Abstract
Choosing an appropriate project delivery system (PDS) directly affects the achievement of performance goals, and at the same time it is of great significance for sustainable construction project management (SCPM). This paper took the PDS of construction engineering as the research object, took the Design-Build (DB) and the Design-Bid-Build (DBB) as examples, and established the indicator system for determinants of the PDS decision. Based on Multi-Agent Systems (MAS), a decision-making simulation model of the PDS decision was constructed, and this paper analyzed the influence of the project attribute characteristics, policy and market environment, owner ability and preference, and contractor technology and capabilities of the PDS decision. While analyzing the circumstances under which the owners tend to choose DB or DBB, the following conclusions were reached: (1) the contractor technology and capabilities increase faster in DB than in DBB. (2) The PDS with policy and market environment preferences has an advantage in the PDS decision, and the owners are more willing to choose the PDS which was selected previously. (3) The competition mechanism in the construction market will eliminate contractors whose growth rate is too low to meet the needs of projects in the market. The research provides theoretical references for the scientific decision-making of construction enterprises.
1. Introduction
With the continuous development of China’s modernization, the proportion of the construction industry in the national economy continues to rise. In 2018, the total output value of China’s construction industry reached 6.18 trillion Yuan, accounting for 6.87% of China’s Gross Domestic Product (GDP). Compared with 1978, it has increased by 3.09 percentage points, and there were more than 90,000 construction enterprises of various types in China [1]. Against this background, the construction industry has a positive impact of economic growth [2,3], and it is important for the sustainability and stability of China’s economy to maintain the development of the construction industry. However, the construction industry faces problems such as a complicated external environment, low project profits and fierce competition, which has attracted people’s attention [4,5]. Moreover, the issue of scientific decision-making in construction project bidding has become the central issue of construction enterprises [6]. In this context, how to achieve the performance goals of engineering projects and the sustainable development of enterprises through scientific decision-making during the bidding process has become an important consideration content for construction enterprises formulating their development strategies.
Sustainable development is development that meets the needs of the present, without compromising the ability of future generations to meet their own needs [7]. Sustainable construction project management (SCPM) requires enterprises to pay attention not only to the project itself, but also to the internal and external environment, so as to maximize the time, quality and economic benefits. PDS is a kind of power and responsibility distribution mode and organization, coordination mode between the owner and the contractor during the construction period [8], and, as one of the critical factors of project success, it affects the project schedule, cost, quality and contract management to a great extent [9]. It has been pointed out that choosing an appropriate project delivery system (PDS) can reduce the cost of infrastructure construction by 5% [10]. In other words, choosing the right PDS directly affects the achievement of performance goals such as the project schedule, cost, and quality, and it is of great significance for the SCPM.
The SCPM is facing many new challenges, including limited time and resources, economic viability issues and reducing carbon emissions [11,12], and it gets the attention of academia [13]. An integrated sustainable performance evaluation method was used to evaluate SCPM, and it indicates that finance, schedule and quality management are the top three important dimensions in SCPM [14]. The fuzzy analytic network process was used to weigh the sub-criteria by considering the interdependence of the main criteria, and the assigned-to-top management and sponsor support, stakeholder expectations and end users-imposed restrictions were known as the key factors for project management on sustainable development [12]. The analytic hierarchy process method and the expert choice computer program were used to find that well-performed management is one of the critical factors which leads to the success of any significant SCPM [15]. SCPM performance evaluation can help to raise the level of management [14]. However, the analyzed studies mainly focus on the research of the project management process and rarely involve the decision-making at the initial stage of the project.
The PDS plays an important role in the rapidly developing construction industry [9,16], and selecting an appropriate PDS can improve the project performance effectively [17,18], as it is considered more in line with the requirements of the SCPM performance. Many methods were used in the study of the decision-making of PDS. After statistically investigating 351 actual engineering cases, Konchar and Sanvido developed a method of multiple linear regression to empirically compare the cost, schedule and quality performance of Design-Bid-Build (DBB), Design-Build (DB) and Construction Management at risk (CM); the results showed that projects administered using DB can achieve significantly improved cost and schedule advantages, and that DB projects produce an equal and sometimes more desirable quality performance than construction management at risk and DBB projects [16]. Luu et al. used a factor analysis and principal component analysis to analyze the main determinants in the selection of the PDS, and clarified the tendency of relevant stakeholders to choose the PDS. They derived an eight-factor solution for PDS selection and found that external environment and project risks were of paramount importance amongst the eight factors identified [19]. Ling et al. compared 11 performance indicators of different projects using DBB and DB in Singapore; the method of multiple linear regression was used, and the results showed that the project delivery speed is faster in the DB, but that the project is more changeable in the DBB, and that it is necessary to establish a procurement system to control project performance [20,21]. A multi-criterion decision-making methodology was used to assist decision-makers in selecting the proper PDS for projects, and the results showed that when the effect of all factor values increased to be the only deciding factor, the DB was the most appropriate option [6]. Kumaraswamy and Dissanayaka selected a sample of different building projects and professionals based in Hong Kong to yield ‘knowledge’, and constructed a knowledge-based decision support system; this system achieved the goal of selecting the appropriate PDS based on different project attributes [22]. Luu et al. developed a fuzzy Case-Based Reasoning (CBR) prototype for the selection of an appropriate PDS and conducted a series of tests with domain experts using real cases and projects; the results confirmed that the cases stored in CBR are correct and consistent, which provided an effective solution for PDS decisions [23]. At the same time, the AHP [17], fuzzy comprehensive evaluation [4,24,25], case-based reasoning [26,27], model decision-making standard methods [28] and other decision-making methods were also used in the research of the decision-making of PDS.
In summary, the existing literatures include innovation and rationality in their research methods and selection of determinants. In the selection of determinants, most of the existing literatures focus on the impact of one determinant or several determinants on the PDS decision. The lack of a comprehensive analysis of PDS decision determinants cannot draw comprehensive research conclusions. The research methods mainly include multivariate statistical analysis, multi-attribute analysis and knowledge-based decision support systems. These methods are biased towards the qualitative and subjective analysis of the impact of determinants on the PDS decision, which cannot describe the decision mechanism and behaviors of PDS systematically. We believe that a comprehensive analysis of the impact of determinants on PDS decision-making requires the establishment of a comprehensive determinants indicator system and the systematic construction of the mechanism and behaviors of the PDS decision.
This article will take the DBB and DB as examples. The DB and DBB are currently the common PDS on an international level [6,9,16]. The DBB emphasizes that project implementation should be carried out in accordance with the “design-tender-build” process. The DB is also known as Turn-Key-Operate in the world; the owner selects a contractor to be responsible for the quality, safety, cost and duration of the entire project, and the contractor needs to have higher technology and capabilities in DB. In the DBB, the contract is concluded separately between the contractor and subcontractor and the supplier, which is different from the DB based on the total price contract when the contract is concluded. Studies have pointed out that DB has a positive impact on schedule arrangements, but it is still uncertain whether DB or DBB have a cost advantage [29].
The aim of the article is to establish a comprehensive determinants indicator system and construct the mechanism and behaviors of the PDS decision, to develop a model (based on the Multi-Agent System) for decision-making, to reveal the rules of PDS decision-making and to make conclusions. It will provide a new perspective for the SCPM through the PDS decision.
2. Methodology
2.1. Construct Indicator System for Determinants of the PDS Decision
The decision-making of PDS is affected by the complex determinants in the whole life cycle of construction project management, and is an important concern for experts and scholars. The research on the determinants of the construction project management decision is mainly from the project attribute characteristics [9,30,31], owner ability and preference [32,33,34], contractor technology and capabilities [26,35,36], project target requirements [37,38], policy and market environment [4,39] and the performance of PDS [40,41]. These researchers have summarized various determinants in the project on the decision-making of the PDS, and these studies focus on studying the influence of single determinants on PDS decision-making. According to the relevant research of experts and scholars, this paper combed the indicator system for determinants of DBB and DB, including project attribute characteristics, owner ability and preference, contractor technology and capabilities, project target requirements, and policy and market environment. According to the principle of operability, integrity and practicality, we invited 20 experts, including owners, builders and consultants, to rate the importance of all determinants based on the Likert scale. The Cochran-Mantel-Haensel Test was used to screen the content of the combed indicators. The Mean Score (MS) represents the average value of the experts in a certain field for the importance assignment of the determinants, and the Overall Mean Score (OMS) represents the average value of all experts for the importance assignment of the determinants. The MS and OMS values of all the determinants are shown in Table 1.

Table 1.
OMS value sorting of the determinants.
According to the rank of the OMS values, we screened the top 15 important indicators to construct the indicator system for the determinants of the PDS decision, and we used a normalization method to calculate the weight of the determinants according to the OMS value of each determinant in Table 1, as shown in Table 2.

Table 2.
Indicator system for the determinants of the PDS decision.
2.2. Set Determinants of PDS Decision
The owner is the core decision-maker in the decision-making of PDS [10]. In addition to considering the preferences themselves, the owners will also consider determinants such as the policy and market environment, project target requirements and project attribute characteristics. These determinants interact with the decision-making process of the owner and constitute the decision-making mechanism of the PDS, as shown in Figure 1.
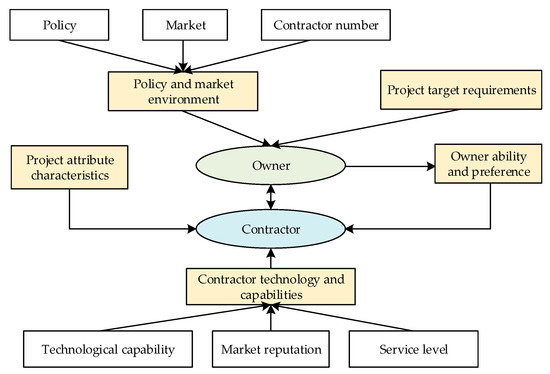
Figure 1.
Decision mechanism of the PDS.
Based on the decision mechanism of the PDS and the determinants of the PDS decision-making, the model of the PDS decision-making was established, as shown in Figure 2. In the model: (1) the owner ability and preference, and the policy and market environment affect the selection tendency of the owner. (2) The owner selection tendency, the contractor technology and capabilities, and the project attribute characteristics affect the decision behavior of the PDS. (3) In the PDS decision-making process, the contractor technology and capabilities need to be identified, so it is necessary to investigate the contractor technology and capabilities to meet the project target requirements. (4) The main influence of the project attribute characteristics on the PDS decision-making is reflected in the project target requirements, but also affects the owner ability and preference.
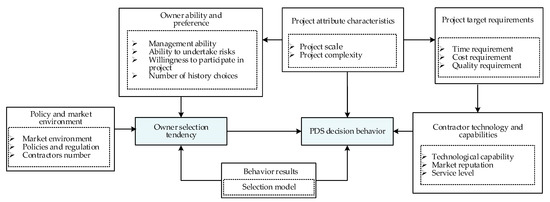
Figure 2.
Model of PDS decision-making.
For the impact of the project attribute characteristics on the PDS decision, we define the project attribute characteristics as At, project scale as a, project complexity as b, and a, b [0.1, 1]; then, the project attribute characteristics At can be expressed as:
where n1, n2 are the weights of the project scale and project complexity, respectively, and the weight is shown in Table 2.
At = n1 × a + n2 × b
The project target requirements are implemented for five indicators, including time, cost, quality requirements, market reputation and service level in terms of contractor technology and capabilities. Thus, we set the project target requirements in the design and construction as m = {m1, m2}; then, the matrix of the project target requirements m can be expressed as:
where m1j [0.1, 1].
For the impact of the policy and market environment on the PDS decision, we define two types of market environments, S1 and S2. The owner’s selection tendencies for S1 and S2 are qs1 and qs2, respectively. The number of history choices for S1 and S2 are Ts1 and Ts2, and the impact coefficients of Ts1 and Ts2 on the owners are m1 and m2, respectively. The propensity of the owner to choose the market environment is expressed as:
We define two types of policy and regulations, Z1 and Z2. The owners’ preference coefficients for Z1 and Z2 are qZ1 and qZ2, respectively. The number of history choices for Z1 and Z2 are Tz1 and Tz2, and the impact coefficients of Tz1 and Tz2 on the owners are n1 and n2, respectively. The propensity of the owner to choose the policy and regulations is expressed as:
We divide the type of contractors into design contractors and build contractors, and the contractors need to have a higher technology and capabilities in DB. According to this reality, we set DB to be selected when the contractor meets the following conditions:
For the impact of the owner ability and preference on the PDS decision, we define the owner ability and preference as Ab, management ability as w, ability to undertake risks as v and willingness to participate in the project as de. C and Z represent the number of history choices in DBB and DB respectively. The frequency of the number of history choices are TC and TZ.
where CSiZj and ZSiZj respectively represent the number of history choices of DBB and DB in the context of the market environment Si and the policy and regulation Zj, and i, j .
The owner ability and preferences in the DBB and DB are expressed as AbC and AbZ, respectively, and their calculation formulas are as follows:
where: q1, q2, q3 respectively represent the weight of management ability, ability to undertake risks and willingness to participate in project, and k represents the weight of the number of history choices, and the weights are shown in Table 2.
2.3. Build a Decision-Making Simulation Model of PDS
The objectives of a decision-making simulation model of PDS is to explore the decision process and behavior of owners and contractors in the process of the PDS decision, the influence of various determinants on the PDS decision and how to realize the whole process of the PDS decision.
This paper built a simulation model based on the following hypotheses:
Hypothesis 1 (H1).
The public bidding information between the owner and the contractor is completely symmetrical, the owner can investigate all the public information of the contractor technology and capabilities, and the contractor can obtain all the information about the project target requirements.
Hypothesis 2 (H2).
The owner can decide the winning contractor, and the contractor will bid for the project according to his own actual ability.
Hypothesis 3 (H3).
The owner determines the winning contractor according to the rank of the contractor’s comprehensive scores on the five indicators. The project attribute characteristics can be regenerated after each simulation, and the specific values can be randomly generated in the simulation according to different situations.
Hypothesis 4 (H4).
The requirements of the owners for different project performance indicators have the lowest threshold, and the contractor can only pass the qualification and enter the bidding evaluation if it exceeds the minimum threshold.
Hypothesis 5 (H5).
Project attribute characteristics regenerate after each simulation cycle, which means a new project. In each new project, the number and attribute values of contractors will change because the contractors chose to learn to upgrade or withdraw from the market in the previous stage.
Based on Multi-Agent Systems (MAS) [42], a decision-making simulation model for PDS was constructed. The simulation model used the DBB and DB as simulation objects, and it was carried out to simulate the behaviors and interactions of each subject by abstracting the subject in the decision-making process of PDS (refer to Figure 2), after which the macro-decision behaviors of the PDS emerged [43]. According to the decision-making mechanism of PDS, this paper abstracted the owner agent and contractor agent, and the contractor agent was divided into the design contractor agent and build contractor agent according to the professional and technical advantages.
According to the simulation model objectives and framework, we set the built-in variables of the owner agent and the contractor agent in the simulation system. The definitions and descriptions of the main built-in variables of the owner agent and contractor agent are shown in Table 3 and Table 4, according the determinations settings of the PDS decision.

Table 3.
Definition and description of the main built-in variables of the owner agent.

Table 4.
Definition and description of the main built-in variables of the contractor agent.
According to the model of PDS decision-making, we sorted out the behavioral strategies of the owner agent and contractor agent in the PDS decision, and designed the implementation methods of different behavioral strategies which would be used to design the simulation process.
(1) The owner agent has the following four behavioral strategies.
Behavior 1: Contractor capacity survey. The owners investigate the contractor technology and capabilities which can undertake engineering design or construction tasks. When the number of contractors who can undertake DB is more than three in the market [44] and those contractors can meet the project target requirements, the basic conditions for selecting DB can be met. Otherwise, the bidding can only be conducted separately, and only the DBB can be selected.
Behavior 2: Mode selection. Pc and Pz are the owner’s choice tendency and preference for DBB and DB, respectively. Pc and Pz are directly affected by the owner ability and preference and the project attribute characteristics. Therefore, the owner’s choice for DBB and DB is expressed respectively as:
where ζ is the weight of the project attribute characteristics, η is the weight of the owner ability and preference, and the weight is shown in Table 2. We define a random number as r, when r is less than Pz and the number of contractors satisfying the bidding requirement is greater than 3; then, the DB is selected, and otherwise the DBB is selected.
Behavior 3: Owner bid evaluation. When evaluating the bid, the performance of the contractor in terms of time, cost, quality, market reputation and service level is evaluated by the owner agent. The bid evaluation function is as follows:
Behavior 4: Winning bidder selection. The bidding contractor or bidding consortium with the highest comprehensive score is selected as the winning bidder.
where x(1), x(2), x(3), x(4) and x(5) represent the values of the contractor i in terms of time, cost, quality, market reputation and service level, respectively. α, β, γ, δ, ε represent the weight indicators of the owner in terms of the time, cost, quality, market reputation and service level respectively, and the weights come from Table 2.
(2) The contractor agent contains mainly six kinds of behaviors
Behavior 1: Determine bid requirements. The choice of the contractor’s bidding behavior is mainly affected by determinants such as construction requirements and their own technical ability level. Based on H2, the Euclidean distance calculation method is introduced. The three contractors with the smallest Euclidean distance are eligible to bid. The bidding decision function is:
Among them, m1, m2, m3, m4, m5 represent the requirements of the project itself in terms of time, cost, quality, market reputation and service level respectively. The three contractors with the minimum di participate in the bid.
Behavior 2: Contractor bidding. The contractor comprehensively considers the requirements of each index of the project and their own technology and capabilities, and selects the most suitable project for bidding.
Behavior 3: Set up a consortium. When bidding in the DB, the contractor forms three consortium enterprises, according to the five hard index values and the Euclidean distance, and selects the cooperative enterprise to form a consortium according to the nature of the lead unit.
Behavior 4: Select bid strategy. The contractor adopts different bidding strategies according to the different PDSs chosen by the owner.
Behavior 5: Contractor learning strategy. The contractor agent has the ability to learn and update attributes. The contractor who wins the bid will learn and update the capability based on the initial capacity in the contracting project, and improve the attribute value of the contractor agent. The learning function is:
where μ represents the growth factor, and the number of growth steps is a random variable that conforms to a normal distribution. φ represents the internal friction factor, and the internal friction step is expressed by the difference value in ability between the two contractors.
Behavior 6: The contractor extinction. If a contractor fails to meet the target requirements of all projects in the simulation, they will die in the market. The condition for extinction is:
2.4. Simulation Process Design
The NetLogo was used in the simulation model. NetLogo is a multi-agent programmable modeling environment. It powers HubNet participatory simulations, and it is authored by Uri Wilensky and developed at the CCL (Center for Connected Learning). NetLogo is suitable for simulating the evolution process over time. It can command multiple agents to observe their behavior interaction, so as to realize research on individual behavior and the macro model at the micro level [45].
The simulation interface is equivalent to the engineering construction market environment, as shown in Figure 3. The simulation interface includes the command area, control area and output area.
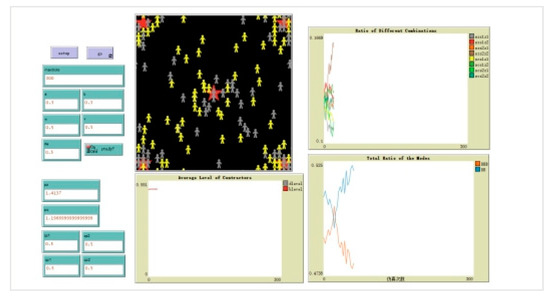
Figure 3.
Virtual interface and elements of NetLogo.
The command area includes two functions: the Setup command or the Reset command is used to create or reset the simulation environment. The Go command runs the simulation model and gets the system output.
In the control area, the change command serves to control whether the owner is affected by the feedback, and the study command serves to determine whether the contractor has a learning behavior and continuously updates the contractor technology and capabilities. The control area forms different scenarios by adjusting the control parameters, and the parameters include pc, pz, ps1, ps2, pz1, pz2. The random number in the decision-making simulation model of PDS is randomly generated by the random control in a given interval (such as d-list, b-list and r). The maximum number of iterations of the simulation is maxticks. The property of the owner agent is updated at every iteration, which means a new engineering project is formed, and the property value of the contractor agent is updated. We will get the running results of the simulation when the number of iterations reaches maxticks.
Three output interfaces are designed in the output area to observe the change of parameters. The curve of the output interfaces shows the change of the owner’s choice in DBB and DB, the change of the contractor technology and capabilities in the market, and the cumulative number of choices in different mode combinations.
Seven modules were designed in the simulation system, including the simulation body creation module, conts-investigation module, mode-choose module, union-establish module, bidding evaluation module, contractor study module and result output module. Each module has different functions, as shown in Table 5.

Table 5.
Model basic variable.
The modules in the simulation system generate behaviors according to the vector sequence of time. The simulation program flow was designed according to the decision mechanism of PDS and the model of PDS decision-making, as shown in Figure 4.
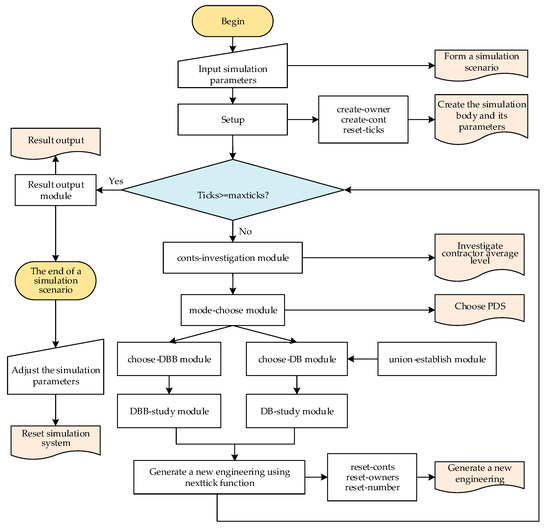
Figure 4.
Simulation program flow chart.
The experimental method: when examining the influences of a project’s attribute characteristics, owner ability and preference, and contractor technology and capabilities on the selection of the PDS, only the parameter values of a certain scenario are adjusted, and the parameters of the other definitions are fixed. This experiment used the main program module in the simulation model to implement the initialization, parameter input, visual output and system operation. The global variables and assignment of the entire agents were set. The total number of owners was 5, the total number of contractors was 150, the maximum number of iterations in the simulation experiment was 900 and the project attributes characteristics were randomly generated after each simulation. To ensure that all experiments maintained the same global variables, the main global variables of different definitions in the simulation system were set as shown in Table 6.

Table 6.
Related major global variables definitions and descriptions.
3. Results
3.1. Impact of Project Attribute Characteristics
The project attribute characteristics influenced the owner’s PDS decision from two aspects: one was to influence the owner to select the DB, and the other was to influence the owner’s preference and probability of selecting the DB. Under the same policy and market environment, owner ability and preference, and contractor technology and capabilities, the parameters of the simulation experiment were set as shown in Table 7. When a and b were taken 0.1–0.9 in turn, and when d-list = 0.502, b-list = 0.496, the running result is shown in Figure 5.

Table 7.
Related parameter settings.
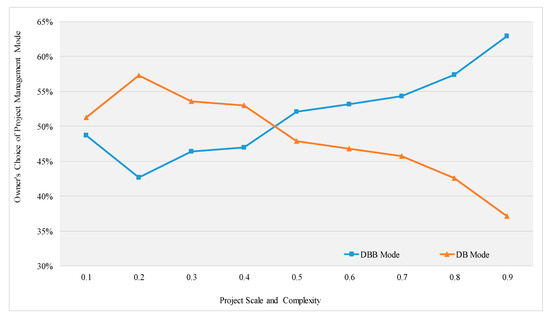
Figure 5.
Effect of the project attributes on the decision-making of PDS.
The following conclusions can be drawn from the analysis:
- (1)
- When the scale and complexity of the project were low (range 0.1–0.4), owners tended to choose DB. With the expansion of the project scale and complexity, the difficulty of the management coordination of the project increased gradually. In order to effectively avoid adverse effects such as costs and construction risks, the owner tended to transfer the construction and management tasks to the contractor with a more extensive experience and high technical level as far as possible, so owners tended to choose DB.
- (2)
- With the further improvement of the project scale and complexity (range 0.5–0.9), the owners tended to choose DBB, and the DBB gradually occupied a dominant position. With the expansion of the project scale and complexity, the implementation of the project management had led to very high requirements regarding the qualifications and capabilities of the contractor, and it was difficult for the contractor in the market to meet the requirements of the standard DB general contractor. The owner can only request a separate invitation to the design or construction individual requirements, thereby selecting the DBB. The owner can only solicit bids individually according to individual requirements of design or construction, and as a result, only DBB can be selected.
3.2. Impact of Policy and Market Environment
Before selecting a PDS, the owner would comprehensively analyze and compare the advantages and disadvantages of different PDSs in different environments, and exert advantages and avoid disadvantages as far as possible. In order to explore the influence of policy and market environment on the decision-making of PDS, the fixed related parameters were set as shown in Table 8.

Table 8.
Related parameter settings.
The decision-making of PDS under different policy situations was simulated, and the owner’s preference for the market environment was set as unchanged (qs1 = qs2 = 0.5). Situation 1: the relevant policy environment preferences were the same, set qz1 = qz2 = 0.5, see Figure 6a. Situation 2: when it biased towards the policy environment Z1, set qz1 = 0.8, qz2 = 0.2, see Figure 6b. Situation 3: when it biased towards the policy environment Z2, set qz1 = 0.2, qz2 = 0.8, see Figure 6c. When d-list = 0.502 and b-list = 0.497, the evolution results of the simulation experiments in the three scenarios are shown in Figure 6.

Figure 6.
Evolution trend under different policies and regulations. (a) qz1 = 0.5, qz2 = 0.5, (b) qz1 = 0.2, qz2 = 0.8, and (c) qz1 = 0.8, qz2 = 0.2.
The decision-making of PDS under different market environment situations was simulated, and the owner’s preference for the policy environment was set as unchanged (qz1 = qz2 = 0.5). Situation 1: the relevant market environment preferences were same, set qs1 = qs2 = 0.5, see Figure 7a. Situation 2: when it biased towards the market environment S1, set qs1 = 0.8, qs2 = 0.2, see Figure 7b. Situation 3: when it biased towards the market environment S2, set qs1 = 0.2, qs2 = 0.8, see Figure 7c. When d-list = 0.504 and b-list = 0.495, the evolution results of the simulation experiments in the three scenarios are shown in Figure 7.

Figure 7.
Evolution trend under different market environments. (a) qs1 = 0.5, qs2 = 0.5, (b) qs1 = 0.8, qs2 = 0.2, and (c) qs1 = 0.2, qs2 = 0.8.
The following conclusions can be drawn from the analysis:
- (1)
- In situations where there are the same preferences for the policy and market environment, there is no obvious bias in the choice tendency of the owners, and the decision of the PDS was random, as shown in Figure 6a and Figure 7a. In the process of long-term evolution, neither the DBB nor the DB occupied a competitive advantage in a specific market environment. Combined with the reality, if the policy and market environment have no obvious preference for PDS, various PDSs will develop in a balanced manner.
- (2)
- In the case of unequal preferences between the policy and market environment, the choice of PDS is basically similar. However, the model of a good policy and market environment occupied an advantage in the decision-making of the PDS with the passage of time, as shown in Figure 6b,c, and Figure 7b,c. It shows that the policy and market environment play a guiding role in the decision-making of the PDS.
3.3. Impact of Owner Ability and Preference
The ability and preference of the owner are mainly reflected in the management ability of the owner, the adaptability to risk, the willingness to participate in the project and the number of history selection modes, which influence the decision-making of PDS comprehensively. In order to explore the influence of the owner ability and preference on the decision-making of PDS, the fixed related parameters were set as shown in Table 9.

Table 9.
Related parameter settings.
The experiment simulated the decision-making of PDS under the situation of different owners’ abilities, and set de = 0.5, Tc = 0.5, Tz = 0.5. When w and v were taken as 0.1–1.0 in turn, and when d-list = 0.499, b-list = 0.490, the running result is shown in Figure 8.
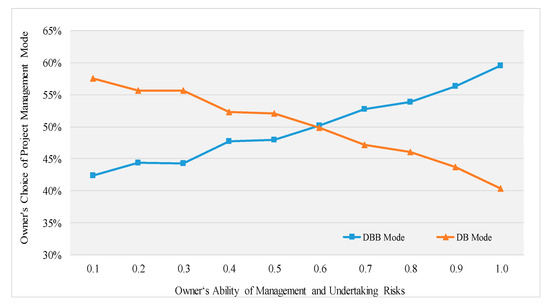
Figure 8.
Influence of owners’ abilities on the choices of PDS.
The experiment simulated the decision-making of PDS under different situations of owners’ willingness to participate, and set w = v = 0.5, Tc = Tz = 20. When de was taken as 0.1–1.0 in turn, and when d-list = 0.496, b-list = 0.485, the running result is shown in Figure 9.
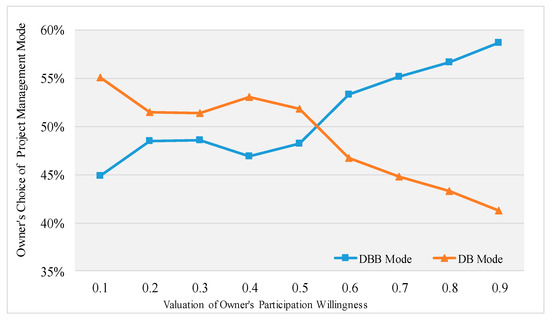
Figure 9.
Influence of owners’ willingness to participate in the selection of PDS.
The experiment simulated the decision-making of PDS under different situations of historical selection times, and set w = v = 0.5, de = 0.5. The simulation experiment set the following situation. Scenario 1: when the number of different history selections was the same, set Tc = 0.5, Tz = 0.5, see Figure 10a. Scenario 2: when the number of different history selections was different, set Tc = 0.3, Tz = 0.7, see Figure 10b. The results are shown in Figure 10.
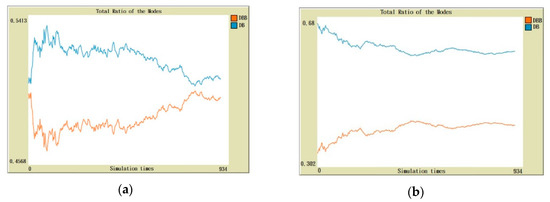
Figure 10.
Evolution trend diagram under different historical selection times. (a) TC = 0.5, TZ = 0.5, and (b) TC = 0.3, TZ = 0.7.
The following conclusions can be drawn from the analysis:
- (1)
- In the situation where the owner’s ability is low (range 0.1–0.6, as shown in Figure 8), the owner tended to choose the DB. This is because the owner only needs to sign a contract with the general contractor in DB, which helps to economize construction costs and reduce the management difficulty. With the continuous improvement of the owner’s ability (range 0.6–1.0, as shown in Figure 8), the owner is more inclined to control the construction process directly. The reason for this is that the owner has enough management ability and ability to cope with risks. The owner can control the progress of the project through the DBB, which effectively economizes construction costs and ensures the quality of the project construction.
- (2)
- When the owner’s willingness to participate in the project is low (range 0.1–0.5, as shown in Figure 9), the owner does not have the willingness to control the project. The DB can reduce the workload of the owner, so the owner is inclined to select the DB. With the increase of the owner’s willingness to participate in the project (range 0.5–1.0, as shown in Figure 9), the owner tends to control the project, so more DBB will be selected, and the owner will strictly control the design scheme and construction process.
- (3)
- In the case of the same historical selection times, there was no significant difference in the probability of each mode being selected, and the difference between the owner’s choice tendency for DB and DBB was only 4%, as shown in Figure 10a. With the increase of historical selection times in one mode, the mode had an absolute competitive advantage in the market, and the owners were increasingly inclined to choose this mode, as shown in Figure 10b. This proved that the owners were largely influenced by previous decision-making experiences when selecting the PDS.
3.4. Impact of Contractor Technology and Capabilities
In project management, the experience and technical level of the contractor continue to improve with the increase of constructing projects. In the experiment, we kept the owner ability and external environment unchanged, and kept the project attribute characteristics and external environment unchanged. We tried to explore the influence of the contractor technology and capabilities on the decision-making of the PDS.
3.4.1. Influence of Contractor Level on Decision-Making of PDS
In the experiment, we fixed the other parameters as being unchanged. Scenario 1: the contractor’s ability does not change, take study? = False. Scenario 2: the contractor’s ability grows within a certain period, take study? = True; we fixed the other parameters as shown in Table 10.

Table 10.
Related parameter settings.
When the owner’s ability and the external environment were kept the same (w = v = 0.5), the influences of a and b were taken from 0.1 to 1.0 in turn, and the comparison results of situation 1 (see Figure 11a) and situation 2 (see Figure 11b) are shown in Figure 11.
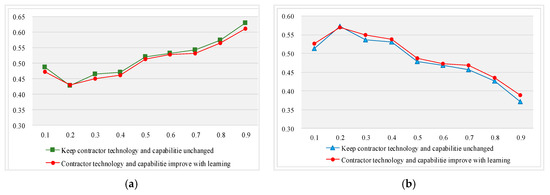
Figure 11.
Evolution trend diagram of different contractors in the horizontal situation. (a) DBB, and (b) DB.
When the project attribute characteristics and the external environment were kept unchanged (a = b = 0.5), and w and v were taken from 0.1 to 1.0 in turn, the comparison results of situation 1 (see Figure 12a) and situation 2 (see Figure 12b) are shown in Figure 12.
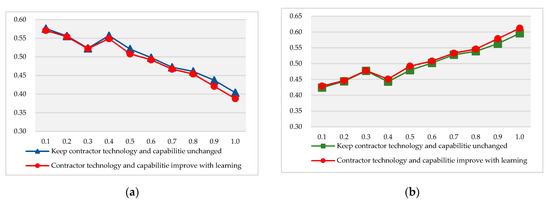
Figure 12.
Evolution trend diagram of different contractors in the horizontal situation. (a) DBB, and (b) DB.
The following conclusions can be drawn from the analysis: when the contractor can continuously improve the technology and capabilities by learning, owners prefer to choose DB. To investigate the reasons for this, with the contractor mastering the construction technology continuously in the process of construction engineering, the risk and cost of the construction project will continue to be reduced. Therefore, the owners prefer to select DB and hand over the whole process of the design and build to the contractor. Therefore, if the government wants to implement the DB or other emerging advantages PDS, it can start by guiding the technology and capability of the contractor in the market, and construct an orderly market environment suitable for the development of a specific model at the same time.
3.4.2. Influence of Decision-Making of PDS on Contractor Level
In the experiment, we fixed the other parameters as being unchanged. Scenario 1: DBB was dominant, set pc = 80%, pz = 20%. Situation 2: DB was dominant, set pc = 20%, pz = 80%. The experiment controlled the market advantage of the DB and DBB, and the other fixed parameters and results are shown in Table 11 and Figure 13.

Table 11.
Related parameter settings.
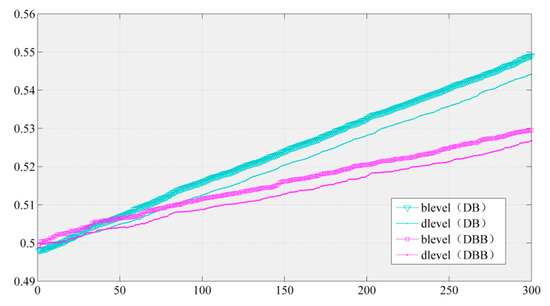
Figure 13.
Trend chart of the contractor level evolution when different modes are dominant.
The following conclusions can be drawn from the analysis:
- (1)
- Regardless of which mode dominates in the market, the contractor’s average technical level of design and build will be improved. At the same time, the market competition mechanism can eliminate contractors whose growth rate is too low to meet the needs of the project in the market.
- (2)
- When the DB dominates in the market, the rate of contractor learning is significantly higher than that of DBB. This is because when DB is chosen, the contractor’s design and build technology spirals upward. At the same time, the DB reduces the cost of management and coordination in design and build, and it can give more full play to the investment income of the engineering supply chain than DBB.
4. Discussion
In this paper, we established an indicator system for determinants of the PDS decision (as shown in Table 2), built a decision-making simulation model of PDS based on MAS, and explored the impact of different determinants on the PDS decision. Based on a comparison of the existing literature, our discussion is as follows.
The existing literature’s focus is on studying the influence of single determinants on PDS decision-making. In view of this situation, we sorted out a large amount of literature and constructed the determinants of the PDS decision in complex environments. Compared with the previous study [9], an analysis of the owner ability and preference was added. The influence of the owner’s ability and preference on the PDS decision was proposed; it should improve the scientific nature of the PDS decision. In the conclusion of this paper, when the owner’s management ability and ability to undertake risks are high and the willingness to participate in the project is high, the owner tends to choose DBB. Otherwise, the owner tends to choose DB. This is consistent with the conclusion in a previous study that when the controlling owner’s characteristic is 100%, the proportion of selecting DBB is as high as 38.2% [6], which may provide a reference for contractors to bid. When the project scale and complexity is low, the owners tend to choose the DB. Otherwise, the owner tends to choose the DBB. This is inconsistent with the conclusion that the probability of choosing the DBB mode and the DB mode are 22.1% and 25.6%, respectively, when the project characteristics are set to 100% [6]. It may be that the project characteristics in the existing literature include not only the scale and complexity of the project, but also factors such as reduction of time and cost [6], which is a problem that is worth further solving in future research.
This article has shown that in different environments, owners tend to choose DB and DBB according to the project time, cost and quality requirements, which meets the requirements of SCPM [7]. SCPM requires enterprises to pay attention not only to the project itself, but also to the internal and external environment. The policy environment has a guiding role in the PDS decision. At the same time, the lack of government support is also one of barriers for SCPM [46], so governments should to formulate policies to support PDS which meet SCPM requirements. The owner’s choice tendency is affected by historical choice. Therefore, the government should encourage the owners to adopt the PDS which is applicable for SCPM. This paper has shown that the DB has the following advantages over the DBB: the technology and capability of contractors increases faster in DB than in DBB (Figure 13). It can be inferred that in the same environment, the DB is more competitive, which is consistent with the conclusion that “if all factors are considered, DB is the most suitable PDS” [6]. Here, we cautiously believe that the DB may be more in line with the requirements of SCPM, which is consistent with the conclusions that “Using a long-term view, sustainability performance will have greater contribution to business competitiveness in the future” [47].
Of course, there are still some other research deficiencies in this paper; for example: (1) the simulation experiment was limited to a single bidding section, and the PDS decision simulation for multi-bidding section engineering needed to be studied. (2) The study only used the DB and the DBB as examples, and did not yet explain the other PDSs, such as the CM, Engineering Procurement Construction Management (EPC) and Engineering Procurement Construction Management (EPCM). This will be our research direction in the future.
An appropriate PDS decision directly affects the achievement of performance goals such as project schedule, cost and quality. This paper established a PDS decision simulation model based on MAS, which is different from the method based solely on experience and knowledge accumulation. The conclusions reached are portable and objective. They have a reference value for owners and contractors in choosing the appropriate PDS, and help promote the SCPM.
5. Conclusions
Choosing a right PDS directly affects the achievement of performance goals such as the project schedule, cost and quality, and it is of great significance for the SCPM. This paper took the PDS of construction engineering as its research object, and took the DBB and DB as examples. The determinants of PDS selection were established by combing the existing literature. Based on MAS, a PDS decision simulation model was constructed, and the following conclusions were reached:
- (1)
- Owners tend to choose the DB under the following circumstances: (1) the project scale and project complexity are low. (2) The owner’s management ability and ability to undertake risks are low. (3) The owner’s willingness to participate in the project is low. (4) The contractor’s technology and ability can grow continuously.
- (2)
- Owners tend to choose the DBB under the following circumstances: (1) the project scale and project complexity are high. (2) The owner’s management ability and ability to undertake risks are high. (3) The owner’s willingness to participate in the project is high.
- (3)
- When the technology and capability level of the contractor increase faster in the DB, the DB has an advantage over the DBB.
- (4)
- The policy and market environment have a guiding role in PDS decision-making. A PDS with policy and market environment preferences has an advantage in the decision of the owner. The owners are affected by historical experience when choosing a PDS, and owners are more willing to choose a previously selected PDS.
- (5)
- The competition mechanism in the construction market will eliminate contractors whose growth rates are too low to meet the needs of projects in the market.
This article explored the impact of different factors on the PDS decision and provided new ideas for SCPM. According to the research conclusions, it can provide the following suggestions for SCPM:
- (1)
- The policy and market environment have a guiding role in the development of PDS, and they also play a guiding role in SCPM. Therefore, the government can create a favorable macro environment for SCPM by formulating policies which are conducive to the promotion of sustainable development PDSs which are applicable for SCPM.
- (2)
- The owner’s choice tendency is affected by historical choice. Therefore, the government should encourage owners to adopt a PDS which is applicable for SCPM, such as DB, in order to cultivate the preferences of owners and to improve owners’ recognition of sustainable development.
- (3)
- Based on the conclusion that the DB is more in line with the requirements of SCPM, it is recommended that the government encourage construction enterprises to adopt the DB, which is conducive to the improvement of the contractor’s technical level, thereby nurturing a leader in the field of engineering construction and supporting Chinese construction enterprises in going global.
Author Contributions
All authors contributed to the paper. Conceptualization, methodology, and writing-original draft preparation, J.-W.Z. and L.-N.Z.; review and editing, L.L. and W.A.; Furthermore, J.-W.Z. acted as a corresponding author. All authors have read and agree to the published version of the manuscript.
Funding
This study has been partly supported by the National Natural Science Foundation of China (No. 71774132), and Shaanxi Water Conservancy Science and Technology Project (No. 2018SLKJ-19).
Conflicts of Interest
Authors declare no conflict of interest.
References
- National Bureau of Statistics of China. China Statistical Yearbook—2018; China Statistics: Beijing, China, 2018.
- Égert, B.; Kozluk, T.; Sutherland, D. Infrastructure and Growth: Empirical Evidence; OECD Publishing: Paris, France, 2009. [Google Scholar] [CrossRef]
- Plebankiewicz, E.; Juszczyk, M.; Kozik, R. Trends, Costs, and Benefits of Green Certification of Office Buildings: A Polish Perspective. Sustainability 2019, 11, 2359. [Google Scholar] [CrossRef]
- Mostafavi, A.; Karamouz, M. Selecting Appropriate Project Delivery System: Fuzzy Approach with Risk Analysis. J. Constr. Eng. Manag. 2010, 136, 923–930. [Google Scholar] [CrossRef]
- Ma, L.; Wang, L.; Wu, K.-J.; Tseng, M.-L. Assessing co-benefit barriers among stakeholders in Chinese construction industry. Resour. Conserv. Recycl. 2018, 137, 101–112. [Google Scholar] [CrossRef]
- Mahdi, I.M.; Alreshaid, K. Decision support system for selecting the proper project delivery method using analytical hierarchy process (AHP). Int. J. Proj. Manag. 2005, 23, 564–572. [Google Scholar] [CrossRef]
- Strange, T.; Bayley, A. Sustainable Development: Linking Economy, Society, Environment; OECD Publishing: Paris, France, 2008. [Google Scholar] [CrossRef]
- Joslin, R.; Müller, R. Relationships between a project management methodology and project success in different project governance contexts. Int. J. Proj. Manag. 2015, 33, 1377–1392. [Google Scholar] [CrossRef]
- Chen, Y.Q.; Liu, J.Y.; Li, B.; Lin, B. Project delivery system selection of construction projects in China. Expert Syst. Appl. 2011, 38, 5456–5462. [Google Scholar] [CrossRef]
- Xue-tong, W.; Bi-lin, X.; Wen-qin, L. Review of Project Delivery Methods. J. Eng. Manag. 2013, 4, 67–71. [Google Scholar]
- Zhong, Y.; Wu, P. Economic sustainability, environmental sustainability and constructability indicators related to concrete-and steel-projects. J. Clean. Prod. 2015, 108, 748–756. [Google Scholar] [CrossRef]
- Kiani Mavi, R.; Standing, C. Critical success factors of sustainable project management in construction: A fuzzy DEMATEL-ANP approach. J. Clean. Prod. 2018, 194, 751–765. [Google Scholar] [CrossRef]
- Tsai, C.Y.; Chang, A.S. Framework for developing construction sustainability items: The example of highway design. J. Clean. Prod. 2012, 20, 127–136. [Google Scholar] [CrossRef]
- Dong, N.; Fu, Y.; Xiong, F.; Li, L.; Ao, Y.; Martek, I. Sustainable Construction Project Management (SCPM) Evaluation—A Case Study of the Guangzhou Metro Line-7, PR China. Sustainability 2019, 11, 5731. [Google Scholar] [CrossRef]
- Erdogan, A.S.; Šaparauskas, J.; Turskis, Z. A Multi-Criteria Decision-Making Model to Choose the Best Option for Sustainable Construction Management. Sustainability 2019, 11, 2239. [Google Scholar] [CrossRef]
- Konchar, M.; Sanvido, V. Comparison of U.S. Project Delivery Systems. J. Constr. Eng. Manag. 1998, 124. [Google Scholar] [CrossRef]
- Oyetunji Adetokunbo, A.; Anderson Stuart, D. Relative Effectiveness of Project Delivery and Contract Strategies. J. Constr. Eng. Manag. 2006, 132, 3–13. [Google Scholar] [CrossRef]
- Hong, H.K. The effect of knowledge on system integration project performance. Ind. Manag. Data Syst. 2008, 108, 385–404. [Google Scholar] [CrossRef]
- Luu, C.; Ng, S.; Chen, S. Parameters governing the selection of procurement system An empirical survey. Eng. Constr. Archit. Manag. 2003, 10, 209–218. [Google Scholar] [CrossRef]
- Ling, F.Y.Y.; Chan, S.L.; Chong, E.; Ee, L.P. Predicting performance of design-build and design-bid-build projects. J. Constr. Eng. Manag. 2004, 130, 75–83. [Google Scholar] [CrossRef]
- Ling, F.Y.Y.; Kerh, S.H. Comparing the Performance of Design-Build and Design-Bid-Build Building Projects in Singapore. Archit. Sci. Rev. 2004, 47, 163–175. [Google Scholar] [CrossRef]
- Kumaraswamy, M.M.; Dissanayaka, S.M. Developing a decision support system for building project procurement. Build. Environ. 2001, 36, 337–349. [Google Scholar] [CrossRef]
- Luu, C.; Ng, S.; Chen, S.; Jefferies, M. A strategy for evaluating a fuzzy case-based construction procurement selection system. Adv. Eng. Softw. 2006, 37, 159–171. [Google Scholar] [CrossRef]
- Chan, C.T.W. Fuzzy procurement selection model for construction projects. Constr. Manag. Econ. 2007, 25, 611–618. [Google Scholar] [CrossRef]
- Wang, X.T.; Wang, Y.W. Lump-sum Contracting PDMs Decision Making:A Model Based on UMA Theory. China Soft Sci. 2010, 19, 153–160. [Google Scholar]
- Moon, H.; Cho, K.; Hong, T.; Hyun, C. Selection Model for Delivery Methods for Multifamily-Housing Construction Projects. J. Manag. Eng. 2011, 27, 106–115. [Google Scholar] [CrossRef]
- Shrestha, P.; O’Connor, J.; Gibson, G. Performance Comparison of Large Design-Build and Design-Bid-Build Highway Projects. J. Constr. Eng. Manag. 2012, 138, 1–13. [Google Scholar] [CrossRef]
- Luu, C.; Ng, S.; Chen, S. Formulating Procurement Selection Criteria through Case-Based Reasoning Approach. J. Comput. Civ. Eng. 2005, 19. [Google Scholar] [CrossRef]
- Park, J.; Kwak, Y.H. Design-Bid-Build (DBB) vs. Design-Build (DB) in the U.S. public transportation projects: The choice and consequences. Int. J. Proj. Manag. 2017, 35, 280–295. [Google Scholar] [CrossRef]
- Love, P.E.D.; Edwards, D.J.; Irani, Z.; Sharif, A. Participatory Action Research Approach to Public Sector Procurement Selection. J. Constr. Eng. Manag. 2012, 138, 311–322. [Google Scholar] [CrossRef]
- Luu, D.T.; Thomas Ng, S.; Chen, S.E. A case-based procurement advisory system for construction. Adv. Eng. Softw. 2003, 34, 429–438. [Google Scholar] [CrossRef]
- Ng, S.T.; Cheung, S.O. Virtual Project Delivery System Adviser. J. Prof. Issues Eng. Educ. Pract. 2007, 133, 275–284. [Google Scholar] [CrossRef]
- El Asmar, M.; Hanna Awad, S.; Loh, W.-Y. Quantifying Performance for the Integrated Project Delivery System as Compared to Established Delivery Systems. J. Constr. Eng. Manag. 2013, 139, 04013012. [Google Scholar] [CrossRef]
- Mafakheri, F.; Dai, L.; Slezak, D.; Nasiri, F. Project Delivery System Selection under Uncertainty: Multicriteria Multilevel Decision Aid Model. J. Manag. Eng. 2007, 23, 200–206. [Google Scholar] [CrossRef]
- Xia, B.; Chan Albert, P.C.; Yeung John, F.Y. Developing a Fuzzy Multicriteria Decision-Making Model for Selecting Design-Build Operational Variations. J. Constr. Eng. Manag. 2011, 137, 1176–1184. [Google Scholar] [CrossRef]
- Smith, J.; Zheng, B.; Edwards, D. Procurement of construction facilities in Guandong, China: Factors influencing the choice of procurement method. Facilities 2004, 22, 141–148. [Google Scholar] [CrossRef]
- Rojas, E.; Kell, I. Comparative Analysis of Project Delivery Systems Cost Performance in Pacific Northwest Public Schools. J. Constr. Eng. Manag. 2008, 134. [Google Scholar] [CrossRef]
- Cheung, S.; Lam, P.; Wan, Y.-W.; Lam, K.-C. Improving Objectivity in Procurement Selection. J. Manag. Eng. 2001, 17. [Google Scholar] [CrossRef]
- Huimin, L.; Zhuofu, W. Spectrum analysis and design model for construction project delivery system. Sci. Technol. Prog. Policy 2009, 21, 91–94. [Google Scholar]
- Hong, K.; Chang, L. Research on importance ranking of influencing factors on selecting project delivery system. J. Civ. Eng. Manag. 2014, 3, 64–68. [Google Scholar]
- Alhazmi, T.; McCaffer, R. Project Procurement System Selection Model. J. Constr. Eng. Manag. 2000, 126. [Google Scholar] [CrossRef]
- Jennings, N.; Sycara, K.; Wooldridge, M. A Roadmap of Agent Research and Development. Auton. Agents Multi-Agent Syst. 1998, 1, 7–38. [Google Scholar] [CrossRef]
- Chan, E.H.W.; Yu, A.T.W. Contract strategy for design management in the design and build system. Int. J. Proj. Manag. 2005, 23, 630–639. [Google Scholar] [CrossRef]
- The National People’s Congress of the people’s Republic of China. Law of the people’s Republic of China on Tenders and Bids; Npc: Beijing, China, 2017.
- Tisue, S.; Wilensky, U. NetLogo: A simple environment for modeling complexity. In Proceedings of the International Conference on Complex Systems, Boston, MA, USA, 16–21 May 2004; pp. 16–21. [Google Scholar]
- Hwang, B.-G.; Zhu, L.; Tan, J.S.H. Green business park project management: Barriers and solutions for sustainable development. J. Clean. Prod. 2017, 153, 209–219. [Google Scholar] [CrossRef]
- Tan, Y.; Shen, L.; Yao, H. Sustainable construction practice and contractors’ competitiveness: A preliminary study. Habitat Int. 2011, 35, 225–230. [Google Scholar] [CrossRef]
© 2020 by the authors. Licensee MDPI, Basel, Switzerland. This article is an open access article distributed under the terms and conditions of the Creative Commons Attribution (CC BY) license (http://creativecommons.org/licenses/by/4.0/).