Measuring the Scale and Scope of Social Anxiety among Students in Pakistani Higher Education Institutions: An Alternative Social Anxiety Scale


Abstract
1. Introduction
2. Method and Methodology
3. The Study and its Results
3.1. Phase I—Item Generation for Social Anxiety Scale (SAS)
3.2. Phase II—Factor Structure, Construct Validity and Internal Consistency of the Scale Sample
3.2.1. Procedure
3.2.2. Results
3.3. Phase III—Confirmatory Analysis Sample
3.3.1. Instrument
3.3.2. Procedure
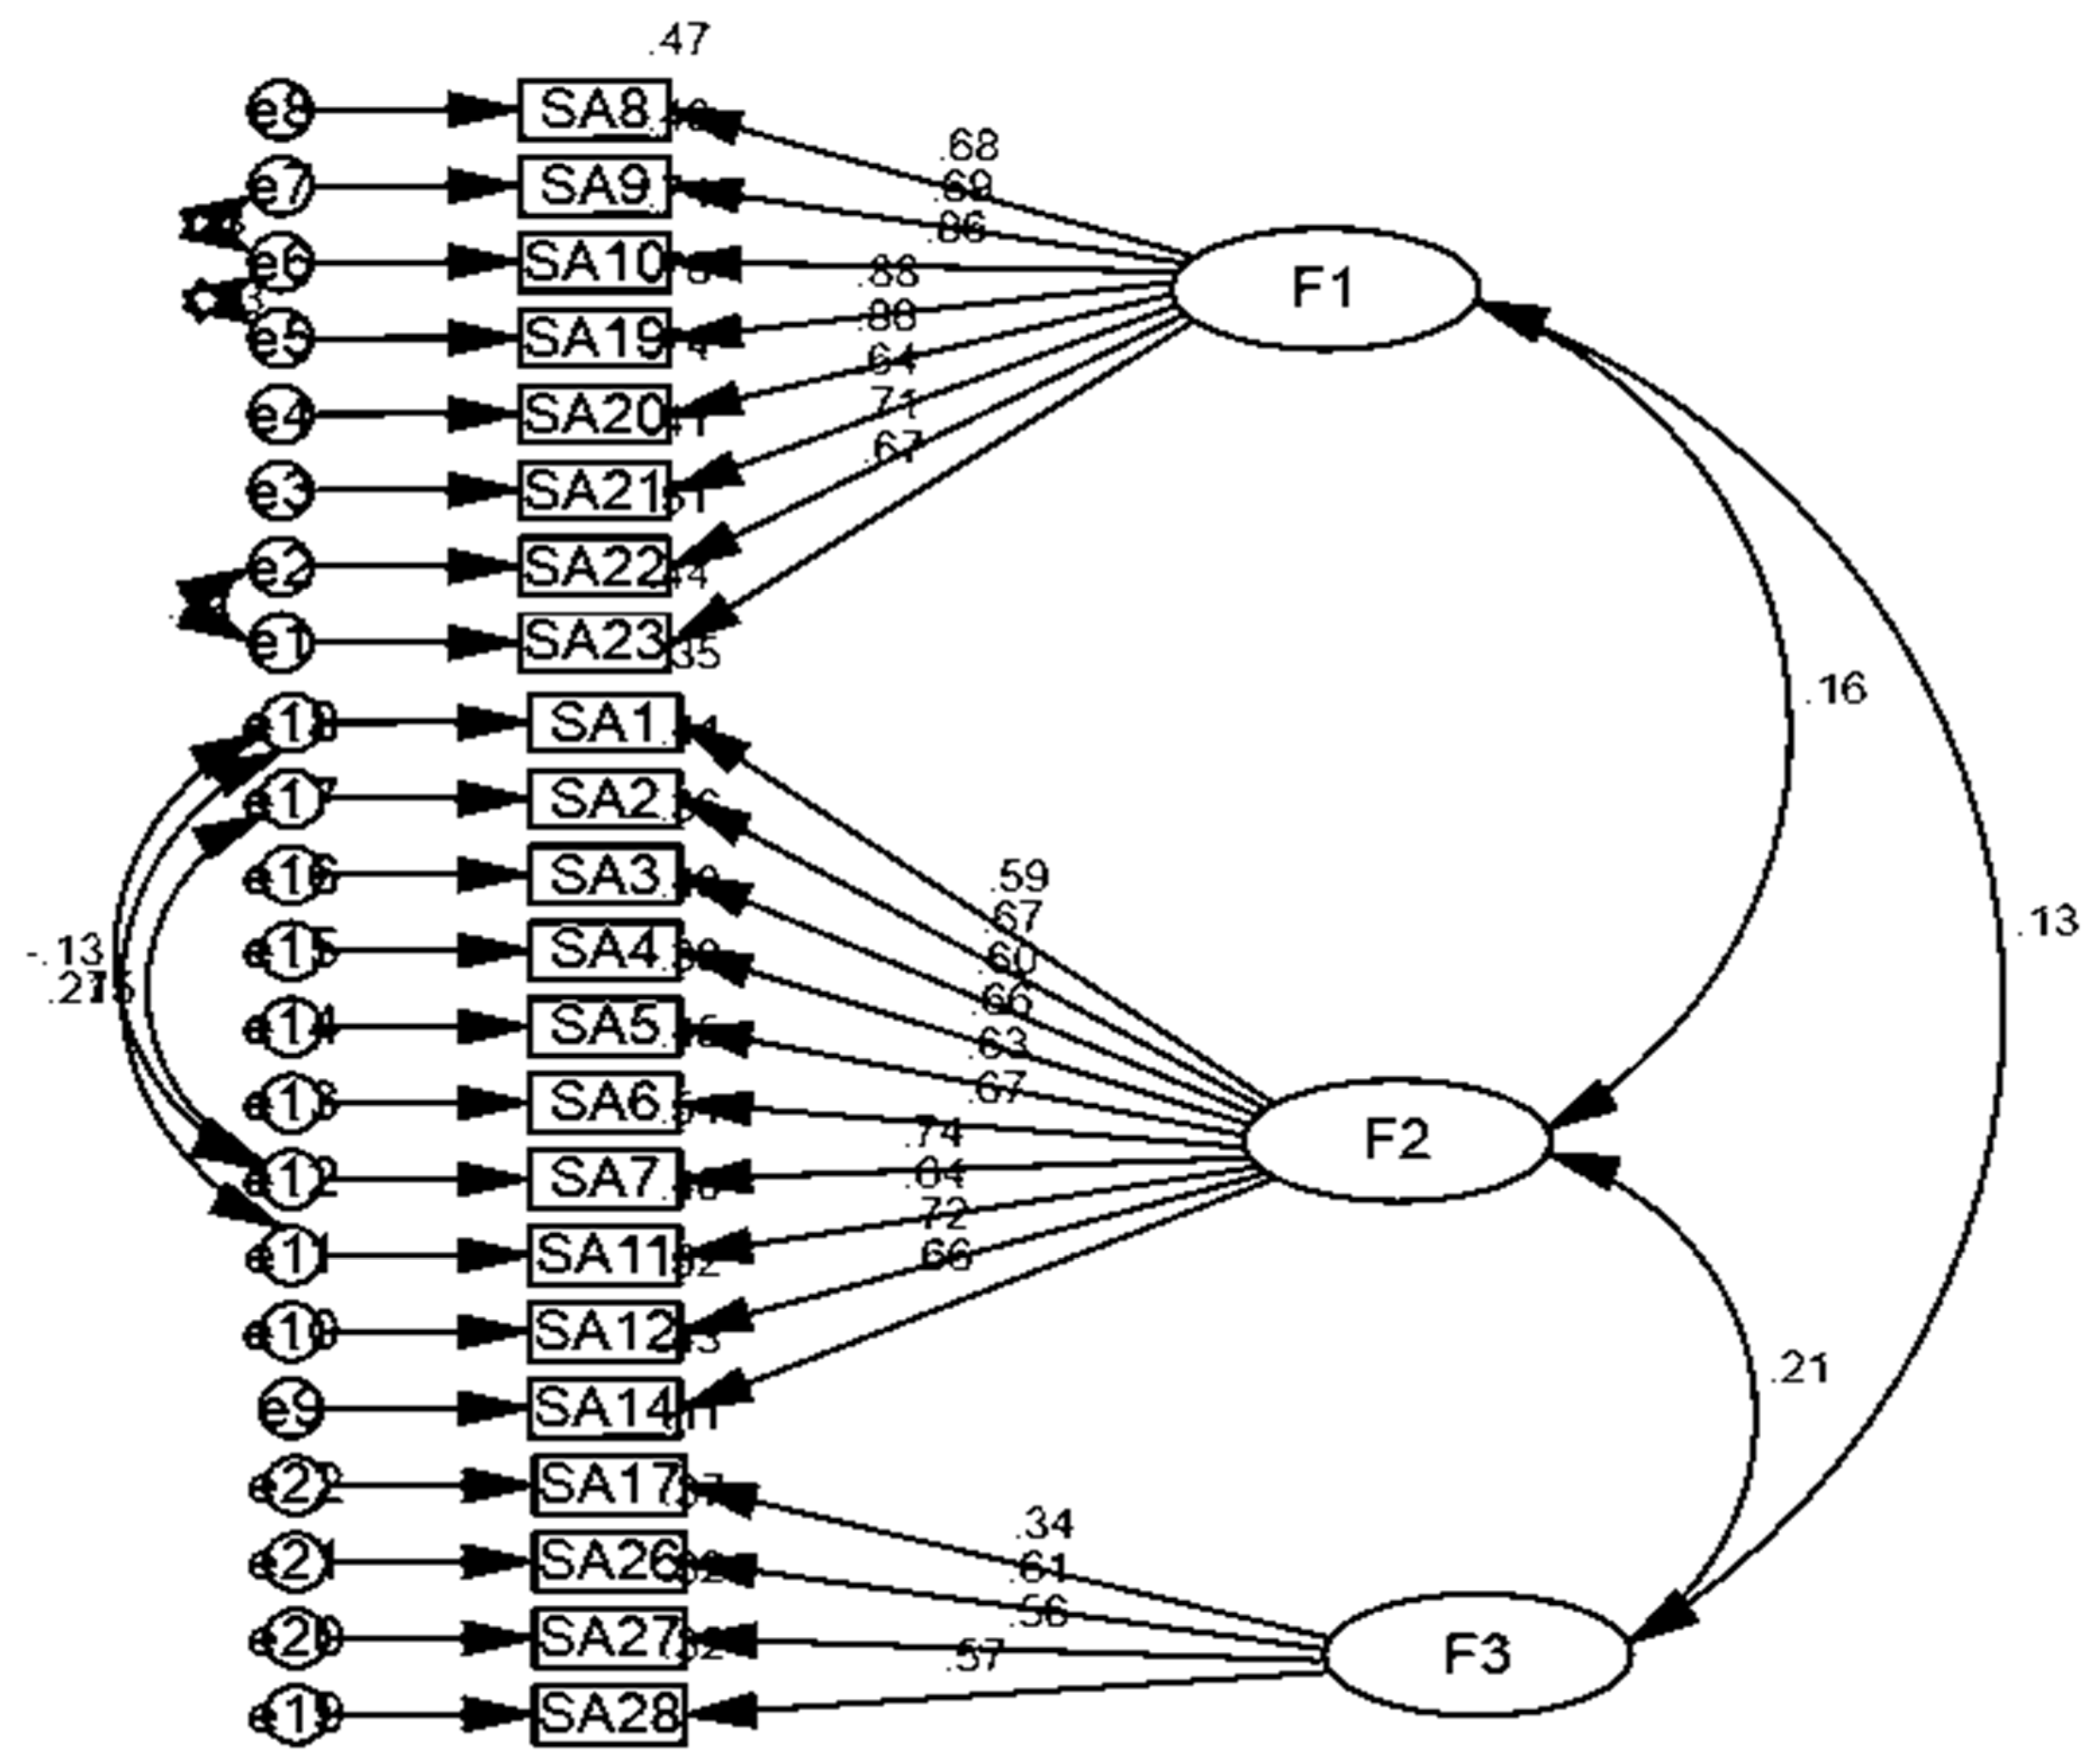
3.3.3. Results
3.4. Phase IV—Convergent and Discriminant Validity of the Social Anxiety Scale
3.4.1. Sample
3.4.2. Material
Social Anxiety Scale (SAS)
Liebowitz Social Anxiety Scale (LSAS)
Extraversion subscale of the Big Five Inventory (BFI)
3.4.3. Procedure
3.4.4. Results
3.5. Phase V—Gender Differences in Social Anxiety and its Dimensions
Results
4. Discussion
5. Limitations
6. Conclusions
Author Contributions
Funding
Conflicts of Interest
Appendix A
| Statements | Always | Often | Sometime | Very less | Never | |||
| 1- | I feel afraid while talking to strangers. | |||||||
| 2- | I feel afraid while travelling with strangers. | |||||||
| 3- | I feel reluctant to talk to a stranger on phone. | |||||||
| 4- | I feel reluctant to ask a stranger for help. | |||||||
| 5- | I feel reluctant while bargaining with the shopkeeper. | |||||||
| 6- | I feel afraid to talk to a person of the opposite gender. | |||||||
| 7- | I feel uneasy when someone stares at me. | |||||||
| 8- | I feel uneasy going to a party or function. | |||||||
| 9- | I feel uneasy talking to influential persons. | |||||||
| 10- | I feel reluctant to talk to people while making eye contact. | |||||||
| 11- | I feel hesitant to make new friends. | |||||||
| 12- | I feel upset when unexpected guests come over. | |||||||
| 13- | I feel uneasy sitting with people. | |||||||
| 14- | I am scared of being judged by people at religious gatherings (Quranic / Milad / Majlis). | |||||||
| 15- | I feel uneasy talking in a crowd. | |||||||
| 16- | I feel reluctant to express my feelings in the presence of people. | |||||||
| 17- | I feel reluctant to address a gathering of people. | |||||||
| 18- | I feel uneasy performing any task in front of people. | |||||||
| 19- | I feel afraid of giving a job interview | |||||||
| 20- | I feel uneasy being the center of attention. | |||||||
| 21- | I fear rejection from people. | |||||||
| 22- | I fear being disliked by people. | |||||||
References
- Davidson, J.R.T.; Hughes, P.L.; George, K. The epidemiology of social phobia: Findings from the Duke Epidemiological Catchment Area Study. Psychol. Med. 1993, 23, 709–718. [Google Scholar] [CrossRef] [PubMed]
- Judd, L.L. Social phobia: A clinical overview. J. Clin. Psychiatry 1994, 55, 5–9. [Google Scholar] [PubMed]
- Stein, M.B.; McQuard, Jr.; Laffge, C. Social phobia in the primary care medical setting. J. Fam. Pract. 1999, 48, 514–519. [Google Scholar]
- Schneier, F.R.; Johnson, J.; Hornig, C.D.; Liebowitz, M.R.; Weissman, M.M. Social phobia: Comorbidity and morbidity in an epidemiological sample. Arch. Gen. Psychiatry 1992, 49, 282–288. [Google Scholar] [CrossRef]
- Kessler, R.C. Lifetime prevalence and age-of-onset distributions of DSM-IV disorders in the national comorbidity sunay replication. Arch. Gen. Psychiatry 2005, 62, 593–602. [Google Scholar] [CrossRef]
- Bruce, T.J.; Saeed, S.A. Social anxiety disorder: A common, under-recognized mental disorder. Am. Fam. Phy. 1999, 60, 2311–2322. [Google Scholar]
- Furmark, T. Social phobia: Overview of community surveys. Acta Psychiatrscand 2002, 105, 84–93. [Google Scholar] [CrossRef]
- Schneier, F.R. Social anxiety disorder. N Engl. J. Med. 2006, 355, 29–36. [Google Scholar] [CrossRef]
- Izgic, E.; Akyuz, G.; Dogan, O.; Kugu, N. Social phobia among university students and its relation to self-esteem and body image. Can. J. Psychiatry 2004, 49, 630–634. [Google Scholar] [CrossRef]
- Acarturk, C.; De Graaf, R.; Van Straten, A.; Cuijpers, P. Social phobia and number of social fears, and their association with comorbidity, health-related quality of life and help seeking. Soc. Psychiatry Psychiatr. Epidemiol. 2008, 43, 273. [Google Scholar] [CrossRef]
- Ahmad, Z.R.; Bano, N.; Ahmad, R.; Khanam, S.J. Social Anxiety in Adolescents: Does Self-esteem Matter? Asian J. Soc. Sci. Hum. 2013, 2, 91–98. [Google Scholar]
- Yidebeck, S.L. Psychiatric-Mental Health Nursing, 5th ed.; Wolters Klumer: Alphen aan den Rijn, The Netherlands, 2011; pp. 240–241. [Google Scholar]
- Watson, D.; Friend, R. Measurement of social-evaluative anxiety. J. Consult. Clin. Psychol. 1969, 33, 448–457. [Google Scholar] [CrossRef]
- Mattick, R.; Clarke, J. Development and validation of measures of social phobia scrutiny fear and social interaction anxiety. 1989; Unpublished manuscript. [Google Scholar]
- Leary, M. Social anxiousness: The construct and its measurement. J. Personal. Assess. 1983, 47, 66–75. [Google Scholar] [CrossRef]
- Liebowitz, M. Social phobia. Mod. Problpharmacopsychiatry 1987, 22, 141–173. [Google Scholar]
- Khalid, K.; Afzal, H.; Moqaddas, F.; Iltaf, N.; Sheri, A.M.; Nawaz, R. Extension of Semantic Based Urdu Linguistic Resources Using Natural Language Processing. In Proceedings of the IEEE 15th International Conference on Dependable, Autonomic and Secure Computing, 15th International Conference on Pervasive Intelligence and Computing, 3rd International Conference on Big Data Intelligence and Computing and Cyber Science and Technology Congress(DASC/PiCom/DataCom/CyberSciTech), Orlando, FL, USA, 6–10 November 2017; pp. 1322–1325. [Google Scholar]
- Thompson, P.; Nawaz, R.; McNaught, J.; Ananiadou, S. Enriching news events with meta-knowledge information. Lang. Resour. Eval. 2017, 51, 409–438. [Google Scholar] [CrossRef]
- Ali, S.; Mehmood, F.; Dancey, D.; Ayaz, Y.; Khan, M.J.; Naseer, N.; Amadeu, R.D.C.; Sadia, H.; Nawaz, R. An Adaptive Multi-Robot Therapy for Improving Joint Attention and Imitation of ASD Children. IEEE Access 2019, 7, 81808–81825. [Google Scholar] [CrossRef]
- John, O.P.; Srivastava, S. The Big-Five trait taxonomy: History, measurement and theoretical perspectives. In Handbook of Personality: Theory and Research, 2nd ed.; Pervin, L.A., John, O.P., Eds.; The Guilford Press: New York, NY, USA, 1999; pp. 102–113. [Google Scholar]
- Lynn, M.R. Determination and quantification of content validity. Appl. Nurs. Res. 1986, 355, 382–385. [Google Scholar] [CrossRef]
- Gregory, R.L. Eye and Brain: The Psychology of Seeing; Princeton University Press: Princeton, NJ, USA, 2015. [Google Scholar]
- Kaiser, H.F. The Application of Electronic Computers to Factor Analysis. Educ. Psychol. Meas. 1960, 20, 141–151. [Google Scholar] [CrossRef]
- Cattell, R.B. The screen test for the number of factors. Multivarbeh Res. 1996, 1, 245–276. [Google Scholar] [CrossRef] [PubMed]
- Kline, R. Principles and Practice of Structural Equation Modeling, 3rd ed.; The Guilford Press: New York, NY, USA, 2011. [Google Scholar]
- Hu, L.; Bentler, P.M. Cutoff criteria for fit indices in covariance structure analysis: Conventional criteria versus new alternatives. Struct. Equ. Modeling 1999, 6, 1–55. [Google Scholar] [CrossRef]
- Brown, M.W.; Cudeck, R. Alternative ways of assessing model fit. In Testing Structural Equation Models; Bollen, K.A., Long, J.S., Eds.; SAGE: Newbury Park, CA, USA, 1993; pp. 136–162. [Google Scholar]
- Hatcher, L. A Step-by-Step Approach to Using the SAS System for Factor Analysis and Structural Equation Modeling; SAS Institute, Inc.: Cary, NC, USA, 1994. [Google Scholar]
- Ameen, A.B.; Ejaz, B. Effects of Social Anxiety on Self-Consciousness and Friendship Quality Among Female University Students. Unpublished thesis, Lahore College for Women, Lahore, Pakistan, 2018. [Google Scholar]
- Afzal, N.; Malik, S.; Muazzam, A. Personality traits, parenting styles and body image as predictors of pre-marital anxiety and effectiveness of pre-marital counseling. Unpublished Thesis, Lahore College for Women, Lahore, Pakistan, 2017. [Google Scholar]
- DeVellis, R.F. Scale Development: Theory and Applications, 2nd ed.; Sage Publications: Newbury Park, CA, USA, 2003. [Google Scholar]
- Hair, J.F.; Black, W.C.; Babin, B.T.; Anderson, R.E.; Tatham, R.L. Multivariate Data Analysis, 6th ed.; Pearson Prentice Hall: New Jersey, NJ, USA, 2006. [Google Scholar]
- Brun, I.; Rajaobelina, L.; Ricard, L. Online relationship quality: Scale development and initial testing. Int. J. Bank Mark. 2014, 32, 5–27. [Google Scholar] [CrossRef]
- Wittchen, H.U.; Stein, M.B.; Kessler, R.C. Social fears and social phobia in a community sample of adolescents and young adults: Prevalence, risk factors and comorbidity. Psychol. Med. 1999, 29, 309–323. [Google Scholar] [CrossRef] [PubMed]
- Caballo, V.E.; Salazar, I.C.; Irurtia, M.J.; Arias, B.; Hofmann, S.G. Differences in social anxiety between men and women across 18 countries. Personal. Individ. Differ. 2014, 64, 35–40. [Google Scholar] [CrossRef] [PubMed]
- Turk, C.L.; Heimberg, R.G.; Orsillo, S.M.; Holtph, C.S.; Gitowm, A.; Streetph, L.L.; Schneierm, F.R.; Liebowitzm, M.R. An investigation of gender differences in social phobia. J. Anxiety Disord. 1998, 12, 209–223. [Google Scholar] [CrossRef]
- Purdon, C.; Antony, M.; Monteiro, S.; Swinson, R.P. Social anxiety in college students. J. Anxiety Disord. 2001, 15, 203–215. [Google Scholar] [CrossRef]
- Pervez, S.; Irshad, E. Self-Esteem of socially anxious and non-anxious university students. Bahria J. Prof. Psychol. 2014, 13, 72–84. [Google Scholar]
- Batista-Navarro, R.T.; Kontonatsios, G.; Mihăilă, C.; Thompson, P.; Rak, R.; Nawaz, R.; Korkontzelos, I.; Ananiadou, S. Facilitating the analysis of discourse phenomena in an interoperable NLP platform. In Proceedings of the International Conference on Intelligent Text Processing and Computational Linguistics, Samos, Greece, 24–30 March 2013; Springer: Berlin/Heidelberg, Germany, 2013; pp. 559–571. [Google Scholar]
- Shardlow, M.; Batista-Navarro, R.; Thompson, P.; Nawaz, R.; McNaught, J.; Ananiadou, S. Identification of research hypotheses and new knowledge from scientific literature. BMC medical informatics and decision making. 2018, 18, 46. [Google Scholar] [CrossRef]
- Ananiadou, S.; Thompson, P.; Nawaz, R. Enhancing search: Events and their discourse context. In Proceedings of the International Conference on Intelligent Text Processing and Computational Linguistics, Samos, Greece, 24–30 March 2013; Springer: Berlin/Heidelberg, Germany, 2013; pp. 318–334. [Google Scholar]
- Jahangir, M.; Afzal, H.; Ahmed, M.; Khurshid, K.; Nawaz, R. An expert system for diabetes prediction using auto tuned multi-layer perceptron. In Proceedings of the 2017 Intelligent Systems Conference (IntelliSys), London, UK, 7 September 2017; pp. 722–728. [Google Scholar]
- Nawaz, R.; Thompson, P.; Ananiadou, S. Identification of Manner in Bio-Events. In Proceedings of the LREC, Istanbul, Turkey, 21–27 May 2012; pp. 3505–3510. [Google Scholar]
- Nawaz, R.; Thompson, P.; McNaught, J.; Ananiadou, S. Meta-Knowledge Annotation of Bio-Events. LREC 2010, 17, 2498–2507. [Google Scholar]
- Nawaz, R.; Thompson, P.; Ananiadou, S. Negated bio-events: Analysis and identification. BMC Bioinform. 2013, 1, 14. [Google Scholar] [CrossRef]
- Wang, X.; Rak, R.; Restificar, A.; Nobata, C.; Rupp, C.J.; Batista-Navarro, R.T.; Nawaz, R.; Ananiadou, S. Detecting experimental techniques and selecting relevant documents for protein-protein interactions from biomedical literature. BMC Bioinform. 2011, 8, S11. [Google Scholar] [CrossRef]
- Ayyaz, S.; Qamar, U.; Nawaz, R. HCF-CRS: A Hybrid Content based Fuzzy Conformal Recommender System for providing recommendations with confidence. PLoS ONE 2018, 13, 10. [Google Scholar] [CrossRef] [PubMed]
- Anjum, A.; Muazzam, A.; Manzoor, F.; Visvizi, A.; Pollock, G.; Nawaz, R. Measuring the scale and scope of workplace bullying: An alternative workplacebullying scale. Sustainability 2019, 11, 4634. [Google Scholar] [CrossRef]
- Anjum, A.; Muazzam, A.; Manzoor, F.; Visvizi, A.; Nawaz, R. Mediating bullying and strain in higher education institutions: The case of Pakistan. Sustainability 2019, 11, 2244. [Google Scholar] [CrossRef]
- Thompson, P.; Nawaz, R.; Korkontzelos, I.; Black, W.; McNaught, J.; Ananiadou, S. News search using discourse analytics. In 2013 Digital Heritage International Congress (DigitalHeritage); IEEE: Piscataway, NJ, USA, 2013; Volume 1, pp. 597–604. [Google Scholar]


| Items | Factors | |||
|---|---|---|---|---|
| 1 | 2 | 3 | Item Total Correlation | |
| SAQ1 | - | 0.65 | - | 0.65 ** |
| SAQ2 | - | 0.71 | - | 0.57 ** |
| SAQ3 | - | 0.66 | - | 0.61 ** |
| SAQ4 | - | 0.69 | - | 0.56 ** |
| SAQ5 | - | 0.67 | - | 0.46 ** |
| SAQ6 | - | 0.68 | - | 0.59 ** |
| SAQ7 | - | 0.75 | - | 0.49 ** |
| SAQ8 | 0.72 | - | - | 0.40 ** |
| SAQ9 | 0.76 | - | - | 0.52 ** |
| SAQ10 | 0.85 | - | - | 0.54 ** |
| SAQ11 | - | 0.71 | - | 0.37 ** |
| SAQ12 | - | 0.74 | - | 0.33 ** |
| SAQ13 | - | 0.68 | - | 0.33 ** |
| SAQ14 | - | - | 0.48 | 0.37 ** |
| SAQ15 | 0.85 | - | - | 0.69 ** |
| SAQ16 | 0.86 | - | - | 0.56 ** |
| SAQ17 | 0.70 | - | - | 0.74 ** |
| SAQ18 | 0.76 | - | - | 0.60 ** |
| SAQ19 | 0.73 | - | - | 0.55 ** |
| SAQ20 | - | - | 0.71 | 0.34 ** |
| SAQ21 | - | - | 0.69 | 0.54 ** |
| SAQ22 | - | - | 0.72 | 0.54 ** |
| Eigen values | 5.71 | 4.36 | 1.76 | |
| Cumulative percentage of variance | 25.97 | 19.82 | 8.04 | |
| Factors | 1 | 2 | 3 | 4 |
|---|---|---|---|---|
| 1. Performance Anxiety | - | 0.72 ** | 0.59 ** | 0.91 ** |
| 2. Interaction Anxiety | - | - | 0.54 ** | 0.91 ** |
| 3. Evaluation AnxietyTotal SAS | - | - | - | 0.73 ** |
| 4. Total SAS | - | - | - | - |
| Alpha coefficient | 0.84 | 0.81 | 0.78 | 0.90 |
| Variables | 1 | 2 | 3 | 4 |
|---|---|---|---|---|
| SAS | - | 0.41 ** | 0.63 ** | −0.40 ** |
| LSF | - | |||
| LSA | - | |||
| EXT | - |
| Men (n = 400) | Women (n = 400) | |||||||
|---|---|---|---|---|---|---|---|---|
| Variable | ||||||||
| M | SD | M | SD | Df | T | p | Cohen’s d | |
| Performance Anxiety | 13.67 | 5.22 | 16.44 | 5.64 | 798 | −7.18 | 0.000 | 0.96 |
| Interaction Anxiety | 10.06 | 6.82 | 17.39 | 7.69 | 798 | −14.25 | 0.000 | 1.02 |
| Evaluation Anxiety | 3.41 | 3.30 | 5.32 | 3.61 | 798 | −7.82 | 0.000 | 1.01 |
| Total Social Anxiety | 27.15 | 12.58 | 39.15 | 14.28 | 798 | −12.61 | 0.000 | 1.29 |
© 2020 by the authors. Licensee MDPI, Basel, Switzerland. This article is an open access article distributed under the terms and conditions of the Creative Commons Attribution (CC BY) license (http://creativecommons.org/licenses/by/4.0/).
Share and Cite
Ejaz, B.; Muazzam, A.; Anjum, A.; Pollock, G.; Nawaz, R. Measuring the Scale and Scope of Social Anxiety among Students in Pakistani Higher Education Institutions: An Alternative Social Anxiety Scale. Sustainability 2020, 12, 2164. https://doi.org/10.3390/su12062164
Ejaz B, Muazzam A, Anjum A, Pollock G, Nawaz R. Measuring the Scale and Scope of Social Anxiety among Students in Pakistani Higher Education Institutions: An Alternative Social Anxiety Scale. Sustainability. 2020; 12(6):2164. https://doi.org/10.3390/su12062164
Chicago/Turabian StyleEjaz, Bisma, Amina Muazzam, Ambreen Anjum, Gary Pollock, and Raheel Nawaz. 2020. "Measuring the Scale and Scope of Social Anxiety among Students in Pakistani Higher Education Institutions: An Alternative Social Anxiety Scale" Sustainability 12, no. 6: 2164. https://doi.org/10.3390/su12062164
APA StyleEjaz, B., Muazzam, A., Anjum, A., Pollock, G., & Nawaz, R. (2020). Measuring the Scale and Scope of Social Anxiety among Students in Pakistani Higher Education Institutions: An Alternative Social Anxiety Scale. Sustainability, 12(6), 2164. https://doi.org/10.3390/su12062164