Article

Efficiency Loss and Intensification Potential of Urban Industrial Land Use in Three Major Urban Agglomerations in China

1
College of Management, Lanzhou University, Lanzhou 730000, China
2
Institute for Studies in County Economy Development, Lanzhou University, Lanzhou 730000, China
3
Institute of Geographic Sciences and Natural Resources Research, Chinese Academy of Sciences, Beijing 100101, China
*
Author to whom correspondence should be addressed.
Sustainability 2020, 12(4), 1645; https://doi.org/10.3390/su12041645
Submission received: 24 December 2019 / Revised: 19 February 2020 / Accepted: 20 February 2020 / Published: 22 February 2020

Abstract

:
In recent decades, efficiency and intensification have emerged as hot topics within urban industrial land use (UILU) studies in China. However, the measurement and analysis of UILU efficiency and intensification are not accurate and in-depth enough. The study of UILU efficiency loss and intensification potential and their relationship is still lacking, and the application of parametric methods with clearer causal mechanisms is insufficient. This paper argued that the intensification potential of UILU could be defined as the amount of saved land or output growth resulting from reduced efficiency loss of UILU. Accordingly, we constructed quantitative models for measuring and evaluating the intensification potential of UILU, using the stochastic frontier analysis (SFA) method to calculate efficiency loss in three major urban agglomerations (38 cities) in China. Our results revealed a large scale and an expanding trend in the efficiency loss and intensification potential of UILU in three major urban agglomerations in China. From 2003 to 2016, the annual efficiency loss of UILU was 31.56%, the annual land-saving potential was 979.98 km2, and the annual output growth potential was 8775.23 billion Yuan (referring to the constant price for 2003). It is, therefore, imperative to formulate and implement better policies and measures to promote further intensification and to reduce inefficiency, especially in the Yangtze and Pearl River Deltas and prioritizing a few key cities, such as Dongguan, Shenzhen, and Shanghai.

1. Introduction

Rapid industrialization has been underway in China over the last four decades since the initiation of the reform and opening process in 1978. Driven by a globalization agenda after joining the World Trade Organization (WTO) at the end of 2001, China quickly emerged as a global manufacturing power and “world factory.” As a basic factor in production, the land has vitally contributed to China’s industrial growth and its rapid industrialization process. However, incrementally planned growth that requires a continuous supply of industrial land is not sustainable [1]. Serious and longstanding issues in China relating to industrial land include low land prices, excess land supply, the high area proportion, extensive use of land, inefficient land use, lax environmental controls, and the race to the bottom between cities [2,3,4,5,6]. This further has caused or aggravated the problems of repeated industrial construction, high industrial similarity, shortage of commercial and residential land, rapid urban sprawl, excessive occupation of cultivated land, large energy consumption, and worsening environmental pollution [6,7,8,9,10]. To some extent, the sustainable development of the whole economy and society in cities has been threatened. At heart is inefficient and extensive utilization of industrial land, while others are its causes or consequences. Accordingly, improving efficiency and promoting intensification of industrial land use are regarded as important goals and tasks by governments in China. To this end, many policies and measures have been taken, such as the lowest transfer price standard, the market-oriented transfer system (the system of bidding, auction, and listing), the investment intensity control indicator, the intensive utilization evaluation in development zones, disposal of idle land, and redevelopment of inefficient land.
These situations have attracted the continuous attention of scholars. In this context, efficiency and intensification have emerged as key issues in the study of urban industrial land use (UILU) in China in recent decades. Different methods have been used to measure and analyze the efficiency of UILU, such as indicator systems [11,12], data envelope analysis (DEA) [4,13,14,15], and the directional distance function model [16,17]. Many researchers have also attempted to measure and evaluate the intensification of UILU, mainly using comprehensive indicator systems [18,19,20,21,22]. As a result, many proposals to improve efficiency and promote intensification have been made. Heated debates about the efficiency and intensification of UILU in China have even transcended its borders, attracting international scholarly attention. However, the existing research has some shortcomings, and the measurement and analysis of UILU efficiency and intensification are not accurate and in-depth enough. On the one hand, although some scholars have directly or indirectly pointed out that the efficiency and intensification of UILU are closely inter-related in concept and practice [13,14,23,24], existing studies have treated them as relatively discrete. Consequently, theoretical explanation and empirical research on their inter-relationship remain a gap in the literature. On the other hand, too much attention has been paid to efficiency levels and intensification degrees of UILU, while not enough attention has been paid to efficiency losses and intensification potentials of UILU. But the latter has more guiding significance to the formulation and implementation of policies and measures. Moreover, research on UILU intensification and efficiency has been restricted to non-parametric methods in which causal mechanisms are unclear, such as indicator systems and DEA, so that the improvement of research accuracy and depth is hindered and could, therefore, be further developed.
Some researchers have suggested that efficiency loss relating to land use results in excessive inputs of land or insufficient outputs on land, which implies that there is potential for land saving or output growth [16,24]. Parametric methods, such as stochastic frontier analysis (SFA), have been increasingly used in analyses of land use efficiency because they reflect variations in time trends and enable the exclusion of noise error [24,25,26]. Drawing on these studies, we conceptualized and operationalized the close relationship existing between the efficiency loss and intensification potential of UILU. Further, we applied SFA, a parametric method with a clearer causal mechanism, to construct models and conducted empirical research, focusing on three major representative urban agglomerations in China. Our findings are expected to contribute to enhancing theoretical exchanges between researchers working on UILU efficiency and intensification and to assess the effectiveness of existing policies and measures to improve UILU efficiency and promote its intensification. So that our study could provide a scientific basis for the better formulation and implementation of policies and measures about UILU efficiency and intensification in the future.

2. Research Methodology

This paper calculated and analyzed the efficiency loss and intensification potential of UILU to provide guidance for improving UILU efficiency and promoting its intensification. It should be emphasized that UILU efficiency and intensification are the opposite of UILU inefficiency and extensification, respectively. The inefficient and extensive way of industrial development in the past in China created the "success" story of the Chinese industry while consuming a large amount of resources and energy, emitting a lot of pollution, and had a great negative impact on the environment. This is why we emphasized on UILU efficiency and intensification, which is a better way of industrial development with less resource and energy consumption, less pollution emissions, and lower environmental impact. We believed that improving UILU efficiency and promoting its intensification would contribute a lot to sustainable development, and this requires first knowing where the efficiency losses and intensification potential of UILU are and how much.

2.1. Model of Efficiency Loss

Efficiency refers to the maximization of outputs in relation to a given input or to the minimization of inputs in relation to a given output [27,28] and is expressed as a ratio of outputs and inputs [29]. Efficiency loss refers to the difference between actual and ideal efficiency and is calculated by subtracting the actual efficiency from the ideal efficiency [24]. SFA is a scientific method used to measure relative efficiency and efficiency loss. In SFA analysis, the efficiency of frontier production, established using the parametric method (stochastic frontier production function), is defined as the ideal efficiency (equal to 1). The efficiency of actual production (located in the range of 0 and 1) is determined by comparing the actual output with the frontier output under the same inputs [30,31]. Assuming that each city is a productive decision-making unit, the SFA model of urban industrial production is expressed as follows:
y i t = f ( X i t , β ) e x p ( υ i t μ i t )
μ i t = μ i e x p ( η t )
The parameters in Equation (1) are as follows: input factors X , urban units i , time t , unknown parameters to be estimated β , random or noise error υ , and non-negative items, representing technical inefficiency μ . The frontier production function with ideal efficiency is denoted by f ( X i t , β ) . The random or noise error items υ i t are independent variables from the same standard normal distribution, i.e., υ i t ~ i i d N ( 0 , σ υ 2 ) . The technical inefficiency items μ i t are independent variables from the same semi-standard normal distribution, i.e., μ i t ~ i i d N + ( 0 , σ μ 2 ) . Equation (2) expresses a commonly used efficiency loss index model, incorporating temporal variations, in which η denotes the influence of the time trend on efficiency loss, and t denotes a y e a r minus y e a r 0 (a selected base period). η > 0 denotes a decrease in the efficiency loss, whereas η < 0 denotes the reverse situation.
Technical efficiency T E i t denotes the actual efficiency of an urban area i at a certain time t . It is the ratio of actual output to maximum output at given inputs, as shown in Equation (3). The corresponding efficiency loss T E L i t is calculated as the ideal efficiency (a value of 1) minus the actual efficiency T E i t , as shown in Equation (4).
T E i t = e x p [ y i t | μ i t , x i t ] e x p [ y i t | μ i t = 0 , x i t ] = E [ e x p ( μ i t ) | ( υ i t μ i t ) ] = e x p ( μ i t )
T E L i t = 1 T E i t = 1 e x p ( μ i t )
In light of our review of previous studies, we selected the trans-log production function as the basic expression of the frontier production function f ( X i t , β ) . As a second-order approximation of a general function, the trans-log production function has a flexible form without too many assumptions. It has several advantages relative to other production functions like Cobb-Douglas (C-D) and constant elasticity of substitution (CES). For example, it can be used to examine interactions between input factors. Accordingly, we replaced Equation (1) by Equation (5):
l n ( y i t ) = l n [ f ( X i t , β ) ] + ( υ i t μ i t ) = β 0 + n = 1 N β n l n x n i t + 1 2 n = 1 N m = 1 N β n m l n x n i t l n x m i t + n = 1 N β n t t l n x n i t + β t t + 1 2 β t t t 2 + υ i t μ i t
We incorporated labor, capital, land, electricity, and water as the UILU input factors in Equation (5). Of the input factors required for industrial production, labor and capital are among the most important. The land is an indispensable spatial carrier for production, electricity is the most widely used form of energy, and water is also an important resource. Because the role of land as a spatial carrier in production differs significantly from that of other production factors, we deemed that it should not be juxtaposed with other production factors. Instead, we incorporated it into the production function as the denominator of each input and output [25]. Therefore, industrial land productivity (calculated as the industrial output divided by industrial land, that is, P u l = y i t / i l i t ) was considered as the output variable in this study. The labor input per area of industrial land ( l i t / i l i t ), the capital input per area of industrial land ( k i t / i l i t ), the electricity input per area of industrial land ( e i t / i l i t ), and the water input per area of industrial land ( w i t / i l i t ) were considered as input variables that were used to construct the UILU function.
Further, because technological changes can lead to changes in industrial land use in the same city over time, we used the variable of time to reflect and measure differences in industrial land use caused by technological changes, as shown in Equation (4). Positing that there could be significant differences among the three urban agglomerations, we used dummy variables to represent and reflect differences among the urban agglomerations. Adhering to the requirement that k 1 dummy variables should be introduced for nominal variables containing k categories [32], we used dummy variables d 1 and d 2 to represent the Beijing-Tianjin-Hebei urban agglomeration and the Yangtze River Delta urban agglomeration, respectively. In our model, if a city was located within the urban agglomeration, it was assigned a value of 1; otherwise, it was assigned a value of 0. The specific UILU function was constructed, as shown in Equation (6). Independent variables comprised one intercept item, four input items, one-time item, 14 interaction items (including five self-interaction quadratic items), two dummy items, one efficiency loss item, and one noise error item.
l n y i t i l i t = β 0 + β 1 l n l i t i l i t + β 2 l n k i t i l i t + β 3 l n e i t i l i t + β 4 l n w i t i l i t + β t t + 1 2 β 11 ( l n l i t i l i t ) 2 + 1 2 β 22 ( l n k i t i l i t ) 2 + 1 2 β 33 ( l n e i t i l i t ) 2 + 1 2 β 44 ( l n w i t i l i t ) 2 + 1 2 β t t ( l n t ) 2 + β 12 l n l i t i l i t l n k i t i l i t + β 13 l n l i t i l i t l n e i t i l i t + β 14 l n l i t i l i t l n w i t i l i t + β 23 l n k i t i l i t l n e i t i l i t + β 24 l n k i t i l i t l n w i t i l i t + β 34 l n e i t i l i t l n w i t i l i t + β 1 t t l n l i t i l i t + β 2 t t l n k i t i l i t + β 3 t t l n e i t i l i t + β 4 t t l n w i t i l i t + β d 1 d 1 + β d 2 d 2 + υ i t μ i t

2.2. Model of Intensification Potential

As previously noted, intensification and efficiency are closely related concepts. Intensification is a mode of production that entails increasing efficiency (factor productivity) rather than inputs [33,34,35,36]. Land-use intensification entails increasing outputs by increasing land productivity [37,38]. Therefore, intensification of land use essentially corresponds to an increase in efficiency or a reduction in efficiency loss. Accordingly, an increase (or decrease) in the efficiency loss corresponds to an increase (or decrease) in intensification potential.
There are two different expressions of land-use intensification potential, namely land-saving potential and output growth potential. In practice, loss of land use efficiency means that land inputs are excessive or land outputs are insufficient. Accordingly, the intensification potential of UILU can be defined as the amount of saved land or the output growth that may be obtained by reducing the efficiency loss of UILU. In light of measurements of the efficiency loss, as noted above, we constructed the following model for assessing the land-saving potential L S P and output growth potential O G P of UILIU:
L S P i t = i l i t T E L i t
O G P i t = y i t 1 T E L i t y i t
It should be noted that the land-saving potential and output growth potential, respectively, reflect the intensification potential of UILU from two different perspectives, namely input minimization and output maximization that are reciprocally related. Although they can coexist, their complete measurements cannot be simultaneously obtained.

3. Study Area and Data

3.1. Study Area

The Beijing-Tianjin-Hebei region, along with the Yangtze River and Pearl River Deltas, are the three largest and most developed urban agglomerations in China. They evidence the highest levels of industrialization and urbanization in the country. Statistical data obtained for the three urban agglomerations in 2016 indicated that while their total land area accounted for just 4.00% of the total area of China, their populations, GDPs, and industrial added values, respectively, accounted for 20.46%, 35.99%, and 39.74% of those of the country as a whole. Furthermore, their population density was 5.12 times above the national average, and the urbanization rate was 15% higher than the national average (see Table 1). We selected these three urban agglomerations as the study area because of their representativeness on UILU in China. Specifically, we investigated 38 municipal city districts located within these agglomerations over a period of 14 years from 2003 to 2016. Beijing-Tianjin-Hebei comprises 13 cities: Beijing and Tianjin, along with 11 cities within Hebei Province (Handan, Xingtai, Shijiazhuang, Tangshan, Qinhuangdao, Baoding, Zhangjiakou, Chengde, Cangzhou, Langfang, and Hengshui). The Yangtze River Delta comprises 16 cities: Shanghai along with eight cities in Jiangsu Province (Nanjing, Wuxi, Changzhou, Suzhou, Nantong, Yangzhou, Zhenjiang, Yangzhou, and Taizhou), and seven cities in Zhejiang Province (Hangzhou, Ningbo, Jiaxing, Huzhou, Shaoxing, Zhoushan, and Taizhou). The Pearl River Delta comprises nine cities in Guangdong Province (Guangzhou, Shenzhen, Zhuhai, Foshan, Jiangmen, Zhaoqing, Huizhou, Dongguan, and Zhongshan). For the sake of clarity, Taizhou in Zhejiang Province and Taizhou in Jiangsu Province were, respectively, labeled as Taizhou-a and Taizhou-b.

3.2. Data

The dataset was mainly derived from the “China Urban Construction Statistical Yearbook” (2003–2016) and the “China City Statistical Yearbook” (2004–2017). Among them, the “China Urban Construction Statistical Yearbook” is compiled by the Ministry of Housing and Urban-Rural Development based on statistical data on urban construction, which is submitted by provincial construction authorities and covers the urban area of cities. The “China City Statistical Yearbook”, compiled by the Urban Socio-Economic Survey Division of the National Bureau of Statistics, is an informative publication that comprehensively reflects the social and economic development of cities in China. Both are annually published by China Statistics Press, and both have electronic data available for download from related websites (For example, http://www.tjcn.org/).
The industrial output value, industrial employees, industrial assets (comprising current and fixed assets) balance, industrial land area, industrial electricity consumption, and industrial water consumption for each year within the period 2003–2016, respectively, represented the output, labor input, capital input, land input, electricity input, and water input for the current urban industrial production. The industrial output and employees were replaced by statistics obtained for industrial enterprises above the designated size because of the non-availability of accurate statistical data on all industrial enterprises. Moreover, we used water usage statistics on production and operations because of the lack of direct statistics on industrial water usage. Average annual data on the industrial employees and assets were used in the study. In addition, to eliminate the effect of price changes, the industrial output value and assets balance were treated and fixed into the 2003 constant price, respectively, with the provincial industrial producer and input price index. Table 2 presents descriptive statistics for each variable for the period 2003–2016.

4. Results and Analysis

4.1. Model Estimations and Validation

The assumption that technology changes and variable interactions occur (Equation (5)) required validation. Accordingly, in model 1, we assumed that there were no technical changes and variable interactions, that is, all coefficient terms, except β 0 , β 1 , β 2 , β 3 , β 4 , β d 1 , a n d   β d 2 , had a value of zero. In model 2, we assumed that there were technical changes but no variable interactions, that is, all coefficient terms, except β 0 ,   β 1 , β 2 , β 3 , β 4 , β t , β d 1 , a n d   β d 2 , had a value of zero. In model 3, we posited that there were variable interactions but no technical changes. Accordingly, the coefficients of all the time-dependent terms had a value of zero ( β t = β 1 t = β 2 t = β 3 t = β 4 t = β t t = 0 ). In model 4, we assumed that variable interactions and technical changes both occurred; that is, none of the coefficients had a value of zero.
FRONTIER 4.1, a public access program written by Tim Coelli for estimating stochastic frontier models (See the website http://www.uq.edu.au/economics/cepa/frontier.htm), was used to estimate and validate the four models. We initially selected model 4 because its results were superior to those obtained for the other three models. However, there were one input item, eight interaction items, and one dummy item in model 4 not statistically significant, indicating that model 4 required further adjustment. Specifically, the eight interaction items and one dummy item in model 4 were not only statistically insignificant but also not significant in an economic sense, indicated by the values of the coefficients, which all did not exceed 0.10. Consequently, their deletion made the model more accurate and concise. However, although the water input item was not significant, the interaction items between the water input and the labor and capital inputs were statistically significant in model 4. In such a situation where the interaction items are significant, but the low-order item (water input) is not, the latter should be retained in the model [27]. Therefore, in model 5, we assumed that the values of the coefficients of the above eight non-significant interaction items and one dummy item in model 4 were all zero, that is, β 33 = β 44 = β 12 = β 23 = β 34 = β 1 t = β 3 t = β 4 t = β d 2 = 0 . The results of the estimation and validation of model 5, using FRONTIER 4.1 software, indicated that all of the items except water input were statistically significant. Accordingly, we selected model 5 as the final model. Table 3 presents the results of the estimation and validation conducted for each model.
The variance parameters, σ 2 and γ , depicted in Table 2, were constructed to facilitate the estimation (see Equation (9)). The variance sum of efficiency loss and noise error was denoted by σ 2 , while γ denoted the variance proportion of efficiency loss in relation to the total variance and reflected the degree to which the efficiency loss term could account for the total disturbance.
σ 2 = σ υ 2 + σ μ 2
γ = σ μ 2 / σ 2
According to the results obtained for model 5, γ = 0.7990 , indicating that up to 79.90% of the total disturbance could be explained by the efficiency loss term μ i t , while only 20.10% could be explained by the noise error term υ i t . With reference to Equation (6) and the results of model 5, we expressed the empirical UILU function of the three major urban agglomerations in China in trans-log form, as shown in Equation (11). The coefficients of the dummy variable d 1 in Equation (11), representing Beijing-Tianjin-Hebei, were statistically as well as economically significant, indicating that the UILU frontier of the Beijing-Tianjin-Hebei agglomeration differed significantly from those of the Yangtze and Pearl River Delta agglomerations.
l n ( y i t i l i t ) = 2.4713 + 1.2392 l n l i t i l i t 0.7053 l n k i t i l i t + 0.9227 l n e i t i l i t 0.0170 l n w i t i l i t + 0.1777 t + 0.0723 ( l n l i t i l i t ) 2 + 0.1123 ( l n k i t i l i t ) 2 0.0028 ( l n t ) 2 0.1985 l n l i t i l i t l n e i t i l i t 0.0806 l n l i t i l i t l n w i t i l i t + 0.1186 l n k i t i l i t l n w i t i l i t 0.0172 t l n k i t i l i t 0.2532 d 1 + υ i t μ i t

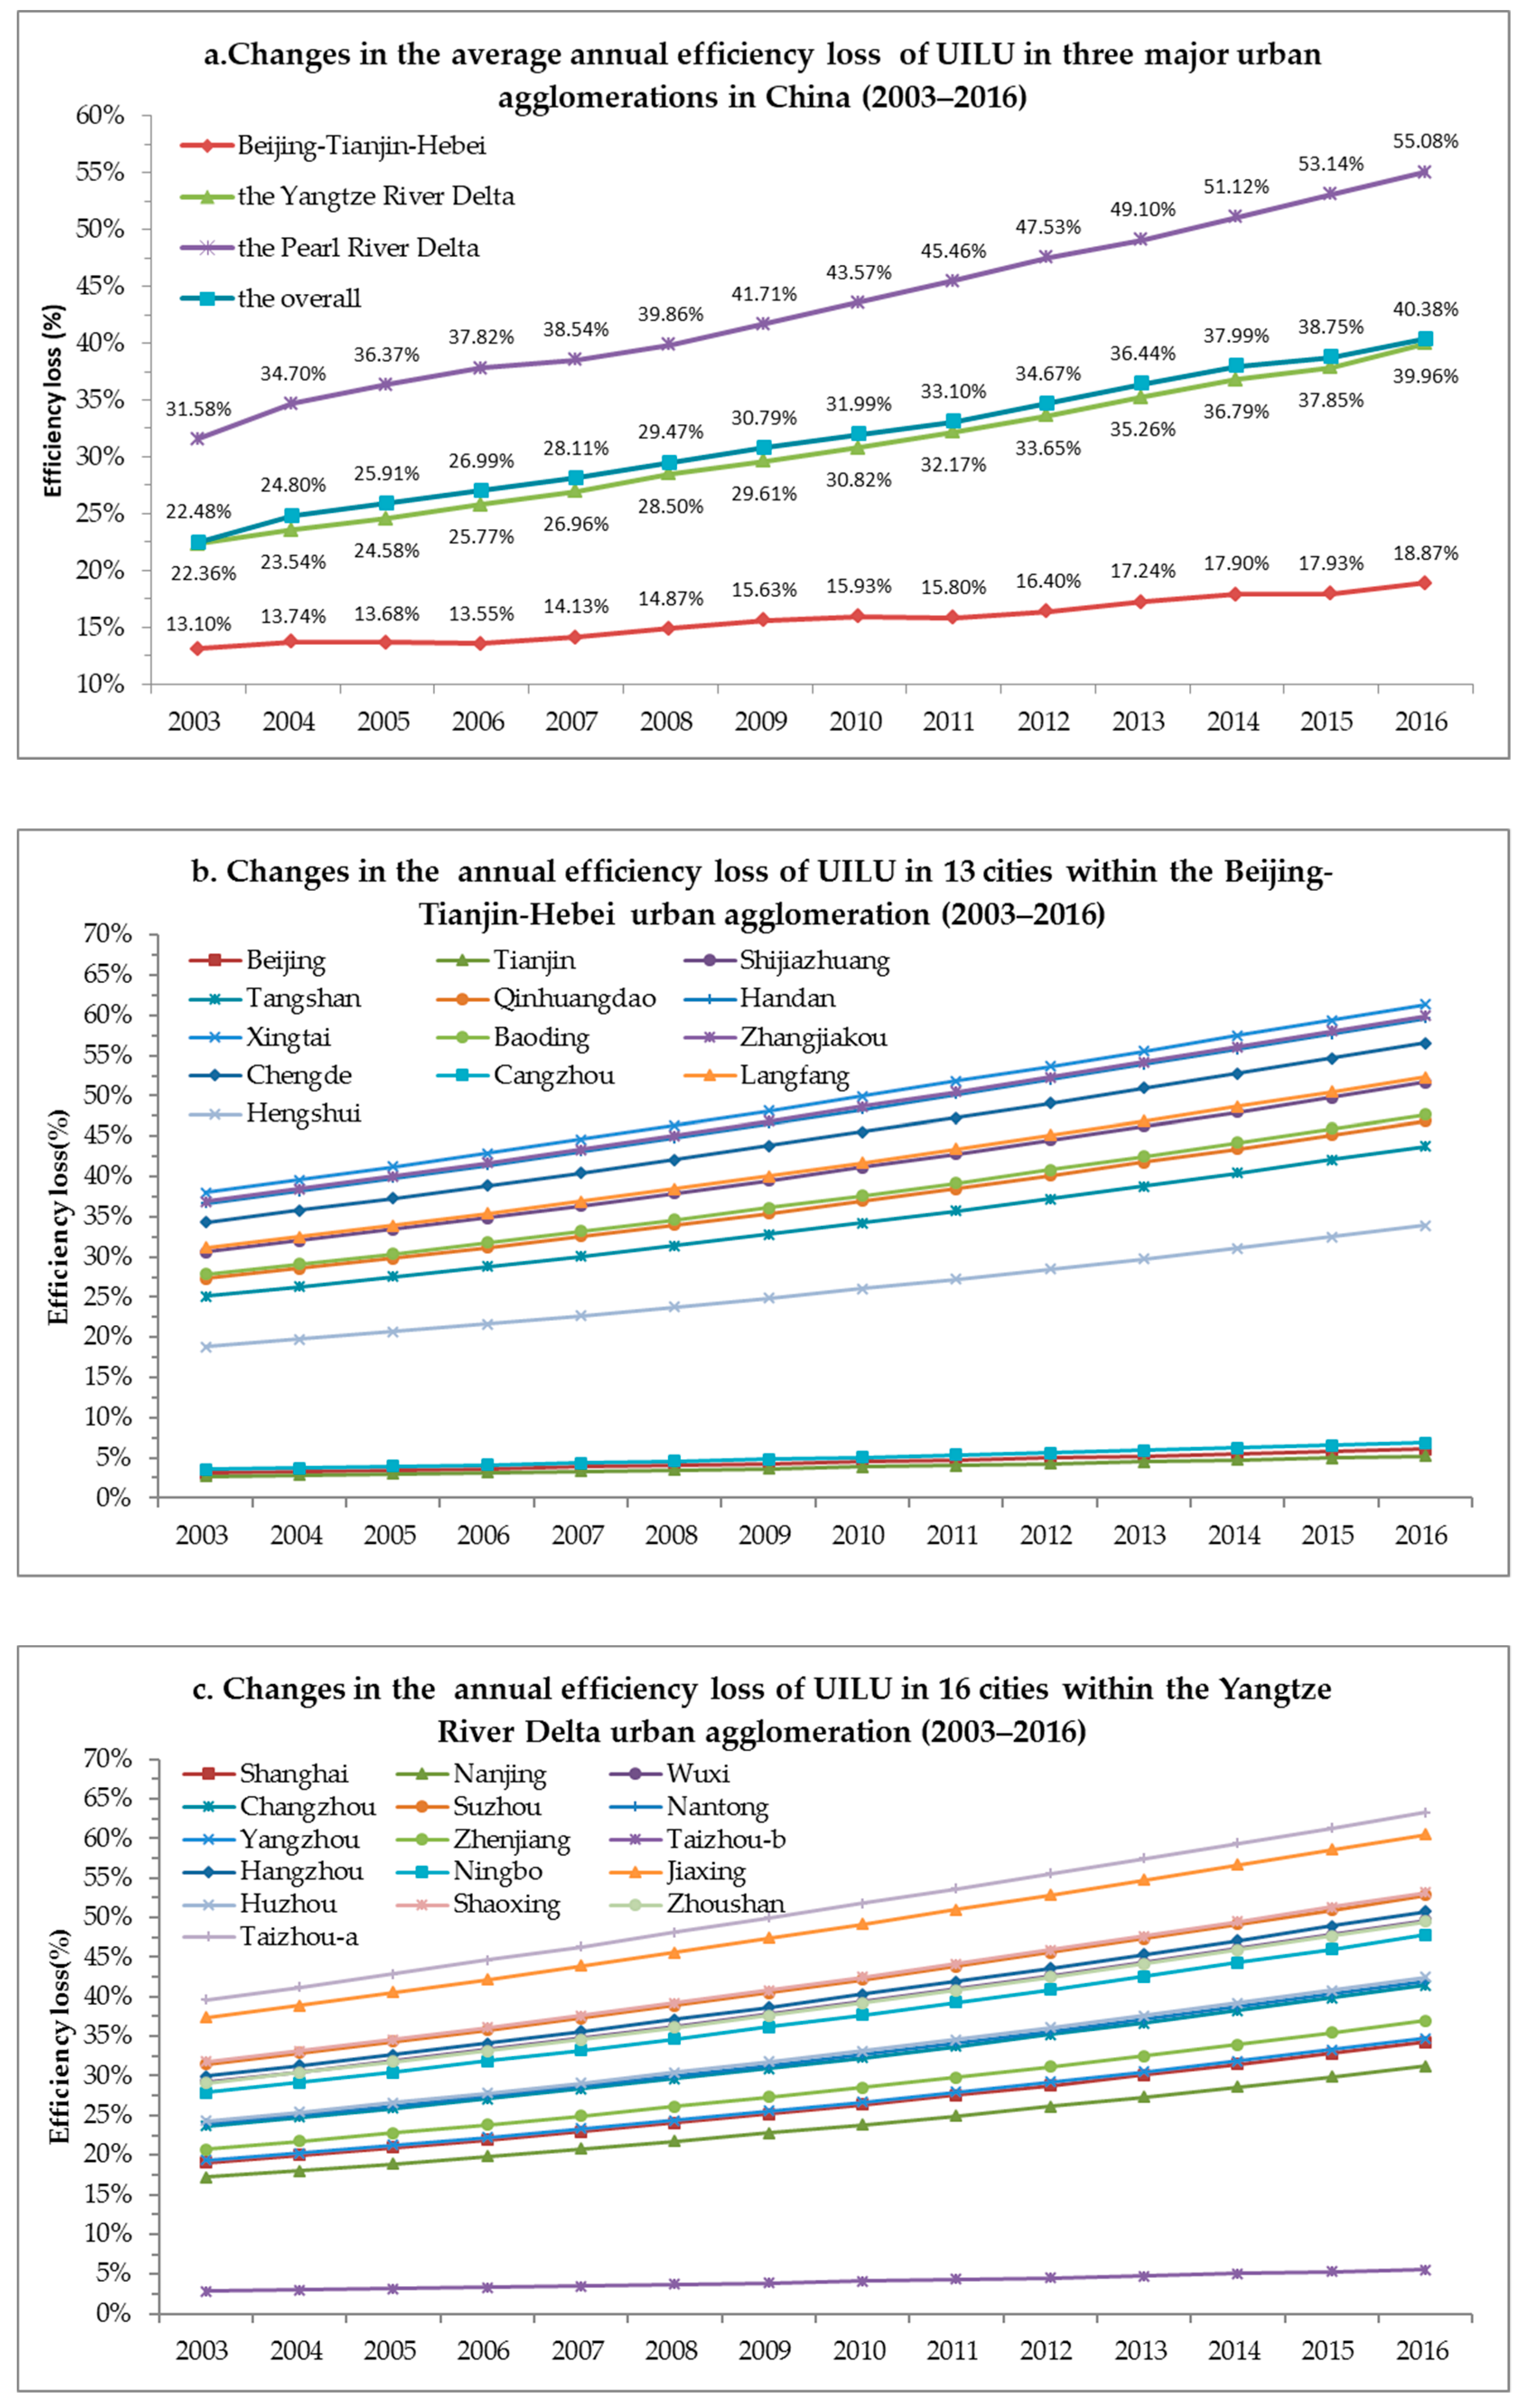
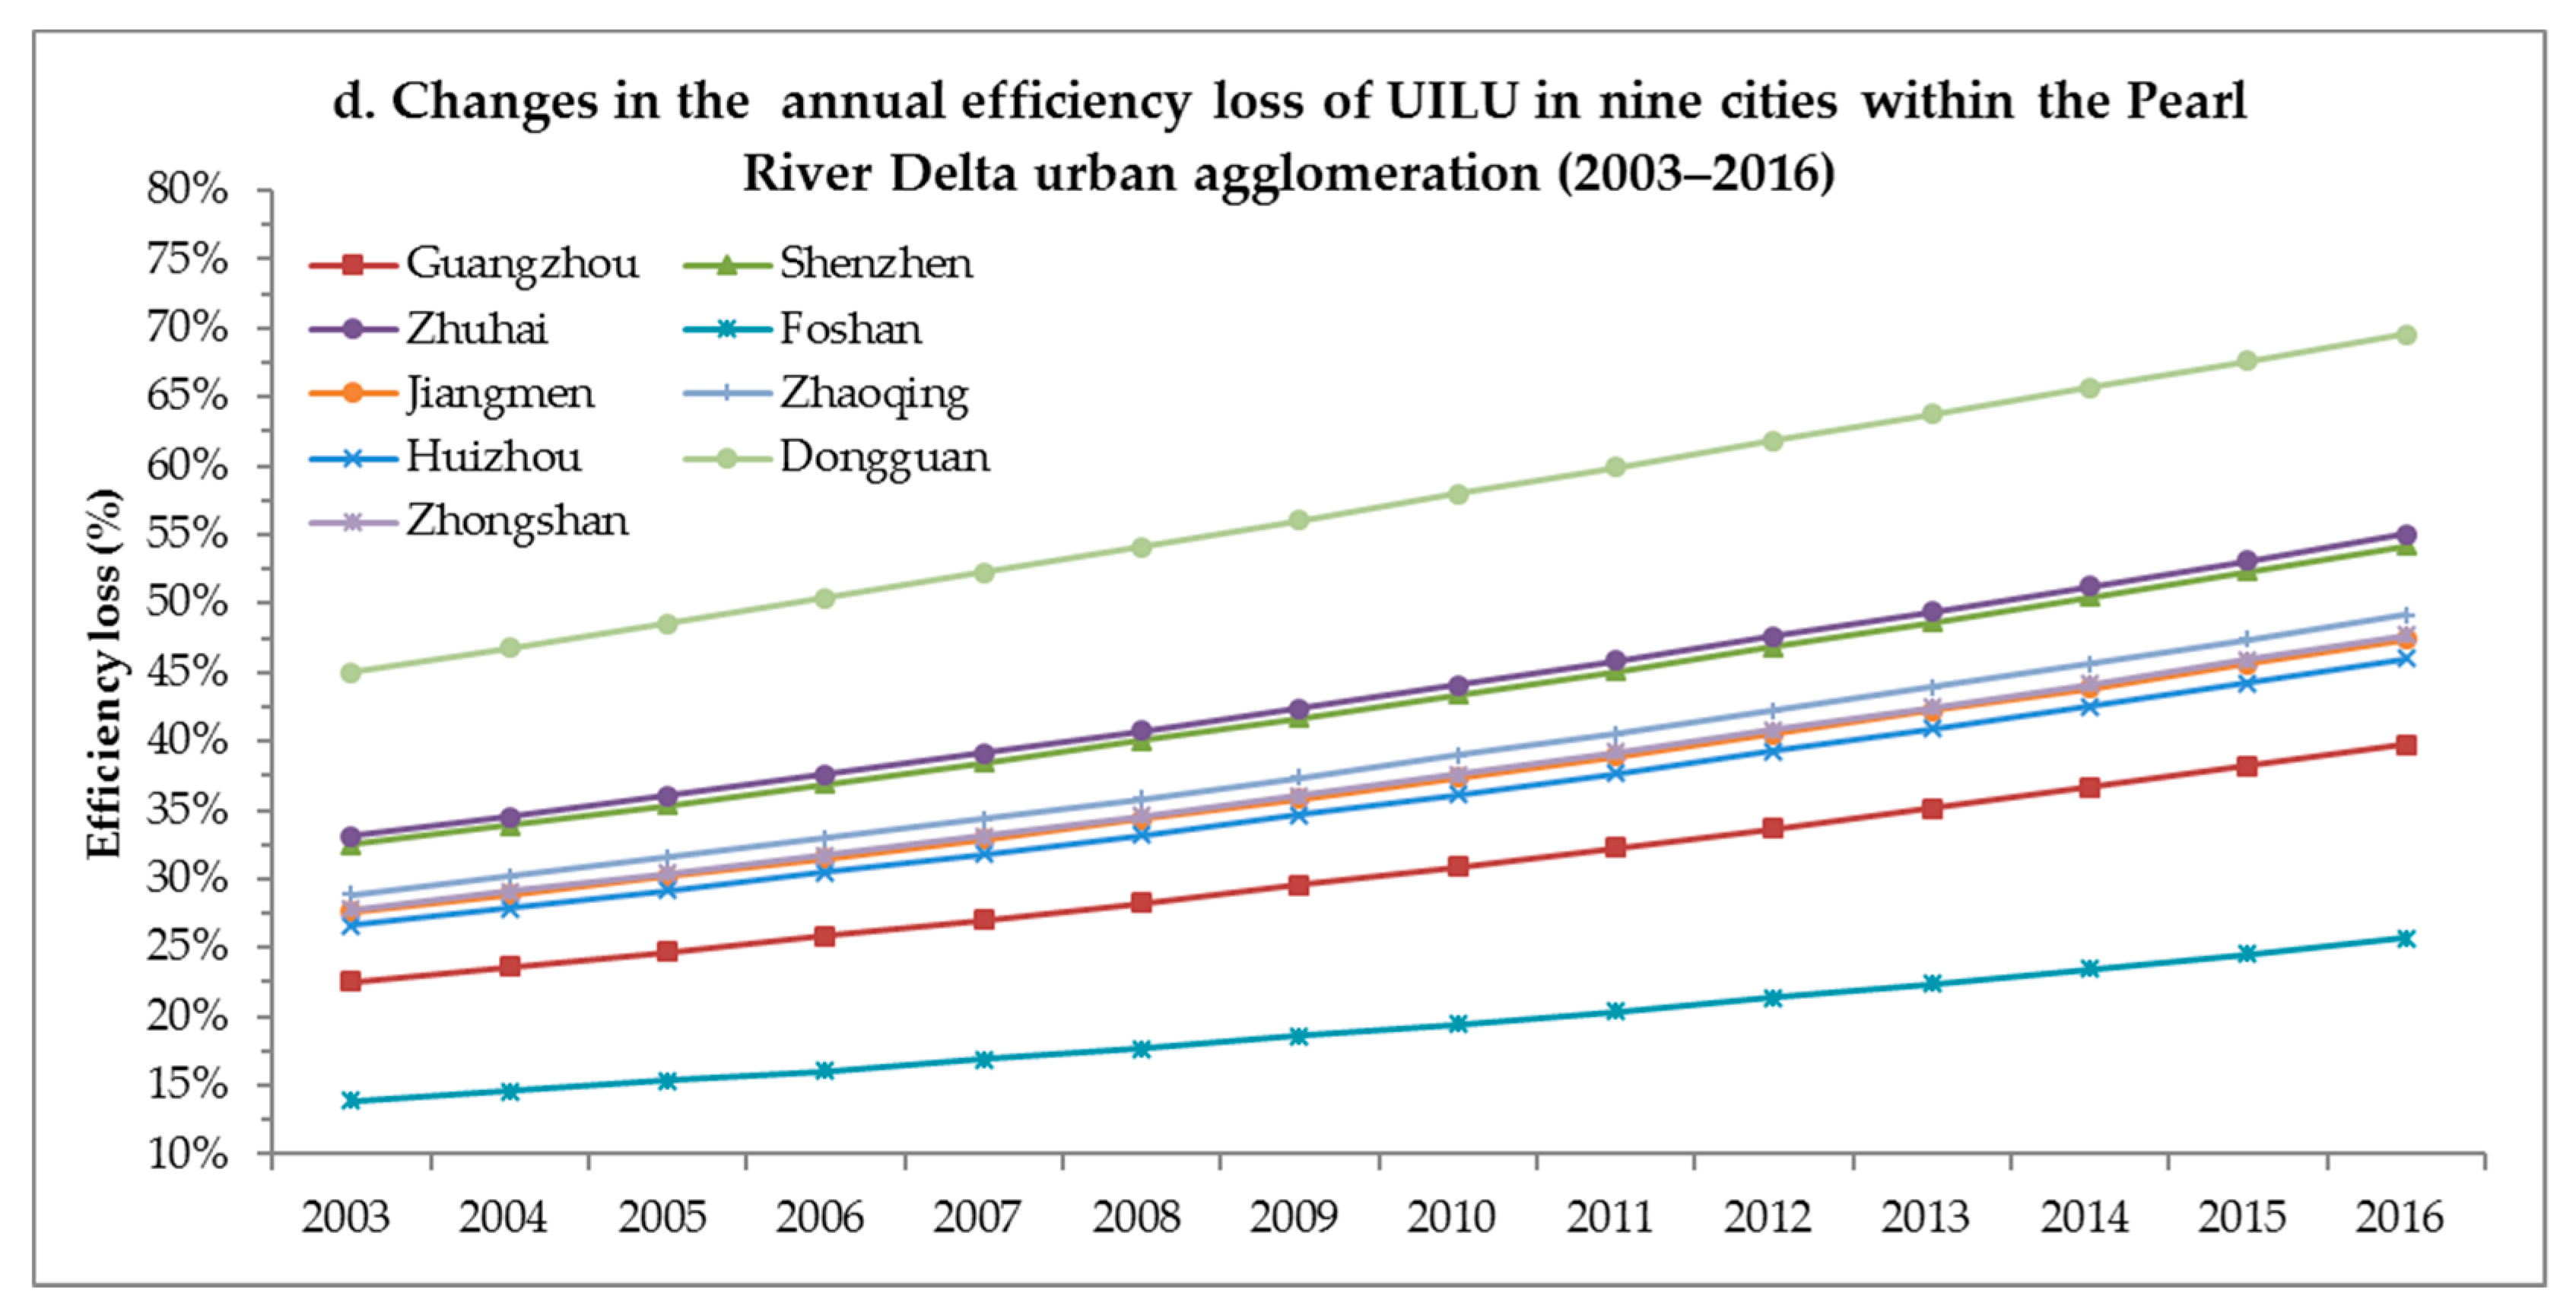
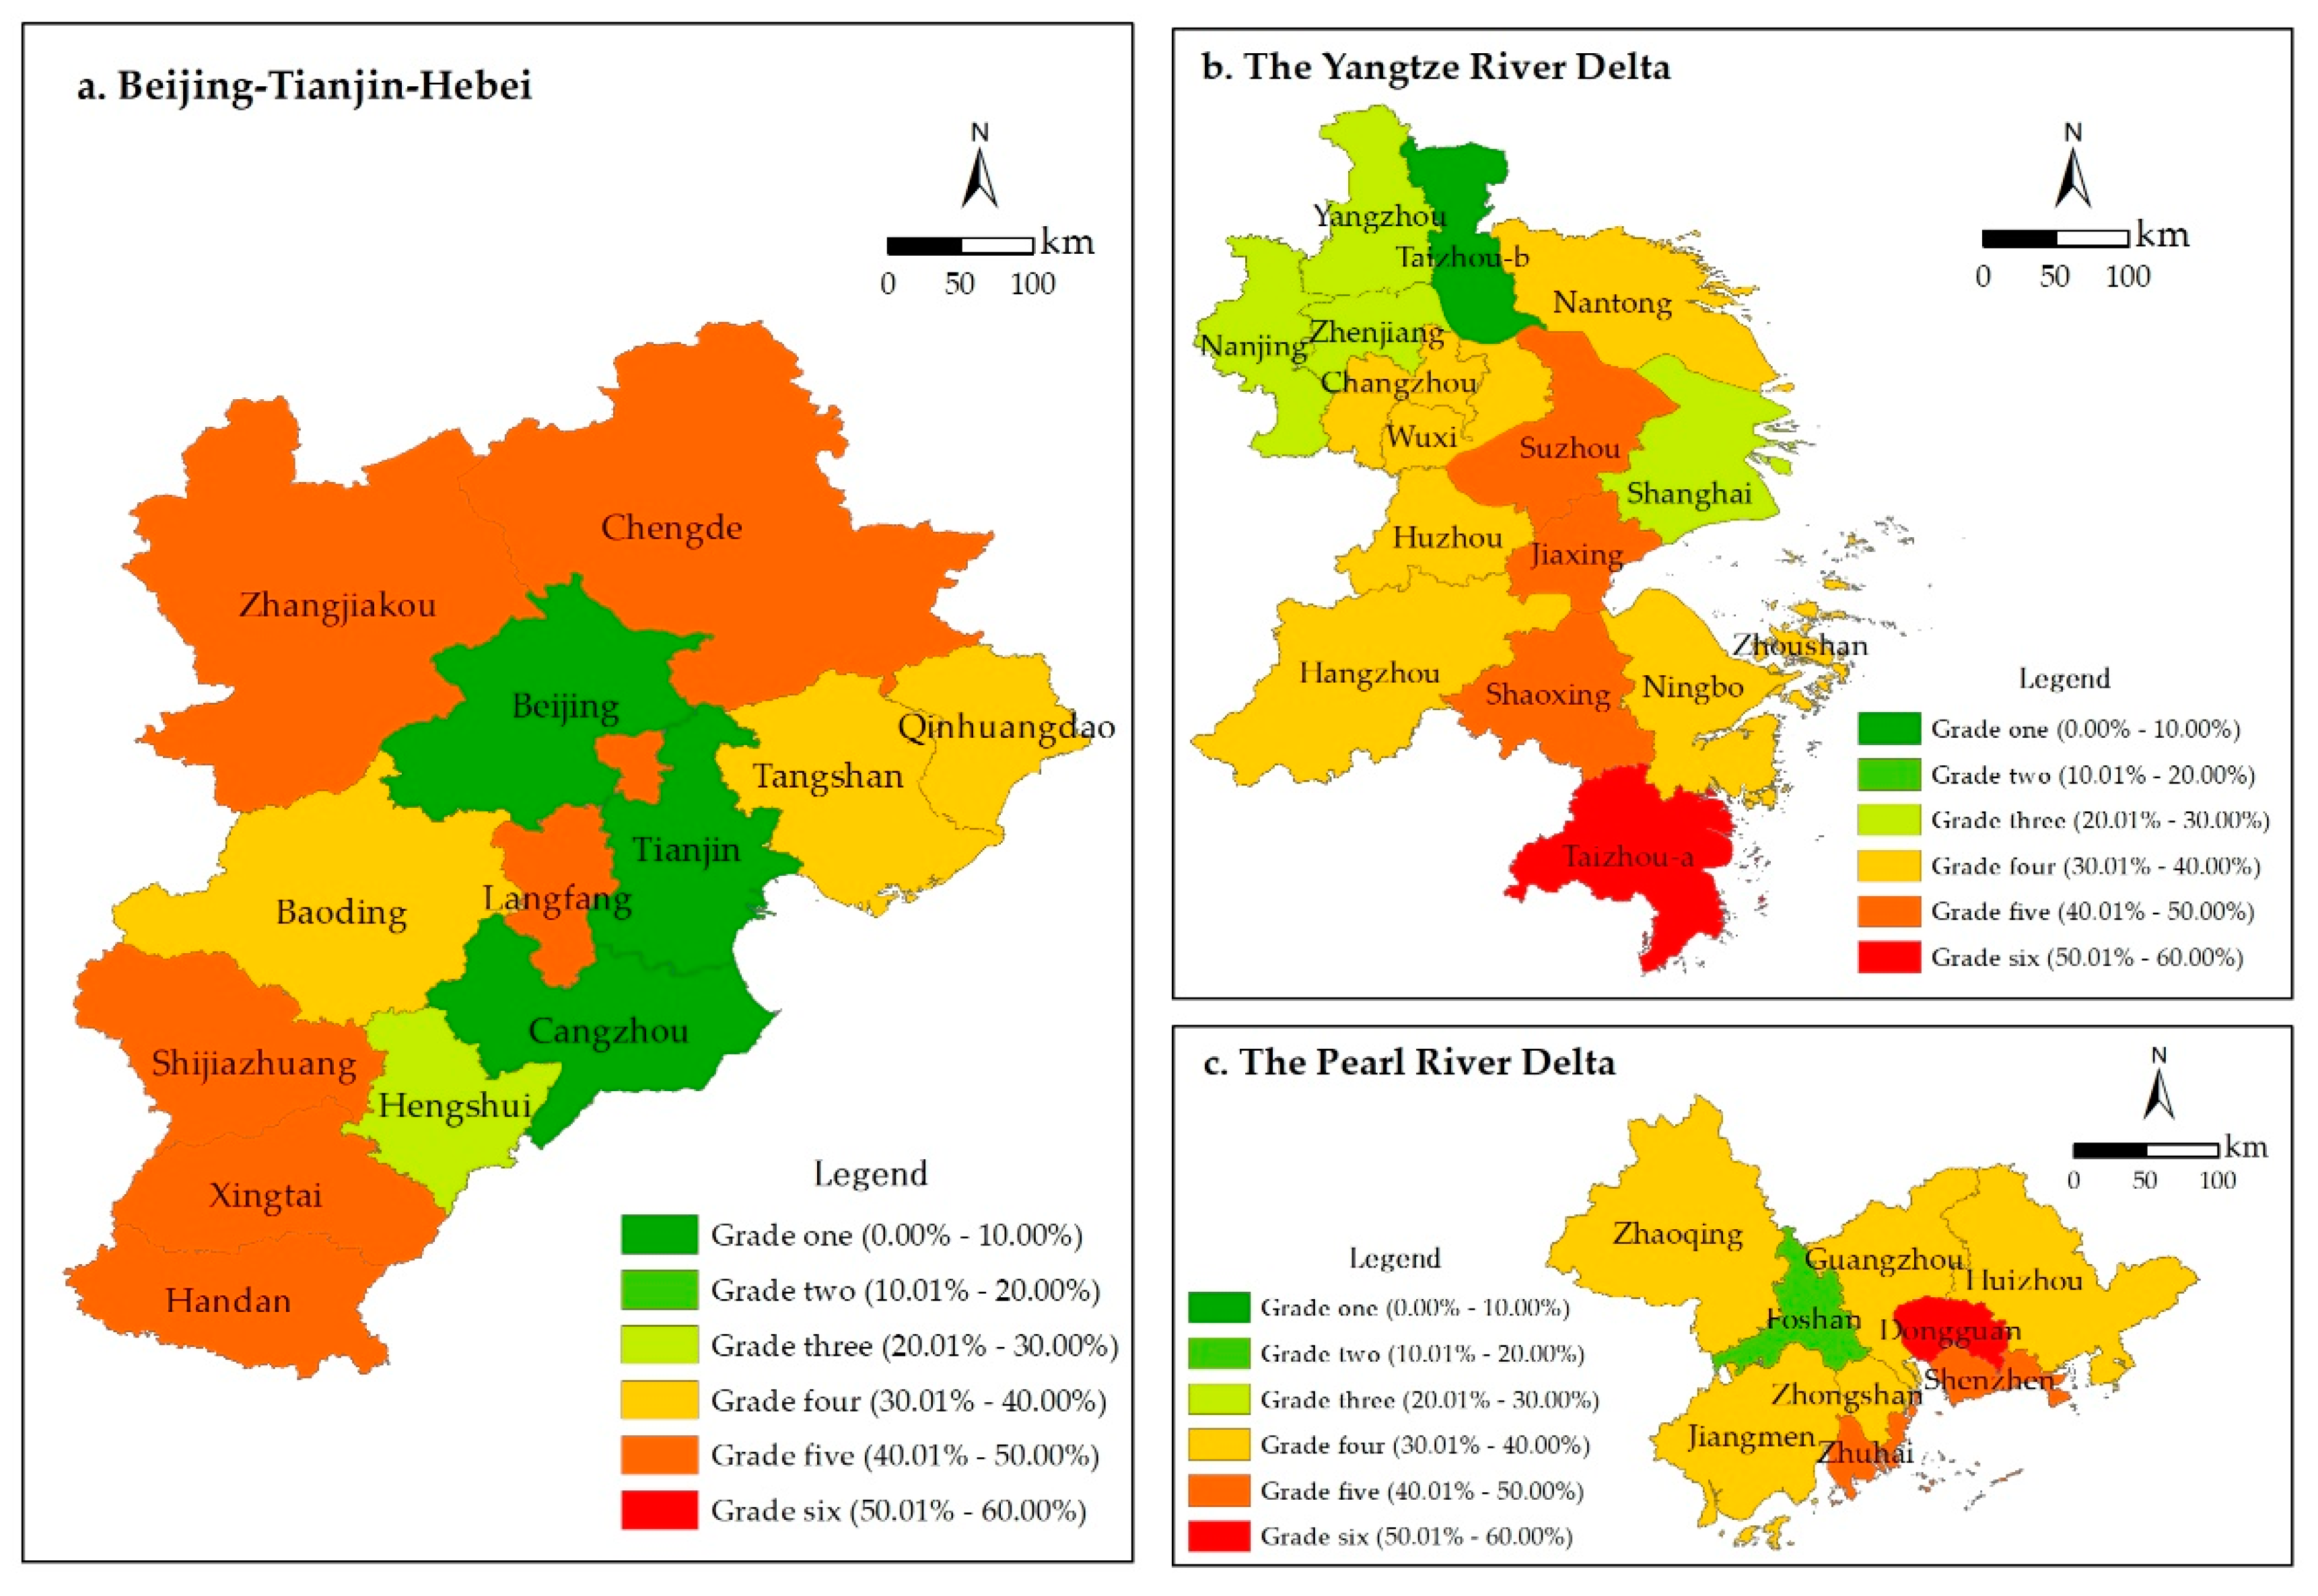
4.2. Efficiency Loss Analysis

Figure 1 depicts changes in the efficiency loss of UILU in three major urban agglomerations in China. As depicted in Figure 1a, the efficiency loss of UILU in these agglomerations (calculated as the weighted average of the efficiency loss of each city within the agglomeration, considering the proportions of industrial land area as the weights) was increasing annually. The overall efficiency loss of the three urban agglomerations increased from 22.48% in 2003 to 40.38% in 2016, with an average annual loss of 31.56% and a net increase of 17.90%. The efficiency loss of the Beijing-Tianjin-Hebei region, the Yangtze River Delta, and the Pearl River Delta increased from 13.10%, 22.36%, and 31.58%, respectively, in 2003 to 18.87%, 30.56%, and 43.26%, respectively, in 2016. The average annual losses for these regions were 15.63%, 30.56%, and 43.26%, respectively, entailing net increases of 5.77%, 17.60%, and 23.51%. Gaps in the efficiency loss of UILU among the three urban agglomerations gradually expanded. For example, the difference between the Beijing-Tianjin-Hebei region (with the lowest loss) and the Pearl River Delta (with the highest loss) rose from 18.48% in 2003 to 36.22% in 2016. On the whole, the situation regarding UILU efficiency in China is not favorable and is getting progressively worse, which contradicts the result that in China, UILU efficiency is improving [4,5,14], and supports the view that UILU efficiency is decreasing [39]. Consequently, considerable attention should be devoted to resolving this issue, entailing the introduction of much more stringent policies and measures to reduce efficiency losses.
Figure 1b–d shows that the patterns of efficiency loss of UILU among cities within the three urban agglomerations remained relatively fixed and highly consistent. Tianjin, Beijing, and Cangzhou were associated with the lowest losses of UILU efficiency that were considerably lower than those of the 11 other cities in the Beijing-Tianjin-Hebei region. In the Yangtze River Delta, Taizhou in Jiangsu Province (Tangzhou-b) evidenced the lowest UILU efficiency loss, while Taizhou in Zhejiang Province (Taizhou-a) and Jiaxing evidenced the highest losses. Lastly, in the Pearl River Delta, Foshan and Dongguan consistently demonstrated the lowest and highest UILU efficiency losses, respectively. Among all 38 cities in all three agglomerations, the gap between the city with the lowest efficiency loss (Tianjin) and the city with the highest efficiency loss (Dongguan) evidenced a steady annual increase from 42.35% in 2003 to 64.33% in 2016. These results refuted the result that the UILU efficiency gap between cities in China is shrinking [40] and confirmed the view that it is widening [39]. Therefore, we could infer that the detrimental presence of path dependence and the Matthew effect relating to UILU efficiency in China have not been effectively resolved and overcome through existing policies and measures.
The 38 cities located within the three major urban agglomerations in China can be categorized within six grades, based on their average annual efficiency loss of UILU, evidencing an absolute difference of 10%. As Figure 2 shows, Beijing, Tianjin, Cangzhou, and Taizhou-b are grade-one cities, and Foshan is a grade-two city. Hengshui, Shanghai, Nanjing, Yangzhou, and Zhenjiang belong to grade three, and Taizhou-a and Dongguan belong to grade six. The remaining 26 cities are either grade-four cities (15) or grade-five cities (11). The figure shows a discernable spatial agglomeration pattern for the efficiency loss of UILU in China. For example, Beijing, Tianjin, and Cangzhou constitute a regional cluster of grade-one cities, and Yangzhou, Zhenjiang, and Nanjing make up a second regional cluster of grade-three cities. Two regional clusters of grade-4 cities are evident. The first comprises Changzhou, Wuxi, Huzhou, and Hangzhou, and the second comprises Jiangmen, Zhongshan, Guangzhou, and Huizhou. There are also two regional clusters of grade-five cities: Shijiazhuang, Xingtai, and Handan and Suzhou, Jiaxing, and Shaoxing. These findings suggested the need to strengthen cooperation and collaboration regarding the control and management of UILU among cities within the same or different clusters.

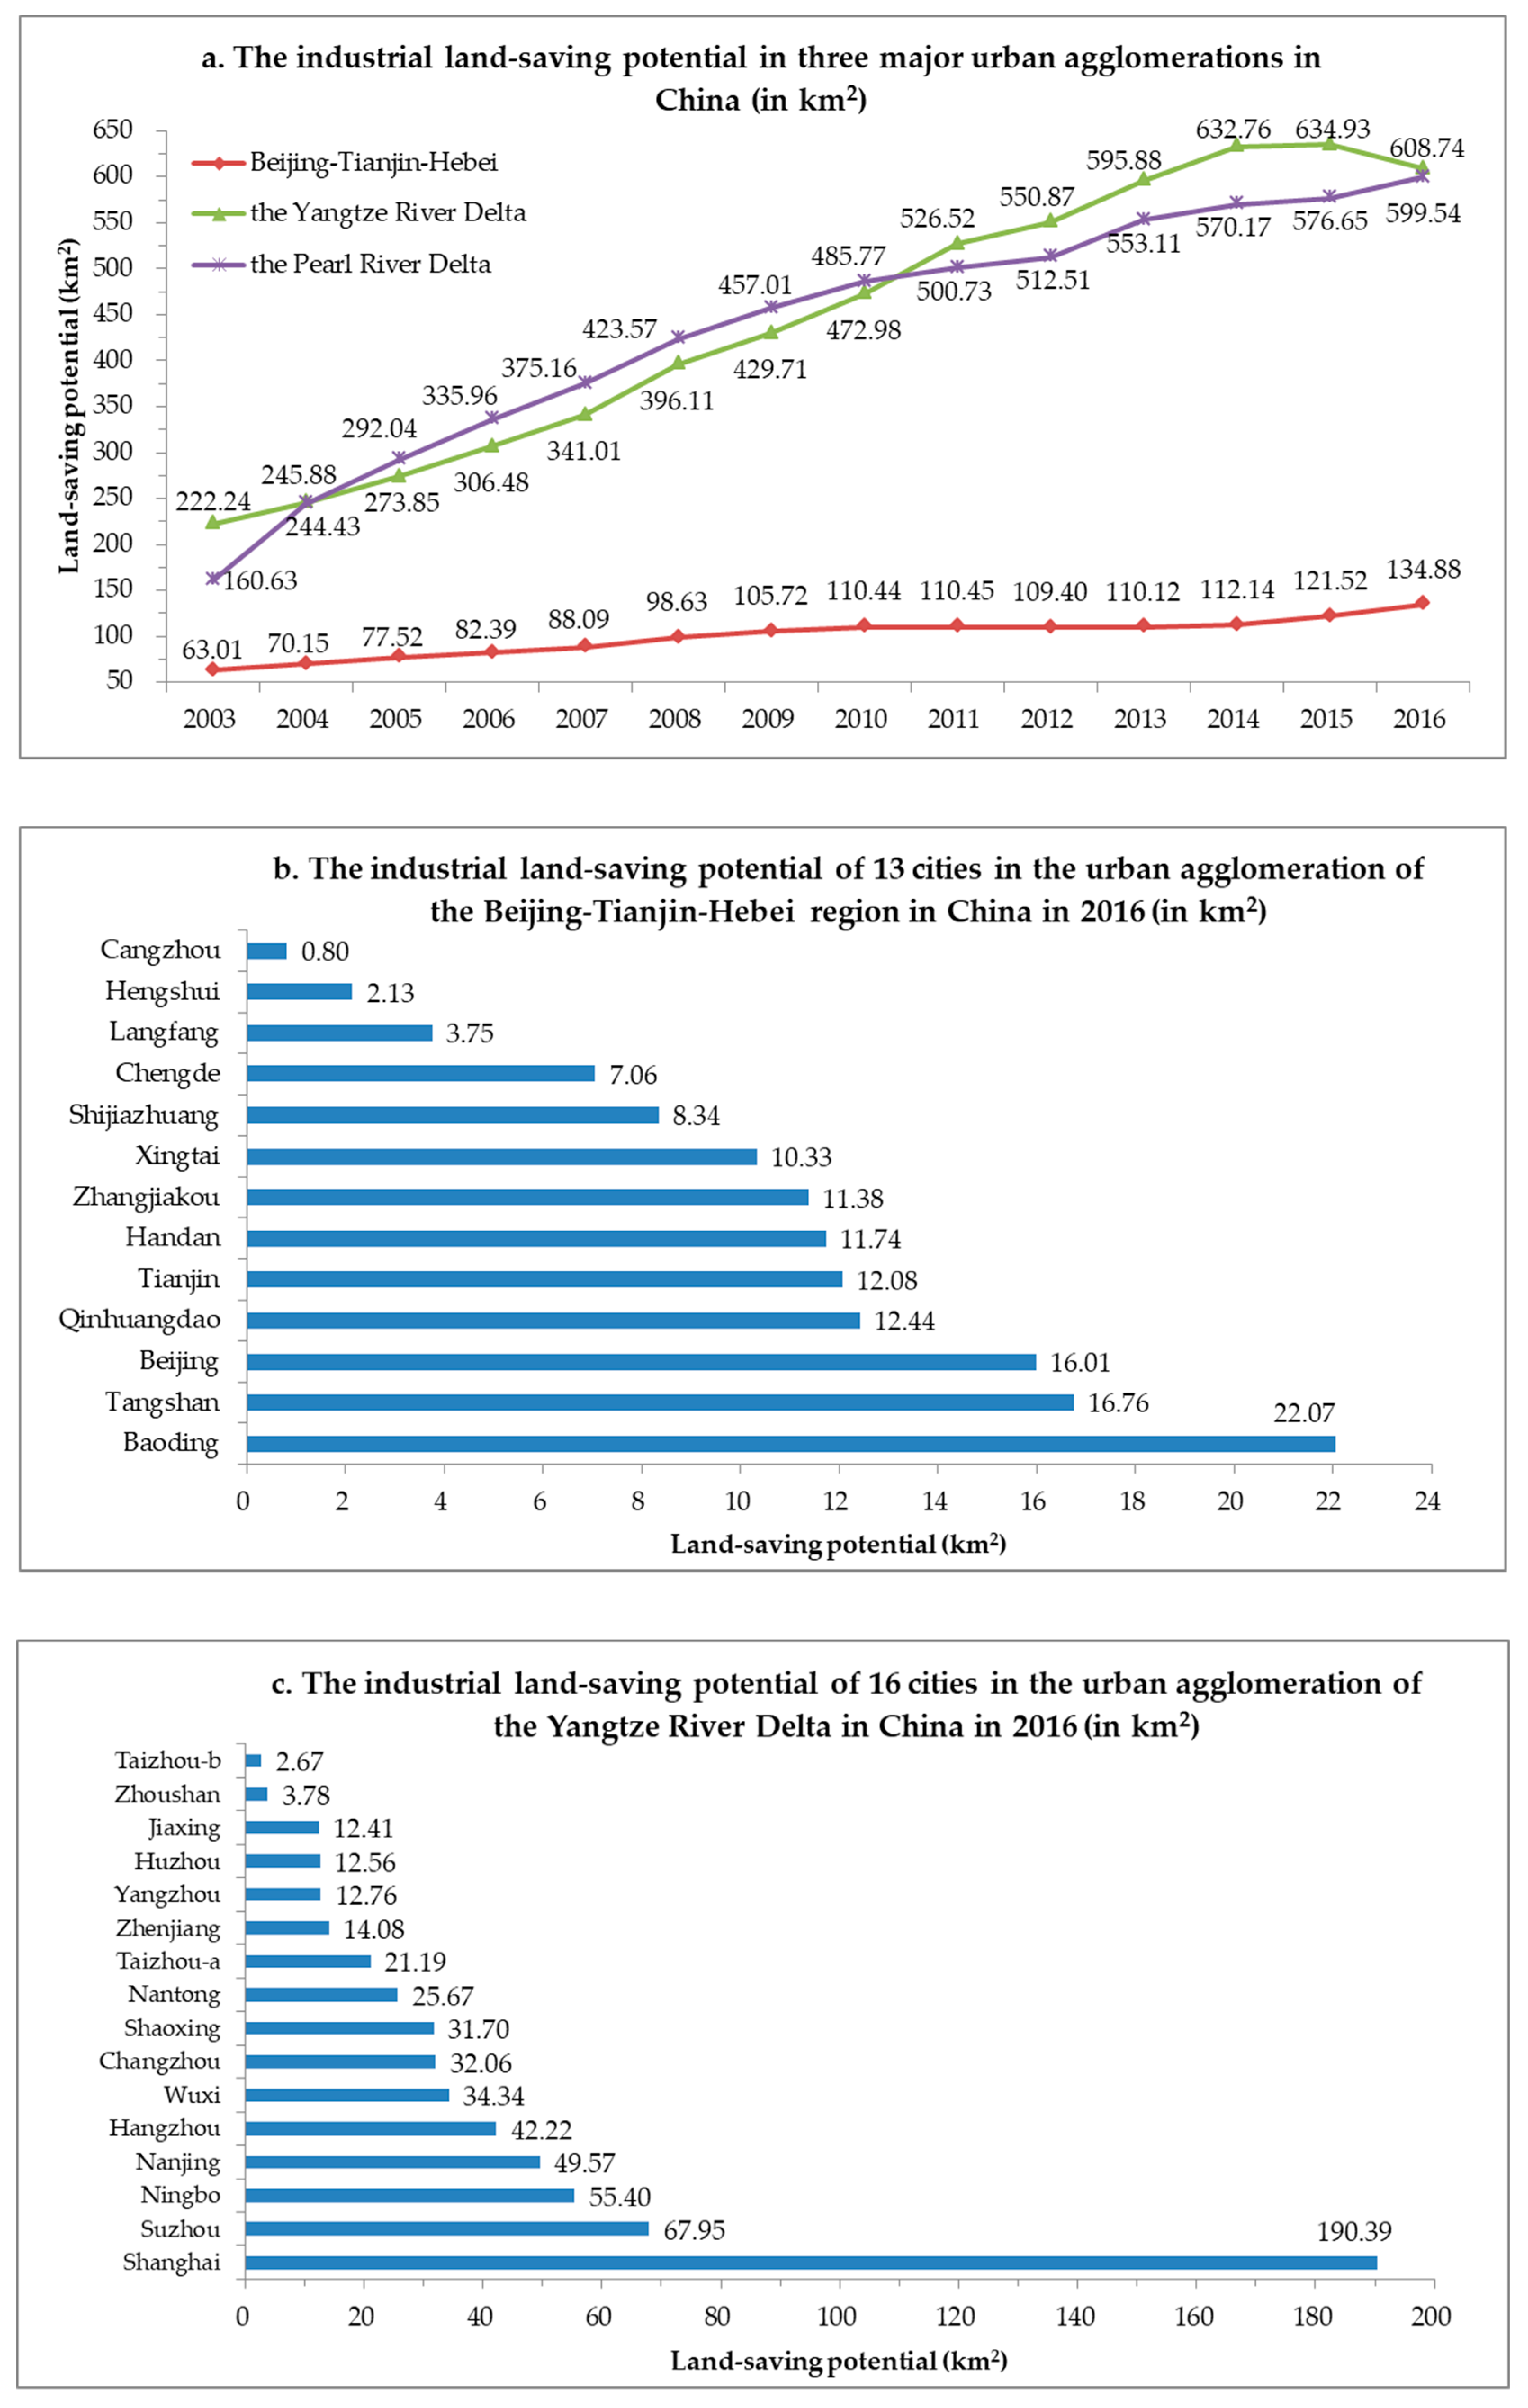
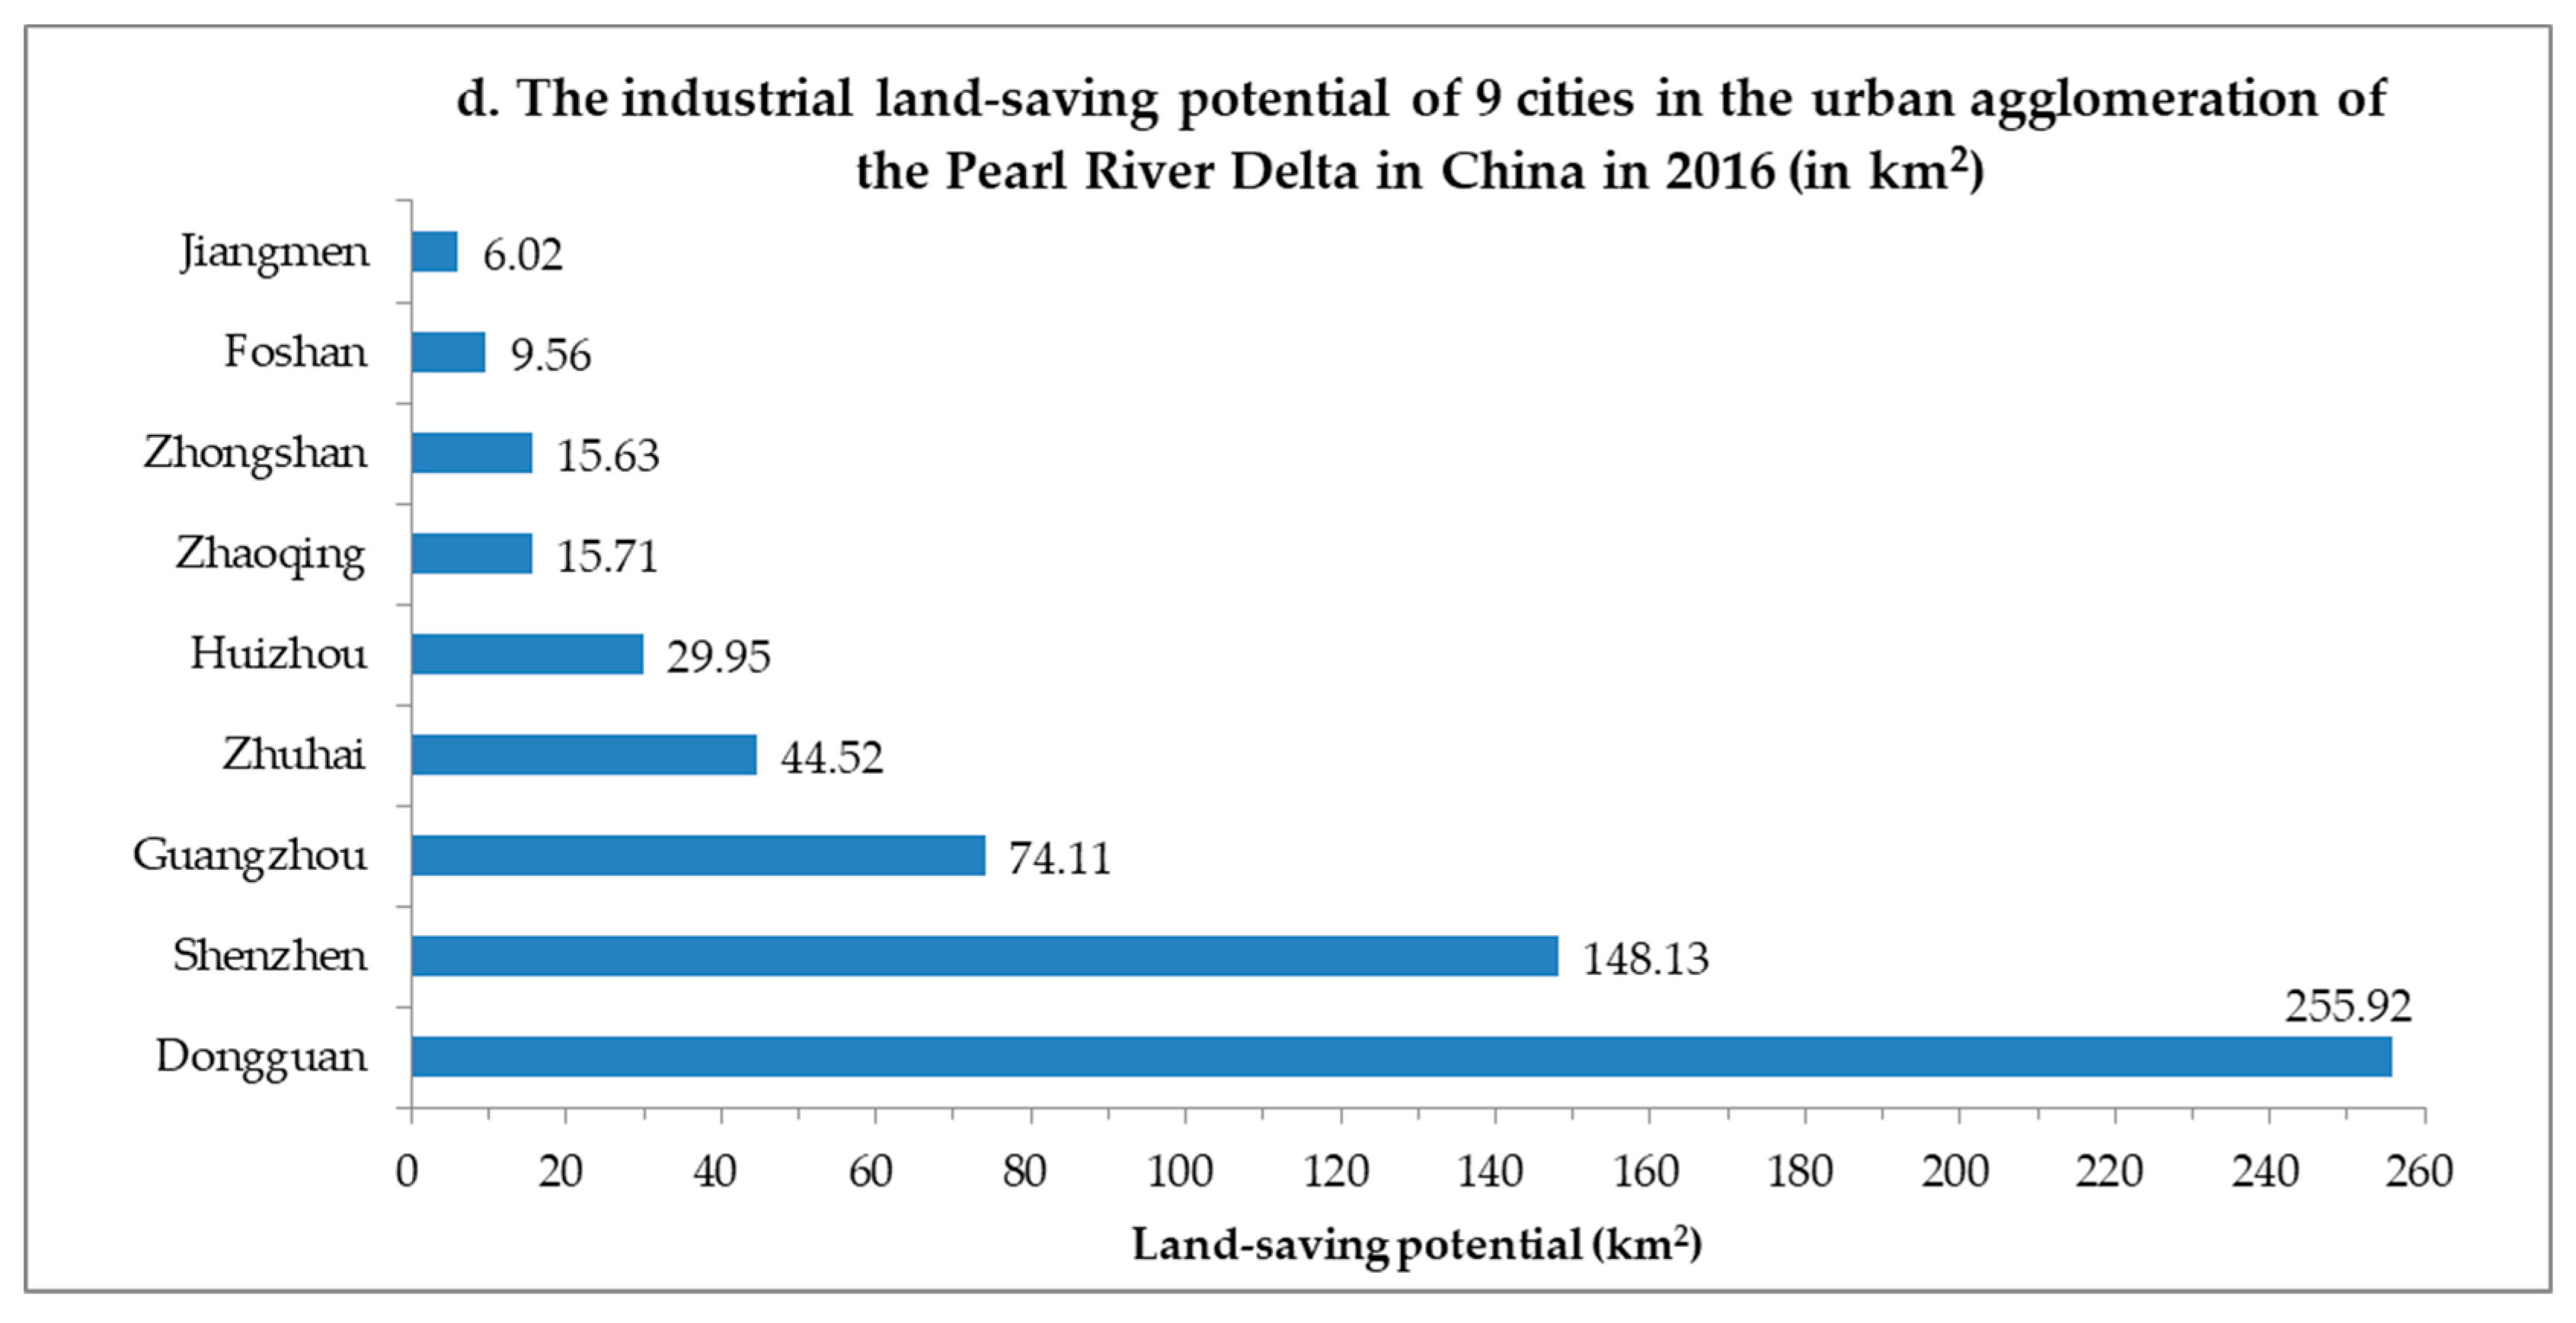
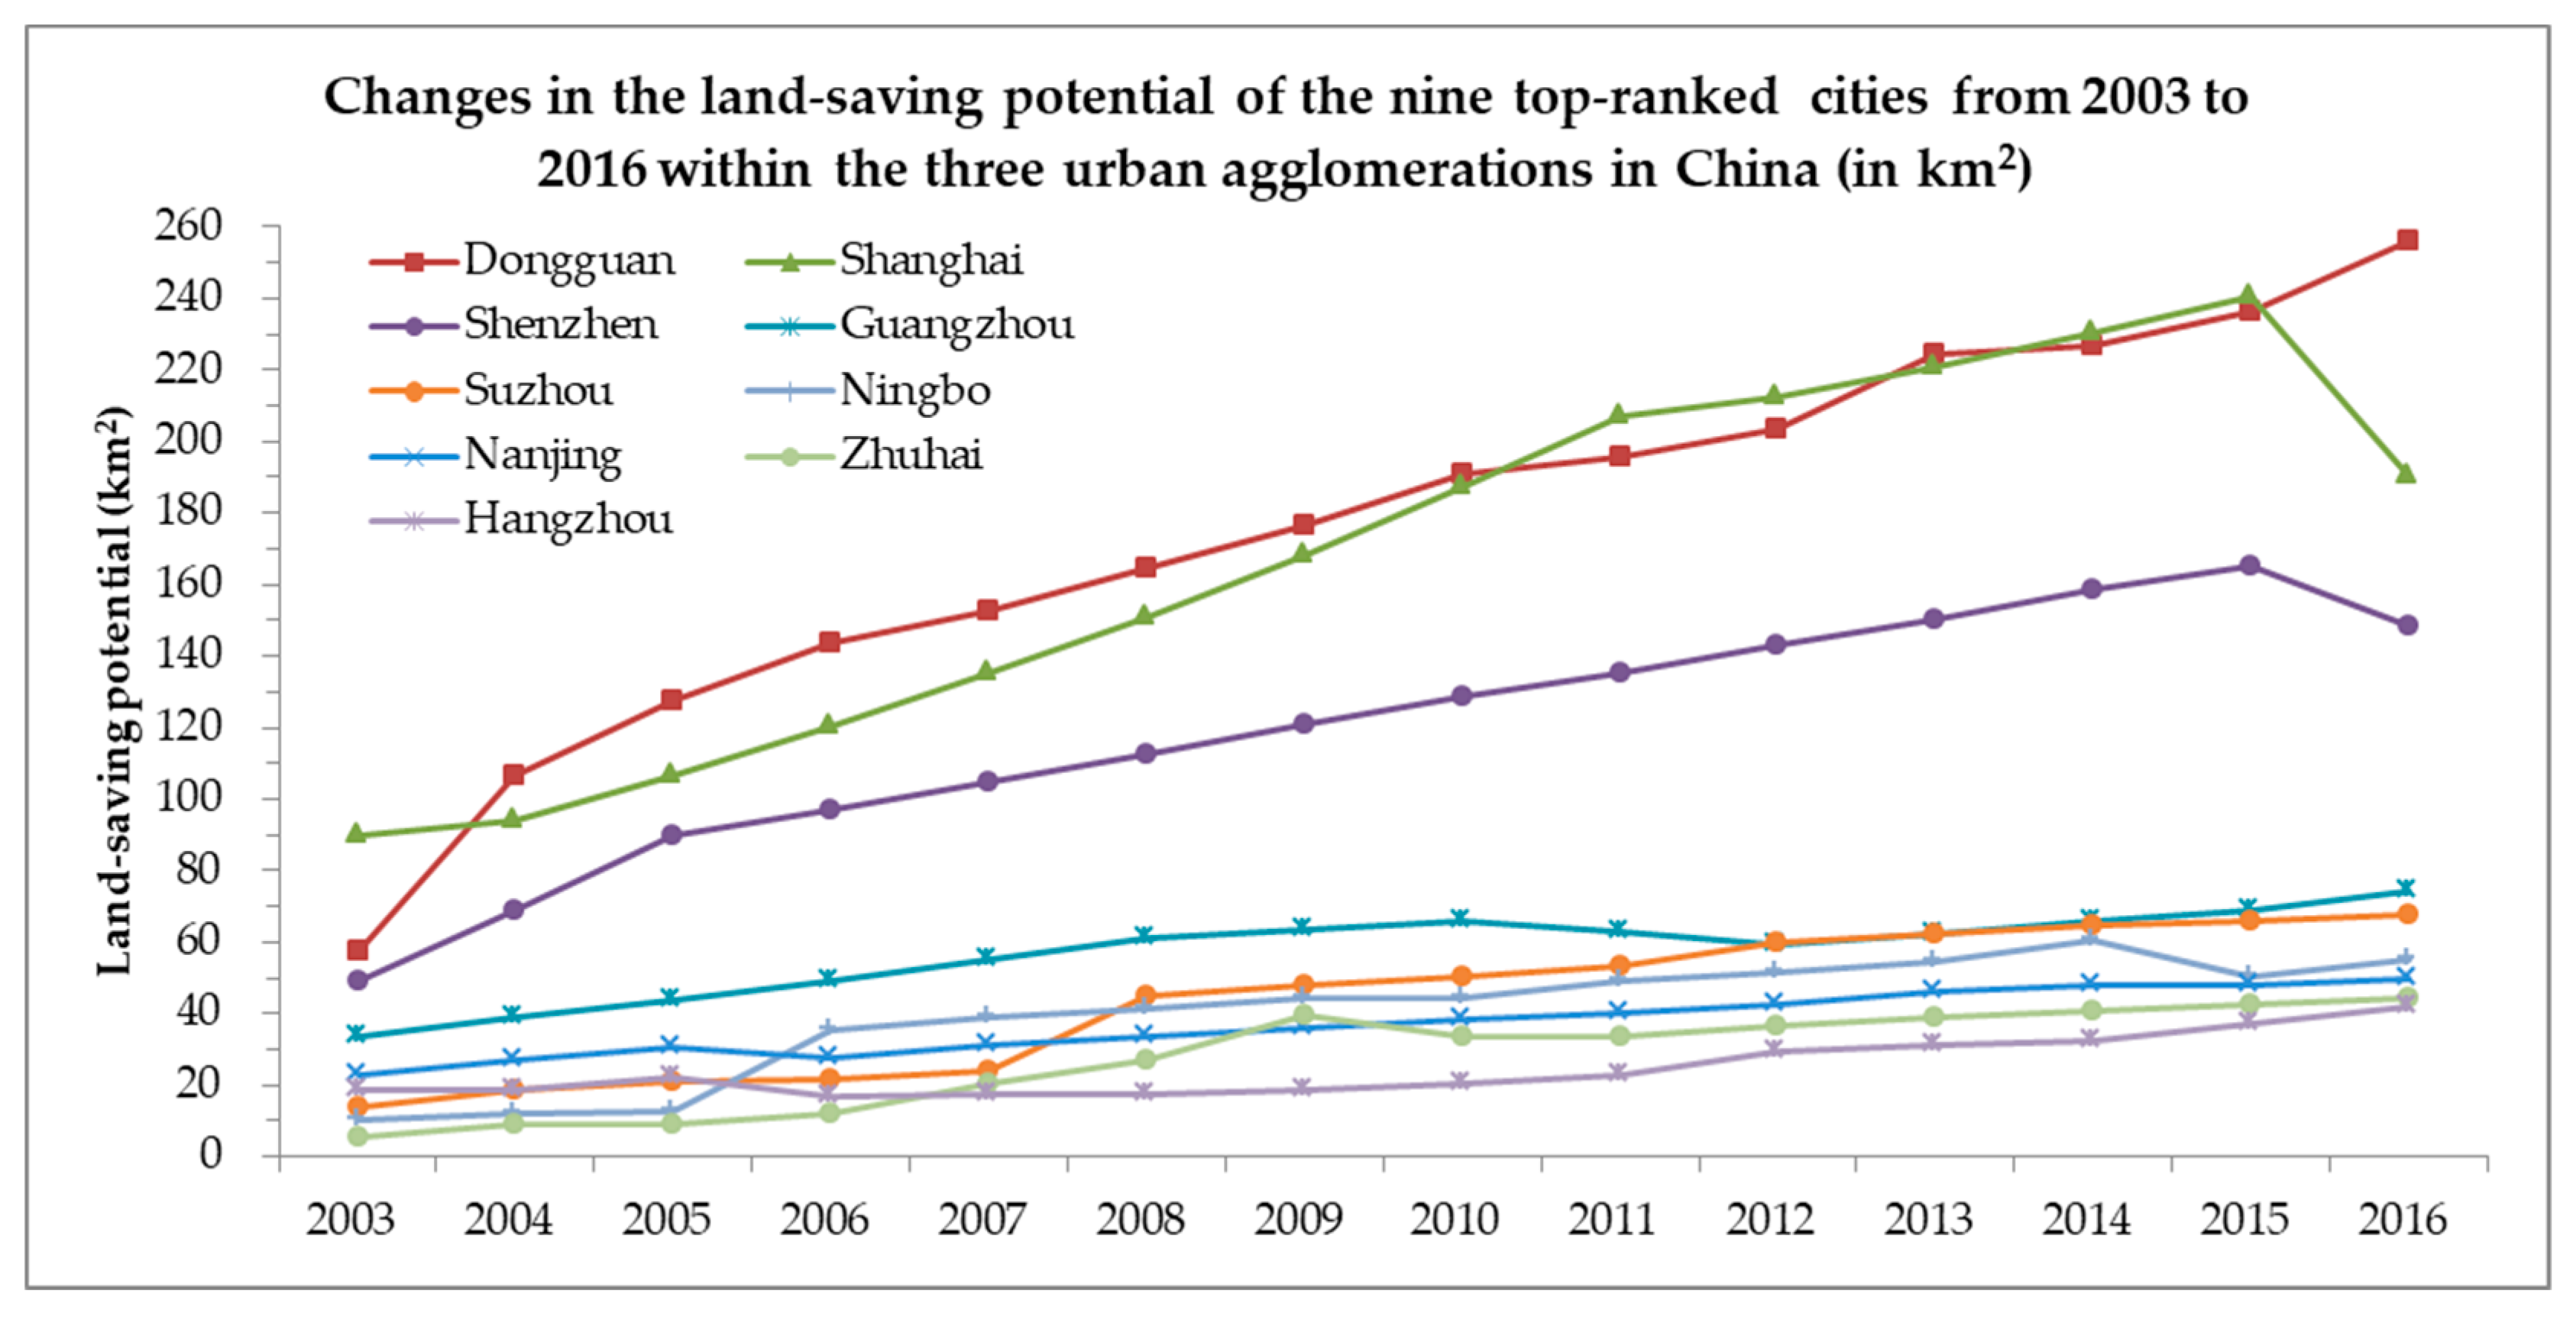
4.3. An analysis of Land-Saving Potential

Figure 3 depicts changes in the land-saving potential of UILU in China. As shown in Figure 3a, the land-saving potential of the three major urban agglomerations, considered collectively, gradually expanded from 445.88 km2 in 2003 to 1343.16 km2 in 2016, evidencing an average annual scale of 979.98 km2 and a net growth of 897.28 km2. However, the growth process of the individual urban agglomerations differed. Whereas the land-saving potential of the Beijing-Tianjin-Hebei region increased from 63.01 km2 in 2003 to 134.88 km2 in 2016, the growth rate was slow, and there was a slight decline in 2012. The land-saving potential of the Yangtze River Delta increased from 222.24 km2 in 2003 to 634.93 km2 in 2015 but then declined to 608.74 km2 in 2016. Finally, the land-saving potential of the Pearl River Delta increased continuously from 160.63 km2 in 2003 to 599.54 km2 in 2016, evidencing a trend of initial fast-paced growth that subsequently slowed down and then returned to a fast pace. The Beijing-Tianjin-Hebei region showed the lowest land-saving potential of the three urban agglomerations, with an average annual scale of 99.60 km2 (10.16% of the average annual land-saving potential of all three agglomerations). The Yangtze River Delta demonstrated the highest land-saving potential at an average annual increase of 445.57 km2 (45.47% of the total average annual scale). These figures indicated that China could save large amounts of urban industrial land through intensive exploitation, especially in the Yangtze and Pearl River Deltas. These results supported the conclusions of existing researches that for industrial land in China, there is a lot of redundancy [4,41], and the saving potential was rising [16]. On the whole, our findings revealed that existing policies and measures for managing the process of intensifying UILU in China are inadequate and require further strengthening.
As could be seen from Figure 3b–d, the industrial land-saving potential of different cities varied significantly. For example, in 2016, the industrial land-saving potentials of Dongguan, Shanghai, and Shenzhen were all above 145 km2, far exceeding those of other cities. The total land saving of these top three cities amounted to 594.43 km2, accounting for 44.26% of the total land saving 1343.16 km2. Guangzhou, Suzhou, Ningbo, Nanjing, Zhuhai, and Hangzhou also evidenced considerable industrial land-saving potential, with areas ranging between 40 km2 and 75 km2 and collectively amounting to 242.34 km2 or 24.85% of the total area. Wuxi, Changzhou, Shaoxing, Huizhou, Nantong, Baoding, and Taizhou evidenced moderate land-saving potentials, which ranged between 20 km2 and 40 km2 and collectively amounting to 171.30 km2 or 12.75% of the total area. These results highlighted the importance of introducing differentiated management measures to promote the intensification of UILU. Moreover, they indicated an urgent need for selected cities, such as Dongguan, Shanghai, and Shenzhen, to take the lead in introducing intensive exploitation of industrial land.
Figure 4, depicting the industrial land-saving potential in the top nine cities, revealed an increasing trend. Although there was a temporary decline in the industrial land-saving potential in some years, none of the declines had been sustained. The industrial land-saving potential of Shanghai and Shenzhen evidently decreased in 2016, and it remains to be seen whether this declining trend would continue. The industrial land-saving potential of Zhuhai, Guangzhou, and Ningbo decreased in certain years, but the decreasing trend all did not last. These results indicated that the situation regarding the intensive use of industrial land is unsatisfactory and has not been reversed.

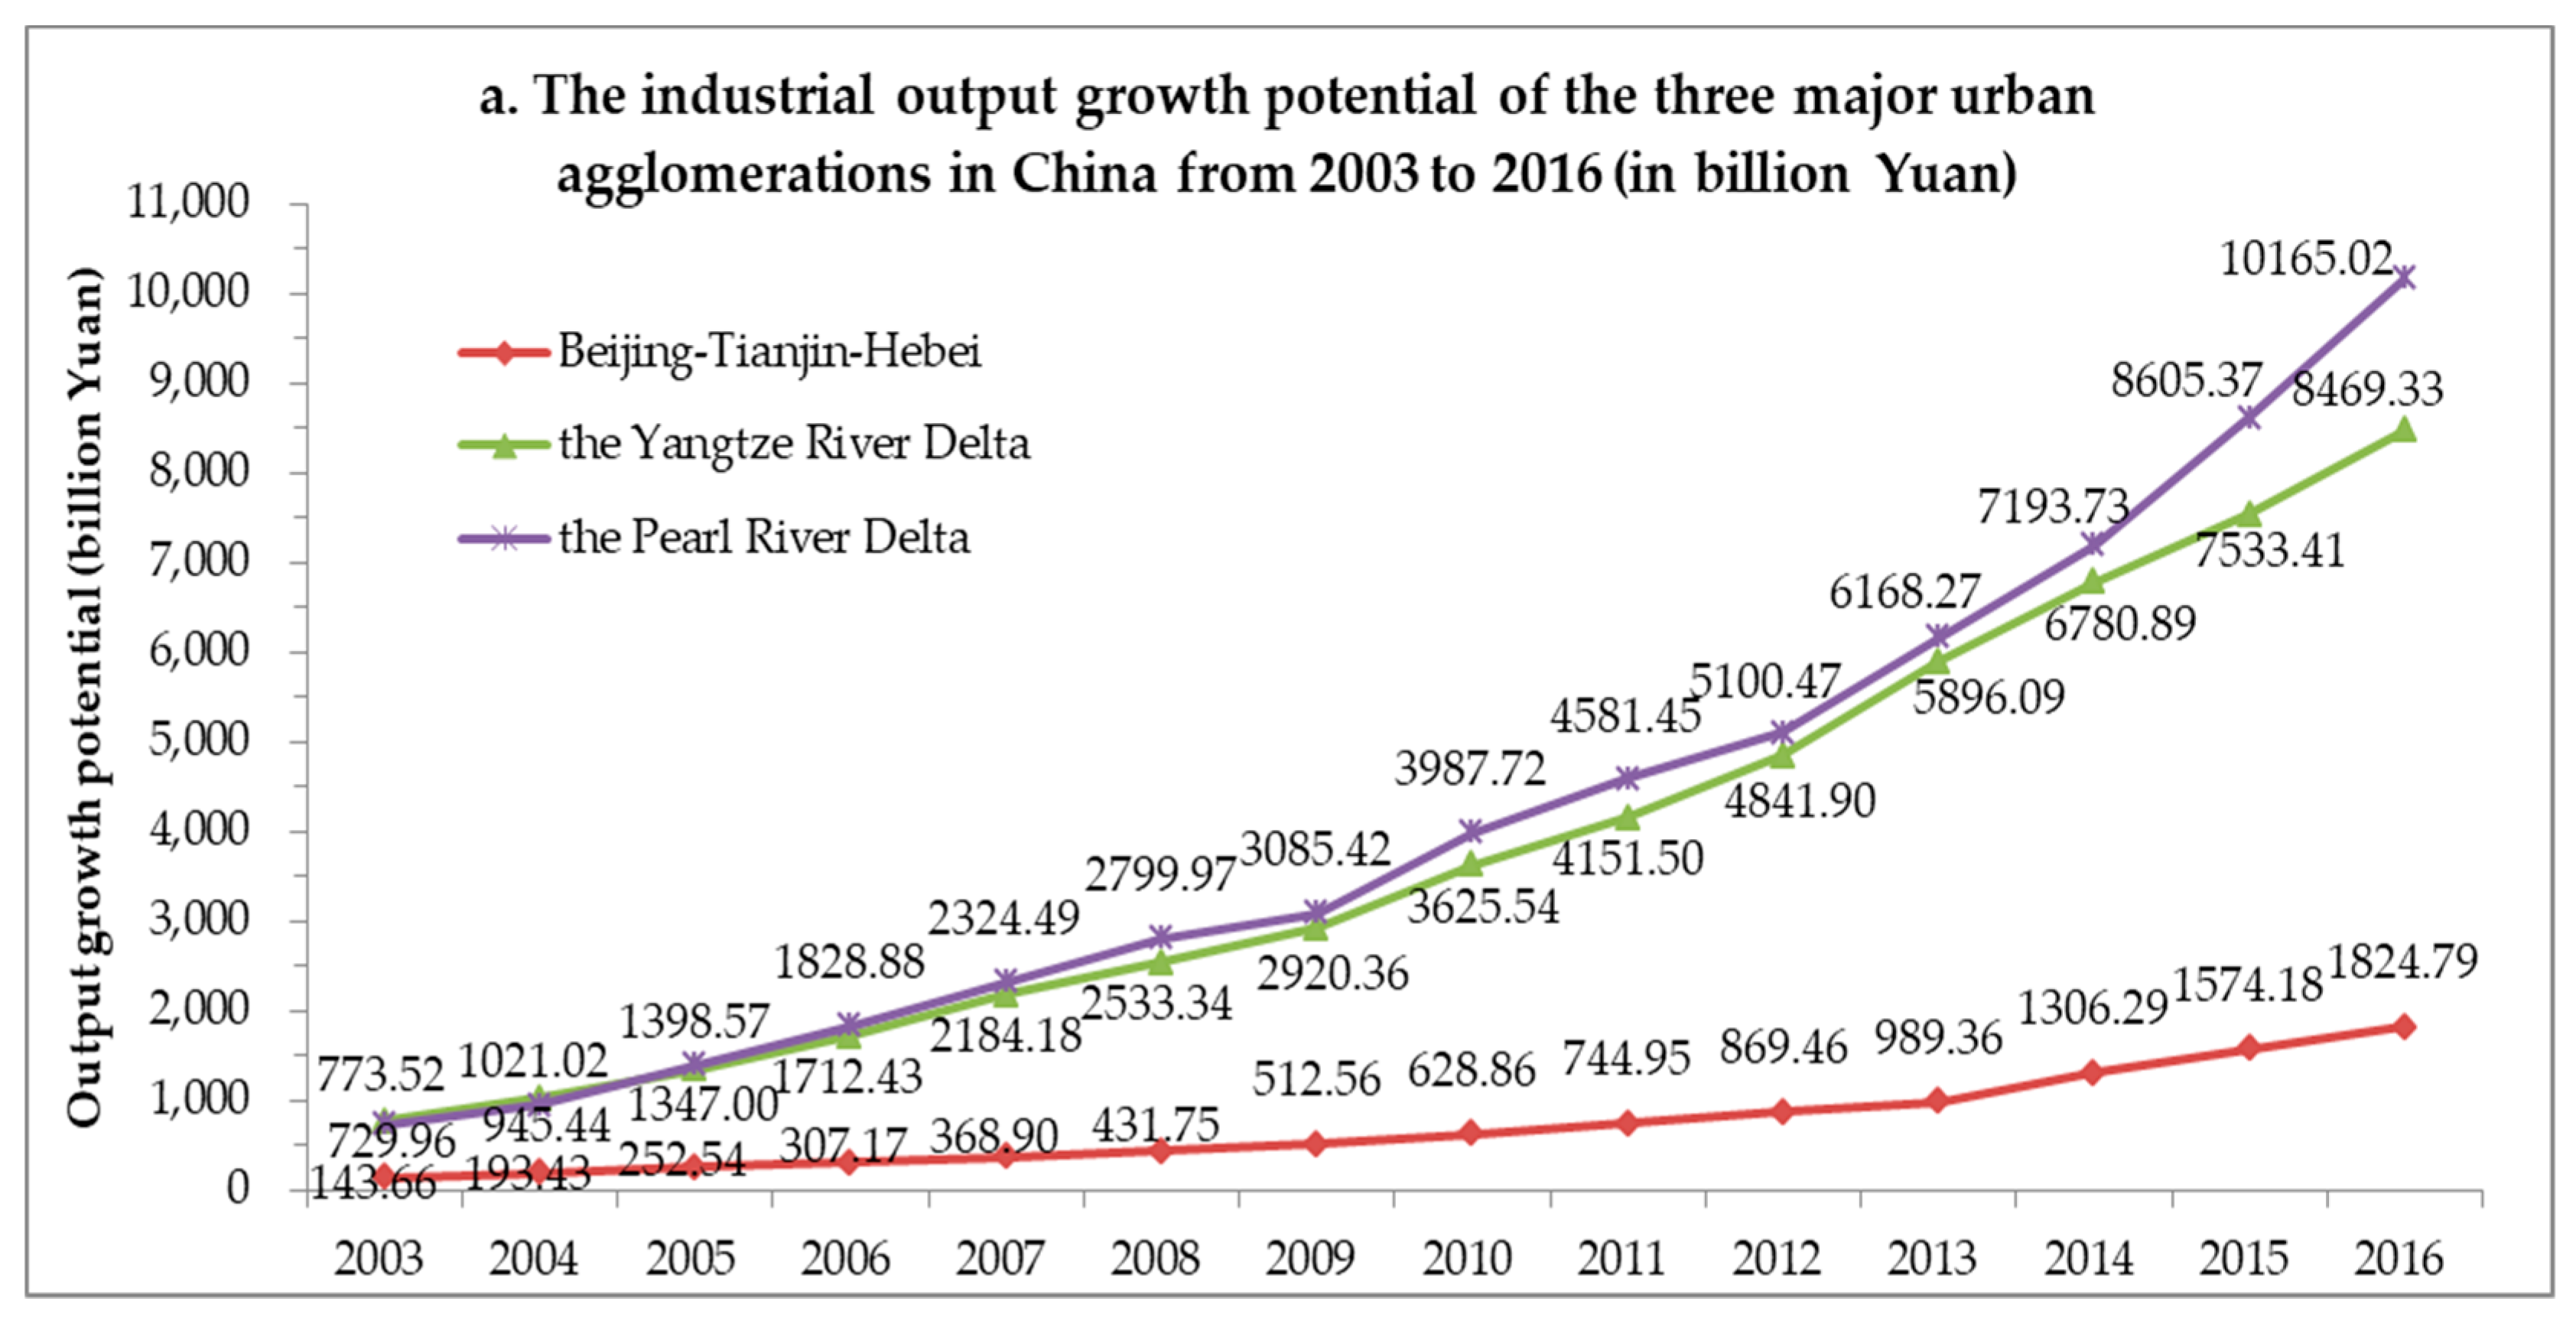
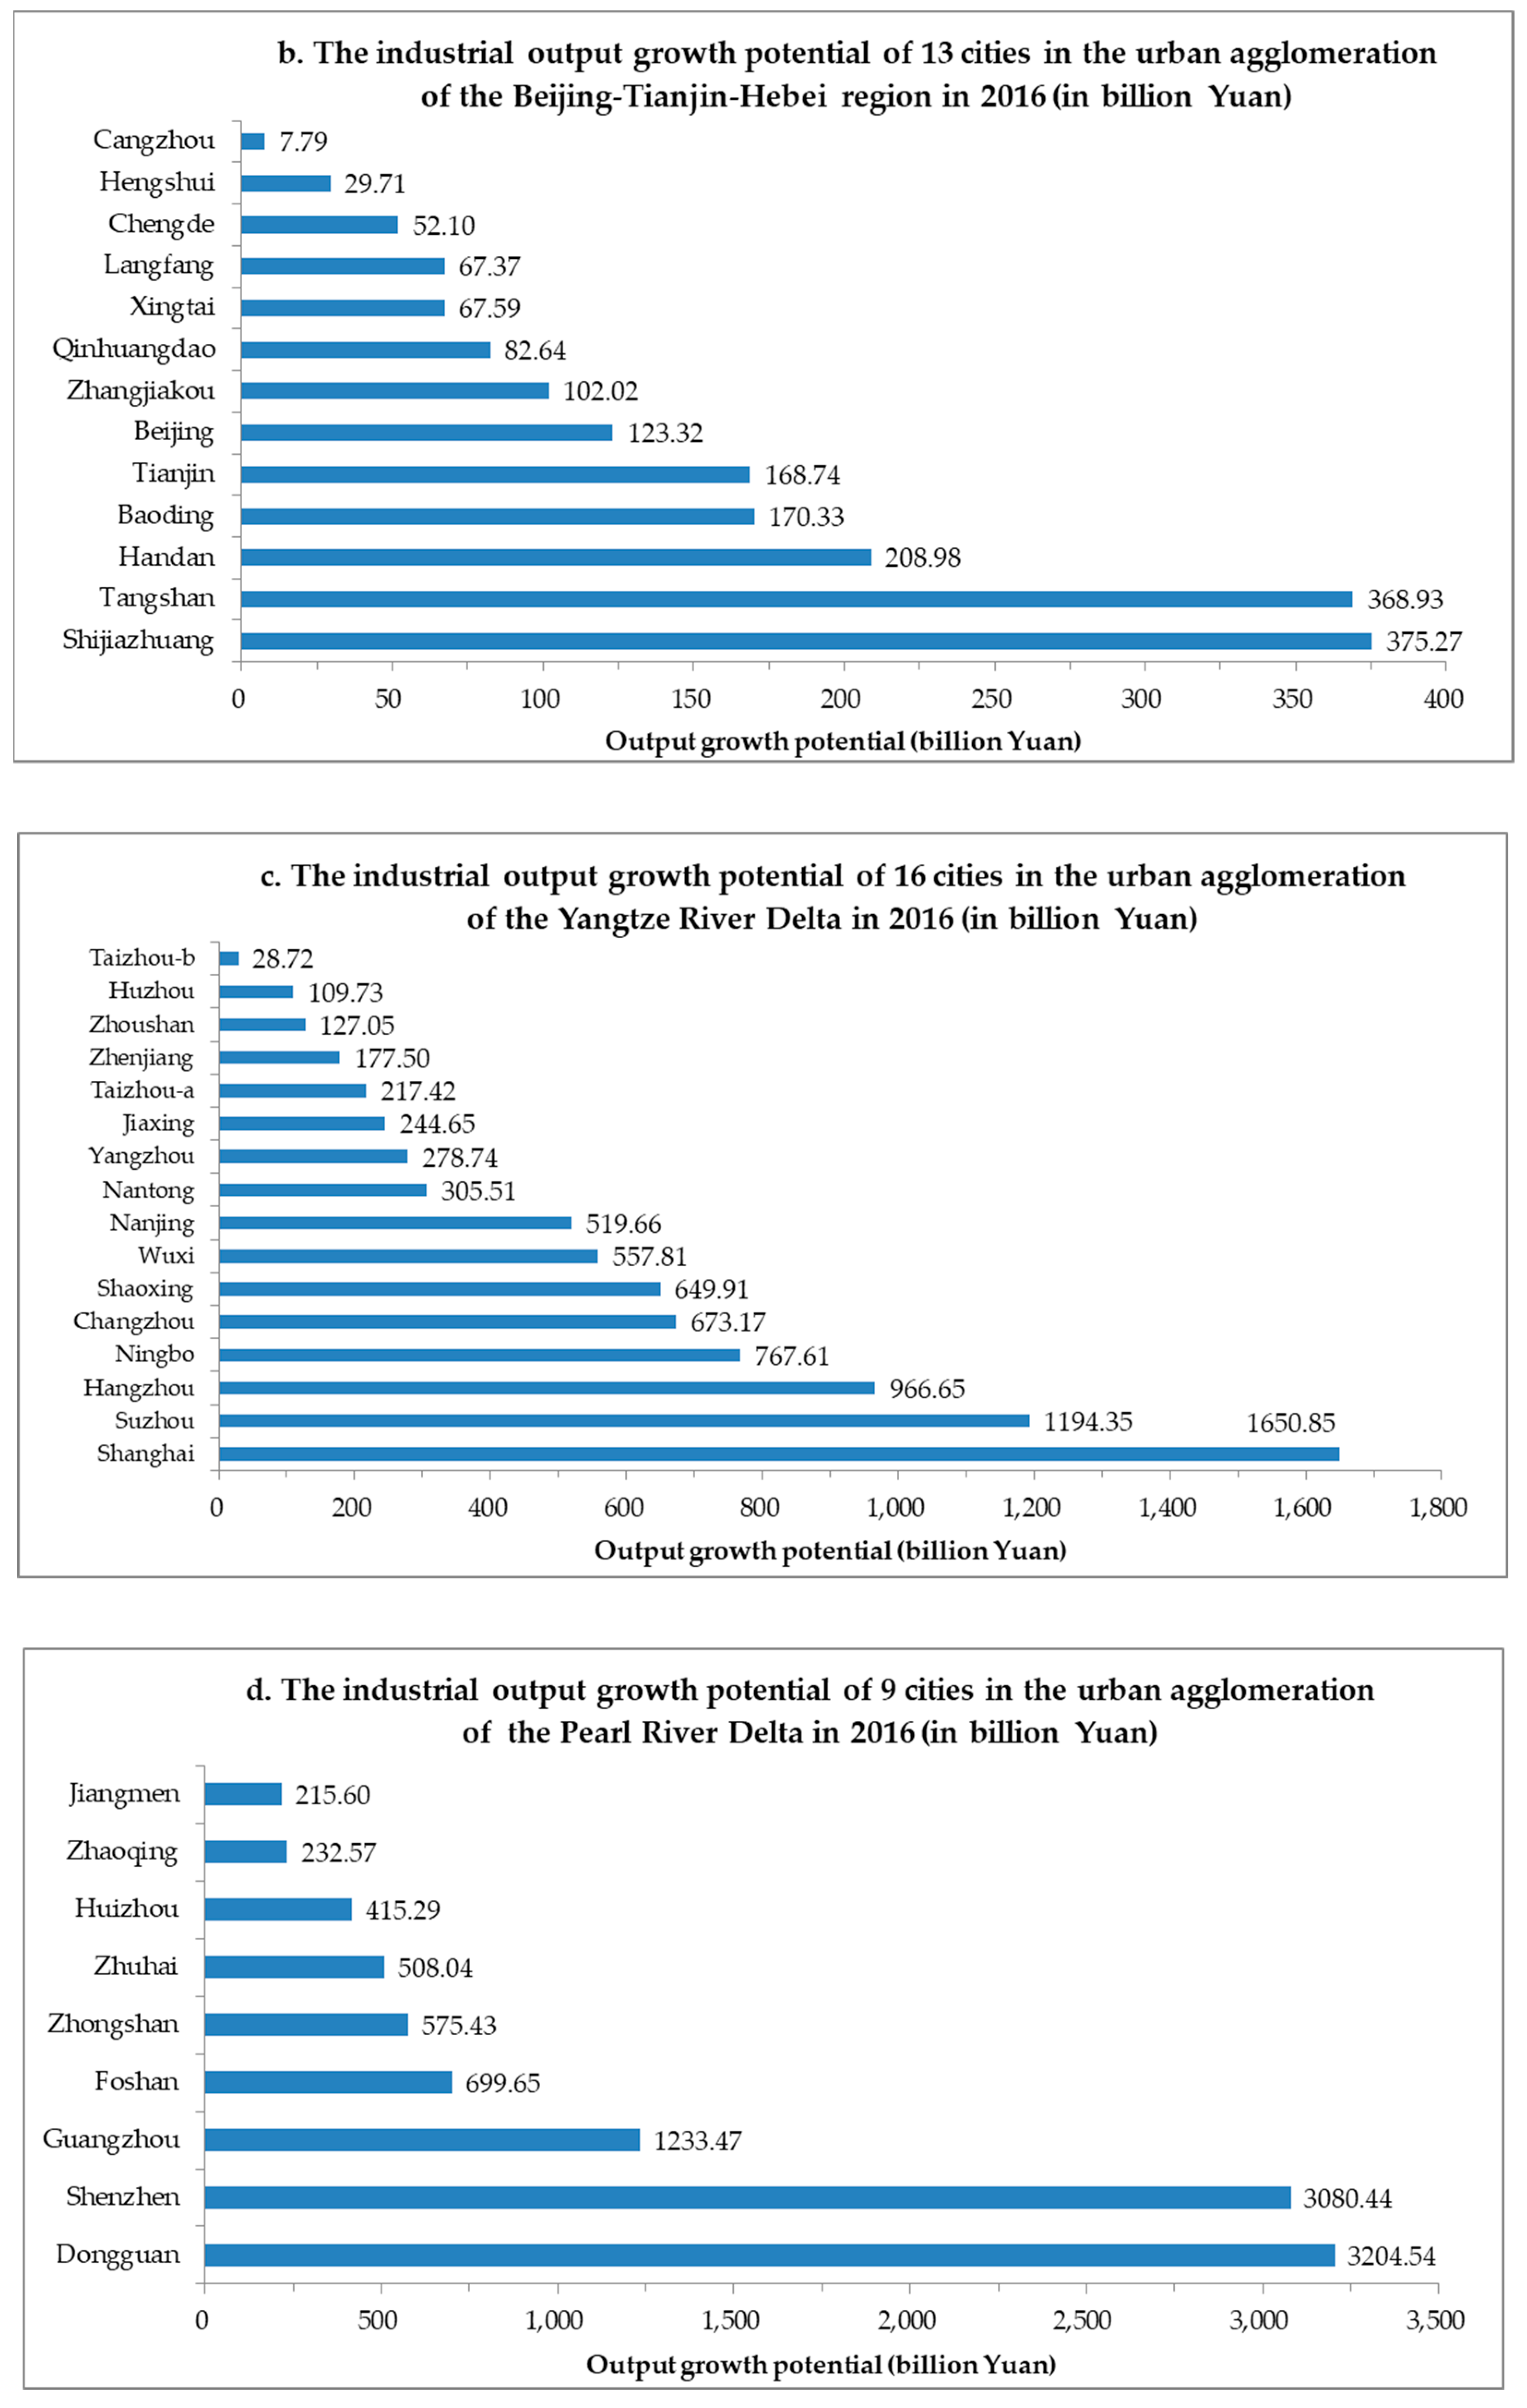
4.4. An Analysis of Output Growth Potential

Figure 5 shows changes in the output growth potential of UILU in China (at the constant price in 2003) during the period 2003–2016. Figure 5a revealed that the industrial output growth potential of the three major urban agglomerations in China continued to expand, rising from 1647.13 billion Yuan in 2003 to 20,459.15 billion Yuan in 2016, with an average annual growth of 8775.23 billion Yuan and a net expansion of 18,812.01 billion Yuan. The pace of increase in the output growth potential of the Beijing-Tianjin-Hebei urban agglomeration was considerably slower than that of the Yangtze River Delta, which was slightly slower than that of the Pearl River Delta. Specifically, the industrial output growth potentials of the Beijing-Tianjin-Hebei region, the Yangtze River Delta, and the Pearl River Delta, respectively, increased from 143.66 billion Yuan, 773.52 billion Yuan, and 729.96 billion Yuan in 2003 to 1824.79 billion Yuan, 8469.33 billion Yuan, and 10,165.02 billion Yuan in 2016. These figures indicated that intensive use of industrial land could result in a significant increase in industrial outputs, particularly in the Yangtze and Pearl River Deltas. They confirmed the necessity of promoting further intensive economic growth and reducing the consumption of land resources.
Figure 5b–d revealed that cities within the three urban agglomerations evidenced significant differences in their industrial output growth potentials. For example, in 2016, the two top-ranked cities were Dongguan and Shenzhen, whose industrial output growth potentials both exceeded 3000 billion Yuan, collectively generating 6284.98 billion Yuan or 30.72% of the total amount of 20,459.15 billion Yuan. The three cities of Shanghai, Guangzhou, and Suzhou ranked second, with industrial output growth potentials ranging between 1000 and 2000 billion Yuan, collectively generating 4078.67 billion Yuan or 19.94% of the total amount. Next in rank were the cities of Hangzhou, Ningbo, Foshan, Changzhou, Shaoxing, Zhongshan, Wuxi, Nanjing, and Zhuhai, all of which evidenced significant industrial output growth potentials that ranged between 500 and 1000 billion Yuan, collectively generating 5917.93 billion Yuan or 28.93% of the total amount. The industrial output growth potentials of the remaining 24 cities were all lower than 500 billion Yuan, collectively generating 4177.56 billion Yuan or 20.42% of the total sum. These figures suggested that a few key cities should be prioritized for tapping the potential for intensive use of industrial land.
As shown in Figure 6, the industrial output growth potentials of the eight top-ranked cities all evidenced a steady increase during the period 2003–2016. In particular, the industrial output growth potentials of the two top cities (Shenzhen and Dongguan) showed an accelerated rising trend. These findings further confirmed the urgent need to implement policies and measures to enhance the intensification of UILU in China.

5. Conclusions and Discussion

5.1. Conclusions

According to the inner conceptual connection existing between intensification potential and efficiency loss of UILU, we constructed quantitative models for evaluating the intensification potential (land saving and output growth) based on the application of the SFA method to calculate efficiency loss. We subsequently conducted an empirical investigation to measure and analyze the efficiency loss and intensification potential of UILU in 38 cities, constituting China’s three main urban agglomerations during the period 2003–2016. The main conclusions of this study are presented below.
First, our theoretical and methodological proposal for calculating potential land savings or output growth of UILU, defined in relation to efficiency loss, provided a solid basis for evaluating the intensification potential of UILU. Notably, we demonstrated that applying the SFA method to evaluate the intensification potential of UILU on the basis of measurements of the relative efficiency loss of UILU was both scientifically grounded and feasible.
Second, between 2003 and 2016, the efficiency loss of UILU in China’s three main urban agglomerations showed a steady increase from 22.48% in 2003 to 40.38% in 2016, with a net increase of 17.90 percentage points. Gaps in the efficiency loss of UILU gradually widened. The gap between the Beijing-Tianjin-Hebei urban agglomeration (demonstrating the lowest efficiency loss) and the Pearl River Delta urban agglomeration (with the highest efficiency loss) expanded from 18.48 percentage points in 2003 to 36.22 percentage points in 2016. Further, among the 38 cities, the gap between Tianjin (with the lowest efficiency loss) and Dongguan (with the highest efficiency loss) expanded from 42.35 percentage points in 2003 to 64.33 percentage points in 2016. Rankings of these cities in terms of efficiency loss of UILU remained largely stable, presenting a relatively fixed pattern. Tianjin, Taizhou-b (Taizhou in Jiangsu), Beijing, and Cangzhou were consistently ranked as the four cities with the lowest efficiency losses, while Dongguan, Taizhou-a (Taizhou in Zhejiang), Xingtai, and Jiaxing were consistently ranked as the four cities with the highest efficiency losses.
Third, during the period 2003–2016, the intensification potentials of UILU in the three major urban agglomerations in China were very high and showed a continuously increasing trend. The total industrial land-saving potential of all the 38 cities showed a trend of gradual expansion from 445.88 km2 in 2003 to 1343.16 km2 in 2016, with an average annual scale of 979.98 km2 and a net increase of 897.28 km2. The total industrial output growth potential of these cities also showed a trend of continuous expansion from 1647.13 billion Yuan in 2003 to 20,459.15 billion Yuan in 2016, with an average annual value of 8775.23 billion Yuan and a net growth of 18,812.01 billion Yuan. In 2016, of the three major urban agglomerations, the Yangtze River Delta demonstrated the greatest land-saving potential (608.74 km2), while the Pearl River Delta demonstrated the greatest output growth potential (10,165.02 billion Yuan). Of the 38 cities, Dongguan demonstrated the greatest land-saving potential and output growth potential, which were, respectively, 255.92 km2 and 3204.54 billion Yuan in 2016.
Last, the situation regarding the efficiency and intensification of UILU in China has not been favorable over the last 14 years and is evidently getting worse. The detrimental phenomenon of path-dependence and Matthew effect has always existed. Through UILU intensification, a considerable amount of land could be saved, or outputs could be increased, especially in the Yangtze and Pearl River Deltas. Thus, the implementation of much more effective policies and measures to promote intensification and reduce inefficiency is necessary and urgent. A few key cities, such as Dongguan, Shenzhen, and Shanghai, should be accorded high priority.

5.2. Discussion

Our research shows that UILU in China is still relatively inefficient and extensive. The existing policies and measures are imperfect and ineffective to some extent. The reasons behind this have not been eliminated, such as the market allocation mechanism of industrial land has not been sound enough, the external costs of industrial land use have not been well internalized, the incentives for intensive and efficient use of industrial land have not been well established, and the transformation of industry from extensive to intensive management is not enough. The adverse effects of inefficient and extensive use of industrial land have still existed on a large scale, such as excessive consumption of land resources, excessive occupation of high-quality arable land, shortage of commercial and residential land, slow industrial transformation and upgrading, and excessive discharge of environmental pollution. Better and effective policies and measures need to be formulated and implemented to improve efficiency and promote the intensification of UILU. It should be emphasized that the problems of low efficiency and extensive utilization of industry cannot be solved in isolation, but need to be solved in a broader perspective. Efficient and intensive use of industrial land must be placed and promoted in the transformation of economic growth mode from extensive to intensive, in the construction of resource-conserving and environment-friendly society, and in the promotion of healthy urbanization and sustainable urban development. It should follow the strategic requirements of China’s supply-side economic reform and high-quality development, implement China’s policy and plan to promote resource security and ecological civilization, and respond to the United Nations initiative on the 2030 Agenda for Sustainable Development and the New Urban Agenda.
Our research makes more scientific and accurate calculation and analysis of UILU efficiency loss and intensification potential. Several shortcomings of existing research on UILU efficiency and intensification have been overcome. Because the basic principles and methods are the same, and industrial land occupies a large part of urban land, our research would directly help to promote and deepen the study of urban land use. Because land is the basic bearing space of production and living in the city, our research also has important referential significance for the study of urban economic growth, urban planning and management, and sustainable cities. In fact, efficiency and intensification of urban land use are common themes in these areas, although sometimes the same concepts are not used. Intensive economic growth, sustainable economic growth, total factor productivity (TFP), urban sprawl, smart growth, growth management, compact city, sustainable urban development, and other various researches are more or less related to efficiency and intensification of urban land use. For instance, intensive use of urban land is the requirement and embodiment of the intensive growth of urban economics [37]. Intensive growth of urban economics is a city growth strategy based on the increase in output per unit of input (but not the expansion of inputs) [42], that is, the improvement in total factor productivity (TFP), while TFP is the key focus and the essential driver to sustainable economic development [43,44,45]. Again, for instance, the fast enlargement of urban areas, the decreasing density of urban population, the low-density development of urban land, and the dispersion of urban buildings are not only the important manifestations of extensive and inefficient use of urban land but also the main contents of urban sprawl [46,47,48]. The consequences of urban sprawl, such as excessive loss of arable land and recreation areas, lack of clearly defined open spaces, increasing reliance on the automobile, and the separation of residential and work locations [47,48], are all harmful to sustainable urban development. This is why smart growth and growth management are required, although this is necessary for improvement in policy formulation and implementation [49,50]. We propose to strengthen interdisciplinary communication and collaboration in these research areas with efficiency and intensification of urban land use at the core.
It should be pointed out that this study still has some shortcomings and defects. Based on this study, efforts may be made in the following aspects in the future, such as the environmental revisions to input and output data, the further decomposition of efficiency loss and intensification potential, the analysis of influential factors, the means to eliminate efficiency loss and exploit intensification potential, and the evaluation of the effect of specific policies or measures. It should also be noted that UILU efficiency and intensification are mainly about topics of resource and economy, although they are closely related to issues of environment and ecology. In order to achieve more comprehensive and sustainable development, it is not only necessary to improve UILU efficiency and promote its intensification but also need to improve environmental quality and ecological health at the same time. In the future, it would be necessary to pay more attention to the environmental and ecological management of UILU while continuing to deepen the study of UILU efficiency and intensification. In this regard, a good and feasible idea for UILU is to draw useful lessons from the research of environmental efficiency and sustainable intensification in agriculture [51,52,53,54], ensuring that UILU efficiency and intensification research is closely integrated with environmental and ecological research about UILU.

Author Contributions

X.W. conceptualized the idea, developed and validated the models, and wrote the manuscript; X.S. and T.P. gave suggestions for the writing and modification of this manuscript; Funding Acquisition, X.S. and T.P. All authors have read and agreed to the published version of the manuscript.

Funding

This research was funded by the National Natural Science Foundation of China, grant number 41590845 and 71904072.

Conflicts of Interest

The authors declare no conflict of interest.

References

  1. Shu, H.; Xiong, P.P. Reallocation planning of urban industrial land for structure optimization and emission reduction: A practical analysis of urban agglomeration in China’s Yangtze River Delta. Land Use Policy 2019, 81, 604–623. [Google Scholar] [CrossRef]
  2. Wu, Y.Z.; Zhang, X.L.; Skitmore, M.; Song, Y.; Hui, E.C. Industrial land price and its impact on urban growth: A Chinese case study. Land Use Policy 2014, 36, 199–209. [Google Scholar] [CrossRef] [Green Version]
  3. Yang, Q.J.; Zhuo, P.; Yang, J.D. Industrial land transfer and the bottom line competition to attract investment. Manag. World 2014, 30, 24–34. (In Chinese) [Google Scholar]
  4. Xie, H.L.; Wang, W. Spatiotemporal differences and convergence of urban industrial land use efficiency for China’s major economic zones. J. Geogr. Sci. 2015, 25, 1183–1198. [Google Scholar] [CrossRef]
  5. Zhao, X.F.; Zhang, L.; Huang, X.J.; Zhao, Y.T.; Zhang, Y.P. Evolution of the spatiotemporal pattern of urban industrial land use efficiency in China. Sustainability 2018, 10, 2174. [Google Scholar] [CrossRef] [Green Version]
  6. Lu, J.X.; Yu, L.L.; Chen, S.X. Industrial land conveyance, the investment quality race in the bottom line and environmental pollution. China Popul. Resour. Environ. 2017, 27, 90–98. (In Chinese) [Google Scholar]
  7. Luo, J. Studies on the Barriers and Mechanism of Industrial Land Intensive Use: A Stakeholder-Based Analysis. Ph.D. Thesis, Zhejiang University, Zhejiang, China, 2018; pp. 1–3, 15–21. (In Chinese). [Google Scholar]
  8. Tian, L. Land use dynamics driven by rural industrialization and land finance in the peri-urban areas of China: “The examples of Jiangyin and Shunde”. Land Use Policy 2015, 45, 117–127. [Google Scholar] [CrossRef]
  9. Wei, Y.D.; Ye, X. Urbanization, urban land expansion and environmental change in China. Stoch. Environ. Res. Risk Assess. 2014, 28, 757–765. [Google Scholar] [CrossRef]
  10. Zheng, S.Q.; Shi, Z. Land and housing markets under “land finance”: An analysis of local government behavior. Guangdong Soc. Sci. 2011, 2, 6–11. (In Chinese) [Google Scholar]
  11. Meng, Y.; Zhang, F.R.; An, P.L.; Dong, M.L.; Wang, Z.Y.; Zhao, T. Industrial land-use efficiency and planning in Shunyi, Beijing. Landsc. Urban Plan. 2008, 85, 40–48. [Google Scholar] [CrossRef]
  12. Tu, F.; Yu, X.; Ruan, J. Industrial land use efficiency under government intervention: Evidence from Hangzhou, China. Habitat Int. 2014, 43, 1–10. [Google Scholar] [CrossRef]
  13. Guo, G.; Wen, Q. Industrial land productivity research under the environmental restriction based on unexpected outputs of 33 typical cities in China. China Popul. Resour. Environ. 2014, 24, 121–127. (In Chinese) [Google Scholar]
  14. Zhang, L.; Wang, Y.H.; Li, Y. Research on industrial land production efficiency from a TFP perspective: Based on Malmquist index method. J. Dalian Univ. Technol. (Soc. Sci.) 2015, 36, 57–62. (In Chinese) [Google Scholar]
  15. Chen, W.; Chen, W.J.; Ning, S.Y.; Liu, E.; Zhou, X.; Wang, Y.N.; Zhao, M.J. Exploring the industrial land use efficiency of China’s resource-based cities. Cities 2019, 93, 215–223. [Google Scholar] [CrossRef]
  16. Xie, H.L.; Chen, Q.R.; Lu, F.C.; Wu, Q.; Wang, W. Spatial-temporal disparities, saving potential and influential factors of industrial land use efficiency: A case study in urban agglomeration in the middle reaches of the Yangtze River. Land Use Policy 2018, 75, 518–529. [Google Scholar] [CrossRef]
  17. Xie, H.L.; Chen, Q.R.; Lu, F.C.; Wang, W.; Yao, G.R.; Yu, J.L. Spatial-temporal disparities and influencing factors of total-factor green use efficiency of industrial land in China. J. Clean. Prod. 2019, 207, 1047–1058. [Google Scholar] [CrossRef]
  18. Zhen, J.H.; Cheng, S.; Guo, Y.C.; Zhang, M. Studies on the assessment for land use intensification potentiality of industrial field in Baotou city. Econ. Geogr. 2004, 24, 250–253. (In Chinese) [Google Scholar]
  19. Tan, D.; Huang, X.J. Influencing factors of the levels of intensive use of typical industrial land. China Popul. Resour. Environ. 2008, 18, 54–57. [Google Scholar]
  20. Guo, G.C.; Ren, B.L.; Wu, Q. Study on assessment on intensive use of industrial land based on ArcGIS in Jintan City, Jiangsu Province. China Land Sci. 2009, 23, 250–253. (In Chinese) [Google Scholar]
  21. Chen, Y.; Chen, Y.R.; Ma, W.B. Colligation evaluation of industrial land intensive use in Hubei Province based on 365 valid questionnaires of typical industrial enterprises. J. Nat. Resour. 2013, 28, 73–80. (In Chinese) [Google Scholar]
  22. Meng, P.; Hao, J.M.; Zhou, N.; Shuang, W.Y.; Hong, S.M. Research on evaluation of industrial land intensive use in the context of new urbanization: A case study in Yizhuang New Town. China Land Sci. 2014, 28, 250–253. (In Chinese) [Google Scholar]
  23. Huang, D.Q.; Hong, L.X.; Liang, J.S. Analysis and evaluation of industrial land efficiency and intensive use in Fujian Province. Acta Geogr. Sin. 2009, 64, 479–486. (In Chinese) [Google Scholar]
  24. Wang, X.D.; Liu, X.Q.; Pei, T.; Wang, Z.B. Potential evaluation of urban land intensive use in the Beijing-Tianjin-Hebei region based on measurement of technical efficiency. Acta Geogr. Sin. 2019, 74, 1853–1865. (In Chinese) [Google Scholar]
  25. Wang, L.J.; Li, H.; Shi, C. Urban land-use efficiency, spatial spillover, and determinants in China. Acta Geogr. Sin. 2015, 70, 1788–1799. (In Chinese) [Google Scholar]
  26. Jin, G.; Deng, X.Z.; Zhao, X.D.; Guo, B.S.; Yang, J. Spatio-temporal patterns of urban land use efficiency in the Yangtze River Economic Zone during 2005–2014. Acta Geogr. Sin. 2018, 73, 1242–1252. (In Chinese) [Google Scholar]
  27. Farrell, M.J. The measurement of productive efficiency. J. R. Stat. Soc. Ser. A (Gen.) 1957, 120, 253–290. [Google Scholar] [CrossRef]
  28. Kopp, R.J. The measurement of productive efficiency: A reconsideration. Quart. J. Econ. 1981, 96, 477–503. [Google Scholar] [CrossRef]
  29. Christenson, A.L. Maximizing clarity in economic terminology. Am. Antiq. 1982, 47, 419–426. [Google Scholar] [CrossRef]
  30. Battese, G.E.; Coelli, T.J. Frontier production functions, technical efficiency and panel data: With application to paddy farmers in India. J. Prod. Anal. 1992, 3, 153–169. [Google Scholar] [CrossRef]
  31. Iglesias, G.; Castellanos, P.; Seijas, A. Measurement of productive efficiency with frontier methods: A case study for wind farms. Energy Econ. 2010, 32, 1199–1208. [Google Scholar] [CrossRef]
  32. Xie, Y. Regression Analysis; Social Science Academic Press: Beijing, China, 2013; pp. 217–221. (In Chinese) [Google Scholar]
  33. Kornai, J. The Socialist System: The Political Economy of Socialism; Oxford University Press: Oxford, UK, 1992; pp. 180–186. [Google Scholar]
  34. Chen, X.Z.; Li, B.T. Quantitative analysis of economic intensive development. Technol. Econ. 1995, 12, 46–48. (In Chinese) [Google Scholar]
  35. Wu, J.L. How to achieve the change of economic growth pattern: For the 40th anniversary of Economic Research. Econ. Res. 1995, 4, 8–12. (In Chinese) [Google Scholar]
  36. Wu, J.Q. Extensification, intensification and their measurement—For accurate understanding of the transformation of economic growth mode. Hebei Acad. J. 1996, 4, 7–11. (In Chinese) [Google Scholar]
  37. Wang, X.D.; Gong, J. The empirical research on process evaluation of land intensive use in China. Econ. Geogr. 2016, 36, 17–25. (In Chinese) [Google Scholar]
  38. Wang, X.D.; Shen, X.Q.; Wang, Z.B.; Liu, X.Q. Dynamic evaluation of farmland intensive use in 2010–2016 in China. China Popul. Resour. Environ. 2019, 29, 58–67. (In Chinese) [Google Scholar]
  39. Guo, G.C.; Xiong, Q. Study on the urban industrial land use efficiency and its influencing factors in China. China Land Sci. 2014, 28, 45–52. (In Chinese) [Google Scholar]
  40. Luo, N.S.; Peng, Y. The Space-time analysis of urban industrial land use and the effects of the local government competition in China. China Land Sci. 2016, 30, 62–71. (In Chinese) [Google Scholar]
  41. Xiong, Q.; Guo, G.C. Productive efficiency of regional urban industrial land in China. Resour. Sci. 2013, 35, 910–917. (In Chinese) [Google Scholar]
  42. Irmen, A. Extensive and intensive growth in a neoclassical framework. J. Econ. Dyn. Contr. 2005, 29, 1427–1448. [Google Scholar] [CrossRef]
  43. Young, A. The tyranny of numbers: Confronting the statistical realities of the East Asian growth experience. Quart. J. Econ. 1995, 110, 641–680. [Google Scholar] [CrossRef] [Green Version]
  44. Zheng, J.; Bigsten, A.; Hu, A. Can China’s growth be sustained? A productivity perspective. World Dev. 2009, 37, 874–888. [Google Scholar] [CrossRef] [Green Version]
  45. Senhadji, A. Sources of economic growth: An extensive growth accounting exercise. IMF Staff Pap. 2000, 47, 129–157. [Google Scholar] [CrossRef]
  46. Galster, G.; Hanson, R.; Ratcliffe, M.R.; Wolman, H.; Coleman, S.; Freihage, J. Wrestling sprawl to the ground: Defining and measuring an elusive concept. Hous. Policy Debate 2001, 12, 681–717. [Google Scholar] [CrossRef]
  47. Nechyba, T.J.; Walsh, R.P. Urban sprawl. J. Econ. Pers. 2004, 18, 177–200. [Google Scholar] [CrossRef] [Green Version]
  48. Jaeger, J.A.; Bertiller, R.; Schwick, C.; Kienast, F. Suitability criteria for measures of urban sprawl. Ecol. Indic. 2010, 10, 397–406. [Google Scholar] [CrossRef]
  49. Tregoning, H.; Agyeman, J.; Shenot, C. Sprawl, smart growth and sustainability. Local Environ. 2002, 7, 341–347. [Google Scholar] [CrossRef]
  50. Anthony, J. Do state growth management regulations reduce sprawl? Urban Aff. Rev. 2004, 39, 376–397. [Google Scholar] [CrossRef]
  51. Moreau, P.; Ruiz, L.; Mabon, F.; Raimbault, T.; Durand, P.; Delaby, L.; Devienne, S.; Vertès, F. Reconciling technical, economic and environmental efficiency of farming systems in vulnerable areas. Agric. Ecosyst. Environ. 2012, 147, 89–99. [Google Scholar] [CrossRef]
  52. Reinhard, S.; Lovell, C.K.; Thijssen, G.J. Environmental efficiency with multiple environmentally detrimental variables; estimated with SFA and DEA. Eur. J. Oper. Res. 2000, 121, 287–303. [Google Scholar] [CrossRef]
  53. Rockström, J.; Williams, J.; Daily, G.; Noble, A.; Matthews, N.; Gordon, L.; Wetterstrand, H.; DeClerck, F.; Shah, M.; Steduto, P.; et al. Sustainable intensification of agriculture for human prosperity and global sustainability. Ambio 2017, 46, 4–17. [Google Scholar] [CrossRef] [Green Version]
  54. Tilman, D.; Balzer, C.; Hill, J.; Befort, B.L. Global food demand and the sustainable intensification of agriculture. Proc. Natl. Acad. Sci. USA 2011, 108, 20260–20264. [Google Scholar] [CrossRef] [PubMed] [Green Version]
Figure 1. Changes in efficiency losses of urban industrial land use (UILU) in three major urban agglomerations in China. Notes: (a) depicts the average annual efficiency loss of the urban agglomeration as a whole, while (bd) respectively depict the annual efficiency loss of each city within each of the three urban agglomerations.
Sustainability 12 01645 g001aSustainability 12 01645 g001b
Figure 2. Cities graded by efficiency loss of UILU in three major urban agglomerations in China. Notes: (ac) respectively depict the efficiency loss grade of each city within each of the three urban agglomerations.
Sustainability 12 01645 g002
Figure 3. Industrial land-saving potential in three major urban agglomerations in China. Notes: (a) depicts the annual industrial land-saving potential of the urban agglomeration as a whole, while (bd) respectively depict the industrial land-saving potential of each city within each of the three urban agglomerations in 2016.
Sustainability 12 01645 g003aSustainability 12 01645 g003b
Figure 4. The land-saving potential of the nine top-ranked cities.
Sustainability 12 01645 g004
Figure 5. The output growth potential of the three major urban agglomerations in China. Notes: (a) depicts the annual industrial output growth potential of the urban agglomeration as a whole, while (bd) respectively depict the industrial output growth potential of each city within each of the three urban agglomerations in 2016.
Sustainability 12 01645 g005aSustainability 12 01645 g005b
Figure 6. The output growth potential of the eight top-ranked cities.
Sustainability 12 01645 g006
Table 1. Statistical data for the three major urban agglomerations in China in 2016.
RegionLand Area (in 10,000 km2)Population (in 10,000s) Population Density (people/km2)Urbanization Rate (%)GDP (108 Yuan)Industrial Added Value (108 Yuan)
Nationwide960138,27114457.35744,127.20247,860.10
Beijing-Tianjin-HebeiNumber21.6011,205.0751963.8875,624.9424,219.29
Proportion (%)2.258.10 10.169.77
The Yangtze River DeltaNumber11.3011,085.0298174.15124,369.4346,734.02
Proportion (%)1.188.02 16.7118.85
The Pearl River DeltaNumber5.485998.49109584.8567,841.8526,870.03
Proportion (%)0.574.34 9.1210.84
TotalNumber38.3728,288.5873772.35267,836.2297,823.34
Proportion (%)420.46 35.9939.47
Table 2. Descriptive information of urban industrial land use (UILU) in the study area during 2003–2016.
StatisticIndustrial Land Area (km2)Industrial Output Value (10 billion Yuan)Industrial Assets Balance (10 billion Yuan)Industrial Employees (in 10,000s)Industrial Electricity Consumption (108 kw/h)Industrial Water Consumption (106 /m3)
Current PriceConstant PriceCurrent PriceConstant Price
Average78.40 47.0742.8012.78 8.95 60.57147.95153.23
Standard Error5.20 2.722.600.73 0.51 3.237.038.73
Median32.76 18.3716.695.56 4.05 27.1472.9168.38
Standard Deviation119.88 62.7359.9616.94 11.87 74.59162.10201.28
Kurtosis11.99 5.056.126.31 7.00 3.823.017.84
Skewness3.19 2.212.392.45 2.52 1.991.742.54
Minimum2.07 0.800.800.32 0.18 2.123.592.24
Maximum744.60 320.14316.8191.92 69.13 376.18805.761267.66
Confidence (95%)10.21 5.345.111.44 1.01 6.3513.8117.14
Table 3. Results of estimations using different stochastic frontier production models.
ParametersModel 1Model 2Model 3Model 4Model 5
β 0 0.7130 ***−0.00042.6864 ***−2.3944 ***−2.4713(−3.9809) ***
β 1 0.2710 ***0.2486 ***0.5591 **1.3403 ***1.2392(5.7556) ***
β 2 0.6548 ***0.6477 ***0.1319−0.9629 ***−0.7053(−3.2617) ***
β 3 0.1155 ***0.0906 ***0.32990.9786 ***0.9227(6.6637) ***
β 4 −0.0716 **−0.0246−0.9607 ***−0.0927−0.0170(−0.1430)
β t 0.0780*** 0.1975 ***0.1777(10.4372) ***
β 11 0.3535 ***0.2521 ***0.1445(2.9507) ***
β 22 0.4435 ***0.3211 **0.2245(3.1770) *
β 33 0.06830.0082
β 44 0.2533 ***0.0636
β t t −0.0059 ***−0.0056(−4.8972) ***
β 12 −0.0994−0.1000
β 13 −0.1043 *−0.1711 ***−0.1985(−6.1097) ***
β 14 −0.1554 ***−0.1390 ***−0.0806(−2.4103) ***
β 23 −0.1255 *−0.0066
β 24 −0.00330.2005 ***0.1186(3.3217) ***
β 34 0.0507−0.0396
β 1 t 0.0076
β 2 t −0.0250 *−0.0172(−3.0789) ***
β 3 t 0.0032
β 4 t −0.0078
β d 1 −0.1853 ***−0.2251 ***−0.1357 **−0.1829 ***−0.2532(−5.7133) ***
β d 2 0.00710.04170.1070 **0.0584
σ 2 0.0413 ***0.0800 **0.0377 ***0.0765 ***0.0819(8.9905) ***
γ 0.3452 ***0.6791 ***0.3988 ***0.7828 ***0.7990(24.6018) ***
μ 0.2388 ***0.4662 ***0.2452 ***0.4893 ***0.5115(8.0532) ***
η 0.0767 ***−0.1382 ***0.0917 ***−0.0496 ***−0.0529(−5.2929) ***
Log Likelihood Function130.7573182.2384165.2274271.5682267.5424
Likelihood Ratio Test of the One-Sided Error200.8346 ***250.7603 ***237.9046 ***342.1148 ***350.1584 ***
Note: See Equation (6) for the variables corresponding to each parameter. ***, **, and * indicate statistical significance at 0.01, 0.05, and 0.10, respectively. The values in parentheses denote t-test statistics.

