1. Introduction
In this era of rapid economic development, the safety and reliability of a water supply network, as the urban infrastructure, is considered the basis for normal operation of cities and communities. After an earthquake, the effective operations of medical, fire, and other systems depend on the water supply network system. Therefore, it is of great social and practical significance to study the reliability of the urban water supply network after earthquakes. It would not only assist in reducing the damages from the secondary disasters, but also improve the earthquake relief capacity.
There is much research on the reliability of the urban water supply network by domestic and foreign scholars [
1,
2]. The methods used in this research can be divided into three categories of methods: analytics, simulation, and agency [
3]. In the analytics method, a failure enumeration is used to select the state, first. Next, the reliability index is calculated by using mathematical derivation. The mostly used analytics methods include the state enumeration method [
4], the objective programming method [
5], minimum cut set method [
6,
7,
8], the first-order and second-order matrix methods [
9], etc. The simulation method uses static simulation or the dynamic delay simulation method to simulate the system under a variety of specified working conditions, investigate the pipe network’s ability to meet the demand, and test the reliability of the water supply network. The commonly used simulation methods include the Monte Carlo method [
10], the quasi-Monte Carlo method [
11], and so on. The agency methods do not directly test the reliability of the pipe network, but use the appropriate agency model to test the reliability [
12]. The agency methods include information entropy [
13,
14], flow entropy [
15], the path entropy method [
16], and the recoverable index method [
17]. Many academics and researchers used a combination of reliability methods in their studies. For example, Deng et al. [
18] proposed a system reliability solution method for a water supply pipe network by combining analytics methods and simulation methods, while calculating path importance and connectivity ratio. The simulation methods can simulate and perform hydraulic analysis under various working conditions. However, this method requires many rounds of hydraulic calculation to reach the results. In addition, the agency method models are simple and easy to program and calculate, but they lack the source of certainty.
This study combined the advantages of simulation methods and agency methods, and used Monte Carlo stochastic simulation to obtain the hydraulic analysis of the water supply network after earthquakes, based on the pressure drive node water demand model. Surplus power entropy was taken as the reliability evaluation index of the water supply network. On the basis of solving the entropy value, the paper developed the structural optimization scheme framework of the water supply network after earthquakes. The purpose of this study is to analyze the characteristics of surplus power entropy data of the post-earthquake pipe network and its feasibility as a reliability index. In addition, the network entropy value was taken as constraint condition, and the reliability improvement of the network was taken as goal. The reliability of network can be improved by improving the reliability of a single node in different ways. This provided theoretical support for the reliability improvement strategy by proposing multi-mode combination and multi-node promotion, taking the network entropy value as network operation index, and taking the reliability as result index. The established model was applied to a small pipe network example to calculate and analyze the entropy value, put forward the reliability improvement scheme, and make a comparative analysis, before and after. This paper consists of four sections.
Section 1 is the introduction. The second section introduces the surplus power entropy solution method based on the Pressure Drive Demand (PDD) model. The third section applies the method to an example, makes a comparative analysis of the results, puts forward a reliability improvement scheme, and analyzes the changes, before and after. The fourth section is the research conclusion and the future research direction.
2. The Basic Theory of Surplus Power Entropy
In the 1860s, the famous German physicist, R. Clausius, first proposed entropy as a concept of thermodynamics. Entropy was used to compare the direction of change in a system under different states. In 1948, Shannon introduced entropy into the information theory and proposed the concept of information entropy. It extended the use of the concept of entropy into information theories, management theories, and other disciplinary areas. With the expansion of the application field of information entropy, Awumah et al. [
19] first applied information entropy to the reliability analysis of the water supply pipe network system. Nodal flow entropy and system flow entropy indexes are proposed to measure the uncertainty of path selection and pipe network redundancy [
20].
He [
21] proposed a new index, “surplus power entropy”, by combining the concept of “flow entropy”, proposed by Awumah et al. [
19], and the index of “surplus power factor” proposed by Vaable [
22]. The surplus power entropy is defined as follows:
where,
is the surplus power entropy of node j,
is the surplus power factor of pipe ij,
is the sum of the surplus power factors flowing from the direct upstream node to node j.
; the probability space is defined by
and
.
, meeting the requirement of:
.
How to determine the reliability of the water supply network by node reliability is an important area in evaluating the reliability of the water supply network. The surplus power entropy formula of the water supply network system is as follows:
where,
is the surplus power entropy of the network,
is the total number of nodes in the network,
is the sum surplus power factors of all pipe.
.
3. Surplus Power Entropy Solution Based on PDD Model
3.1. The PDD Model
Traditional hydraulic analysis methods of the water supply network assume that the node water demand is known, or the node water demand is fixed, and it is not affected by the change of node pressure. Then the node pressure and pipe flow can be calculated. This method is the Demand Drive Analysis (DDA) method [
23]. Under normal working conditions, due to the sufficient pressure of the water supply network, the change of pressure will not affect the change of water consumption on the basis of meeting the user’s water demand. At this time, the analysis result of this calculation method is accurate and effective. However, when the working status of the pipe network is abnormal (such as pipe burst, insufficient water supply, and daily maintenance process), the actual pressure of the network cannot reach the ideal pressure demand, and the user’s water consumption will depend on the node pressure. In these situations, according to the Pressure Drive Demand (PDD) model, water consumption not only changes with time, but also depends on the water supply pressure of the network [
24].
The PDD model is developed as follows. When the actual water pressure at the node reaches or exceeds the designed water pressure (
), the node’s water supply is equal to the water demand. When the actual water pressure at the node is lower than the minimum water pressure (
), the node’s water supply is 0. When the actual water pressure at the node is between the design water pressure (
) and the minimum water pressure (
), the node’s water supply and the water pressure satisfy a certain functional relationship. Wagner et al. [
25] proposed the relationship between node water pressure and water distribution. The formula is as follows:
where,
is the pre-earthquake water supply of node
i (L/s);
is the water supply of node
i, which conforms to the relationship between node water pressure and node water supply (L/s);
is the water pressure for node
i (m);
is the minimum node water pressure required by node
i, when node
i water supply
is greater than 0;
is the design water pressure required by node
i when the water supply of node
i reaches
before the earthquake.
3.2. Solution Process
In this paper, based on the PDD model, hydraulic adjustment calculation was conducted without changing the topological structure of the pipe network by adopting the iterative method [
6]. Epanet2.dll was used for hydraulic adjustment calculation many times. According to the calculation results of hydraulic adjustment, the surplus power entropy of nodes and network system was also calculated [
26]. The calculation process is shown in
Figure 1. The main steps are as follows [
10].
(1) Random sampling was used to determine the seismic damage state of the pipeline. The hydraulic model of the network after an earthquake was developed [
27]. The hydraulic adjustment of the water supply network after an earthquake was calculated based on the pressure-driven node’s water distribution model [
28].
(2) The flow direction of the segment was determined, and the pipe segments were sorted by using the numbers at the end of the pipe segment. Next, the pipe segment parameters and surplus power factors flowing into each node were counted.
(3) The sum of all surplus power factors of each node was calculated. Following it, the surplus power entropy of the node was calculated.
(4) The sum of the surplus power entropy of all nodes was calculated to obtain the surplus power entropy of the water supply network.
The first step of the process needs to do the following work [
10]. The first is to determine the number and location of pipeline failure points. It is assumed that the pipeline failure after the earthquake is a random independent event, and the Poisson distribution is observed along the pipeline length. The probability formula of pipeline seismic damage is Equation (4).
where,
is the probability of pipeline failure after an earthquake;
is the average seismic damage rate of the pipeline (repairs/km);
is pipeline length (km).
L is a random number subject to an exponential distribution with a mean of 1
/RR. Then, the calculation formula for the location of the pipeline failure point after generating earthquake is Equation (5) [
29].
where,
is the distance between the
and
locations of damage;
is a random variable, which is uniformly distributed between 0 and 1.
The earthquake damage rates are calculated via adopting the models developed from Jeon [
30] and Wang [
31] on the seismic oscillation data of the Northridge earthquake in 1994, and the seismic damage data of water supply network. Equation (6) can be used to calculate the seismic damage rate of steel tubes (riveted joints, diameter D ≥ 600 mm).
where,
is peak ground acceleration (
).
The second is to determine the type of pipeline failure point and leakage form. The American Lifeline Association (ALA) [
32] divides pipeline damage into two types: disconnection and leakage. Shi and O Rourke [
33] divided pipeline leakage into five forms, according to different pipe materials and joints. Then the hydraulic model of failure point was built on EPANET by adding a virtual pool and diffuser [
34]. Finally, the hydraulic adjustment of the water supply network after the earthquake was calculated based on the water distribution model of pressure drive node’s demand.
4. Applications and Results
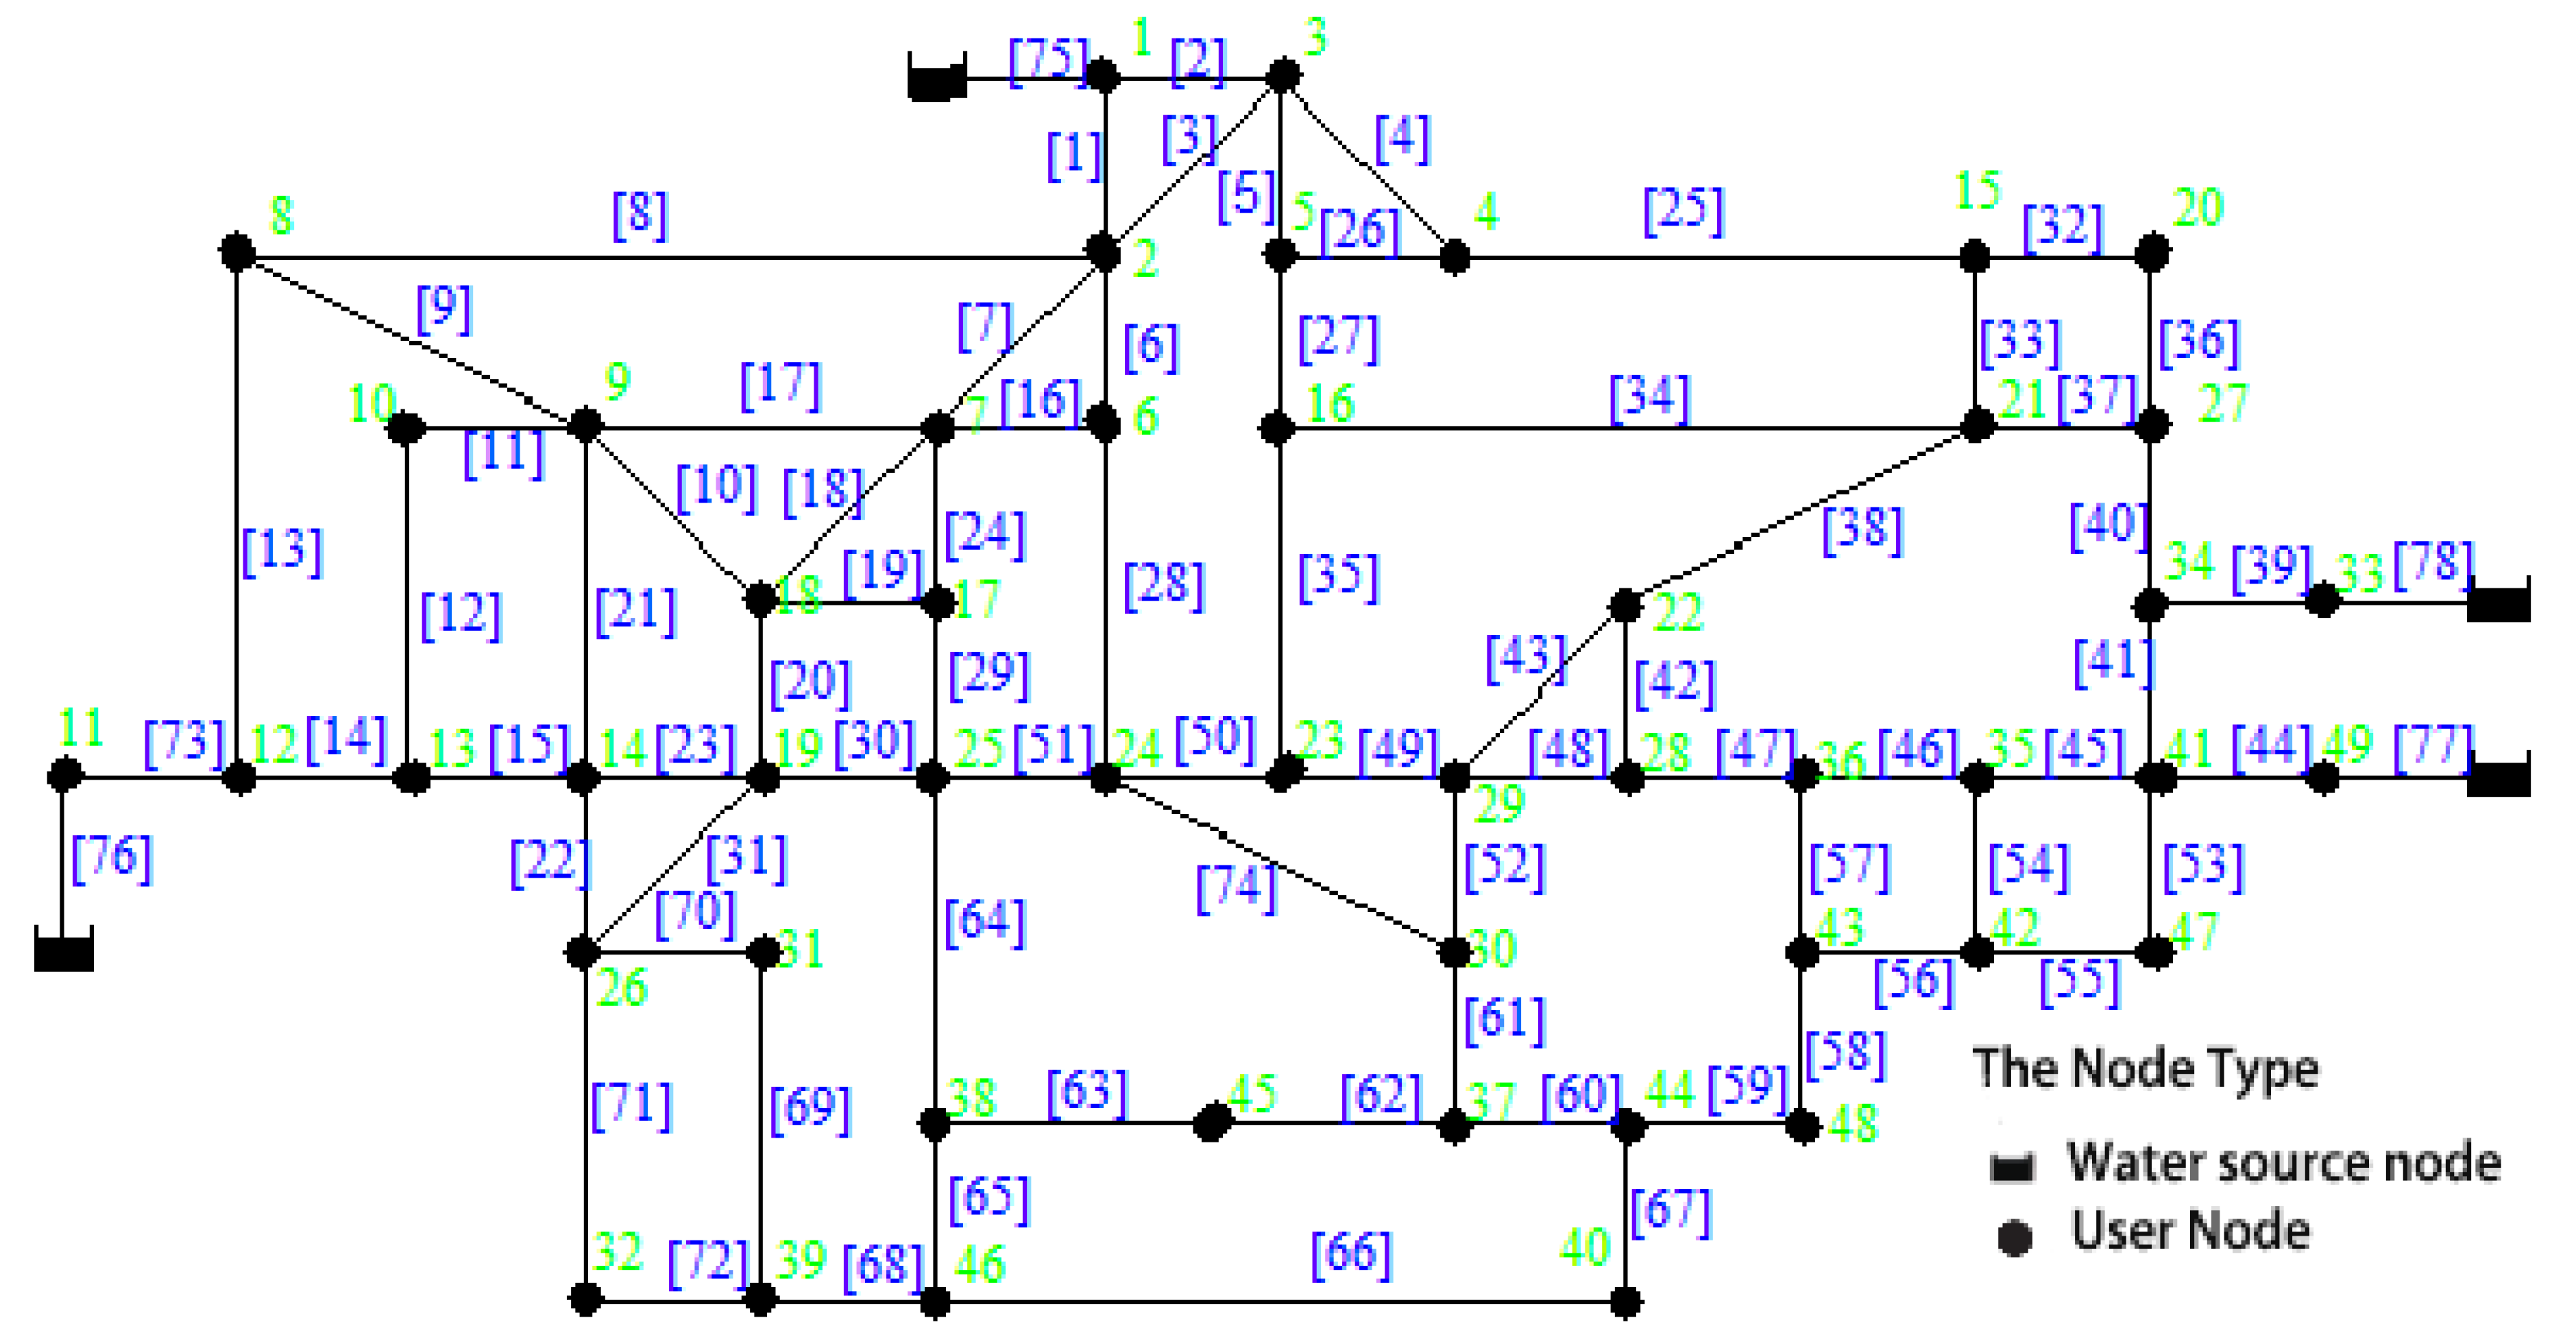
The surplus power entropy model of the water supply network system is applied to the model of the urban water supply network in a certain area [
35]. The topological structure of the water supply network model is shown in
Figure 2. The water source of the water supply network is node 50, 51, 52, 53, with a total head of 76.95 m, 74.31 m, 83.58 m, and 81.98 m, respectively. The specific pipe network node elevation and water demand, pipe segment length and diameter, and Monte Carlo simulation parameter information were used according to the literature [
10,
35].
It is assumed that for pipes with diameter greater than 600mm, the formula of steel tube (riveted joint) shall be applied. The seismic damage rates of VII, VIII, IX degrees were calculated as 0.0246, 0.0542, and 0.1254 respectively. For pipes less than 600 mm in diameter, the formula of ductile iron (rubber seal joint) shall be applied. The damage rates of VII, VIII, IX degrees were calculated as 0.0103, 0.0260, and 0.0690, respectively.
4.1. Statistics of Surplus Power Entropy of Network
In order to objectively analyze the reliability of the pipe network and calculate the surplus power entropy of the pipe network system, this paper divided it into 15 groups for different times of calculation. The results of the network entropy mean, and standard deviation in the VII, VIII, and IX degrees, are shown in
Figure 3. The specific data of IX degree are shown in
Table 1.
From the curve in
Figure 3a, it can be seen that the entropy values of VII, VIII, and IX degrees basically reach stable convergence after 3000 times. From the standard deviation curve of
Figure 3b, it can be seen that the standard deviation also reached stable convergence and gradually stabilized at 0.29–0.30 after 3000 times. The average of the seven groups mean values after 3000 simulations was taken as the surplus power entropy of the pipe network. The surplus power entropy of pipe network at VII, VIII, and IX degrees are 4.984, 4.950, and 4.868, respectively. The mean of standard deviation after stabilization are 0.294, 0.300, and 0.291, respectively.
According to the curve changes, in the first 3000 simulations, the entropy value curve of VII degree has a large fluctuation range. At the beginning, it fluctuates from the lowest value 4.879 to the highest value 5.044, and then the fluctuation range decreases. The stable value of fluctuation is 4.984, and the standard deviation gradually decreases from 0.357 to 0.291. That network surplus power entropy at VII degree, in front of the stability of the discrete degree is higher, having a larger fluctuation at a high level, compared to the other degree. The range of the entropy curve fluctuation reduces at VIII degree. The fluctuation quickly enters a stable state with a stable value of 4.950. The mean entropy gradually increases, smoothly, from 4.808, and quickly enters a stable state with a stable value of 4.868. The entropy of each simulation at IX degree is lower than the surplus power entropy of pipe network at VII degree and VIII degree. With the increase of intensity, the entropy curve of the pipe network is distributed from high to low. Viewing from the whole picture, the surplus power entropy of the network with relatively low intensity is larger than that with relatively high intensity, which also conforms to the actual situation.
The standard deviation curve of
Figure 3b also shows that the standard deviations of different intensities are relatively close after stabilization. After stabilization, the standard deviations of VII, VIII, and IX degrees are 0.294, 0.300, and 0.291, respectively, with little difference. It indicates that there is no significant difference in the dispersion degree of the data after stabilization and the stability of the data after the entropy value of the pipe network among VII, VIII, and IX degrees.
4.2. Comparative Analysis of Node Entropy
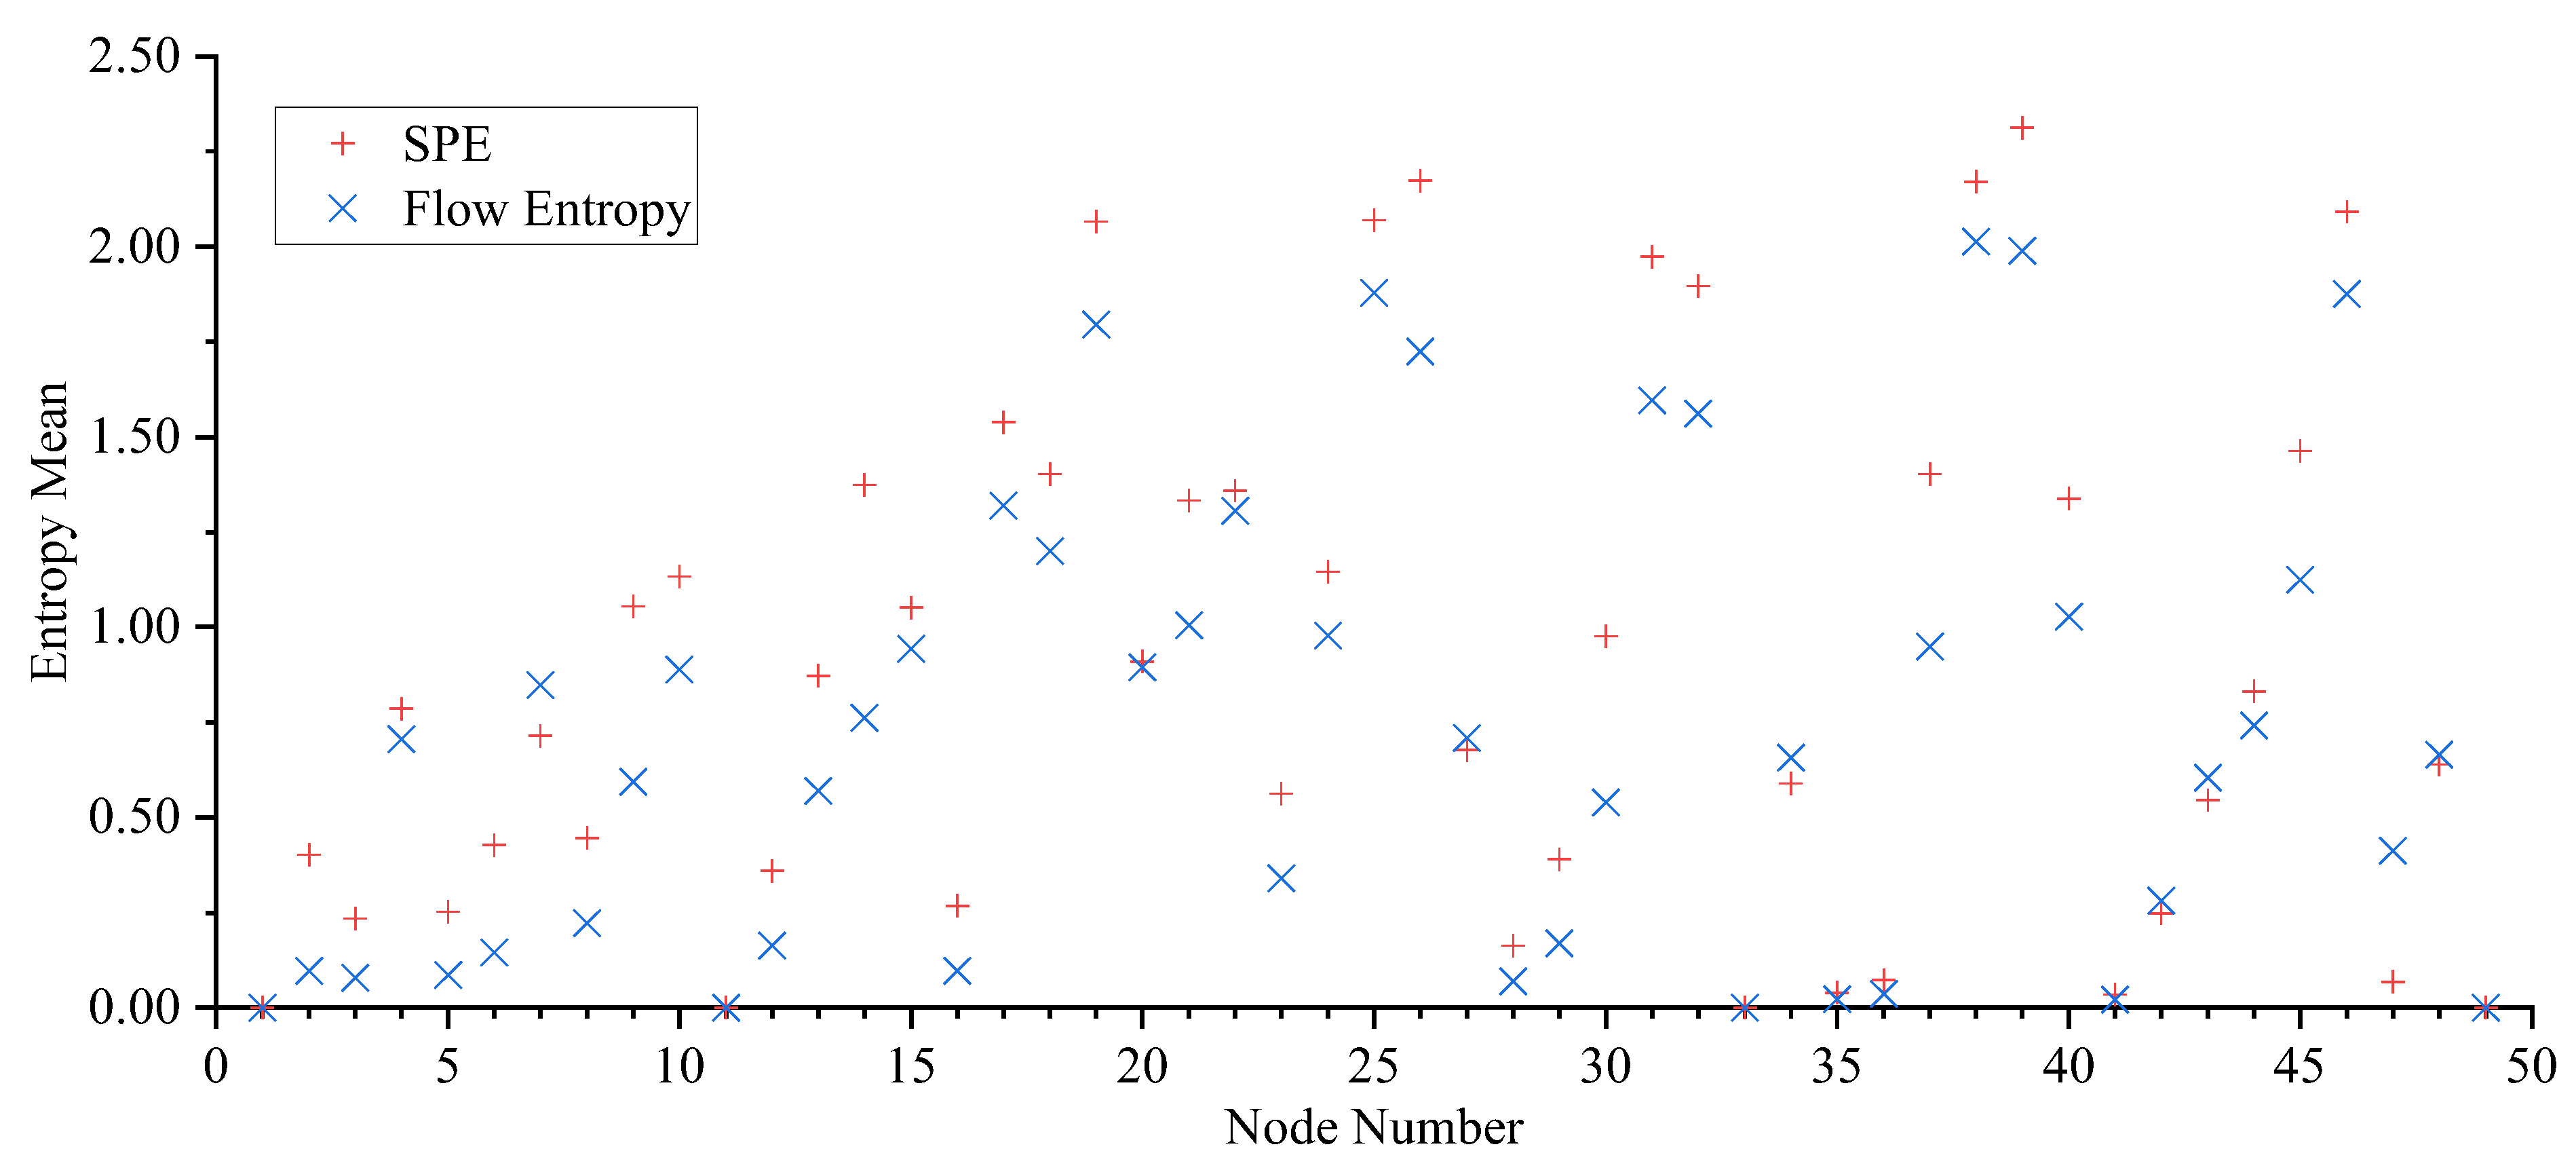
In the present study, 4000 Monte Carlo simulations under IX degree were conducted with network data to obtain the post-earthquake hydraulic analysis results of the water supply pipe network based on the PDD model. After processing the results, the flow entropy and surplus power entropy can be obtained by substituting into the formula. The average value of node entropy is shown in
Table 2 (and data drawn, as shown in
Figure 4).
Due to different random simulation, different failure locations, and different specific working conditions, it is not feasible to select the working conditions generated by a random simulation as the specific working conditions of entropy mean analysis. Therefore, in the second column of
Table 2, direct upstream nodes, of user nodes under normal working conditions, are adopted in the present study. Under the damage of earthquakes, the upstream and downstream relationship of some nodes will change; the number of these nodes is small, and the relative position of the points will not change, so the overall and partial node analysis can be conducted.
Table 2 presents the ten nodes with the minimum entropy value are the nodes 1, 11, 33, 49, 41, 35, 47, 36, 28, and 3. Since the water source is the initial node of the pipe network, and no water flows into it, the entropy of the water source node is 0. The direct upstream node of the nodes 1, 11, 33, and 49 is the water source point, and there is only a single water supply path from the water source point to the node. Therefore, the entropy value of the nodes 1, 11, 33, and 49 is always 0, if the path is not destroyed. The entropy value of the nodes 41, 35, 47, 36, 28, and 3 depends on the water supply path from the water source point to the node. If the water supply path is a single path, the entropy value is 0. If it is not a single path, the entropy value will depend on the distribution uniformity of remaining energy factors in different paths. When a pipe segment in these nodes was broken, the original downstream nodes of the pipe segment were no longer supplied by adjacent water sources, instead, by other water sources. In this circumstance, its water supply path is not a single path, and its entropy value is not zero. However, during most of the simulations in this study, no earthquake damage simulations occurred around this section, so these nodes would also have 0 entropy value. It is necessary to improve the entropy value of such nodes to improve the reliability of the network. When the node has only a single water supply path, once the pipe segment of this water supply path fails, it will have a significant impact on the water supply of the node, or even stop the water supply. For nodes with multiple water supply paths, if one water supply path fails, the other path can continue to supply water to the user node; thus, the reliability of water supply is higher. Therefore, when optimizing the network topology, it is suggested to consider the circumferential network laying to ensure multi-path water supply for user nodes, improve the redundancy of water supply path for user nodes, and improve the reliability of the network [
36].
On the other hand, entropy is also related to the average distribution of surplus power in different paths. Some nodes that have more than one water supply path from the water source have low entropy. The reason for the low entropy is that there is a large gap between the distribution of surplus power in different pipe segments; for nodes with a large gap between the distribution of residual energy in different water delivery paths. Once the path with a large distribution of residual energy fails, the residual energy in the remaining paths is not enough to undertake the water delivery task transferred from the fault pipe segment, leading to the node’s low reliability. The entropy value of nodes with low average distribution degree is normally higher than those nodes with a single water supply path. Therefore, when considering the topological structure optimization of network, the optimization of nodes with a single water supply path should be taken into account to improve the reliability of network.
Combined with the network topology, it can be seen from
Figure 4 that if the surplus power entropy points in the figure are connected, and flow entropy do the same, the two curves obtained are consistent in the changes between nodes. There is a high correlation between the flow entropy and the surplus power entropy of nodes. The correlation coefficient of the two indexes was 0.971. It shows that the flow entropy and the surplus power entropy of nodes are consistent in the change between nodes. It verifies the feasibility of surplus power entropy is a reliability index. The comparison of the entropy values of the same node shows that the surplus power entropy is higher at the high level and closer to the low level than the flow entropy. The value of surplus power entropy of most nodes is normally higher than that of flow entropy, which indicates that the evaluation of reliability of the same node has a higher degree of differentiation in the evaluation of reliability compared with flow entropy.
4.3. Analysis of Working Conditions under Different Seismic Intensities
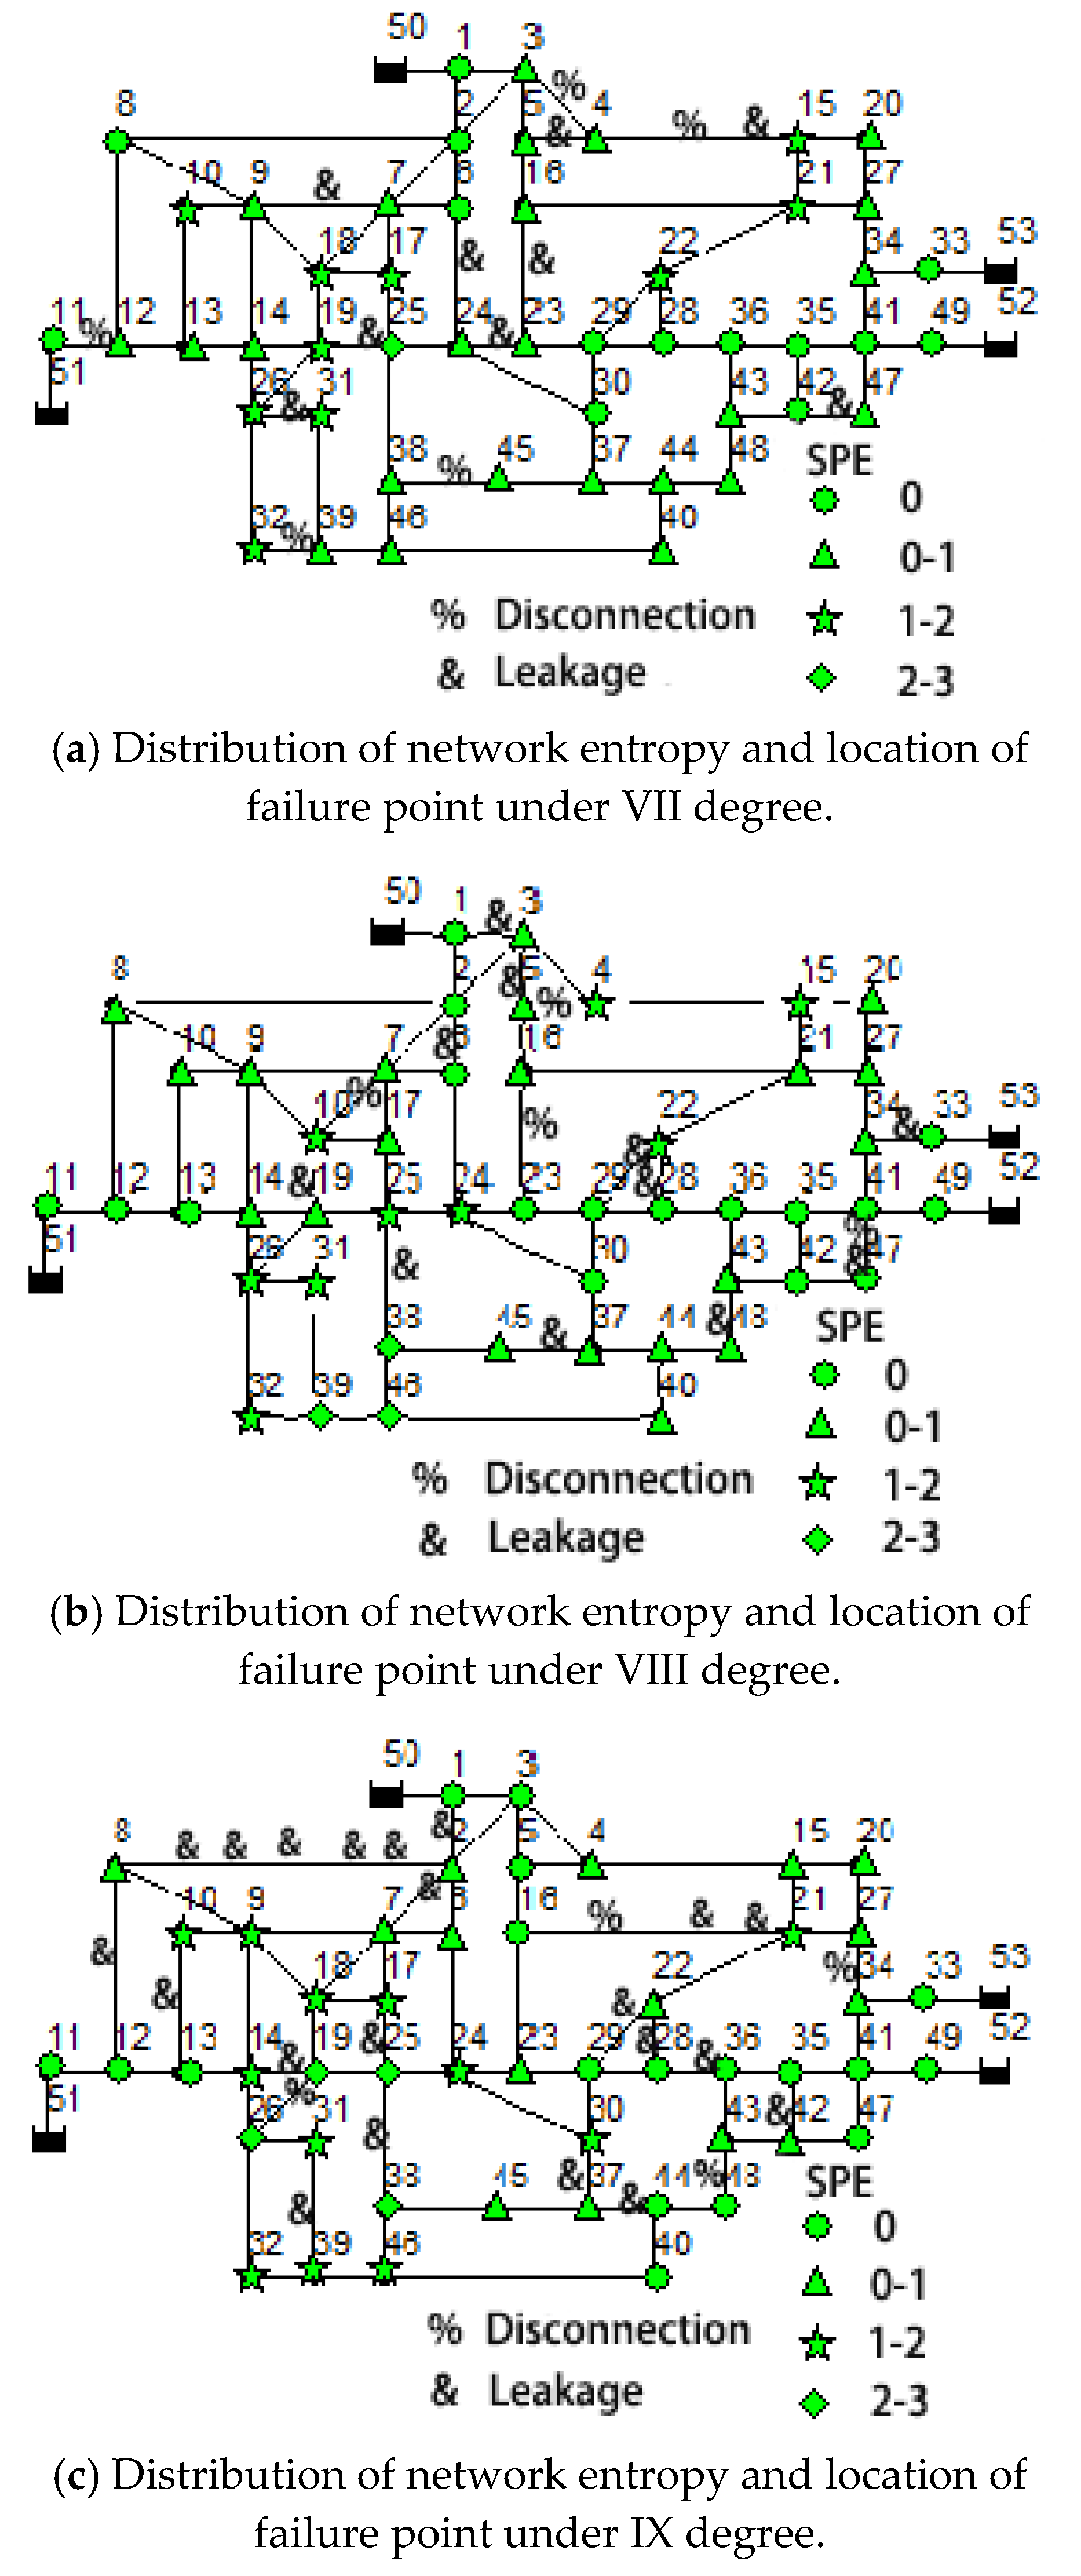
In the present study, a working condition with the most damaged sections was selected from 10,000 simulations at VII, VIII, IX degrees, and the surplus power entropy of its nodes was calculated, respectively. The entropy value was classified, and its quantity distribution was shown in
Table 3. It was marked in the pipe network structure drawing (
Figure 5a–c).
Both the number of water supply routes from the water source to the node and the uniformity of residual energy factors on multiple water supply routes determine the value of surplus power entropy. In
Figure 5a–c, the nodes with entropy of 0 have certain characteristics in the spatial distribution, most of which are distributed near the water source. Moreover, the nodes with entropy of 0 are distributed in the pipe network at different intensity levels. This is because in most cases, the earthquake failure did not change the single water supply path of the node near the water source. For nodes, only when there are two or more water supply paths, the residual energy factor be distributed and the water supply path have redundancy, and the entropy value can be improved. Therefore, the water supply path redundancy of nodes in the network has an important impact on the value of surplus power entropy. In addition, the water supply path from the water source point to the node with non-zero entropy value is not the single path, and the entropy value of such node is closely related to the random distribution uniformity of residual energy in different water supply paths. In the present study, the nodes with entropy of 0 are considered from the perspective of network structure optimization in lifting condition.
The surplus power entropy reflects the capacity to undertake the water transportation task transferred from other pipe segments in addition to the completion of its own water transportation task. The surplus power entropy quantifies the redundancy of the pipe segment. In addition, it measures the reliability of the network through the distribution uniformity of residual energy, and can be used as an operating index to measure the reliability of the pipe network. The present study suggests that the surplus power entropy of the network can be improved and the reliability of the network can be improved by adjusting pipe network structure. In addition, the scheme is developed based on the increase of the network’s surplus power entropy, and the scheme is verified by using the satisfaction of water volume and head as the result index, to determine the optimal scheme of the pipe network structure.
4.4. Reliability Improvement Scheme
In the present study, three reliability improvement schemes are proposed, including increasing pipe segment, increasing pipe diameter, and adding water pump. Under the damage situation of the network, the weak part of the network, the nodes with low entropy value, and the units with high influence or importance are identified and then optimized.
4.4.1. Increase the Pipe Section
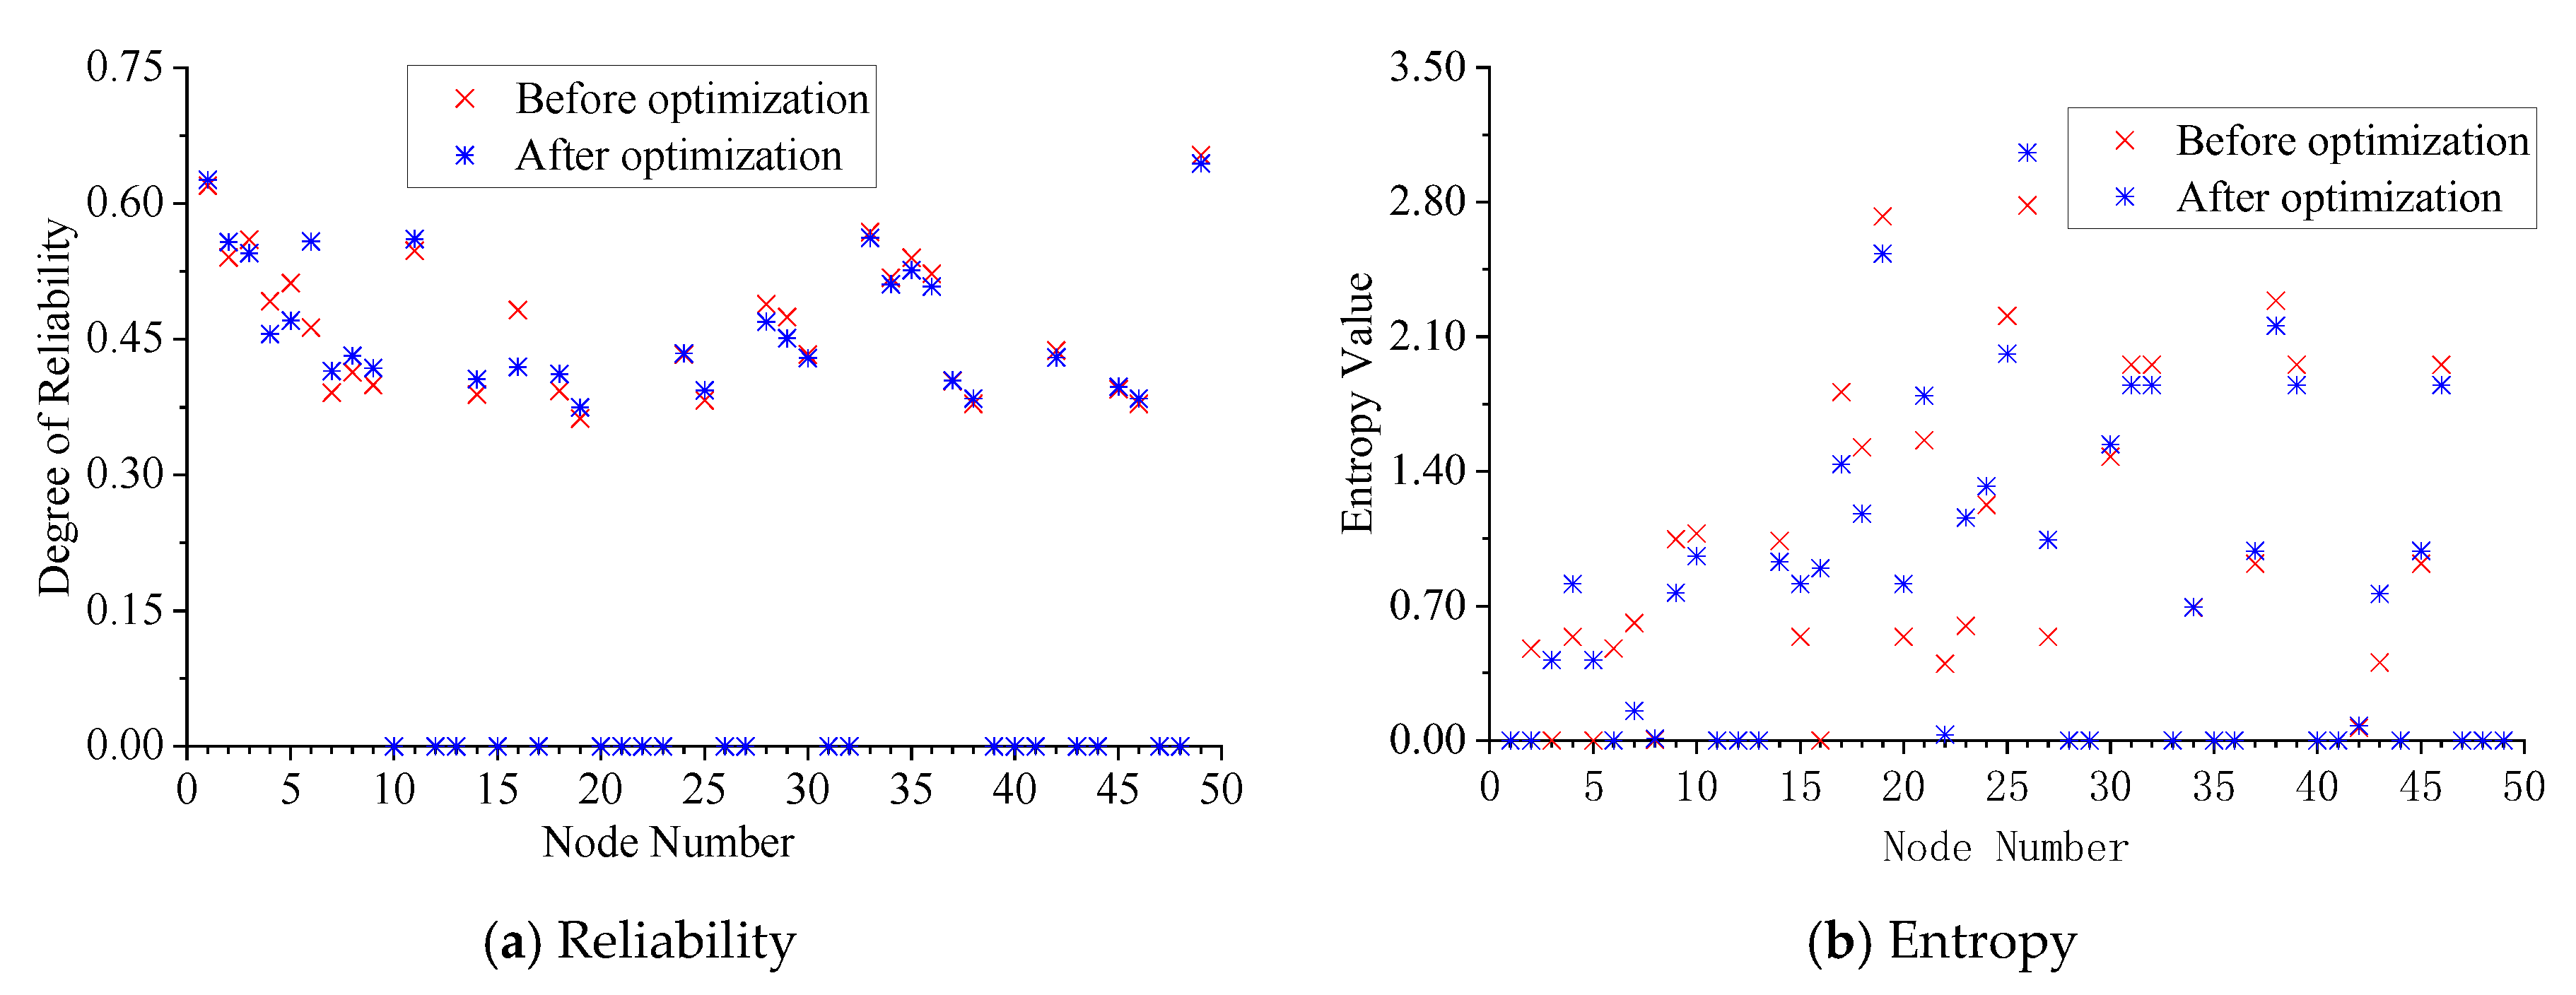
This study was to optimize part of the pipe section and test the rationality and feasibility of the optimized scheme, with a further goal to improving the reliability through comparative analysis of the optimized reliability index. This study increases the water supply path of a node based on the working condition in
Figure 5c, and a new pipe section is added between node 34 and node 28 to improve the reliability of the pipe network. The number of the newly added pipe segment is No. 79, with a length of 4150 m, a diameter of 800 mm and an approximate coefficient of 120. The data of pre and post optimization are shown in
Figure 6. The reliability index used to verify the optimization results is water pressure reliability. Water pressure reliability refers to when there is less than 70% of the designed water demand of the node flow, and the node reliability is 0. If the flow is greater than or equal to 70%, the node reliability is the ratio between the node heads under normal working conditions.
It was found that the reliability and surplus power entropy of the node 28 are all improved after optimization. The reliability increases to 0.0153 and the surplus power entropy increases to 1.052. The index of the pipe network system was also improved. The reliability increased from 0.26 to 0.2613, and the entropy increased from 4.749 to 4.8488. It was also found from
Figure 6 that the reliability and surplus power entropy values of most nodes did not have a significant difference, before and after optimization. However,
Figure 6 shows that the nodes around nodes 34 and 28 changed significantly. The results analysis of the entropy value show that after optimization, except for nodes 14, 34, and 42, the entropy value of node 28 increased from 0 to 1.052. It indicates that the water supply path increased, resulting in an increase in the water supply redundancy of node 28. The analysis of the reliability results also shows that after optimization, except for the decrease of nodes 33, 34, and 49, the remaining nodes were unchanged. The nodes 33, 34, and 49 are located upstream of the new section 79; node 28 and its downstream nodes shared the head energy of these nodes, resulting in a decline. No matter what the index value of the node after optimization rises or falls, both the surplus power entropy and reliability value of the pipe network system were higher than pre-optimization. For users, the higher the index of the nodes, the better. However, in order to improve system index, more consideration should be given to the reliability of the pipe network system and the improvement of entropy value in the optimal design.
4.4.2. Increase the Pipe Diameter
The pipe diameter was increased in the pipe segment with both the diameter of more than 500 mm and the 0 entropy value at the beginning or end of the nodes; the lifting scheme was developed based on the improved entropy value after optimization and the improved reliability. The earthquake damage statistics showed the pipe diameter varies within the range of 200 to 500 mm, and the reliability did not fluctuate significantly [
37]. Therefore, this study chose to increase the pipe diameter of the section with the pipe diameter above 500 mm in
Figure 5c. The pipe diameter of the section near the water source was increased to provide more water for downstream users. Therefore, the pipe diameter of section 76, between the water source point 51 and node 11, increased from 500 to 800, and other data remained unchanged. The water pressure reliability was used as the reliability index. The data before and after optimization are shown in
Figure 7.
The comparison between reliability and entropy was shown in
Figure 7. The pipe diameter of section 76 increased from 500 to 800, resulting in a significant increase in the water head of node 11, from 25.38 to 55.88. The reliability then also increased from 0.547 to 1, and the entropy value remained unchanged. It shows that after the optimization, the performance index of the pipe network system improved. The surplus power entropy of the pipe network also increased by 0.101, from 4.749 to 4.850, and the proportion of the increased part was 1.84%. Moreover, the reliability increased by 0.0148, from 0.260 to 0.275, and the proportion of the increased part was 5.68%. In
Figure 7a, it was found that due to the increase in a pipe diameter of section 76, the water head of node 11 increased greatly and other nodes slightly improved. The reliability of the pipe network increased from 0.260 to 0.275.
Figure 7b shows the change of entropy value laid in the user node, with water source point 51 as the main water source. It was mainly distributed in the lower left of the pipe network.
The improvement scheme started with increasing the pipe diameter, and then the pipe segment with the pipe diameter of more than 500 mm from the vicinity of the water source point was selected. The entropy value of the pipe network increased, and the lifting scheme that improved the reliability of the pipe network was selected. The increase of pipe diameter was used as the supplementary means of structural adjustment, and increase of pipe segment, to provide a scheme to improve the reliability of the pipe network.
4.4.3. Add Pump Station
This study increased the water head of the node and its adjacent nodes by adding pumps, to change the entropy value and reliability of the node. In order to improve the entropy value and reliability, the reliability improvement scheme was developed. This lifting scheme was based on the working conditions shown in
Figure 5c. A water pump was added between nodes 16 and 6 with a flow of 250 LPS and a head of 35 m. The results, pre and post-optimization, were shown in
Figure 8.
It was found that the water head of node 6 was increased by adding the water pump from 21.37 m to 25.76 m, and the reliability also increased from 0.463 to 0.558. However, node 16 was affected, and the reliability decreased from 0.482 to 0.419. The reliability and entropy of the pipe network system improved; the surplus power entropy increased from 4.749 to 4.763, and the reliability increased from 0.260 to 0.263. It indicates that the addition of water pumps improved the reliability of the pipe network system to a certain extent.
In
Figure 8a, the reliability of the downstream nodes of the water pump, such as nodal 6, 7, 9, 17, 18, 24, 25, and so on, had improved. Among them, the reliability increased by 20.55%. The upstream nodes of the pump, such as 4, 5, 16, 23, and so on, declined, with node 16 dropping the most; the water head and reliability decreased by 13.07%. Adding the water pump added a water delivery path between node 16 and 6. It inevitably led to a certain decrease in the water pressure of the upstream and downstream nodes of node 16. A large number of nodes in the network entropy decreased, owing to when the water pumps were added; the flow direction of one pipe segment (segment 3 between nodes 2 and 3) in the network changed as well. It had an impact on the downstream node entropy value of these two nodes, resulting in a decrease in the entropy value of most nodes in the downstream node of node 2. However, the reliability index of the pipe network system was improving, with the entropy value increasing by 0.29% and the reliability increasing by 1.25%.
Figure 8b shows the entropy value of most nodes after node 28 had slightly changed, indicating that the water pump had a great influence on the reliability of nodes near its installation location. In addition, the reliability of the pipe network mainly laid in the importance of the target node of the water pump in the pipe network. Every single pump could play an important role in improving the reliability of important local nodes in the pipe network and ensuring the water security of specific important user nodes. In the optimization design of the pipe network system, the scheme of adding a water pump was adopted to improve the reliability of the local important user nodes. This ultimately provided overall reliability for the pipe network.
4.5. Discussion
The urban pipe network, as a complex network system to provide its seismic capacity. On the one hand, the seismic resistance of the pipe is directly improved by adopting the pipe with better seismic resistance. On the other hand, it can be adopted to improve the redundancy and the overall anti-seismic capacity of the pipe network to improve reliability. This paper does not change the seismic resistance of the structural members, but improves the reliability of the pipe network system through the latter. Through combining the three schemes, it was found that the optimization of a single structural unit could change the reliability of the nearby downstream nodes with the flow of water; thus, improving the reliability of the pipe network system. However, since the optimization of a single node or unit has limited influence in the whole pipe network, the reliability and entropy of the three schemes in this study are relatively limited. It was shown in the study that the reliability of the pipe network was increased by 0.001, 0.015, and 0.003 respectively, and the surplus power entropy was increased by 0.100, 0.101, and 0.014, respectively. In addition, the researchers found that the reliability and entropy value could be further improved by selecting the appropriate unit for optimization, based on the optimization of a single structural unit. Moreover, economic factors will be taken into consideration in further work. In future research, a variety of adjustment schemes for the pipe network structure will be developed based on the increase in entropy value, and the adjustment scheme will be determined with the satisfaction of water volume, or head, as the result index. In order to improve the reliability of the pipe network system, multiple nodes will be optimized by the same scheme, or multiple nodes will be optimized by a combination of different schemes. This process will be used in the optimization and reinforcement of the pipeline network before earthquake damage and the formulation of a post-earthquake recovery strategy.
5. Conclusions
(1) In this study, based on the flow model of the pressure-driven node, the Monte Carlo hydraulic simulation was conducted in a case study to provide a reference for the optimization of the pipe network.
(2) The curves of simulation times, standard deviation, and the mean value of surplus power entropy of the water supply network, under different intensities, were calculated in the process of solving surplus power entropy by using the Monte Carlo stochastic simulation. It was found that the entropy value was basically stable after 3000 simulations. After stabilization, the surplus power entropy of the pipe network at VII, VIII, IX degrees were 4.984, 4.950, and 4.868, respectively. With the increase of intensity, the network entropy curve was distributed from top to bottom.
(3) Based on the analysis of the surplus power entropy of the nodes, it is concluded that the node entropy is related to the water supply path of the nodes and the distribution uniformity of the residual energy in different pipelines. The consistency of flow entropy and surplus power entropy verifies the feasibility of surplus power entropy as a reliability index. This provides a basis for the targeted transformation and optimization of the pipe network.
(4) Specific working conditions under different intensities were selected for analysis in this study, and the spatial node position of a single water supply path was unchanged, which is the reason for the similar distribution of nodes with an entropy value of 0 in the spatial network position. The specific research object and optimization target of network optimization were further clarified in this study as well.
(5) It was also concluded that the surplus power entropy index was a beneficial supplement to the reliability evaluation index of the pipe network and could be used as the operating index to evaluate the rationality of the pipe network structure.
The surplus power entropy calculation method can be used to obtain the distribution of entropy value in the pipe network, and the specific object of reliability improvement is determined. According to the entropy value of specific nodes and segments, the scheme of improving reliability in the local pipe network is designed. Through quantitative calculation of network reliability and network entropy value, before and after the improvement, the effect of network reliability improvement is determined and the network reliability improvement scheme is formulated. In this study, economic factors were not taken into account when formulating the optimization scheme, such as the indicators related to the financial efficiency of the investment. Moreover, the improvement effect of single node unit optimization was limited. Thus, this study suggests we combine economic factors, multiple schemes, and multi-node optimization together to enhance the reliability of the pipe network in future work.
Author Contributions
Conceptualization, Z.S., W.W., and Z.H.; methodology, W.W.; validation, W.W.; formal analysis, Z.S.; writing—original draft preparation, Z.S.; writing—review and editing, W.W., D.M. All authors have read and agreed to the published version of the manuscript.
Funding
This study was supported by the National Natural Science Foundation of China (Grant Nos. 51678017,51908025); National Key R&D Program of China (Grant No. 2018YFD1100902-1); Beijing Natural Science Foundation (No.8194058).
Acknowledgments
The authors are grateful for the opportunity of using the “EPANET” software free of charge.
Conflicts of Interest
The authors declare no conflict of interest. The funders had no role in the design of the study; in the collection, analyses, or interpretation of data; in the writing of the manuscript, or in the decision to publish the results.
List of Notation
| SPE | surplus power entropy |
| SPF | surplus power factor |
| the surplus power entropy of node j |
| the surplus power factor of the pipe segment consists of starting node i and ending node j. |
| the sum of the surplus power factors flowing from the direct upstream node to node j. |
| the upstream node set of node j |
| the surplus power entropy of the network |
| the total number of nodes in the network |
| the sum surplus power factors of all pipe network |
| the sum of the surplus power factors flowing from the direct upstream node to node i. |
| the surplus power entropy of node i |
| the pre-earthquake water distribution of node i |
| the water distribution of node i considering the relationship between node water pressure and water distribution. (L/s) |
| the water pressure for node i |
| the minimum node water pressure when is greater than 0 |
| the design water pressure when node i reaches the pre-earthquake water distribution |
| the probability of pipeline failure after earthquake |
| the average seismic damage rate of pipeline |
| the pipeline length |
| the distance between the and locations of damage |
| a random variable which is uniformly distributed between 0 and 1 |
| the peak ground acceleration |
References
- Gheisi, A.; Forsyth, M.; Naser, G. Water Distribution Systems Reliability: A Review of Research Literature. J. Water Resour. Plan. Manag. 2016, 142. [Google Scholar] [CrossRef]
- Kowalski, D.; Kowalska, B.; Bławucki, T.; Suchorab, P.; Gaska, K. Impact Assessment of Distribution Network Layout on the Reliability of Water Delivery. Water 2019, 11, 480. [Google Scholar] [CrossRef]
- Baoyu, Z. Research on Reliability of Urban Water Distribution Systems; Tianjin University: Tianjin, China, 2012. [Google Scholar]
- Lixia, L. Reliability Analysis and Study of Urban Water Network System; Chongqing University: Chongqing, China, 2007. [Google Scholar]
- Fujiwara, O.; Li, J. Reliability analysis of water distribution networks in consideration of equity, redistribution, and pressure-dependent demand. Water Resour. Res. 1998, 34, 1843–1850. [Google Scholar] [CrossRef]
- Xu, C.; Li, S. Layout optimization of valves based on network reliability. Water Wastewater Eng. 2010, 36, 169–172. [Google Scholar] [CrossRef]
- Mahmoud, A.A.B.; Piratla, K.R. Comparative Study of Reliability Assessment Approaches for Water Pipeline Networks. In Construction Research Congress 2018; American Society of Civil Engineers: New Orleans, LA, USA, 2018. [Google Scholar] [CrossRef]
- Phan, H.C.; Dhar, A.S.; Thodi, P.; Sadiq, R. Probability of network disconnection of water distribution system for maintenance prioritization. J. Water Supply Res. Technol. Aqua 2018, 67, 252–269. [Google Scholar] [CrossRef]
- Liu, C.; He, S. Serviceability Analysis of Water Supply Networks Based on Varied Pressure Deficient Conditions after Earthquake. J. Disaster Prev. Mitig. Eng. 2009, 29, 502–506. [Google Scholar]
- Han, Z.; Ma, D.; Hou, B.; Wang, W. Post-earthquake hydraulic analyses of urban water supply network based on pressure drive demand model. Sci. Sin. Technol. 2019, 49, 351–362. [Google Scholar] [CrossRef]
- Jiang, Z.; Wang, P.; Shi, L.; Tan, C. Mine water supply network reliability based on low deviation sequence. J. Cent. South Univ. (Sci. Technol.) 2014, 45, 1686–1691. [Google Scholar]
- Raad, D.N.; Sinske, A.N.; van Vuuren, J.H. Comparison of four reliability surrogate measures for water distribution systems design. Water Resour. Res. 2010, 46. [Google Scholar] [CrossRef]
- Tanyimboh, T.T. Informational Entropy: A Failure Tolerance and Reliability Surrogate for Water Distribution Networks. Water Resour. Manag. 2017, 31, 3189–3204. [Google Scholar] [CrossRef]
- Kashani, M.G.; Hosseini, M.; Aziminejad, A. Reliability assessment of water distribution network using informational entropy considering design/hydraulic parameters. J. Croat. Assoc. Civ. Eng. 2017, 69, 547–559. [Google Scholar] [CrossRef]
- Santonastaso, G.; Di Nardo, A.; Di Natale, M.; Giudicianni, C.; Greco, R. Scaling-Laws of Flow Entropy with Topological Metrics of Water Distribution Networks. Entropy 2018, 20, 95. [Google Scholar] [CrossRef]
- Wu, Y.; Wang, F.; Tian, H. Entropy-based reliability analysis in water distribution systems. J. Harbin Inst. Technol. 2007, 39, 251–254. [Google Scholar] [CrossRef]
- Todini, E. Looped water distribution networks design using a resilience index based heuristic approach. Urban Water 2000, 2, 115–122. [Google Scholar] [CrossRef]
- Quanlong, D.; An, J.Z.; Shuo, H.; Enqi, F. Reliability Analysis of Dust-Proof Water Supply Network System Based on Sobol. J. Tianjin Univ. (Sci. Technol.) 2018, 51, 919–926. [Google Scholar] [CrossRef]
- Awumah, K.; Goulter, I.; Bhatt, S.K. Assessment of reliability in water distribution networks using entropy based measures. Stoch. Hydrol. Hydraul. 1990, 4, 309–320. [Google Scholar] [CrossRef]
- Tanyimboh, T.T.; Siew, C.; Saleh, S.; Czajkowska, A. Comparison of Surrogate Measures for the Reliability and Redundancy of Water Distribution Systems. Water Resour. Manag. 2016, 30, 3535–3552. [Google Scholar] [CrossRef]
- He, Z. Reserch on Surplus Power Entropy of Water Distribution Systems and Reliability Assessment; Harbin Institute of Technology: Harbin, China, 2014. [Google Scholar]
- Vaabel, J.; Koppel, T.; Ainola, L.; Sarv, L. Capacity reliability of water distribution systems. J. Hydroinf. 2014, 16, 731–741. [Google Scholar] [CrossRef]
- Zhou, W.; Li, S.; Hou, Y.; Huang, L. Comparative study of calculation methods for link importance in water distribution network based on DDA and PAD models. Water Wastewater Eng. 2013, 39, 154–157. [Google Scholar]
- Hou, B.; Du, X. Pressure-Dependent Analysis of Water Supply Network Damaged by Earthquake Based on Emitter Model. J. Civ. Archit. Environ. Eng. 2013, 35, 36–43. [Google Scholar] [CrossRef]
- Wagner, J.M.; Shamir, U.; Marks, D.H. Water distribution reliability: Simulation methods. J. Water Resour. Plan. Manag. 1988, 114, 276–294. [Google Scholar] [CrossRef]
- Yoo, D.; Chang, D.; Song, Y.; Lee, J. Optimal Placement of Pressure Gauges for Water Distribution Networks Using Entropy Theory Based on Pressure Dependent Hydraulic Simulation. Entropy 2018, 20, 576. [Google Scholar] [CrossRef]
- Choi, J.; Yoo, D.; Kang, D. Post-Earthquake Restoration Simulation Model for Water Supply Networks. Sustainability 2018, 10, 3618. [Google Scholar] [CrossRef]
- Yoo, D.; Jung, D.; Kang, D.; Kim, J. Seismic-Reliability-Based Optimal Layout of a Water Distribution Network. Water 2016, 8, 50. [Google Scholar] [CrossRef]
- Cornell University. GRAFFE User’s Manual Version 4.2; Cornell University, School of Civil & Environmental Engineering: Ithaca, NY, USA, 2008. [Google Scholar]
- Jeon, S.S.; O’Rourke, T.D. Northridge earthquake effects on pipelines and residential buildings. Bull. Seismol. Soc. Am. 2005, 95, 294–318. [Google Scholar] [CrossRef]
- Wang, Y.; O’Rourke, T.D. Seismic Performance Evaluation of Water Supply Systems; MCEER: Buffalo, NY, USA, 2006. [Google Scholar]
- Eidinger, J.M. Seismic Guidelines for Water Pipelines; American Lifelines Alliance: San Francisco, CA, USA, 2005. [Google Scholar]
- Shi, P.; O’Rourke, T.D. Seismic Response Modeling of Water Supply Systems; MCEER: Buffalo, NY, USA, 2006. [Google Scholar]
- Rossman, L.A. EPANET 2: Users Manual; U.S. Environmental Protection Agency (EPA): Cincinnati, OH, USA, 2000.
- Lin, Y. Design of Real-time Monitoring System for Municipal Water Supply Network and Optimization of Monitoring Points; South China University of Technology: Guangzhou, China, 2013. [Google Scholar]
- Gupta, R.; Rathi, S. Joint Consideration of Layout and Pipe Sizes for Water Distribution Network Design with Reliability. Procedia Eng. 2017, 186, 357–363. [Google Scholar] [CrossRef]
- He, S. The Format Criterion of Doctoral Dissertation of DUT; Dalian University of Technology: Dalian, China, 2009. [Google Scholar]
© 2020 by the authors. Licensee MDPI, Basel, Switzerland. This article is an open access article distributed under the terms and conditions of the Creative Commons Attribution (CC BY) license (http://creativecommons.org/licenses/by/4.0/).


