1. Introduction
Energy is the driving force for economic activity. However, the carbon emissions from energy may lead global warming to affect humankind and the environment. Some climate negotiations, such as the Kyoto Protocol, Nationally Appropriate Mitigation Actions (NAMAs), and Intended Nationally Determined Contributions (INDC), have been agreed to by many countries to limit carbon emissions. The main reason for the increasing carbon emissions is that the environmental pollution that takes place along with economic development is neglected. Because carbon emissions have no market value, firms and consumers overproduce and overconsume commodities without paying for the responsibility of the pollution. The price mechanism and resource distribution have failed and are inefficient. To allocate resources efficiently, the external cost, such as carbon dioxide emissions, should be considered in the commodity price. Consequently, it is necessary for governments to design a mechanism to price carbon emissions.
Pigou first claimed that the external cost can be taken into account by imposing a tax on the market activity of polluters [
1]. However, it is difficult to achieve zero pollution of the economy. Because most market activity produces pollution, zero pollution represents the prohibition of all production and is inefficient and unacceptable. The optimal pollution produced must consider the trade-off between the cost of pollution and pollution control—the amount of pollution should be the intersection of the marginal damage cost and marginal abatement cost to allocate the resource efficiently. In the framework of partial equilibrium, imposing a Pigouvian Tax may be efficient for the allocation of resources. However, for general equilibrium, with the interaction of markets in a whole economy, deadweight loss may occur due to tax distortion. As illustrated in the top of
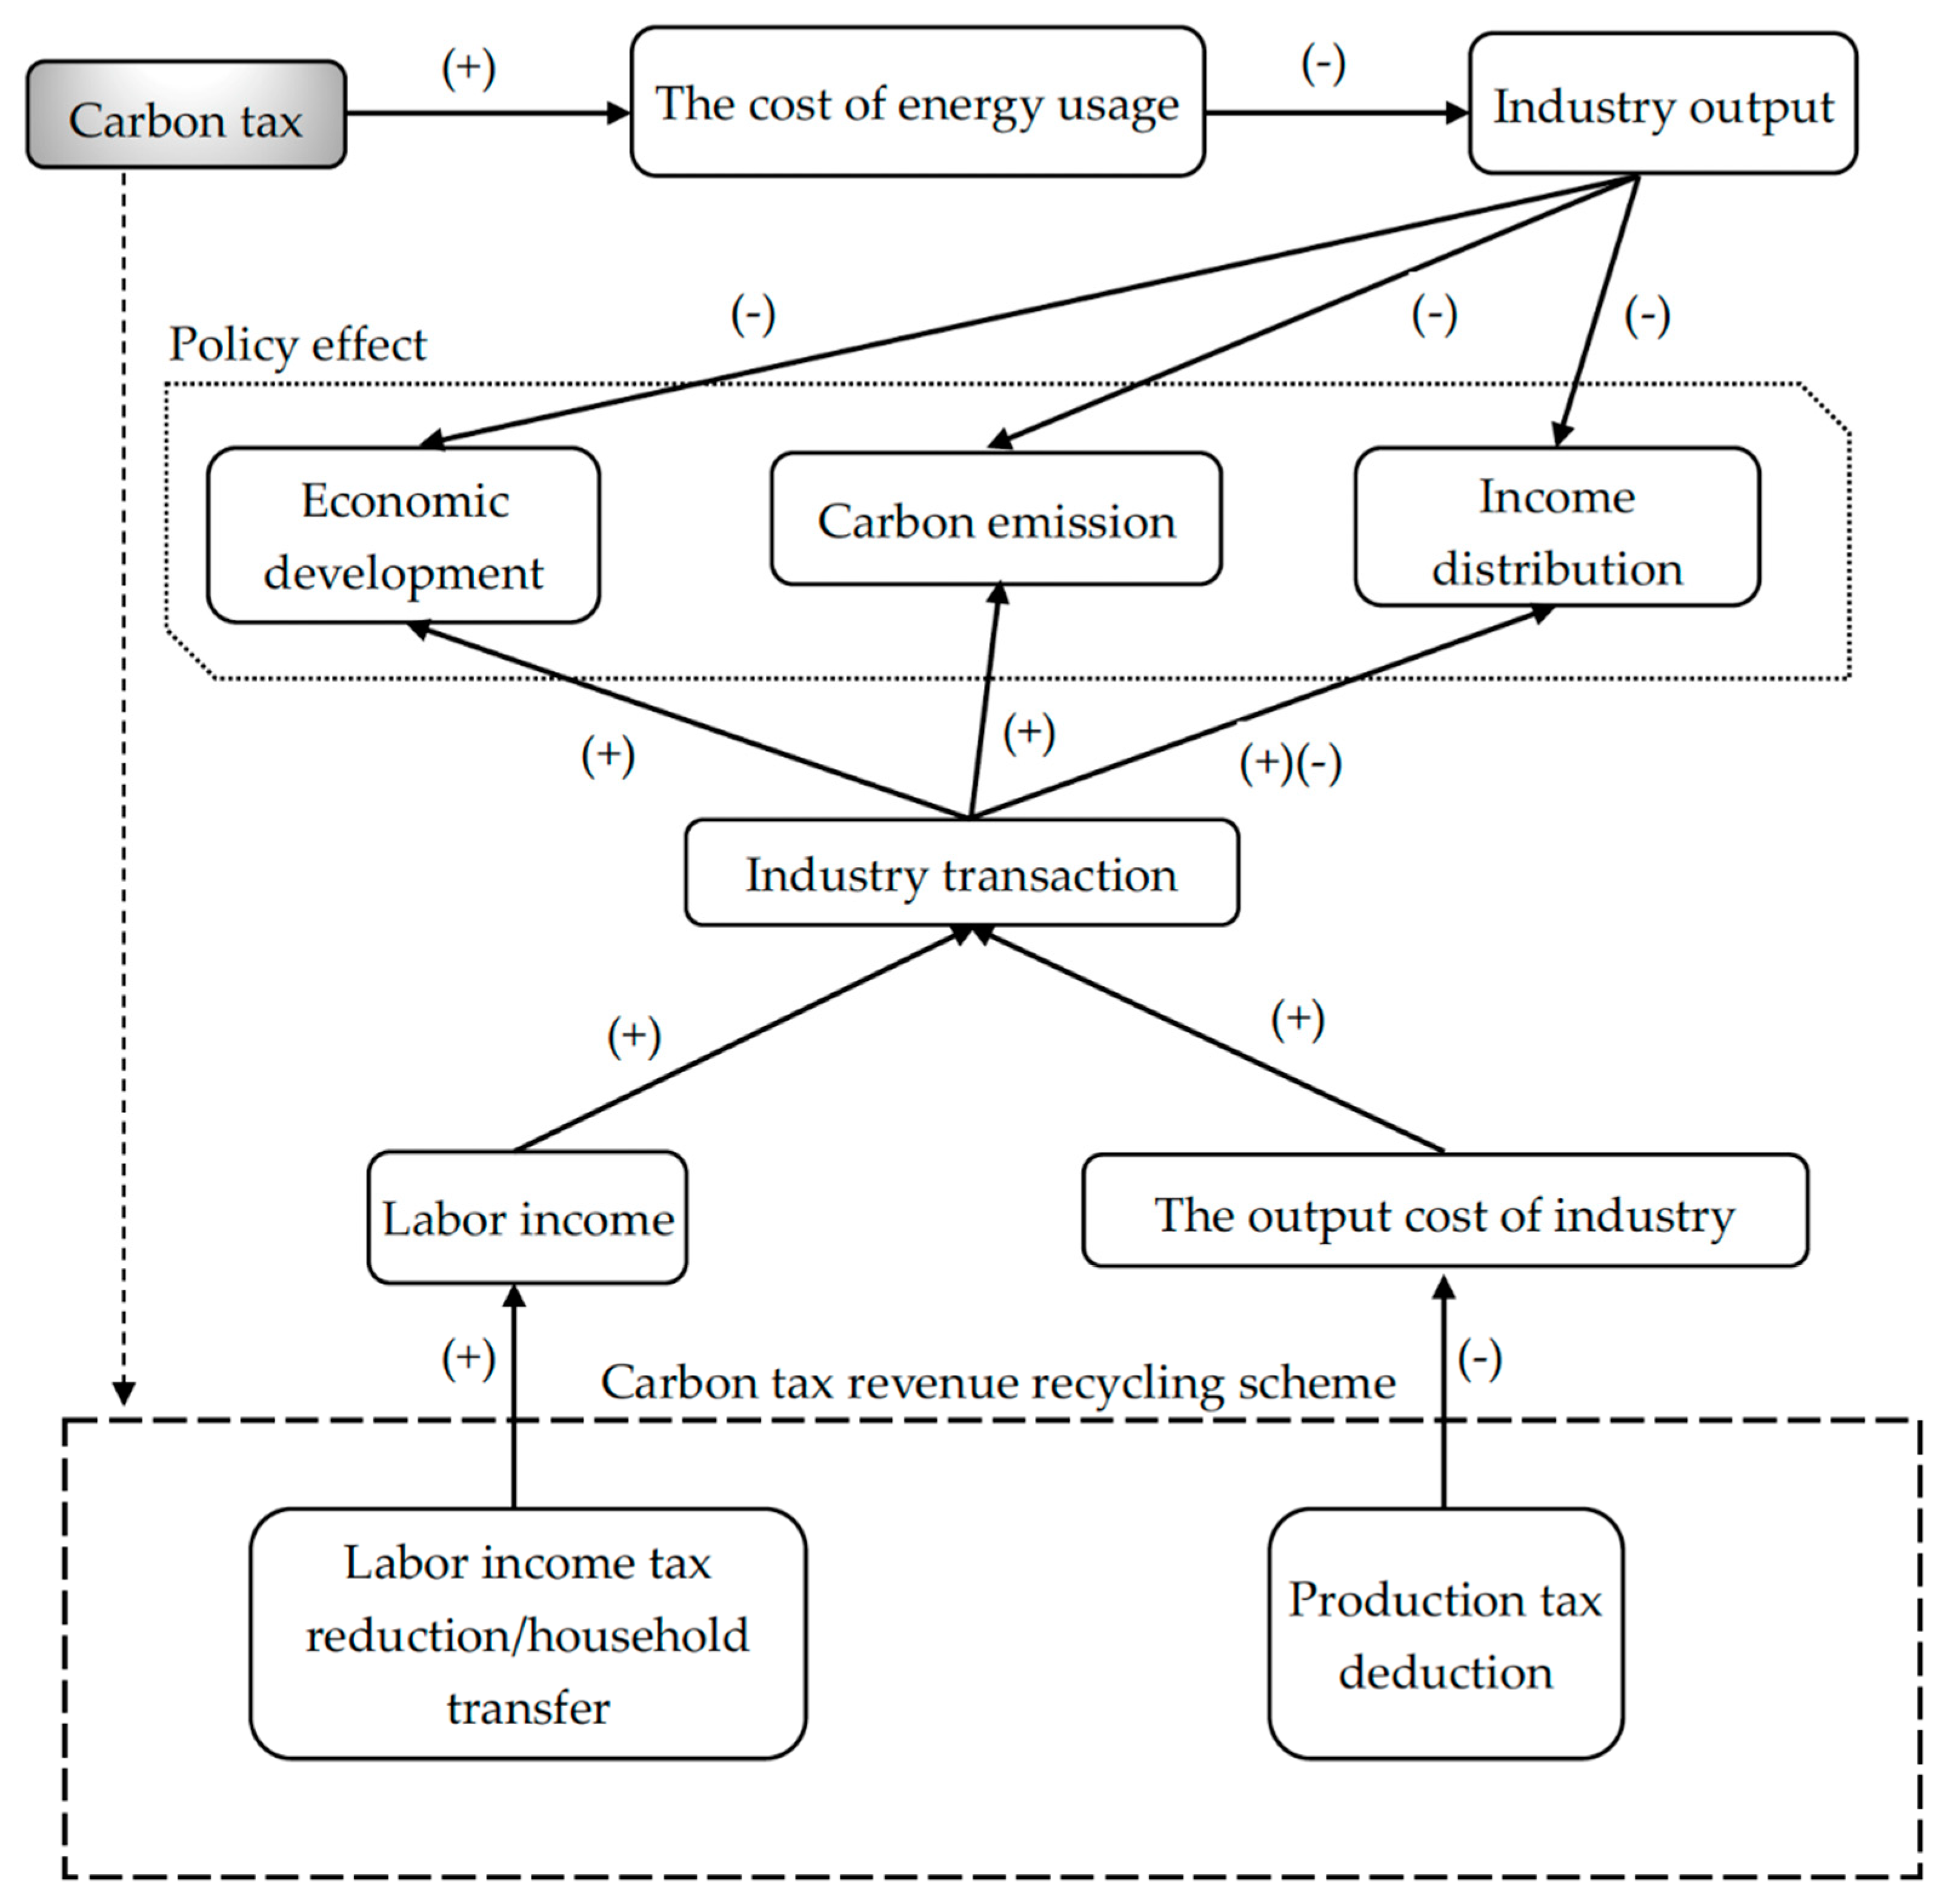
Figure 1 (the transmission mechanism), for carbon tax, it would increase the cost of energy usage for firms, decrease industry output, and harm economic development. The real purchasing power of labor income and employment, with a positive elasticity of labor supply, would also fall. Additionally, an interaction between carbon tax and other taxes could exist to change the tax base of other taxes.
A carbon tax is regressive before tax recycling [
2]. Regressive means that people with a low-income level would be affected through the taxation. In other words, a carbon tax is bad for income distribution (in the top of
Figure 1). This is also the main reason for the slow carbon taxation policy of many countries. In the middle of the 1980s, most European countries faced an aging population, increasing unemployment, and fiscal deficit. At the same time, each country asked fora better environmental quality. Green tax reform which combined environmental and fiscal policy was born at that time to use the revenue from green tax to correct the distortion. As the transmission channels, tax revenue can be re-distributed by different means, such as income tax reduction, direct transfer, production tax deduction (in the bottom of
Figure 1). These schemes can boost industry transactions to offset the damage resulting from a carbon tax. Namely, green tax reform can internalize the external cost of pollution in order to improve the environment. Under “tax neutrality”, other distortionary taxes can be adjusted to decrease the deadweight loss to create the “double-dividend” effect. Tax revenue recycling, such as the reduction of other taxes, subsidy, and transfer is necessary for the double dividend. The deduction of other taxes is usually to cut indirect tax, production tax, labor tax, and so on. The subsidy and transfer are mainly household income transfer.
Concerning the energy situation in Taiwan, due to Taiwan’s geographical characteristics and limited natural resources, its energy supply relies heavily on imported fossil fuels, which cater for over 90% of the country’s energy demands. In 2018, the energy mix in Taiwan was as follows: coal and coal products accounted for 29.38% of energy supply, crude oil and petroleum products accounted for 48.28%, natural gas accounted for 15.18%, nuclear accounted for 5.38%, and solar photovoltaic and wind power accounted for 0.28%. Therefore, Taiwan’s energy security is uncertain, and it faces challenges concerning carbon reduction in the future. For carbon reduction action, there are two main greenhouse gas reduction policies in Taiwan—the INDC, and the Greenhouse Gas Reduction Act. These two polices aim to reduce 20% and 50% of the greenhouse emissions of 2005 by 2030 and 2050, respectively. The carbon reduction targets are ambitious under the nuclear-free homeland policy and with the limited renewable energy resources in Taiwan. Consequently, a carbon tax is an effective and direct way to achieve the policy’s target. However, the carbon tax schedule in Taiwan is under consideration. In order to access the impact of the carbon tax and its corresponding measures (tax revenue recycling) on economic development, the environment, and income distribution under a comprehensive economic system framework, this paper employs a dynamic computable general equilibrium (CGE) model for Taiwan, which has been widely applied to the analysis and research on climate change policy from the past few years. The structure of this paper is organized as follows:
Section 2 is a literature review,
Section 3 describes the CGE model and database used in this paper, and
Section 4 presents our scenarios and simulation results. Finally,
Section 5 concludes the relevance between these incentives and policies.
2. Literature Review
The double-dividend effect is key for the success of green tax reform. Generally speaking, the double dividend comes with environmental tax revenue recycling to reduce other taxes. The first dividend is environmental improvement through the internalization of the external cost of pollution. The second is to reduce the excess taxation of current distortionary taxes. Oates [
3] suggests that the second dividend can be decomposed into two effects—income recycling and tax interaction—in a second-best theorem. Income recycling means the deduction of the existing tax rate to reduce the excess burden. The tax interaction effect represents the implementation of an environmental tax increase on production costs. As a result, commodity prices rise and reduce the real wage. A lower real wage lessens the labor supply and makes the real income worse. Bovenberg and Goulder [
4] indicate that the double dividend depends on the net effect of income recycling and tax interaction. If the effect of income recycling is greater than tax interaction, the double-dividend hypothesis occurs because of the taxation shifting toward the factors with less distortion.
In the empirical studies, Lin [
5] applies the CGE model to access the welfare impacts of fuel taxes on regional and socioeconomic groups in Taiwan. Lin [
5] finds that fuel taxes have an impact on the real income and the welfare effects of socioeconomic groups depending on the distribution of tax revenue. McKitrick [
6] shows that the abatement costs of carbon emissions can be reduced through the double-dividend approach in Canada. Also, the welfare and output reductions with carbon taxation can be removed. Zhang [
7] analyzes the carbon reduction policy in China using a recursive dynamic CGE model. The results also indicate that carbon tax revenue recycling can mitigate the impact resulting from the implementation of a carbon tax. Park [
8] accesses the double-dividend effect in Japan using a CGE model with involuntary unemployment. The double dividend appeals when tax revenue is used to lower the labor cost. André et al. [
9] estimate the effects of environmental tax reform in Andalusia in Spain. The occurrence of the double dividend depends on the options for tax recycling. Callan et al. [
10] analyze carbon tax revenue recycling for all household income levels in Ireland. Income distribution can be improved with an increase of social benefits from tax revenue.
Freire-González [
11] reviews a series of double-dividend- and CGE-related literature. There is no doubt that an environmental dividend can be achieved by environmental tax reform. However, the second dividend of economic efficiency improvement is still uncertain. An analysis of the past literature shows that about 55% of the related research reaches the double-dividend condition. It is also difficult to compare between these literatures due to different countries, the setting of variables, tax recycling schemes, and the model structure, etc.
3. General Equilibrium Model for Energy, Environment, and Technology (GEMEET) Model
This research employed a recursive dynamic general equilibrium model called the General Equilibrium Model for Energy, Environment, and Technology (GEMEET) which was jointly developed by the Institute of Nuclear Energy Research and the Center for Applied Economic Modeling in Chung-Yuan Christian University in Taiwan. The GEMEET model is based on the ORANI-type model [
12] with detailed specifications for renewable energy technology and sectors, environmental taxation mechanisms, and household income distribution. The model is formulated with the linear transformation technique of Johansen [
13], which transforms the original nonlinear equations with level solutions into linear equations of percentage change. This procedure simplifies the technique required for solving the equilibrium and makes it feasible for economists to develop and solve a more detailed model. Consequently, the solution can easily be reverted from the solution of percentage change to the solution of value without much trade-off in accuracy.
This model retains the basic features of a typical dynamic CGE model with several important extensions. These include (1) the detailed specification of major new and renewable energy equipment and power generation technology, such as bio-ethanol, bio-diesel, solar PV (photovoltaic), onshore wind power, offshore wind power, integrated gasification combined cycle (IGCC) with carbon capture and storage (CCS), etc.; (2) the taking into account of the learning effect, especially for new and renewable energy sectors, and specifying functions that link cumulative production and R&D investment with total factor productivity; (3) the econometric estimation of some key parameter values in the model [
14]; (4) the inclusion of the subsidy mechanism for power generation, such as the feed-in tariff scheme; and (5) the consideration of tax recycling and income distribution.
3.1. Model structure
The GEMEET model is solved by choosing the optimized output though the specific production function in terms of the cost-minimization assumption. For the basic structure (
Figure 2), the enterprises, government, and households are the major agents in the model. The enterprises produce commodities and services using intermediate and composite energy and primary factor inputs (
Figure 3). Each intermediate input can be divided into domestic production and imports. As for the composite energy and primary factor inputs, the energy input contains energy product and electricity, and the primary input includes labor, capital, and land. All the inputs mentioned above can be substituted with each other subject to the constant elasticity of substitution (CES) function.
represents the substitution elasticity of the CES production function. The elasticity reflects the degree of substitution relation between these inputs. Then, commodities and services can be sold to households, the government, other domestic enterprises, and the rest of the world. The constant elasticity of transformation (CET) function in the top of the
Figure 3 can depict whether the commodities and services are for domestic use or for the rest of the world.
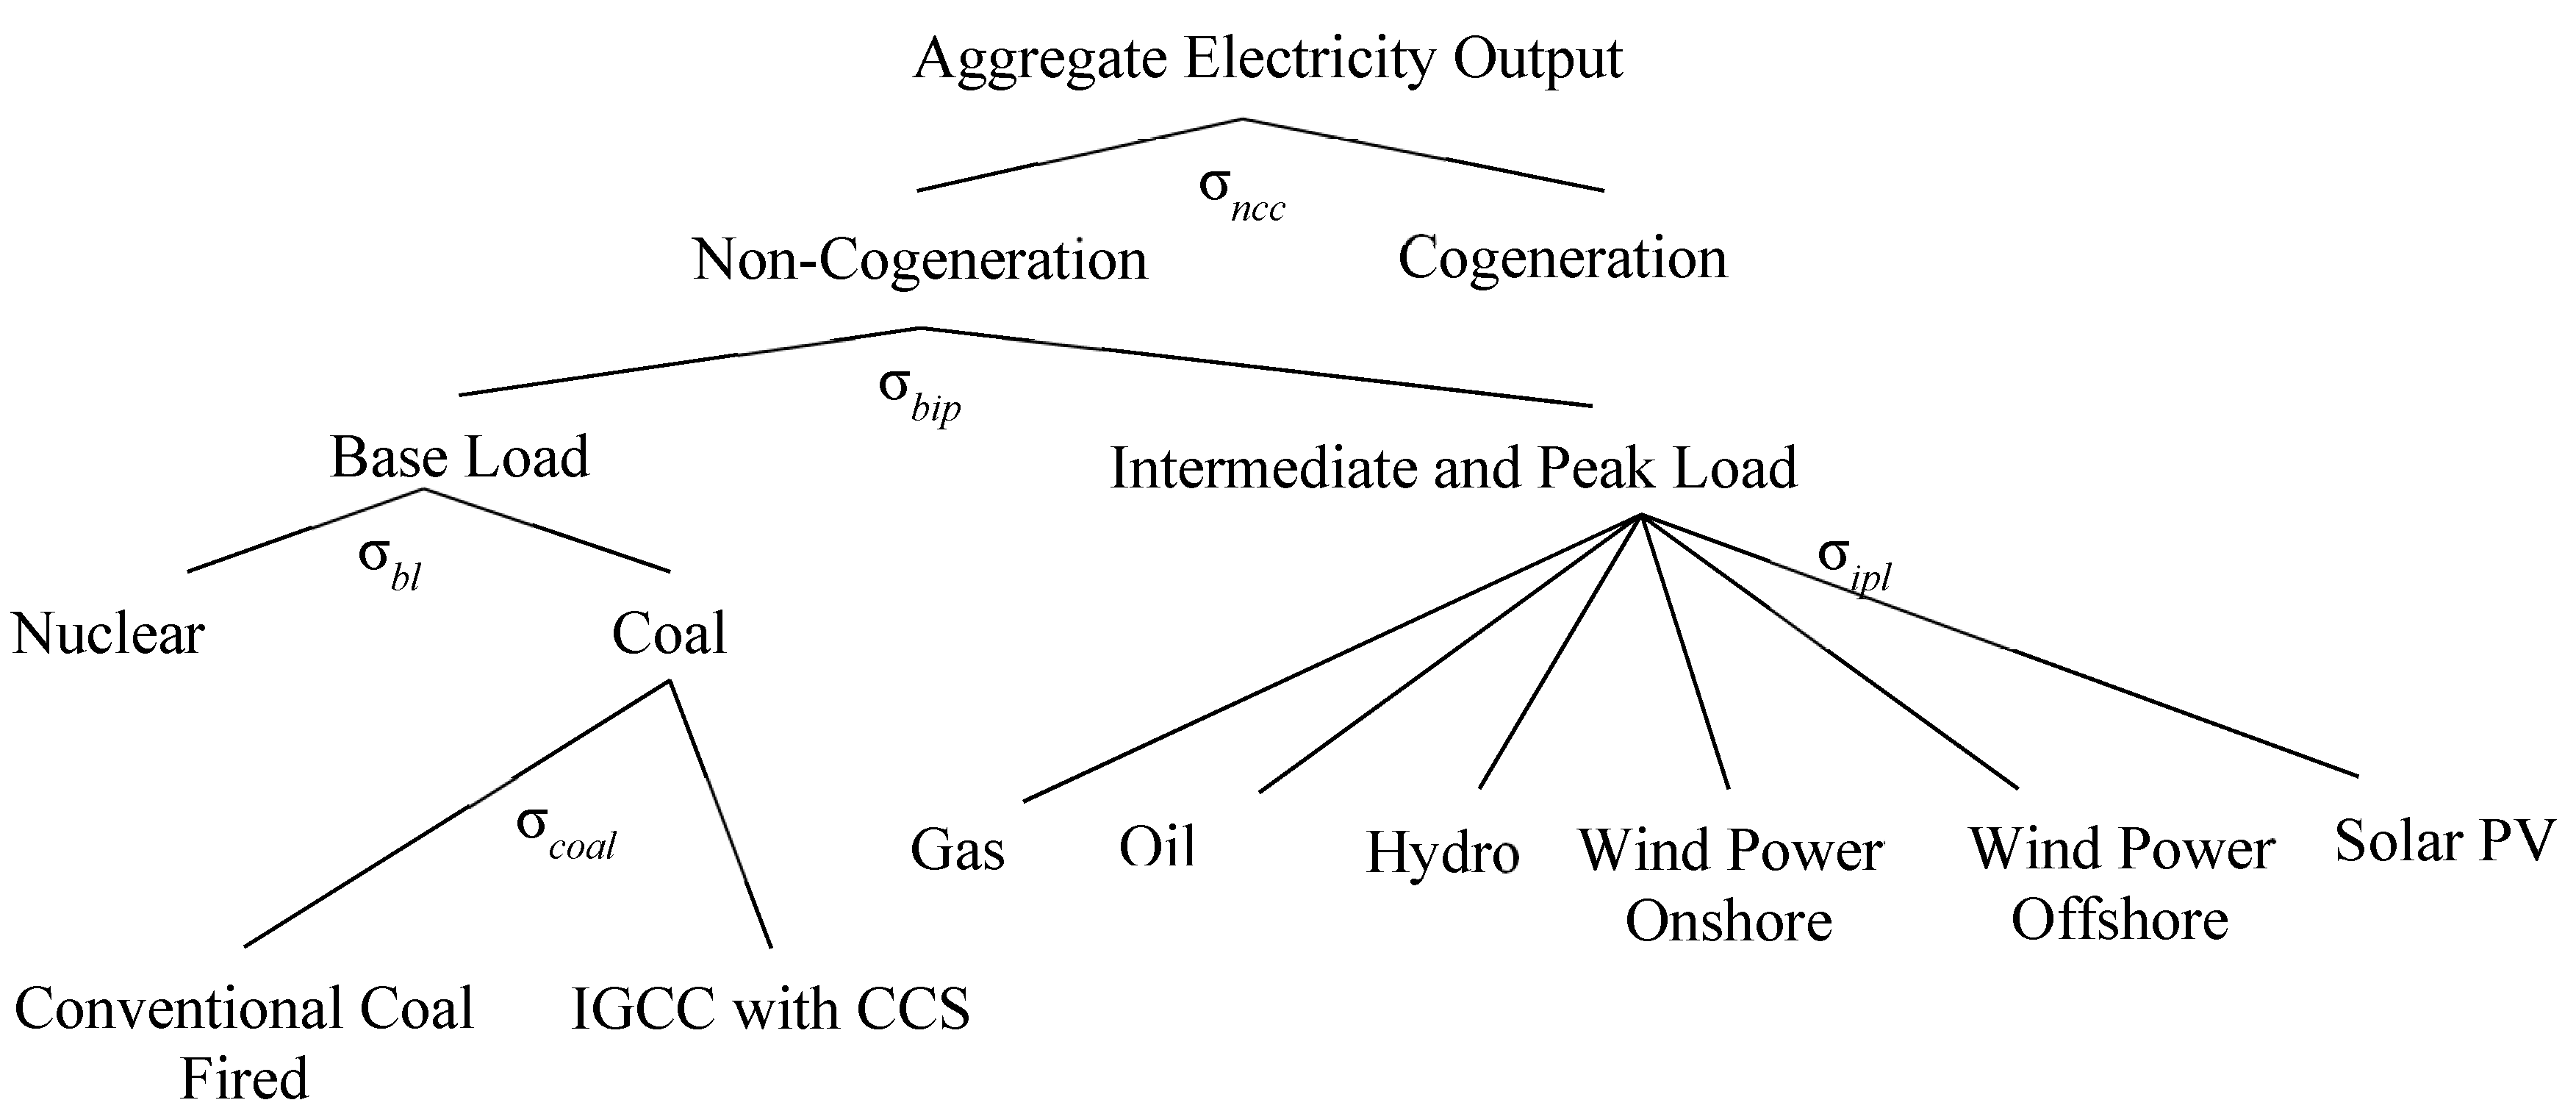
The model also covers energy products and electricity, as shown in
Figure 4. We also distinguished various electrical-power generation technologies in the model, such as nuclear, coal-fired, gas-fired, oil-fired, IGCC with CCS, hydro, onshore wind power, offshore wind power, and solar PV. These generation technologies were classified into base, intermediate, and peak load in the model based on their characteristics (
Figure 4). The base-load power had to meet the base demand of electricity through a stable and continuous power supply and be low cost compared to other power generations. To conform to the real-world situation of electricity generation, nuclear and coal-fired powers were categorized as base-load power, and the lower substitution elasticity was used instead of the intermediate- and peak-load nested structure.
To include some new and renewable energy sectors in the model, and to distinguish different types of refined petroleum products and different kinds of power generation technologies, we made adjustments to the tables supplementing them with some exogenously collected cost and sales data for industries. The total electricity generated is sold to the sole electricity distributor which distributes electricity to all other sectors in the economy.
In order to quantify the distributional impact of the carbon tax in Taiwan and simulate various ways of tax revenue recycling, we built a social accounting matrix (SAM)-based model with a disaggregated household sector and occupational labor. The main economic data we used to feed our model was a social accounting matrix for the Taiwanese economy. This was a square matrix that described the sectoral interdependence of production and sales. It also reflected the monetary flow arising from interactions among different agents in the economy for the specific year. In the GEMEET model, four main agents are identified: households, government, enterprises, and the rest of the world (ROW). The main roles of the four agents and saving equations in the GEMEET model are based on Corong and Horridge [
15]. Some adjustments were necessary to fit the categories of the national accounts and the input‒output tables in Taiwan.
Households—Households supply labor, consume goods and services, receive income from the supply of labor (different occupational groups), rent from capital, and make transfers between households and other agents. Households also pay interest, taxes, social insurance expenditure, transfer to others, and save from part of their total income. Generally, the heterogeneity of households’ income sources, expenditure, and consumption patterns result in the different impact by the implementation of the carbon tax.
Government—The main role of government is to collect and reallocate other agents’ income through taxes, subsidies, social insurance contributions, and transfers. In the GEMEET model, four taxes are classified: production tax (net value, taxes on production less subsidies); value-added tax (VAT) on products; tariffs (including taxes on import goods, special taxes on tobacco and alcohol, port and construction fees); direct tax on households and enterprises (including individual income tax, business income tax, and other current taxes, such as housing tax, estate tax, etc.). The government also buys domestic and imported goods and services, pays interest for government bonds, receives income from property and public utilities and saves parts of total incomes in a budget surplus.
Enterprises—Enterprises produce commodities with different inputs (labor, capital, energy, and intermediates) to maximize their profits. Their income from capital and government subsidies on production are used for corporate taxes, enterprise savings (retaining earnings), and transfer to households. There are 85 industries that product 85 commodities in the GEMEET model with detailed specification of major new and renewable energy equipment and power generation technology, such as bio-ethanol, bio-diesel, solar PV, onshore wind power, offshore wind power, and IGCC with CCS.
The rest of the world. Foreign sectors purchase domestically produced commodities (denoted as exports) and sell commodities produced in the rest of world (denoted as imports). The imported commodities are considered to be imperfect substitutes for domestic commodities by referring to the Armington assumption [
16] through a constant elasticity of substitution (CES) function of the domestic and imported commodities. They also pay VAT for consuming our exports, earn on domestic assets, pay capital income on overseas assets, transfer remittances by paying wages to national residents who work overseas, receive compensation from employees who work in Taiwan, and make other transfers between the ROW and domestic agents. The saving is the difference between remittances received from Taiwan and paid to Taiwan. It is equal to the negative value of Taiwan’s current account deficit.
3.2. Household disaggregation
To find out how changes in particular groups will affect the overall income inequality after imposing a carbon tax and revenue recycling, ten household groups, income sources, and expenditures were decomposed in the GEMEET model. More detailed household data were obtained from the Survey of Family Income and Expenditure (SFIE) in the Taiwan area conducted by the Directorate General of Budget, Accounting, and Statistics (DGBAS). The SFIE is produced annually and the samples included more than 15,000 households.
Based on the SFIE data, we began to scale up these households using the household weights provided by the DGBAS based on census demographic characteristics and then categorize each household into deciles based on their pre-tax income. We aggregated all households into a representative household for each decile to obtain the aggregate income by source and aggregate expenditure by category for each representative household. In order to decrease the sampling bias, we calculate a 3-year average (2011–2012) as the reference dataset of the SFIE data.
The second step was to disaggregate the household income and expenditure in the macro SAM into 10 groups. First, according to the categories of income and expenditure in the macro SAM, we established corresponding categories using a detailed dataset from the SFIE, shown in
Table 1. Second, we kept the aggregate income or expenditure in category
of a macro SAM constant (
) and disaggregated them using the share of household income or expenditure in category
by household group,
, as determined from the constructed SFIE dataset, (
). This was expressed in Equation (1),
where
represented a disaggregated household income or expenditure in category
by household group, indexing household groups as
,
, and income and expenditure categories as
,
.
Most of the shares were from the SFIE data. However, commodities categories for the consumption and industries categories for labor income could not be matched between the GEMEET and SFIE. For the consumption expenditure, we had to develop a new commodity classification for the reconciliation of the two data sets—the SFIE and our model. One hundred and five products or fees from the SFIE data were merged with the new classification and generated the share of expenditure by household decile across commodities for disaggregating 85 consumption expenditures in the SAM. For labor income, the manufacturing sector was aggregated in the SFIE data. Instead, we used the survey data of the Manpower Utilization Survey conducted by DGBAS to establish the share matrix of labor income by occupation type across the industries. According to the share matrix, we disaggregated the labor income from the SAM into occupation types and further distributed each labor income into all household groups based on the information from the SFIE data. Finally, we aggregated the labor income from all occupation types to make up the labor income by household group across the industries.
3.3. Data
The GEMEET model was benchmarked in 2011, as the latest updated input‒output table available for Taiwan is that from the year 2011. A macro SAM for the Taiwanese economy is shown in
Table 2. The core data were based on a combination of data from the national accounts data, input-‒output table, household survey, and the labor force survey. All data were collected from the Directorate General of Budget, Accounting, and Statistics (DGBAS) [
17]. There were 15 representative columns (denoted as payments) and 15 representative rows (denoted as income). The sum of each column was equal to the corresponding row sum.
Figure 5a,b show the structure of the income sources and consumption categories from the survey data. On the income sources side (
Figure 5a), there was a significant difference between households. A large proportion of the total income in the low-income group was from government transfers. Other incomes (most were transfers from individuals) also represented a much larger share of the income for the poor household group compared to the rich household group. Although the share of income from capital was similar across households, the lowest decile earnt 18% of the total income, while the highest received 24%. As for consumption, compared to the income sources, the consumption pattern was not significantly different between the households. Water, electricity, and energy were the smallest share of total consumption and showed less difference between households, as shown in
Figure 5b.
4. Scenario Design and Simulation Results
The GEMEET model is benchmarked in 2011, as the latest updated input‒output table available for Taiwan is that from the year 2011. Some important variables such as the GDP, households, exchange rate, and power generation mix are calibrated through a historical simulation from 2012–2017. The projection period is from 2018 to 2050. In the reference scenario, we assumed no carbon taxation in the future. The nuclear power plant will be gradually phased out in 2018, 2023, 2024, and 2025 according to the nuclear-free homeland policy in Taiwan. The targets of renewable energy were also considered in the reference scenario. The policy targets for PV, onshore wind power, and offshore wind power are 20 GW, 1.2 GW, and 3 GW, respectively, by 2025. After 2025, referring to Huang et al. [
18], the potential capacity for PV and offshore wind power are larger than the policy target for 2025. Consequently, we assumed that PV and wind power offshore will reach the potential capacity of 30 GW and 9 GW, respectively, in 2050. The nominal international energy price is exogenous in the GEMEET model and estimated with an econometric method based on the projection of the International Energy Agency [
19].
Figure 6a–c shows the setting of the nominal international energy price. The autonomous energy efficiency improvement (AEEI) is assumed to be 1% annually. Total factor productivity is assumed by industry according to the historical yearly average (2009–2016). The policy scenarios were the same as the reference scenario except for some assumptions with different scenarios. The detailed assumptions for each policy scenarios were as follows:
Carbon tax with no tax revenue recycling (CTN): The implementation of the carbon tax starts from 2019 to 2050. Differently from the other research, the carbon tax in this paper was calculated backward based on the total labor income tax deduction. The carbon tax revenue for each year assumed 38% of the total labor income tax of the reference scenario for the corresponding year. The carbon tax in policy scenarios in the future was decided by using the revenue divided by the CO
2 emissions (
Figure 6d). To keep tax neutrality, carbon tax and the total value of revenue recycling were the same for each policy scenario. No carbon tax revenue recycling into household and enterprise existed in this scenario.
Labor income tax reduction with the same proportion (LIRSP): In this scenario, we assumed that each household decile had the same proportional labor income tax deduction of 38% each year.
Labor income tax reduction with different proportion (LIRDP): Similar to the second scenario, this scenario also focused on carbon tax recycling to labor income tax. The proportion is shown in
Table 3. Although the proportion was different with the second scenario, the total tax revenue recycling was still the same with tax neutrality.
Household transfers by government (HTG): In this scenario, the total carbon tax revenue was distributed to household groups according to the share shown in
Table 4. The low-income groups obtained more subsidies from the government. The poorest household decile got 40% of the total carbon tax revenue and decreased in order. The 6th to 10th household deciles had no subsidies from the government.
Production tax deduction and household transfers by government (PTXHTG): The total production tax of energy for enterprise was offset in this scenario. Because the total production tax of energy is about one fourth of the carbon tax revenue, the rest revenue was assumed to subsidize the low-income group according to the share in light of the fourth scenario.
Under the assumptions in the reference scenario, the results of real GDP and economic growth were as shown in
Figure 7. Economic growth in Taiwan decreased from 2.6% to 1.25% from 2018 to 2050,and real GDP was about 2.6 trillion NTD (New Taiwan Dollar) in 2050. With the growth in the economy, the emission of carbon dioxide increased in the future (
Figure 8). Notably, before 2025, the emissions grew faster than after. Due to Taiwan’s geographical characteristics and limited natural resources, its energy supply relies heavily on imported fossil fuels, which cater for over 90% of the country’s energy demand. The international energy price has a great influence on the domestic energy demand. For the projection of the international energy price in this paper (
Figure 6a–c), the coal price was almost in stagnation along with the rising trend of oil and LNG (Liquid Natural Gas) prices before 2025. The increasing demand for coal, because of its lower price compared to that of other fossil fuel energies, may result in a rapid ascent of carbon emissions. The power generation mix (
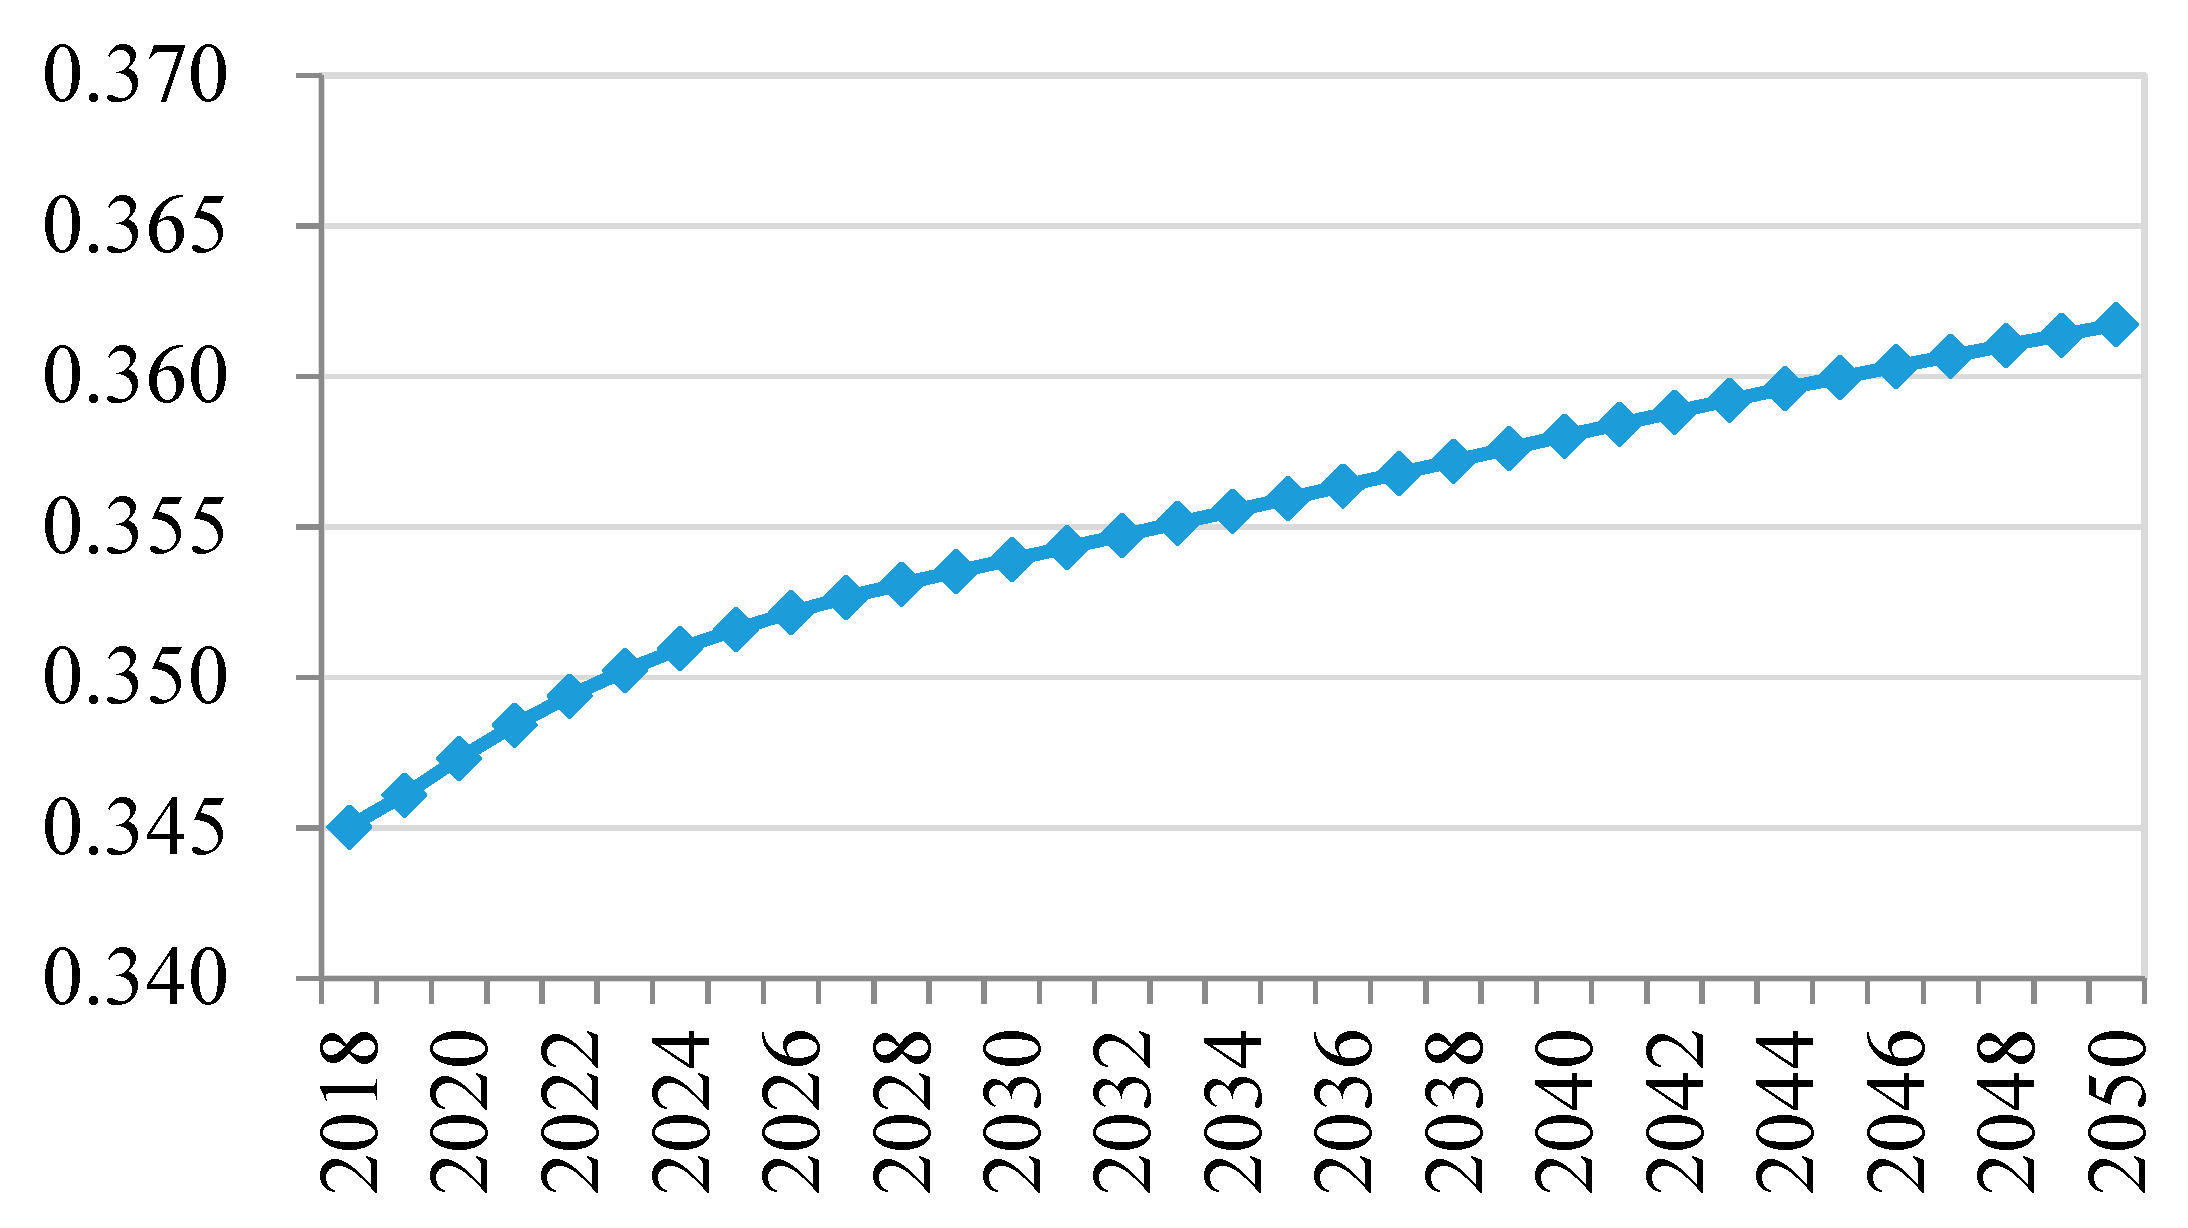
Figure 9) showed the same pattern with the trend of international energy price. This paper also measured the dispersion of income distribution through the GINI index. Using the GINI index in the reference scenario (
Figure 10), the income distribution tended to become slowly unequal in 2050.
Figure 11 shows the percentage changes of the real GDP in each policy scenario relative to the reference scenario. The carbon tax would have more impact on the whole economy without the deductions of other taxes. The costs of energy products increased for all industries and households and caused a drop in the outputs of all productive activities with no tax recycling. By offsetting the labor income tax with the carbon tax revenue, the increasing disposable income would stimulate household purchasing and the real GDP would be raised through the industry linkage effects. However, if carbon tax revenue was used to subsidize the low-income group, it would not be significant for the improvement of the economy when implementing the carbon tax. As for the deduction in production tax, for enterprise, the reducing cost of energy input raised the total output. In the meanwhile, the rest of the tax revenue was used for transfer from government to low-income households. The real GDP in Taiwan would have a minor improvement after 2035 relative to the reference.
Concerning the environmental aspect (
Figure 12), the reduction of CO
2 emissions in each policy scenario was very similar. From 2020 to 2050, the percentage changes in CO
2 emissions relative to the reference scenario were between −6% and −16%, whether the tax revenue was used to recycling or not. For climate change mitigation action in Taiwan, there are two main greenhouse gas reduction policies, the INDC and the Greenhouse Gas Reduction Act. These two polices aim to reduce 20% and 50% of the greenhouse emissions of 2005 by 2030 and 2050, respectively. Comparing the policy targets with the results (
Figure 13), it was shown to be impossible to achieve the emission targets with the carbon tax assumed in this paper. More carbon tax, low carbon technology, or demand-side management in energy are needed to meet the reduction target. Alternatively, it means the INDC and Greenhouse Gas Reduction Act policy targets in Taiwan are too high, especially under the nuclear-free homeland policy and with the limited renewable energy resources in Taiwan.
Figure 14 shows the percentage changes in the GINI index relative to the reference scenario. The carbon tax progressed slightly with no recycling because the carbon tax had more impact on high-income-level households. The income source of high-income groups came more from the enterprise revenue and capital gains than that of the low-income groups. Additionally, energy related firms belong to capital-intensive industry. The implementation of the carbon tax affects these enterprises directly. For recycling into labor income, the income distributions were very different depending on the proportion of the deduction for the household group. For the average deduction to all groups, the income distribution could worsen after 2040 because the high-income decile gained more. However, for more deduction on low-income level, the GINI index had a significant improvement over time. Obviously, transfer direct to the low-income group had the strongest effects on income distribution.
5. Conclusions
In recent years, environmental issues have become more important for nations all over the world. As a result, many climate negotiations have made many countries regulate their carbon emissions. Carbon tax is a powerful tool for cutting carbon emissions directly through the internalization of the external cost of pollution. To prevent the impact of carbon taxation, green tax reform is necessary for a double-dividend approach. The spirit of green tax reform is to recycle tax revenue using other taxes, subsidy, and transfer. In 2018, more than a quarter of global greenhouse gas emissions have been put the price on carbon, about half of the global economy [
20]. However, carbon tax policy is still in consideration in Taiwan today. To access the effect of carbon tax and tax revenue recycling, this paper adopts a recursive dynamic CGE model—GEMEET under a comprehensive economic system framework. The GEMEET model has several important extensions with detailed specifications of new and renewable energy and the consideration of tax recycling and income distribution. This paper also designs several policy simulations with different carbon recycling mechanisms to estimate the effects of economy, environment, and income distribution by some proxy measures.
The results show that the carbon tax has some impact on the economy without the deduction of other taxes in the CTN scenario in
Figure 11. With more labor income tax reduction in low-income groups, there will be a significant improvement to the real GDP in LIRSP and LIRDP, as shown in
Figure 11. Concerning the environmental aspect (
Figure 13), the abatement effects are similar across all scenarios. However, comparing the policy targets with the results, it is impossible to achieve the emission targets with a low carbon tax. Nordhaus [
21] suggests that a global carbon tax of 142 USD per ton of CO
2, (or the equivalent in 2025)—which is higher than the carbon tax in this paper through the RICE (Regional Integrated Climate-Economy) model—is needed to keep below 2 °C of warming. More carbon tax, low carbon technology, or demand-side management in energy are needed to meet the reduction target. Alternatively, the INDC and Greenhouse Gas Reduction Act policy targets in Taiwan should be adjusted under the nuclear-free homeland policy and with the limited renewable energy resources in Taiwan. For income distribution (
Figure 14), the results can be very different based on the different recycling approaches. Transferring directly to low-income households could have a better income distribution than others (HTG scenario in
Figure 14). Overall, a suitable recycling mechanism is the key factor for the success of green tax reform. In this paper, we suggest that carbon tax recycling into labor income taxes with more to the low-income household group could have a significant improvement on the economy, environment, and on income distribution, simultaneously.


