Abstract
Community resilience is a key index for describing the response of human habitat systems to hazards. Evaluating and enhancing the community resilience requires indicators, identification, and quantitative measurements, especially for urban flooding management. In this study, an advanced index framework for measuring community resilience to urban flooding is proposed, integrating the fuzzy Delphi method (FDM) and the analytic network process (ANP). Seven indicators (public facilities, spatial structure of land use, flood management organizations, rescue capability, accuracy of weather forecasts, vulnerable population, and individual capability) of community resilience are identified using the fuzzy Delphi method. The indicators are classified into four dimensions, and the weights are determined by the analytic network process. This approach is applied to three different types of communities, namely, a newly built neighborhood, an ancient college, and a flood-prone village in the city of Nanning, China, using data collected from questionnaires, interviews, and field investigations. The neighborhood (with a total averaged score of 2.13) has the largest community resilience to urban flooding, followed by the college (1.8), and finally the village (0.91). Flooding management organizations play a leading role in the urban flooding resilience of the neighborhood and college, while the vulnerable population has a great impact on the community resilience of the village. Results of the strategy analysis suggest that science and technology improvement (0.543) is more important than social–economic status improvement (0.325) and built-environment improvement (0.132) for mitigating urban hazards in Nanning. The proposed framework in this study contributes to the interdisciplinary understanding of community resilience for urban flooding and is expected to be applied to sustain urban planning and flood evacuations.
1. Introduction
Due to a changing climate and urbanization, natural hazards are becoming more and more intense and frequent, having devastating impacts on lives and infrastructure [1]. According to the Annual Flood and Drought Hazards Report of China, the direct flood damage in 2016 reached 364.3 billion Chinese Yuan, and 192 cities were involved in flood events [2]. Flooding risk mitigation requires studies associated with flooding hazards [3,4,5] and flooding risk management strategies combining hazard, exposure, and social vulnerability [6,7,8], as well as the response and resilience of communities.
A community generally refers to a group of individuals in a shared geographical area who are linked by dynamic socio-economic interactions and engage in collective actions [9,10]. Resilience is widely recognized as the ability of a system to respond to and recover from disasters and to absorb the impacts as well as cope with an event [11]. Community resilience is the capacity of a community to resist disasters and to take alleviating actions that are consistent with achieving the expected level of protection [12]. If a community can respond and recover from a hazard event and return to normal quickly, with good preparedness to reduce disaster losses rather than waiting for an event to occur [13], it is recognized as having a high resilience level. As a novel concept of disaster risk reduction (DRR), community resilience is widely used to resist disasters and maintain security in various aspects of fiscal, social, cultural, and environmental problems [14]. However, not all communities have the capability for resilience when facing hazards. The ability to absorb, recover from, and adapt to the hazard events varies, and the system may have different levels of vulnerability. Vulnerability is another conception of disaster risk reduction, which reflects the likelihood of damage, and is related to the exposure and sensitivity of the system [15]. Moreover, vulnerability is related to the components of risk, shown as “risk = hazard × vulnerability” [16]. Resilience analysis refers to the speed of returning to equilibrium after hazards, whereas vulnerability analysis refers to the susceptibility to hazard events in a dynamic system [17,18]. In detail, even if hazards in the communities are recognized, risk reduction and vulnerability often are not salient concerns until after the disaster occurs. Prior to that, assessing the community resilience is essential.
As a new wave of research has demonstrated, community resilience explores the leads for integrating systematic risk into urban planning [19]. Different types of human settlements, such as villages, towns, and cities, might experience a different level of loss due to the same hazards; thus, urbanization is considered a potential characteristic of the risk [20]. To reduce the impacts of urban flooding on a community, people make efforts to enhance the community resilience by establishing an alarm system, conducting evacuation drills and implementing mitigation measures [21]. The level of resilience is affected by a series of factors, which can be conceptualized and expected to function as indicators for constructing community resilience [22]. For instance, community resilience to natural hazards consists of the economic level, social capital, information and communication, organization ability dimensions [23], collective activities, and reorganization ability, which can all make a difference in enhancing resilience [24]. However, limited attention has been paid to evaluating the resilience of communities with different types or to assess the corresponding hazard mitigation strategies.
A comprehensive assessment framework of community resilience usually involves analytic methods to distinguish the critical indicators with weights. According to previous studies, various methodologies have been used to rank and prioritize indicators, including the Delphi method [25], analytic hierarchy process [26], and the analytic network process [27]. These methodologies are conducted based on experts’ decisions and content analysis, which establishes the quantitative indicator systems through collecting data from the previous literature. Enhancing community resilience to urban floods requires multiple decisions to evaluate the potential resilience at the scale of the community, as well as to diagnose the strategy in risk management. The integrated model has been improved to be effective to measure a multi-layer community resilience system [28,29].
As communities vary in their size, density, and heterogeneity, the resources that could be used and the emergency situations that might be faced are different. Therefore, in this study, the community resilience to urban floods in difference types of communities is discussed, and corresponding hazard mitigation strategies have been drawn up. Moreover, using the data collected by investigation, an integrated approach using fuzzy-Delphi and analytic network process (ANP) methods is proposed, by which the complicated and multiple indicator system could be simplified, and the interdependence between indicators and dimensions could be considered. The objectives of this study include: (i) proposing an improved and simplified indicator system concerning regional urban flooding, (ii) quantitative identification of the priority of community resilience indicators in different types of communities, and (iii) providing policy implications to enhance the community resilience to urban floods and to better reduce disaster risks. These findings are expected to provide scientific guidance for risk management of and strategic decisions for urban floods at the community scale.
2. Materials and Methods
2.1. Study Area
Nanning is located in the south of China, with an annual average rainfall of about 1300 mm. Yong Jiang River is the largest river in this city, with an annual average runoff discharge of 4.18 × 10⁷ m3. According to historical data, there were 19 urban flood events with peak flow discharges of more than 1.11 × 10⁴ m3/s from 1907 to 2000. For example, the rainstorm hazards in July of 2006 resulted in large areas of waterlogging in Nanning, that is, 66 streets were flooded with 0.5–3 m depths of water, leading to a huge economic loss and serious environmental and social problems. In terms of the social development degree, the three communities that are selected as the study area in this paper (Figure 1) are (A) Guangxi University of Chinese Medicine, (B) the Zhuhu village and (C) the Daxuenan neighborhood. Guangxi University of Chinese Medicine is an old community with historical buildings; it is regarded as a key waterlogged point in Nanning city due to its poor drainage and low-lying land; contrarily, the Daxuenan neighborhood is a newly built community located prone to Xiangsihu River, with a brand-new drainage system and smart layout, and the Zhuhu village is a remote community that continually suffers severe waterlogging, which causes misery to the villagers. Thus, the three selected communities are of different types, with different drainage facilities and different flood defense standards, and are confronted with the different challenges of urban floods.
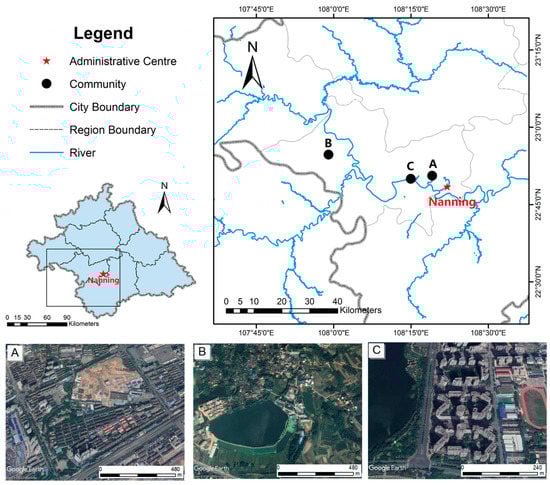
Figure 1.
Study area, A: Guangxi University of Chinese Medicine; B: the Zhuhu village; C: the Daxuenan neighborhood.
2.2. Data Collection
In this study, questionnaires, interviews, and field observations are used to collect individual responses. A well-designed questionnaire is the prime process in the investigation. The questionnaire used in this study was designed based on the related literature by our group members. Firstly, the questionnaire was pretested by undergraduate students studying hydrology and water resources engineering as a major at Sun Yat-sen University and by experts in the field of urban flood hazards. With the comments from the pretest, we modified several question options and confusing questions. Then, the formal questionnaire was finally established, which contained 18 questions. In the first part, the demographic factors age, occupation, educational background, health condition, and income were collected, which related to the indicators of the vulnerable population and individual capability. In the second part, some more questions were investigated, such as “Q6: What would be your effective way of escape if you are caught by urban floods?”, which is related to the indicator of rescue capability, and “Q11: Do you have any knowledge on preparation or prevention of urban flood hazards?”, related to the individual capability. Each indicator of community resilience could be derived from the investigation, and it took nearly 10 min to complete the questionnaire. The investigation was conducted on March 2018 in the study area.
To determine the sample size of questionnaires, a simplified formula was applied [30] as follows:
where n is the smallest sample size, N is the total population in the study area, t is the probability degree. According to the correlation table, t equals 1.96 at a 97% degree of probability. p represents a rounded number, p = 0.5. Δp is acceptable error, Δp = 6%.
The populations of the Guangxi University of Chinese Medicine, the Daxuenan neighborhood, and the Zhuhu village were 10,000, 5400, and 5012 people, respectively. Questionnaires were handed out at the Guangxi University of Chinese Medicine and the Daxuenan neighborhood; the total population of the two communities was 15,400. The formula produced a value of “n = 263” with an error acceptance value of 6%. Therefore, the proportional samples for the university and the neighborhood were 171 and 92, respectively. As for the Zhuhu village, as many villagers are illiterate, we performed face-to-face interviews in typical households. Thus, data collection was based on door-to-door surveys, electronic questionnaires, and face-to-face interviews.
At the beginning of the investigation, a brief introduction described the objectives of the study and highlighted that participating and completing the questionnaire were voluntary and could be terminated at any time. It was also clearly stated that the questionnaire was completely anonymous. The questionnaire included a comprehensive sociodemographic background of the respondents, such as gender, age, education, occupation, income, etc. The community resilience factors, for example, social trust, rescue capability, local authority decision, and community functioning, were also included in the questionnaire. For each respondent, we calculated the average as the indicator score.
2.3. Measurement Method
Community resilience will be the strongest where the different domains intersect. Communities may not be fully resilient, as some of the elements in the community resilience framework contribute to vulnerability. Building on previous resilience studies [31,32], urban resilience can be understood in the aspects of ecological resilience, economic resilience, and social resilience. Certain studies have shown that resilience to urban disasters is related to the urban organization and government, as well as residents’ perception of risk. Some frameworks and evaluation tools have been developed by governmental organizations and academic researchers that are focused on different fields and may not be appropriate for other study areas due to the differences in local needs and conditions.
Sharifi (2016) established the disaster resilience indicators for the Tan-sui River, which is located in the Taipei metropolitan area surrounded by lakes and rivers and suffers from frequent typhoons and floods, as it is affected by the monsoon climate. With similar natural and social conditions, five dimensions including 13 indicators were identified as the original framework in this study, which are the same as those in reference [33]. In order to assess the community resilience to urban floods, a framework with five dimensions is adopted in this study, including science and technology (ST), the built-environment (BE), organization and institutes (OI), the natural environment (NE), and social–economic status (SE). The indictor system has a multi-hierarchy, as a simplified and new framework of indicators is proposed in this study. Assuming all the dimensions are interdependent, the original framework is shown in Figure 2, which is based on reference [33]. For example, if the resilience of science and technology is promoted, the performance of the built-environment, organization and institutes, the natural environment, and social–economic status would be increased; thus the arrow points from ST to BE, OI, NE, and SE. The relations are displayed similarly in other dimensions; thus, the two-way arrows are marked in Figure 2. The key advantages of this framework include the following: it is a complex network with close interlinkages between the five dimensions and it can be applied to any community.
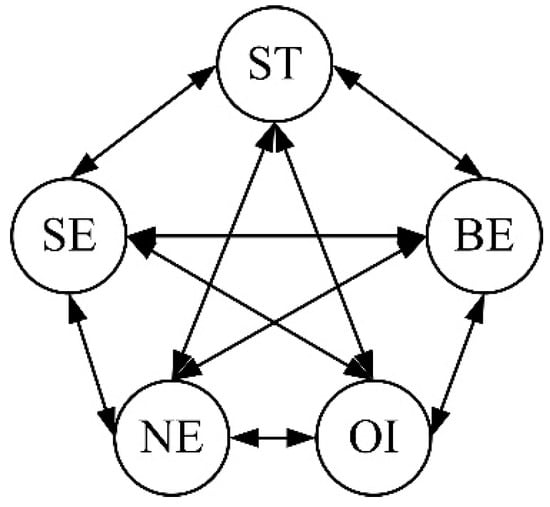
Figure 2.
Original framework of community resilience. Science and technology (ST), the built-environment (BE), organization and institutes (OI), the natural environment (NE), and social–economic status (SE).
The definition of five dimensions, the sub indicators of each dimension, and the introduction of data resources are shown in Table 1, which is also based on the work in [33]. These indicators in Table 1 are described as follows: Self-rescue capability (ST1): The capability of relief and self-rescue of the community and neighbors; Accuracy of weather forecasts (ST2): The forecasts and preparedness capacities in a community; Public facilities (BE1): Urban infrastructure systems covered in a community; Spatial structure of land use (BE2): Spatial structures in the community; Disaster prevention plans (OI1): Family plans to prevent urban floods; Related management organization (OI2): Capacity of risk management and the decision process in urban flood hazards; Resource distribution capability (OI3): The capability of flood control and regulation in the areas of the community; Environmentally sensitive area (NE1): Flood-prone area; Water resource conservation (NE2): Area of water conservation plan; Slope area conservation (NE3): Area of slope conservation plan; Vulnerable population (SE1): Elderly residents or children, low income, low education, and hospitalized population in the community; Individual capability (SE2): Social and economic capability of neighbors with respect to emergency response and recovery; Government’s financial capability (SE3): The local government’s financial capacity to cope with urban floods.

Table 1.
Indicators of community resilience to urban floods.
Figure 3 shows the framework of the integrated model in this paper. The dimensions and indicators of community resilience to urban flood are identified first based on the common framework and fuzzy Delphi method (FDM). Then, an evaluation network is constructed with selected indicators. Afterward, the weights of the urban flood community resilience indicators are computed using the analytic network process (ANP) and finally, the ranking of community resilience indicators is generated, as well as the importance of strategies.
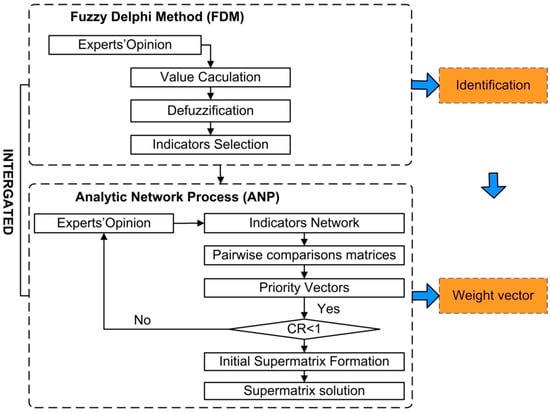
Figure 3.
Integrated method of FDM and ANP.
2.3.1. Indicator Selection by FDM
To identify the evaluation indicators in community resilience to urban floods, the fuzzy Delphi method is used in this paper. Since the traditional Delphi method was first developed, it has been widely used in decision making and group consensus in various areas [34]. However, the Delphi method may involve uncertainties, which could be reduced by fuzzy theory [35]. Hence, FDM has been applied to combine participants’ viewpoints, as these can provide more objective and reasonable results [36,37].
The procedure to create a series of impact factors as evaluation criteria of community resilience using FDM is as follows:
- Experts’ judgments on 13 indicators within a common framework are produced using semantic variables in questionnaires. To minimize the differences caused by subjective judgements on marking, experts should provide both a possible lowest and a possible highest value using score from 1 to 10, rather than just a random number. The low and high values should be stored for each factor.
- Based on questionnaires and face-to-face survey data, the minimum values αi, geometric mean ave βi, and maximum values γi are calculated, so the evaluation value of the i-th indicator is (αi, βi, γi), i = 1, 2, 3, ….
- To obtain the final value of indicator Si, an appropriate defuzzification measure is selected. There are several defuzzification measures which display the intuitive and reasonable characteristics of fuzzy theory, such as centroid, bisection, or maximum. Since the evaluation value of the indicator is dependent only on three parameters (αi, βi, and γi) in this study, in order to simplify the calculation, a simple center of the gravity method is applied for defuzzification:
- Set a threshold ρ to select the more important indicators from the common framework system for community resilience to urban floods. If Si ≧ ρ, the i-th indicator is retained, and if Si < ρ, the i-th indicator is abandoned.
2.3.2. Weight Calculation by ANP
The analytic network process evolved from the analytic hierarchy process (AHP), which is applied to assign weights to the selected dimensions and indicators. AHP provides weights to indicators by creating pairwise dimensions and indicators, without considering interdependent relationships among dimensions. To deal with the uncertainty of the interdependence of indicators and a complex network relationship of dimensions, ANP can be used to determine the mixed weight [38,39], which makes the evaluation model approximate the reality of community resilience to urban floods. ANP can be described as follows:
- Extracting the features of a problem: Analyzing community resilience that is abstracted as interdependent indicators. Specifically speaking, it is decomposed into different dimensions, and a rational network is constructed by quantified correlations.
- Pairwise coupling of the comparison matrices of dimensions and indicators: Decision indicators for each dimension are compared pairwise with respect to their importance for the same dimension, and the dimensions themselves are also compared pairwise regarding to their contribution to the resilience. The relative importance values are determined by Satty’s scale as in AHP (Table 2), and then the priority vector can be calculated.
Table 2. Satty’s scale.
- Checking consistency: The consistency index (C.I.) and consistency ratio (C.R.) are calculated.where λmax is the maximum eigenvalue of the comparison matrix, n is the order of the comparison matrix, and R.I. is the average random index based on matrix size. All the comparison matrices are required to pass the test with C.R. < 0.1; otherwise, the comparison matrices must be performed again.
- Initializing supermatrix formation and supermatrix solution: The supermatrix is formed with the obtained local priority vectors and matrices from step (ii), a weighted supermatrix is derived by transforming all columns to sum to unity, and then the weights are calculated by long-term stable weighted values.
3. Results and Discussion
3.1. Investigation Results for the Three Communities
The investigation results of the university and neighborhood communities show the response options in the questionnaires (Figure 4). The total average score was calculated, i.e., 1.8 for the university and 2.13 for neighborhood. The interview records and indicator marks were analyzed for the village, and the total average score was 0.91. Guangxi University of Chinese Medicine had the best resilience in the ST, OI, and SE dimensions, as it is located in an urban area, where the infrastructure has a relatively high quality, and governments provide sufficient rescue once an urban flood occurs. However, this area is not that resilient to the BE and NE dimensions due to its limited pace, flat terrain, and dense buildings. The Daxuenan neighborhood has advanced drainage systems and high elevation, which alleviate the occurrence of severe waterlogging. The Zhuhu village, whose disaster defense construction is still weak, suffers poor resilience in terms of most of the indicators. The priority of community resilience is as follows: the Daxuenan neighborhood, followed by the Guangxi University of Chinese Medicine, and the Zhuhu village, which is relatively weak at recovering from an urban flood.
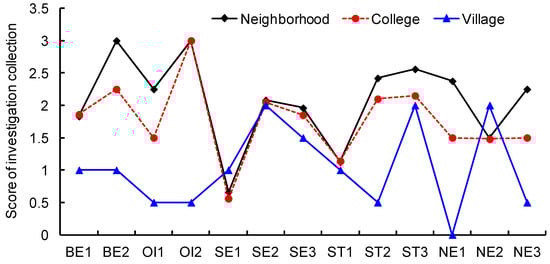
Figure 4.
Score of investigation of the three communities in the study area.
3.2. Evaluating the Indicator System of Community Resilience to Urban Floods
In order to construct an evaluation indicator system of community resilience to urban flooding, we analyzed the indicators ST, BE, OI, SE, and NE, as shown in Figure 1. However, as some indicators in this community resilience system are not necessary when applied to urban floods, a simplified community resilience system is required to reduce management resources and performance. The fuzzy Delphi method was adopted to determine the indicators for a community resilience system for urban floods. Based on the results of questionnaires and interviews in the three communities, the scores of indicators were classified into seven levels: 0, 0.5, 1.0, 1.5, 2.0, 2.5, and 3.0. Then, the total scores of indicators were calculated, as shown in Table 3. For BE1, for example, the responders would be asked “Q7: What do you think of the impact on public facilities in your community when urban flood hazards occur? (i) the impact is quite slight, (ii) public facilities may include waterlogging, which would temporary restrict daily life, (iii) damages and loss would likely occur, or (iv) severe damages and loss would very likely occur”, and the responders were required to tick one of the items as their response. Information on several public facilities had been collected by material review, such as houses, roads, water supply, and power supply, Different communities were confronted with the different challenges of public facilities; the investigators would mention the information when they conducted the questionnaires or interviews. These four items were marked with scores of 3, 2, 1, and 0, respectively.
Table 3.
Indicators of community resilience to urban flooding using FDM (ρ = 1.7).
The samples in different communities were collected, and the total score was calculated by the average value. Thus, the final values of BE1 were 1.83, 1.86, and 1 in the neighborhood, college, and village, respectively. If a threshold is set in the interval between 1.6 and 1.7, an obvious cluster of indicators could be detected, shown in Figure 5 and Table 3. In other words, the same simplified indicator system would be generated, irrespective of the value set in the interval between 1.6 and 1.7. Therefore, the indicator system of community resilience would be determined and would display consistency. If a decision-maker requires more indicators, the threshold ρ can be set smaller, and vice versa [27]. With comprehensive consideration of the responders’ linguistic scale and the decision-makers’ efficient management of the community resilience system, seven indicators were accepted in this study, where we set the threshold ρ = 1.7. As shown in Figure 5, the blue bar represents the selected indicators, and the yellow bar represents the abandoned indicators. This process can help local governments to better manage urban flooding risks and better understand the predominant elements of community resilience to urban floods.
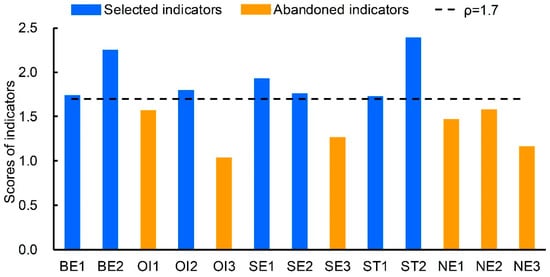
Figure 5.
Selected indicators of community resilience to urban flooding (ρ = 1.7).
3.3. Indicators of the ANP Model of Community Resilience to Urban Flood
A simplified network of community resilience indicators was proposed based on evaluation of the indicator system of community resilience to urban flooding. As shown in Table 3, all the indicators of the natural environment dimensions are abandoned. If we take the NE dimension as an exterior dimension as a pressure driver, there are four dimensions remaining in this simplified framework, which are the BE, OI, SE, and ST dimensions. To describe the interdependent relationships of community resilience indicators in different communities, we suppose the interdependent relationships exist both within dimensions and among dimensions in this study; thus the ANP network model of indicators was constructed, and the interdependent relationship between selected indicators was established.
In this study, the four dimensions in the simplified network have no interdependence with each other. The normalized weights were computed and are listed in Table 4. The comparison matrices pass the test with C.R. < 0.1. Then, seven indicators of the simplified evaluation system were compared in the three different communities, and experts were asked “considering the satisfaction of indicator BE1, what is the relative impact of all the indicators on each other?”, and the question was applied to BE2, OI, ST1, ST2, SE1, and SE2 for the three different communities. In order to ensure that the results are reliable and efficient, six experts were selected in this study, including two in the field of flash flood management, two from the hydrology governmental agency, and two from the local community management agency. In the next stage, the supermatrix for compatibility [40] was formed to converge to a long-term and stable set of weights, which presents the results of relative importance, as shown in Appendix A and Appendix B, the supermatrix for compatibility after convergence. Finally, the overall normalized weights of evaluation indicators in the neighborhood, college, and village community were obtained, as listed in Table 5, and a comparison of resilience indicators in communities is shown in Figure 6.
Table 4.
The normalized weights of the four dimensions.
Table 5.
Weights of the three communities with respect to resilience indicators.
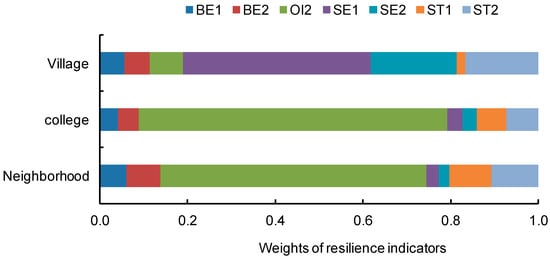
Figure 6.
Comparison of resilience indicators in communities.
In this study, the built environment dimension was set to test the strength of public facilities and land structures that can defend against water flushing and soaking. The public facilities indicator of the neighborhood reached 0.061, which indicates that an instant heavy rainstorm might generate small-scale waterlogging to impact people’s movement. The village had a lower resilience in terms of the public facility (0.057) and spatial structure of land use (0.057), that is, natural, as in large areas there is farmland and most houses are made of bricks. Once an urban flood occurs, crops would be destroyed, and bricks would be damaged easily. The college had the lowest level of the built environment dimension, i.e., 0.042 for public facilities and 0.047 for the spatial structure of land use. This is because the ancient buildings in this college are made of bricks, as it is in the village; moreover, some areas of the college are under construction, which influences the built environment of community resilience, although new urban planning is going to be covered in the future.
The organization and institute dimension refers to disaster prevention plans. The neighborhood and college had a high level in OI2, with weights of 0.606 and 0.703, respectively; these communities are in urban areas with a water-control bureau and municipal government, so emergency rescue, dredging, and other flood management techniques can be easily implemented.
The science and technical dimension consists of rescue capacity and weather forecast. However, the difference in science and technical resilience among communities mainly depends on their rescue capacity, as the forecasting system is advanced, and a disaster warning signal can be sent to mobile phones. The rescue capability in the Zhuhu village had a low level (0.019) as it is located in a remote region; during heavy rainstorms, villagers cannot easily escape.
The social–economic status dimension represents the influence of the population and the residents’ ability to prepare for possible hazards. The village had a high social–economic status level (0.428 in SE1 and 0.196 in SE2) as it can only depend on itself once urban flooding occurs, for example, we noticed that most villagers prepared home-used pumps to increase their drainage ability.
In summary, the results show that differences exist in the community resilience indicators of different communities and illustrate the relative importance of resilience dimensions considering the independent relationships. In this study, seven indicators of the simplified evaluation system were identified by FDM, and the ANP model was used to construct the network evaluation system of community resilience to urban floods. Hence, the proposed model can be used to improve the evaluation by implementing the simplified indicator system and facilitating the computational process. The application provides a quantitative method for resilience dimension assessment and presents methods to cope with interdependent community resilience indicator prioritization in a systematic way.
3.4. Strategies of the ANP Model to Enhance Community Resilience
After reviewing the literature and consulting experts, the economic, environmental, and social aspects were considered in the stage of strategy selection, and the strategies to enhance the community resilience to urban flood were defined. Based on the simplified network of community resilience proposed in Section 3.3, the natural environment is an exterior dimension as a pressure driver, and the organization and institute dimension is an interior dimension of the decision makers. Therefore, three community resilience improvement strategies were determined, which are defined as S1 (science and technology improvement), S2 (social–economic status improvement), and S3 (built-environment improvement). There is also interdependence between the three development strategies and the 7 evaluation indicators associated with community resilience to urban flooding. The interdependent relationships exist both within dimensions and among dimensions in this study; thus the ANP network model of strategies was constructed, and the interdependent relationship between selected indicators was established.
If there was no interdependence between the strategies and indicators, the normalized weights were computed, as shown in Table 6, and the comparison matrices passed the test with C.R. < 0.1. Then, three improvement strategies were compared in a simplified evaluation system; experts were asked “considering the satisfaction of indicator BE1, which strategy contributes more to the effect on indicator BE1, and how much more?”, and the question was applied to BE2, OI, ST1, ST2, SE1, and SE2. In the next stage, the supermatrix for compatibility was calculated, as shown in Appendix C, and the supermatrix for compatibility after convergence is shown in Appendix D. Finally, the overall normalized priorities of improvement strategies of community resilience to urban flooding were obtained, which indicated that the science and technology improvement ranked first, with a weight of 0.543, followed by social–economic status improvement and built-environment improvement, with weights of 0.325 and 0.132, respectively, as shown in Table 7.
Table 6.
The normalized weights of the strategies.
Table 7.
Specific measures for the three communities to enhance resilience.
The results of these strategies shed light on some key issues which direct the decision makers in enhancing community resilience to urban flooding, shown in Table 7. First, science and technology improvement promotes and enables community resilience initiatives. Greater scientific planning of rescue capabilities with family members, an increase in the accuracy of weather forecasts, and timely alert of the public are urgently required, and an increase in trust in terms of forecasts and warnings is also necessary. According to our calculations, a social–economic status strategy is less important for community resilience than the science and technology strategy. The social–economic status strategy provides an important advancement of social ties in community resilience. A decease of the vulnerable population and an increase of individual capability and financial capability are embedded in the social–economic status strategy. Specifically, the improvement of social ties, individual capability, and communication with neighbors would enhance the community resilience in the neighborhood and college. As there is a larger vulnerable population in the village community, special assistants are urgently required once urban floods occur. Moreover, participation in community parties, groups, and organizations helps to exchange information of hazard risk, which would also enhance community resilience. However, financial capability also characterizes the types of communities, for example, rural communities (the Zhuhu village) with lower financial capability are usually based on shared ideology and have more intense relationships between the residents, which helps to improve the community resilience, while the newly built neighborhood (the Daxuenan neighborhood) in large cities exhibits the increased social alienation and diverse lifestyles of residents, which are expected to result in a lower level of community resilience. Finally, built-environment improvement should be stressed. Communities need to have the capacity to withstand external shocks and a resilient equilibrium before the arrival of external aid. However, not every community can activate their inner resilience, not only due to the vulnerability conditions but also because of the limitations of access to resources. The measurements of built-environment strategies include building and sustaining resilient critical infrastructures in the village community and optimizing urban planning when land use changes in the neighborhood and college community.
To sum up, the network evaluation system can not only rank the resilience indicators in a systematic way, it can also analyze the relevant importance of strategies that guide future community resilience development and planning. Our findings of resilience strategies expand the current understanding of community resilience to urban floods by considering the interdependence in the evaluation framework and try to provide policy implications for urban flood prevention. This fills an important gap in the literature.
3.5. Validation
Community resilience is identified as recovering from urban flood hazards quickly [41]. However, the loss data are difficult to obtain at the community scale. In order to validate the result of community resilience in this study, the indicators from the ANP model and the indicators from the AHP model were compared. AHP is a multi-dimension decision model and can be characterized as a meta-multicriteria method [42], which has been widely used in the previously published research on community resilience [32].
Among the indicators in the AHP model, the community resilience is measured by FDM and AHP in a hierarchy framework, in which the indicators are designed to be independent. According to Table 3, the hierarchy framework based on the simplified indicators in our study can be constructed, in which four dimensions and seven indicators were included. Then, the resilience scores in the study area were calculated by using the provided model. In the study, the pair-wise comparisons in the hierarchy were conducted based on the experts’ judgement, and the investigation results for the three communities are shown in Figure 4. Finally, the priority vector was calculated by Equation (5), and the consistency was checked with the ANP model, as shown in Equations (3) and (4).
where A is the judgement matrix, and λmax is the maximum eigenvalue of A.
As shown in Table 7, the overall normalized weights of the evaluation indicators for the neighborhood, college, and village community were obtained by the AHP model, as listed in Table 7. The neighborhood and college had a high level in OI2, with weights of 0.18 and 0.21, respectively. The vulnerable population, accuracy of weather forecasts, and individual capability reached 0.23, 0.23, and 0.18, respectively. The results of AHP are consistent with the results of the indicators from the ANP model. However, AHP is a hierarchy framework, in which the indicators are assumed to be independent and are only related to their upper hierarchy; Thus, the weights of the community resilience indicators were homogeneous. Take the neighborhood for example: the spatial structure of land use and relative management organizations both reached the maximum weight (0.18), while the rescue capability and accuracy of weather forecasts both had a weight of 0.15. Therefore, with the tiny difference in weight vectors calculated by the indicator AHP model, it is not easy for local governments to identify the dominating indicator for any neighborhood community. While ANP is a network framework, this model not only helps to rank the community indicators but can also find a more reliable weight based on interdependent relationships among resilience indicators. The results could provide guidance for urban flood management.
Overall, Table 8 suggests that both the ANP and AHP frameworks could measure the community resilience to urban floods, and the results of the provided indicators from the ANP model in this study are in accordance with those of previous models. The network community resilience framework constructed in this study can not only simplify the indicators and dimensions but can also convert the subjective correlation of indicators into a quantitative value of community resilience and show a more distinguished result.
Table 8.
Results of the ANP model and analytic hierarchy process (AHP) model.
According to the limitations, the indicators were identified by FDM, and community resilience indicators and the improvement strategies were evaluated by ANP separately, as it is a systematic framework characterized by weight vectors. More effort should be focused on the identification of the characteristic factors when enhancing resilience. Resilience is a process more than a result. Further study should focus on the dynamic characteristics of community resilience to urban floods.
4. Conclusions
This study investigated the differences in community resilience to urban flooding in three types of communities, which can be applied to group decision-making methods in urban flood management. The fuzzy Delphi and ANP methods were applied to quantitatively identify the interdependence relationships among community resilience indicators and flood-relief strategies. Some major conclusions can be drawn as follows:
- With reference to the investigation results from the study area and experts’ suggestions, public facilities (BE1), spatial structure of land use (BE2), relative management organizations (OI2), vulnerable population (SE1), individual capability (SE2), rescue capability (ST1), and accuracy of weather forecasts (ST2) were identified as indicators of community resilience to urban floods, and the combined effects of resilience indicators were measured. The results support the definition of community resilience to urban floods. Communities are expected to strengthen the public facilities and land structure to defend against urban flood hazards, relative management organization at the local level is required in response to urban floods, scientifically and quickly, neighbors in the community are suggested to improve their self-ability to reduce hazard losses, and the demographic characteristics of the community also influence the recovery from urban floods. All of the indicators affect the enhancement of community resilience to urban floods. Moreover, we quantified the interdependence correlations among the resilience indicators of urban floods and calculated weights in a systematic way. These procedures can be incorporated into a new framework, which can promote the evaluation of community resilience with multiple indicators.
- In this study, three typical communities were selected, which included a newly built neighborhood, an ancient college and a flood-prone village in Nanning, China. The neighborhood (with a total average score of 2.13) had the largest community resilience to urban flood, followed by the college (1.8), and finally, the village (0.91). The findings of this analysis shed light on the relationship between the type of community and resilience to urban floods. For example, the strength of the built-environment and the organization and institute dimension in the neighborhood community, with a high level of resilience in the science and technology dimension and social–economic status dimension for residents in the neighborhood, are strong predictors of community resilience. In other words, examining the types of community could enhance the community resilience effectively. Flood management organizations play a leading role in the urban flooding resilience of the neighborhood and college, while the vulnerable population has a great impact on the community resilience of the village.
- With reference to the strategies of the ANP model, we developed a theoretical framework to better understand the coupled system of community resilience to urban floods. Results of the strategy analysis indicate that science and technology improvement (0.543) is more important than social–economic status improvement (0.325) and built-environment improvement (0.132) for mitigating urban hazards in Nanning. As shown in the simplified indicator system, science and technology improvement is related to self-rescue ability and the accuracy of weather forecasts, which could ultimately drive the enhancement of the residents’ perception of risks and responses to hazards when urban floods occur.
The differences in the three communities demonstrates the different access to resources and variations in the situations when urban flooding occurs. These proposals and ideas may point to future directions for flood risk management at the community scale and indicate effective measures in the various communities to enhance the resilience to urban floods.
Author Contributions
All authors were involved in the production and writing of the manuscript. Supervision, Y.H.; Project administration, X.C., K.L., and M.Z. All authors have read and agreed to the published version of the manuscript.
Funding
The research was funded by the National Key R&D Program of China (grant No.2017YFC0405900), the National Natural Science Foundation of China (grant No. 51709286 and No. 51779279), the outstanding Youth Science Foundation of NSFC (grant No. 51822908), and the Guangdong Natural Science Foundation of China (grant No. 2017A030310065).
Acknowledgments
The authors would like to thank the graduate students for help with fieldwork. We also extended our gratitude for the valuable feedback from the anonymous reviewers in the improvements of this manuscript.
Conflicts of Interest
The authors declare no conflict of interest.
Appendix A
Table A1.
Supermatrix for compatibility before convergence of dimensions.
Table A1.
Supermatrix for compatibility before convergence of dimensions.
| Neighborhood | College | Village | BE1 | BE2 | OI2 | SE1 | SE2 | ST1 | ST2 | ||
|---|---|---|---|---|---|---|---|---|---|---|---|
| Neighborhood | Neighborhood | 0 | 0.115 | 0 | 0 | 0 | 0 | 0 | 0 | 0 | 0 |
| College | 0.112 | 0 | 0.026 | 0 | 0 | 0 | 0 | 0 | 0 | 0 | |
| Village | 0.016 | 0.013 | 0 | 0 | 0 | 0 | 0 | 0 | 0 | 0 | |
| BE1 | 0.018 | 0.032 | 0.079 | 0.015 | 0.015 | 0.067 | 0.064 | 0.064 | 0.066 | 0.066 | |
| BE2 | 0.141 | 0.127 | 0.079 | 0.135 | 0.135 | 0.070 | 0.0640 | 0.064 | 0.066 | 0.066 | |
| OI2 | 0.556 | 0.556 | 0.556 | 0.583 | 0.583 | 0.556 | 0.556 | 0.624 | 0.631 | 0.631 | |
| SE1 | 0.026 | 0.026 | 0.031 | 0.028 | 0.028 | 0.027 | 0.034 | 0.034 | 0.025 | 0.025 | |
| SE2 | 0.013 | 0.013 | 0.008 | 0.028 | 0.028 | 0.027 | 0.017 | 0.017 | 0.025 | 0.025 | |
| ST1 | 0.079 | 0.059 | 0.012 | 0.106 | 0.106 | 0.102 | 0.098 | 0.098 | 0.062 | 0.062 | |
| ST2 | 0.040 | 0.059 | 0.107 | 0.106 | 0.106 | 0.102 | 0.098 | 0.098 | 0.125 | 0.125 | |
| College | Neighborhood | 0 | 0.108 | 0.096 | 0 | 0 | 0 | 0 | 0 | 0 | 0 |
| College | 0.107 | 0 | 0.024 | 0 | 0 | 0 | 0 | 0 | 0 | 0 | |
| Village | 0.013 | 0.012 | 0 | 0 | 0 | 0 | 0 | 0 | 0 | 0 | |
| BE1 | 0.008 | 0.014 | 0.035 | 0.018 | 0.018 | 0.047 | 0.043 | 0.043 | 0.031 | 0.031 | |
| BE2 | 0.063 | 0.057 | 0.035 | 0.073 | 0.073 | 0.047 | 0.043 | 0.043 | 0.031 | 0.031 | |
| OI2 | 0.518 | 0.518 | 0.528 | 0.710 | 0.710 | 0.696 | 0.718 | 0.718 | 0.727 | 0.727 | |
| SE1 | 0.070 | 0.070 | 0.084 | 0.029 | 0.029 | 0.033 | 0.028 | 0.028 | 0.043 | 0.043 | |
| SE2 | 0.035 | 0.035 | 0.021 | 0.029 | 0.029 | 0.033 | 0.019 | 0.019 | 0.043 | 0.043 | |
| ST1 | 0.124 | 0.093 | 0.019 | 0.071 | 0.071 | 0.071 | 0.069 | 0.069 | 0.041 | 0.041 | |
| ST2 | 0.062 | 0.093 | 0.167 | 0.071 | 0.071 | 0.071 | 0.069 | 0.069 | 0.083 | 0.083 | |
| Neighborhood | 0 | 0.062 | 0.055 | 0 | 0 | 0 | 0 | 0 | 0 | 0 | |
| College | 0.061 | 0 | 0.014 | 0 | 0 | 0 | 0 | 0 | 0 | 0 | |
| Village | 0.008 | 0.007 | 0 | 0 | 0 | 0 | 0 | 0 | 0 | 0 | |
| Village | BE1 | 0.011 | 0.020 | 0.051 | 0.061 | 0.061 | 0.062 | 0.062 | 0.062 | 0.039 | 0.039 |
| BE2 | 0.090 | 0.081 | 0.051 | 0.061 | 0.061 | 0.062 | 0.062 | 0.062 | 0.039 | 0.039 | |
| OI2 | 0.030 | 0.030 | 0.030 | 0.043 | 0.043 | 0.045 | 0.045 | 0.045 | 0.210 | 0.210 | |
| SE1 | 0.394 | 0.394 | 0.473 | 0.313 | 0.313 | 0.309 | 0.494 | 0.494 | 0.324 | 0.324 | |
| SE2 | 0.197 | 0.197 | 0.118 | 0.313 | 0.313 | 0.309 | 0.124 | 0.124 | 0.324 | 0.324 | |
| ST1 | 0.104 | 0.104 | 0.021 | 0.021 | 0.021 | 0.021 | 0.021 | 0.021 | 0.006 | 0.006 | |
| ST2 | 0.104 | 0.104 | 0.014 | 0.189 | 0.189 | 0.191 | 0.191 | 0.191 | 0.057 | 0.057 | |
Appendix B
Table A2.
Supermatrix for compatibility after convergence of dimensions.
Table A2.
Supermatrix for compatibility after convergence of dimensions.
| Neighborhood | College | Village | BE1 | BE2 | OI2 | SE1 | SE2 | ST1 | ST2 | ||
|---|---|---|---|---|---|---|---|---|---|---|---|
| Neighborhood | Neighborhood | 0 | 0 | 0 | 0 | 0 | 0 | 0 | 0 | 0 | 0 |
| College | 0 | 0 | 0 | 0 | 0 | 0 | 0 | 0 | 0 | 0 | |
| Village | 0 | 0 | 0 | 0 | 0 | 0 | 0 | 0 | 0 | 0 | |
| BE1 | 0.061 | 0.061 | 0.061 | 0.061 | 0.061 | 0.061 | 0.061 | 0.061 | 0.061 | 0.061 | |
| BE2 | 0.078 | 0.078 | 0.078 | 0.078 | 0.078 | 0.078 | 0.078 | 0.078 | 0.078 | 0.078 | |
| OI2 | 0.606 | 0.606 | 0.606 | 0.606 | 0.606 | 0.606 | 0.606 | 0.606 | 0.606 | 0.606 | |
| SE1 | 0.027 | 0.027 | 0.027 | 0.027 | 0.027 | 0.027 | 0.027 | 0.027 | 0.027 | 0.027 | |
| SE2 | 0.026 | 0.026 | 0.026 | 0.026 | 0.026 | 0.026 | 0.026 | 0.026 | 0.026 | 0.026 | |
| ST1 | 0.095 | 0.095 | 0.095 | 0.095 | 0.095 | 0.095 | 0.095 | 0.095 | 0.095 | 0.095 | |
| ST2 | 0.107 | 0.107 | 0.107 | 0.107 | 0.107 | 0.107 | 0.107 | 0.107 | 0.107 | 0.107 | |
| College | Neighborhood | 0 | 0 | 0 | 0 | 0 | 0 | 0 | 0 | 0 | 0 |
| College | 0 | 0 | 0 | 0 | 0 | 0 | 0 | 0 | 0 | 0 | |
| Village | 0 | 0 | 0 | 0 | 0 | 0 | 0 | 0 | 0 | 0 | |
| BE1 | 0.042 | 0.042 | 0.042 | 0.042 | 0.042 | 0.042 | 0.042 | 0.042 | 0.042 | 0.042 | |
| BE2 | 0.047 | 0.047 | 0.047 | 0.047 | 0.047 | 0.047 | 0.047 | 0.047 | 0.047 | 0.047 | |
| OI2 | 0.103 | 0.103 | 0.103 | 0.103 | 0.103 | 0.103 | 0.103 | 0.103 | 0.103 | 0.103 | |
| SE1 | 0.035 | 0.035 | 0.035 | 0.035 | 0.035 | 0.035 | 0.035 | 0.035 | 0.035 | 0.035 | |
| SE2 | 0.033 | 0.033 | 0.033 | 0.033 | 0.033 | 0.033 | 0.033 | 0.033 | 0.033 | 0.033 | |
| ST1 | 0.067 | 0.067 | 0.067 | 0.067 | 0.067 | 0.067 | 0.067 | 0.067 | 0.067 | 0.067 | |
| ST2 | 0.073 | 0.073 | 0.073 | 0.073 | 0.073 | 0.073 | 0.073 | 0.073 | 0.073 | 0.073 | |
| Neighborhood | 0 | 0 | 0 | 0 | 0 | 0 | 0 | 0 | 0 | 0 | |
| College | 0 | 0 | 0 | 0 | 0 | 0 | 0 | 0 | 0 | 0 | |
| Village | 0 | 0 | 0 | 0 | 0 | 0 | 0 | 0 | 0 | 0 | |
| Village | BE1 | 0.057 | 0.057 | 0.057 | 0.057 | 0.057 | 0.057 | 0.057 | 0.057 | 0.057 | 0.057 |
| BE2 | 0.057 | 0.057 | 0.057 | 0.057 | 0.057 | 0.057 | 0.057 | 0.057 | 0.057 | 0.057 | |
| OI2 | 0.076 | 0.076 | 0.076 | 0.076 | 0.076 | 0.076 | 0.076 | 0.076 | 0.076 | 0.076 | |
| SE1 | 0.428 | 0.428 | 0.428 | 0.428 | 0.428 | 0.428 | 0.428 | 0.428 | 0.428 | 0.428 | |
| SE2 | 0.196 | 0.196 | 0.196 | 0.196 | 0.196 | 0.196 | 0.196 | 0.196 | 0.196 | 0.196 | |
| ST1 | 0.019 | 0.019 | 0.019 | 0.019 | 0.019 | 0.019 | 0.019 | 0.019 | 0.019 | 0.019 | |
| ST2 | 0.167 | 0.167 | 0.167 | 0.167 | 0.167 | 0.167 | 0.167 | 0.167 | 0.167 | 0.167 | |
Appendix C
Table A3.
Supermatrix for compatibility before convergence of strategies.
Table A3.
Supermatrix for compatibility before convergence of strategies.
| BE1 | BE2 | OI1 | SE1 | SE2 | ST1 | ST2 | S1 | S2 | S3 | |
|---|---|---|---|---|---|---|---|---|---|---|
| BE1 | 0.009 | 0.009 | 0.036 | 0.012 | 0.012 | 0.013 | 0.013 | 0.013 | 0.013 | 0.013 |
| BE2 | 0.053 | 0.053 | 0.036 | 0.069 | 0.069 | 0.080 | 0.080 | 0.077 | 0.077 | 0.077 |
| OI1 | 0.120 | 0.120 | 0.117 | 0.128 | 0.128 | 0.152 | 0.152 | 0.131 | 0.131 | 0.131 |
| SE1 | 0.204 | 0.104 | 0.162 | 0.207 | 0.207 | 0.186 | 0.186 | 0.213 | 0.201 | 0.201 |
| SE2 | 0.102 | 0.102 | 0.162 | 0.103 | 0.103 | 0.093 | 0.093 | 0.107 | 0.107 | 0.107 |
| ST1 | 0.069 | 0.069 | 0.228 | 0.064 | 0.064 | 0.063 | 0.063 | 0.061 | 0.061 | 0.061 |
| ST2 | 0.414 | 0.414 | 0.228 | 0.386 | 0.386 | 0.380 | 0.380 | 0.367 | 0.367 | 0.367 |
| S1 | 0.003 | 0.003 | 0.010 | 0.003 | 0.003 | 0.003 | 0.003 | 0 | 0.016 | 0.016 |
| S2 | 0.010 | 0.010 | 0.010 | 0.010 | 0.010 | 0.010 | 0.010 | 0.016 | 0 | 0.016 |
| S3 | 0.017 | 0.017 | 0.010 | 0.018 | 0.018 | 0.019 | 0.019 | 0.016 | 0.016 | 0 |
Appendix D
Table A4.
Supermatrix for compatibility after convergence of strategies.
Table A4.
Supermatrix for compatibility after convergence of strategies.
| BE1 | BE2 | OI1 | SE1 | SE2 | ST1 | ST2 | S1 | S2 | S3 | |
|---|---|---|---|---|---|---|---|---|---|---|
| BE1 | 0.016 | 0.016 | 0.016 | 0.016 | 0.016 | 0.016 | 0.016 | 0.016 | 0.016 | 0.016 |
| BE2 | 0.068 | 0.068 | 0.068 | 0.068 | 0.068 | 0.068 | 0.068 | 0.068 | 0.068 | 0.068 |
| OI1 | 0.137 | 0.137 | 0.137 | 0.137 | 0.137 | 0.137 | 0.137 | 0.137 | 0.137 | 0.137 |
| SE1 | 0.191 | 0.191 | 0.191 | 0.191 | 0.191 | 0.191 | 0.191 | 0.191 | 0.191 | 0.191 |
| SE2 | 0.107 | 0.107 | 0.107 | 0.107 | 0.107 | 0.107 | 0.107 | 0.107 | 0.107 | 0.107 |
| ST1 | 0.087 | 0.087 | 0.087 | 0.087 | 0.087 | 0.087 | 0.087 | 0.087 | 0.087 | 0.087 |
| ST2 | 0.363 | 0.363 | 0.363 | 0.363 | 0.363 | 0.363 | 0.363 | 0.363 | 0.363 | 0.363 |
| S1 | 0.004 | 0.004 | 0.004 | 0.004 | 0.004 | 0.004 | 0.004 | 0.004 | 0.004 | 0.004 |
| S2 | 0.010 | 0.010 | 0.010 | 0.010 | 0.010 | 0.010 | 0.010 | 0.010 | 0.010 | 0.010 |
| S3 | 0.017 | 0.017 | 0.017 | 0.017 | 0.017 | 0.017 | 0.017 | 0.017 | 0.017 | 0.017 |
References
- Saharia, M.; Kirstetter, P.-E.; Vergara, H.; Yong, B.; Hong, Y.; Giroud, M. Mapping Flash Flood Severity in the United States. J. Hydrometeorol. 2017, 18, 397–411. [Google Scholar] [CrossRef]
- Ministry of Water Resources of the People’s Republic of China. Annual flood and drought hazards report of China. Ministry of Water Resources of the People’s Republic of China: Beijing, China, 2017. [Google Scholar]
- Zhong, M.; Wang, J.; Gao, L.; Lin, K.R.; Hong, Y. Fuzzy risk assessment of flash floods using a cloud-based information diffusion approach. Water Resour. Manag. 2019, 33, 2537–2553. [Google Scholar] [CrossRef]
- Carlos, H.R.L.; Upmanu, L.; Tara, J.T. A climate informed model for nonstationary flood risk prediction: Application to Negro River at Manaus, Amazonia. J. Hydrol. 2015, 522, 594–602. [Google Scholar]
- Lai, C.G.; Shao, Q.X.; Chen, X.H.; Wang, Z.L.; Zhou, X.W.; Yang, B.; Zhang, L. Flood risk zoning using a rule mining based on ant colony algotithm. J. Hydrol. 2016, 542, 268–280. [Google Scholar] [CrossRef]
- Cutter, S.L.; Emrich, C.; Morath, D.; Dunning, C. Integrating social vulnerability into federal flood risk management planning. J. Flood Risk Manag. 2013, 6, 332–344. [Google Scholar] [CrossRef]
- Koks, E.E.; Jongman, B.; Husby, T.; Botzen, W. Combining hazard, exposure and social vulnerability to provide lessons for flood risk management. Environ. Sci. Policy 2015, 47, 42–52. [Google Scholar] [CrossRef]
- Frigerio, I.; De Amicis, M. Mapping social vulnerability to natural hazards in Italy: A suitable tool for risk mitigation strategies. Environ. Sci. Policy 2016, 63, 187–196. [Google Scholar] [CrossRef]
- Rapaport, C.; Hornik-Lurie, T.; Cohen, O.; Lahad, M.; Leykin, D.; Aharonson-Daniel, L. The relationship between community type and community resilience. Int. J. Disaster Risk Reduct. 2018, 31, 470–477. [Google Scholar] [CrossRef]
- Klein, R.T.J.; Nicholls, R.J.; Thomalla, F. Resilience to natural hazards: How useful is this concept? Environ. Hazards. 2003, 5, 35–45. [Google Scholar]
- Saravi, S.; Kalawsky, R.; Joannou, D.; Casado, M.R.; Fu, G.; Meng, F. Use of Artificial Intelligence to Improve Resilience and Preparedness Against Adverse Flood Events. Water 2019, 11, 973. [Google Scholar] [CrossRef]
- Chuang, W.-C.; Garmestani, A.; Eason, T.; Spanbauer, T.; Fried-Petersen, H.; Roberts, C.; Sundstrom, S.; Burnett, J.; Angeler, D.; Chaffin, B.; et al. Enhancing quantitative approaches for assessing community resilience. J. Environ. Manag. 2018, 213, 353–362. [Google Scholar] [CrossRef] [PubMed]
- The National Academy of Sciences. Disaster Resilience: A National Imperative. Committee on Increasing National Resilience to Hazards and Disasters, Committee on Science, Engineering, and Public Policy; The National Academies Press: Washington, DC, USA, 2012. [Google Scholar]
- Joanna, W.; Eloise, B.; Andrew, J.T. Measurement of Social Networks for Innovation within Community Disaster Resilience. Sustainability 2019, 11, 1943. [Google Scholar] [CrossRef]
- Martín, Y.; Mimbrero, M.R.; Antón, M.Z. Community vulnerability to hazards: Introducing local expert knowledge into the equation. Nat. Hazards 2017, 89, 367–386. [Google Scholar] [CrossRef]
- Wisner, B.; Blaikie, P.; Cannon, T.; Davis, I. At risk: Natural hazards, people’s vulnerability and disasters. Econ. Geogr. 2003, 72, 460–463. [Google Scholar]
- Bakkensen, L.A.; Fox-Lent, C.; Read, L.K.; Linkov, I. Validating Resilience and Vulnerability Indices in the Context of Natural Disasters. Risk Anal. 2017, 37, 982–1004. [Google Scholar] [CrossRef]
- Gallopín, G. Linkages between vulnerability, resilience, and adaptive capacity. Glob. Environ. Chang. 2006, 16, 293–303. [Google Scholar] [CrossRef]
- Serre, D.; Heinzlef, C. Assessing and mapping urban resilience to floods with respect to cascading effects through critical infrastructure networks. Int. J. Disaster Risk Reduct. 2018, 30, 235–243. [Google Scholar] [CrossRef]
- Sander, E.V.D.L. Are Cities Resilient? OpenScience; ISTE Ltd. Publishing: London, UK, 2018; pp. 1–9. [Google Scholar]
- Qasim, S.; Khan, A.N.; Shrestha, R.P.; Qasim, M. Risk Perception of the People in the Flood Prone Khyber Pukhthunkhwa Province of Pakistan. Int. J. Disaster Risk Reduct. 2015, 14, 373–378. [Google Scholar] [CrossRef]
- Cutter, S.L.; Barnes, L.; Berry, M.; Burton, C.; Evans, E.; Tate, E.; Webb, J. A place-based model for understanding community resilience to natural disasters. Glob. Environ. Chang. 2008, 18, 598–606. [Google Scholar] [CrossRef]
- Norris, F.H.; Stevens, S.P.; Pfefferbaum, B.; Wyche, K.F.; Pfefferbaum, R.L. Community Resilience as a Metaphor, Theory, Set of Capacities and Strategy for Disaster Readiness. Am. J. Community Psychol. 2008, 41, 127–150. [Google Scholar] [CrossRef]
- Ainuddin, S.; Routray, J.K. Earthquake hazards and community resilience in Baluchistan. Nat. Hazards. 2012, 63, 909–937. [Google Scholar] [CrossRef]
- Alshehri, S.; Rezgui, A.; Li, Y. Delphi-based consensus study into a framework of community resilience to disaster. Nat. Hazards. 2015, 75, 2221–2245. [Google Scholar] [CrossRef]
- Spiliotis, M.; Skoulikaris, C. A fuzzy AHP-outranking framework for selecting measures of river basin management plans. Desalination Water Treat. 2019, 167, 398–411. [Google Scholar] [CrossRef]
- Zhang, J. Evaluating regional low-carbon tourism strategies using the fuzzy Delphi- analytic network process approach. J. Clean. Prod. 2017, 141, 409–419. [Google Scholar] [CrossRef]
- Parkouhi, S.V.; Ghadikolaei, A.S. A resilience approach for supplier selection: Using Fuzzy Analytic Network Process and grey VIKOR techniques. J. Clean. Prod. 2017, 161, 431–451. [Google Scholar] [CrossRef]
- Jordan, E.; Javernick-Will, A. Indicators of Community Recovery: Content Analysis and Delphi Approach. Nat. Hazards Rev. 2013, 14, 21–28. [Google Scholar] [CrossRef]
- Yamane, T. Elementary Sampling Theory; Prentice-Hall Inc: Englewood Cliffs, NJ, USA, 1967. [Google Scholar]
- Miller, F.; Osbahr, H.; Boyd, E.; Thomalla, F.; Bharwani, S.; Ziervogel, G.; Walker, B.; Van Der Leeuw, S.; Hinkel, J.; Downing, T.; et al. Resilience and Vulnerability: Complementary or Conflicting Concepts? Ecol. Soc. 2010, 15, 11. [Google Scholar] [CrossRef]
- Sharifi, A. A critical review of selected tools for assessing community resilience. Ecol. Indic. 2016, 69, 629–647. [Google Scholar] [CrossRef]
- Chan, S.; Wey, W.; Chang, P. Establishing Disaster Resilience Indicators for Tan-sui River Basin in Taiwan. Soc. Indic. Res. 2014, 115, 387–418. [Google Scholar] [CrossRef]
- Dalkey, N.; Helmer, O. An Experimental Application of the DELPHI Method to the Use of Experts. Manag. Sci. 1963, 9, 458–467. [Google Scholar] [CrossRef]
- Ishikawa, A.; Amagasa, M.; Shiga, T.; Tomizawa, G.; Tatsuta, R.; Mieno, H. The max-min Delphi method and fuzzy Delphi method via fuzzy integration. Fuzzy Sets Syst. 1993, 55, 241–253. [Google Scholar] [CrossRef]
- Andrić, J.M.; Lu, D.-G. Fuzzy methods for prediction of seismic resilience of bridges. Int. J. Disaster Risk Reduct. 2017, 22, 458–468. [Google Scholar] [CrossRef]
- Ma, Z.; Shao, C.; Ma, S.; Ye, Z. Constructing road safety performance indicators using Fuzzy Delphi Method and Grey Delphi Method. Expert Syst. Appl. 2011, 38, 1509–1514. [Google Scholar] [CrossRef]
- Razavitoosi, S.L.; Samani, J.M.V. Prioritizing Watersheds Using a Novel Hybrid Decision Model Based on Fuzzy DEMATEL, Fuzzy ANP and Fuzzy VIKOR. Water Resour. Manag. 2017, 42, 2853–2867. [Google Scholar]
- Afzali, A.; Sabri, S.; Rashid, M.; Samani, J.M.V.; Ludin, A.N.M. Inter-Municipal Landfill Site Selection Using Analytic Network Process. Water Resour. Manag. 2014, 28, 2179–2194. [Google Scholar] [CrossRef]
- Saaty, T.L. Theory and Applications of the Analytic Network Process: Decision Making with Benefits, Opportunities, Cost, and Risks; RWS publications: Pittsburgh, PA, USA, 2005. [Google Scholar]
- Fenner, R.A.; O’Donnell, E.; Ahilan, S.; Dawson, D.; Kapetas, L.; Krivtsov, V.; Ncube, S.; Vercruysse, K. Achieving Urban Flood Resilience in an Uncertain Future. Water 2019, 11, 1082. [Google Scholar] [CrossRef]
- Spiliotis, M.; Iglesias, A.; Garrote, L. A Meta-multicriteria Approach to Estimate Drought Vulnerability Based on Fuzzy Pattern Recognition. Communications in Computer and Information Science 2019, 349–360. [Google Scholar]
© 2020 by the authors. Licensee MDPI, Basel, Switzerland. This article is an open access article distributed under the terms and conditions of the Creative Commons Attribution (CC BY) license (http://creativecommons.org/licenses/by/4.0/).