Article

Purification Effect of the Aquaculture Wastewater and Sediment by Microbial Nanospheres with Different Material Ratios and Dosing Methods

1
School of Water Resources and Hydropower Engineering/State Key Laboratory of Water Resources and Hydropower Engineering Science, Wuhan University, Wuhan 430072, China
2
College of Agricultural Engineering, Hohai University, Nanjing 210098, China
*
Author to whom correspondence should be addressed.
Sustainability 2020, 12(4), 1462; https://doi.org/10.3390/su12041462
Submission received: 9 January 2020 / Revised: 11 February 2020 / Accepted: 12 February 2020 / Published: 17 February 2020
(This article belongs to the Section Environmental Sustainability and Applications)

Abstract

:
Nanospheres were prepared by different materials of nano-bamboo charcoal powder, zeolite powder, and aquaculture pond sediment in different ratios. It was then fermented with effective microorganisms (EM) active calcium liquid to synthesize the bioactive microbial nanospheres. These nanospheres were used to compare the purification effect of ammonium nitrogen (NH4+-N), total nitrogen (TN), and total phosphorus (TP) pollutants in aquaculture wastewater. The indoor simulation experiment was also conducted to compare the different dosage methods (one-time dosing without aeration, multiple dosing without aeration, and multiple dosing with aeration) of microbial nanospheres on the removal of organic matter (OM) and effect of the biodegradability (G value) in aquaculture sediment. The results obtained indicated that the purification effect was most remarkable when the mass ratio of nano-bamboo charcoal powder: zeolite powder: pond sediment was 10%: 15%: 75%, in which the maximum removal rate of NH4+-N, TN, and TP reached up to 84.86%, 52.15%, and 50.35%, respectively. Under the same microbial nanospheres amount, the effect of one-time addition on the removing of OM in sediment was not as effective as that of multiple dosing. After the 20th day, the removal rate of OM reached 25.99% in multiple dosing treatment and it was 35.58% higher than one-time dosing treatment. The OM content in sediment was reduced by 32.38% under the multiple dosing with aeration treatment. Multiple dosing of microbial nanospheres with aeration increased the G value of sediment about 337.0%. In situ experiment further indicated that the microbial nanospheres dosage with aeration had a good sediment bio-remediation effect, which is applicable to solve the problem of endogenous pollution in aquaculture ponds.

1. Introduction

China is the largest aquaculture country in the world. Currently, over 80% of aquaculture has adopted an intensive cultivation pattern, large quantities of nitrogen and phosphorus are produced during the metabolism of aquatic animals, and the decomposition of excessive feed residues in the aquaculture [1]. The discharge of untreated aquaculture wastewater can seriously pollute surface waters and lakes, causing a series of social and environmental problems [2]. Good water quality is a basic premise for maintaining healthy aquaculture. However, the food chain is frequently destroyed during the intensive aquaculture cultivation process, and a lot of organic matter from the residual bait, excrement, and death debris cannot be used by other organisms and remain in the bottom mud, which leads to the ecological degradation and the serious diseases [3]. Therefore, repairing the eutrophic aquaculture environment requires not only the reduction of nitrogen, phosphorus, and organic matter in the aquaculture water, but also the removal of the sediment mud. In the aspect of aquaculture water purification, the leading technologies include biological filter treatment [4], artificial floating bed cultivation [5], artificial wetland [6], and so on. Due to the shortage of freshwater resources, the high density of breeding and a large amount of bait in the aquaculture industry as well as the present aquaculture water treatments still have problems, such as single treatment method adoption, high cost, and difficult operation [7]. In recent years, a new type of circulating water pond model is applied to reduce the nitrogen and phosphorus content in the aquaculture water, mainly relying on aquatic plants and microbes function [8]. Many studies [9,10,11] have found the composite microbial agents composed of various microbes could make the control effects of aquaculture water quality better. The EM population (containing more than 80 kinds of microbes, with photosynthetic bacteria, lactic acid bacteria, yeast, and actinomycetes as representative microbes) has been widely used in aquaculture wastewater purification [12]. The useful substances and secretions produced by EM microbes in the process of their metabolism will become the nutrients for their own or mutual growth, thereby forming complex and stable micro-ecological system with multiple functions through the symbiotic relationship among them. Shan et al. [13] conducted experiments by various microbes and confirmed that ammonia nitrogen wastewater could be effectively purified. In the same trend, Liu [14] showed that the removal rates of TN and the TP were increased by 43.33% and 42.78%, and 54.80% and 53.77%, respectively, by using EM combined with two kinds of terrestrial plants to purify tail water compared with the common aquatic plant.
Fixed microorganisms in carriers have also been applied to purify the wastewater. You [15] used the PVA cycle freezing method to fix nitrifying bacteria in sodium alginate pellets for the treatment of ammonia-nitrogen wastewater. Besides, various novel carriers are researched and developed, such as modified slag and activated carbon, etc. [16,17], all of which show excellent application potential in the environmental restoration of polluted water bodies. Recent studies demonstrate that the effect of nanomaterials added on solidified microbes is more prominent. Li [18] used nano-Fe2O3 and nano-SiO2 to modify the quartz sand and found the new adsorption carrier could improve the loading capacity by eight times, and the desorption rate would decrease by more than 70%. Wang et al. [19] added nano-Al2O3 in clay to sinter ceramsite. This application increased the specific surface area and porosity of ceramsite.
The nano bamboo charcoal (NBC) obtained by high-temperature pyrolysis of the bamboo wood has a dense carbonaceous and hexagonal molecular structure, high void ratio and large specific surface area [20]. It is a good nano-loaded matrix to fix effective microbes with a unique role in adsorbing, deodorizing and inhibiting the harmful bacteria [21]. Zeolite powder is a porous aluminosilicate mineral having alkali metals and alkaline earth metals with a network structure and a large specific surface, which is beneficial to the adhesion and filming of microbes and resistant to physicochemical and biological corrosion [22]. Therefore, zeolite powder has been used as a component of the microbial immobilization carrier material. So far, there is few research and application of high-efficiency ecological purifying agents using nanomaterial as the carriers for microbial immobilization to improve the aquaculture water quality. In this paper, microbial solid nanospheres composed of a different NBC, zeolite powder, and sediment were made. The effects of microbial nanospheres and the dosage methods on the purification of aquaculture wastewater and sediment were also studied to provide a theoretical and experimental basis for microbial nanospheres application in aquaculture wastewater purification.

2. Materials and Methods

2.1. Preparation of Microbial Nanospheres

2.1.1. EM Active Calcium Solution

EM active calcium solution was prepared using a mix of EM stock solution, molasses, deionized water, and Ca2+ solution with a mass concentration of 2% according to the volume ratio in Table 1. Then, it was transferred them into the fermentation flask under closed conditions. The fermentation was carried out for six to seven days at a shaker with a speed of 150–220 rpm and a constant temperature of 37 °C to obtain an EM active calcium solution. According to the research of Wang et al. [23], the combination of active calcium with EM could significantly improve microbial biological activities.

2.1.2. Nano Spheres Carriers

The sediment obtained from an aquaculture pond was acidified using a 0.1 mol/L HCl solution to decontaminate. Moreover, it was washed with deionized water and air-dried. The NBC powder, zeolite powder, and sediment are uniformly mixed according to the mass percentage (Table 2). The mixture materials are washed with deionized water, sterilized, and dried. 10g of the mixture was separately taken through adding an appropriate amount of EM active calcium solution to form a sphere by hand, and the nano-carrier sphere is placed in an oven-controlled at 250°C for drying and sintering. The physical properties of the carrier spheres are listed in Table 3.

2.1.3. Fixation of Microbes in Nano-Carrier Spheres

Three kinds of nano-carrier spheres prepared above were placed in EM active calcium solution for two days, and were then kept at room temperature for two days after being taken out. The bacterial liquid was uniformly adsorbed, fixed, and colonized on the porous surface of the nanosphere to prepare the microbial nanospheres (weight about 10 g) containing a ratio of different NBC powder and sediment carrier materials for purification of aquaculture water.

2.2. Experimental Design

2.2.1. Effects of Ratio of Nanospheres Materials on Aquaculture Wastewater Purification

The experiment was carried out in Key Laboratory of Efficient Irrigation-Drainage and Agricultural Soil-Water Environment in Southern China, Ministry of Education. A 10 L water sample taken from a contaminated aquaculture pond was placed in a plastic bucket with a bottom diameter of 15.5 cm, a mouth diameter of 25 cm, and a height of 22 cm. The main water quality indicators of the tested water samples are shown in Table 4. Microbial nanospheres T1, T2, and T3 with three different ratios of carrier materials were added to plastic buckets, respectively. Meanwhile, the four holes high-power aeration pump was used for each treatment at every morning from 8:00 to 10:00 for aeration and the gas production was 10 L/min. Three replicates were set for each treatment and the NH4+-N, TN, and TP contents were measured every day for a total of seven days. Considering the physical adsorption of nanospheres itself, the T4 treatment was designed to distinguish the biological and abiotic effects of the microbial nanospheres in the purification experiment. The ratio of T4 was consistent with nanospheres T2, but not soaked with EM active calcium solution.

2.2.2. Effect of Microbial Nanospheres Dosing Methods on Removal OM in Sediment

A transparent glass cylinder is having a size of 35 cm length × 20 cm width × 23 cm height was used as a reaction device for sediment removal of organic matter (OM) in sediment. The sediment was taken from the same contaminated aquaculture pond. After the collected sediment was placed for two to three days, the moisture, branches, stones, plastics, and other impurities were removed. Each glass cylinder was laid with a 5 cm thick of sediment, and the pond water was poured into with a height of 15 cm. Three treatment groups of microbial nanospheres dosing methods were set up in the experiment and each treatment group was replicated three times. For the first treatment group (M1), 60 g of microbial nanospheres T2 were placed into a glass cylinder. For the second treatment group (M2), 30 g microbial nanospheres T2 were placed into a glass cylinder and added once on the 10th day. For the third treatment group (M3), 30 g microbial nanospheres T2 were placed into glass cylinder and added once on the 10th day, and a four-hole high-power oxygen pump was used for aeration at 8:30–10:30 every morning, and the gas production was 10 L/min. The test lasted for 20 days and the sediment samples were taken every two days to determine the OM content and biodegradability (G value).

2.2.3. In Situ Evaluation of the Sediment Bioremediation

In situ experiment was set up to verify sediment bioremediation. It was performed in two similar aquaculture ponds (ponds I, II) in Gucheng lake (31°14′ N, 118°53′ E), Nanjing City, Jiangsu Province, China, where the aquaculture water quality had experienced serious eutrophication. The two aquaculture ponds were approximately 0.4 hm2 in area, 1 m in depth. The sediment bioremediation was applied only in the tested pond (pond II) at a rate of 50 kg/hm2 microbial nanospheres T2 every month and provided sediment aeration at 8:30–10:30 every morning keeping DO concentration in 4~5 mg/L. Every month from April to October, the sediment samples (about 500 g) were collected from three places in each pond for analysis of OM, G value and thickness of sediment.

2.3. Determination Methods

The determination methods of each water quality index are carried out following standard methods. TN was determined by alkaline potassium persulfate digestion ultraviolet spectrophotometer [24]. NH4+-N was determined by Nessler's reagent Spectrophotometry [25]. The concentration of TP in overlying water was determined using Phosphorus Molybdenum Blue Method [26]. The concentration of TN, NH4+-N, and TP were determined using a LASPEC Alpha-1860Plus ultraviolet spectrophotometer. All chemicals were of analytical grade and obtained from Sinopharm Chemical Reagent Co., Ltd., China. Sediment organic matter (OM) was determined by the photometric method [27]. Sediment biodegradability (G value) was determined by the potassium permanganate oxidation method. It was tested by accurately weighing 1 g dried sediment samples in a 1 L flask, then adding 0.5 L boiled overlying aquaculture water, and shocking at 6 h and 30 min static. The sediment G value was measured based on the CODMn amount of the overlying water before and after the shock [28]:
G = ( C 1 C 2 ) × V 10 × Q × T
where, C1 and C2 are the CODMn value of the water before and after shock, mg/L; V is the volume of the overlying water, mL; Q is the weight of the sediment, g; and T is the shock time, h. All the data were expressed as the mean values of three replicates.
The fixed microbes were observed using a MERLIN compact-61-78 scanning electron microscope (SEM). The multi-point Brunauer–Emmett–Teller (BET) surface area and pore structure of nanospheres were measured using a Quantachrome Nova 3000e automated surface area analyzer.

2.4. Statistical Methods

The experimental results were averaged over three replicates. Data were analyzed by SPSS 18.0 software (SPSS Inc., Chicago USA) for one-way ANOVA. The differences in the levels of each factor were compared using the least significance difference (LSD) test, p < 0.05 indicates that the difference is significant.

3. Results and Discussion

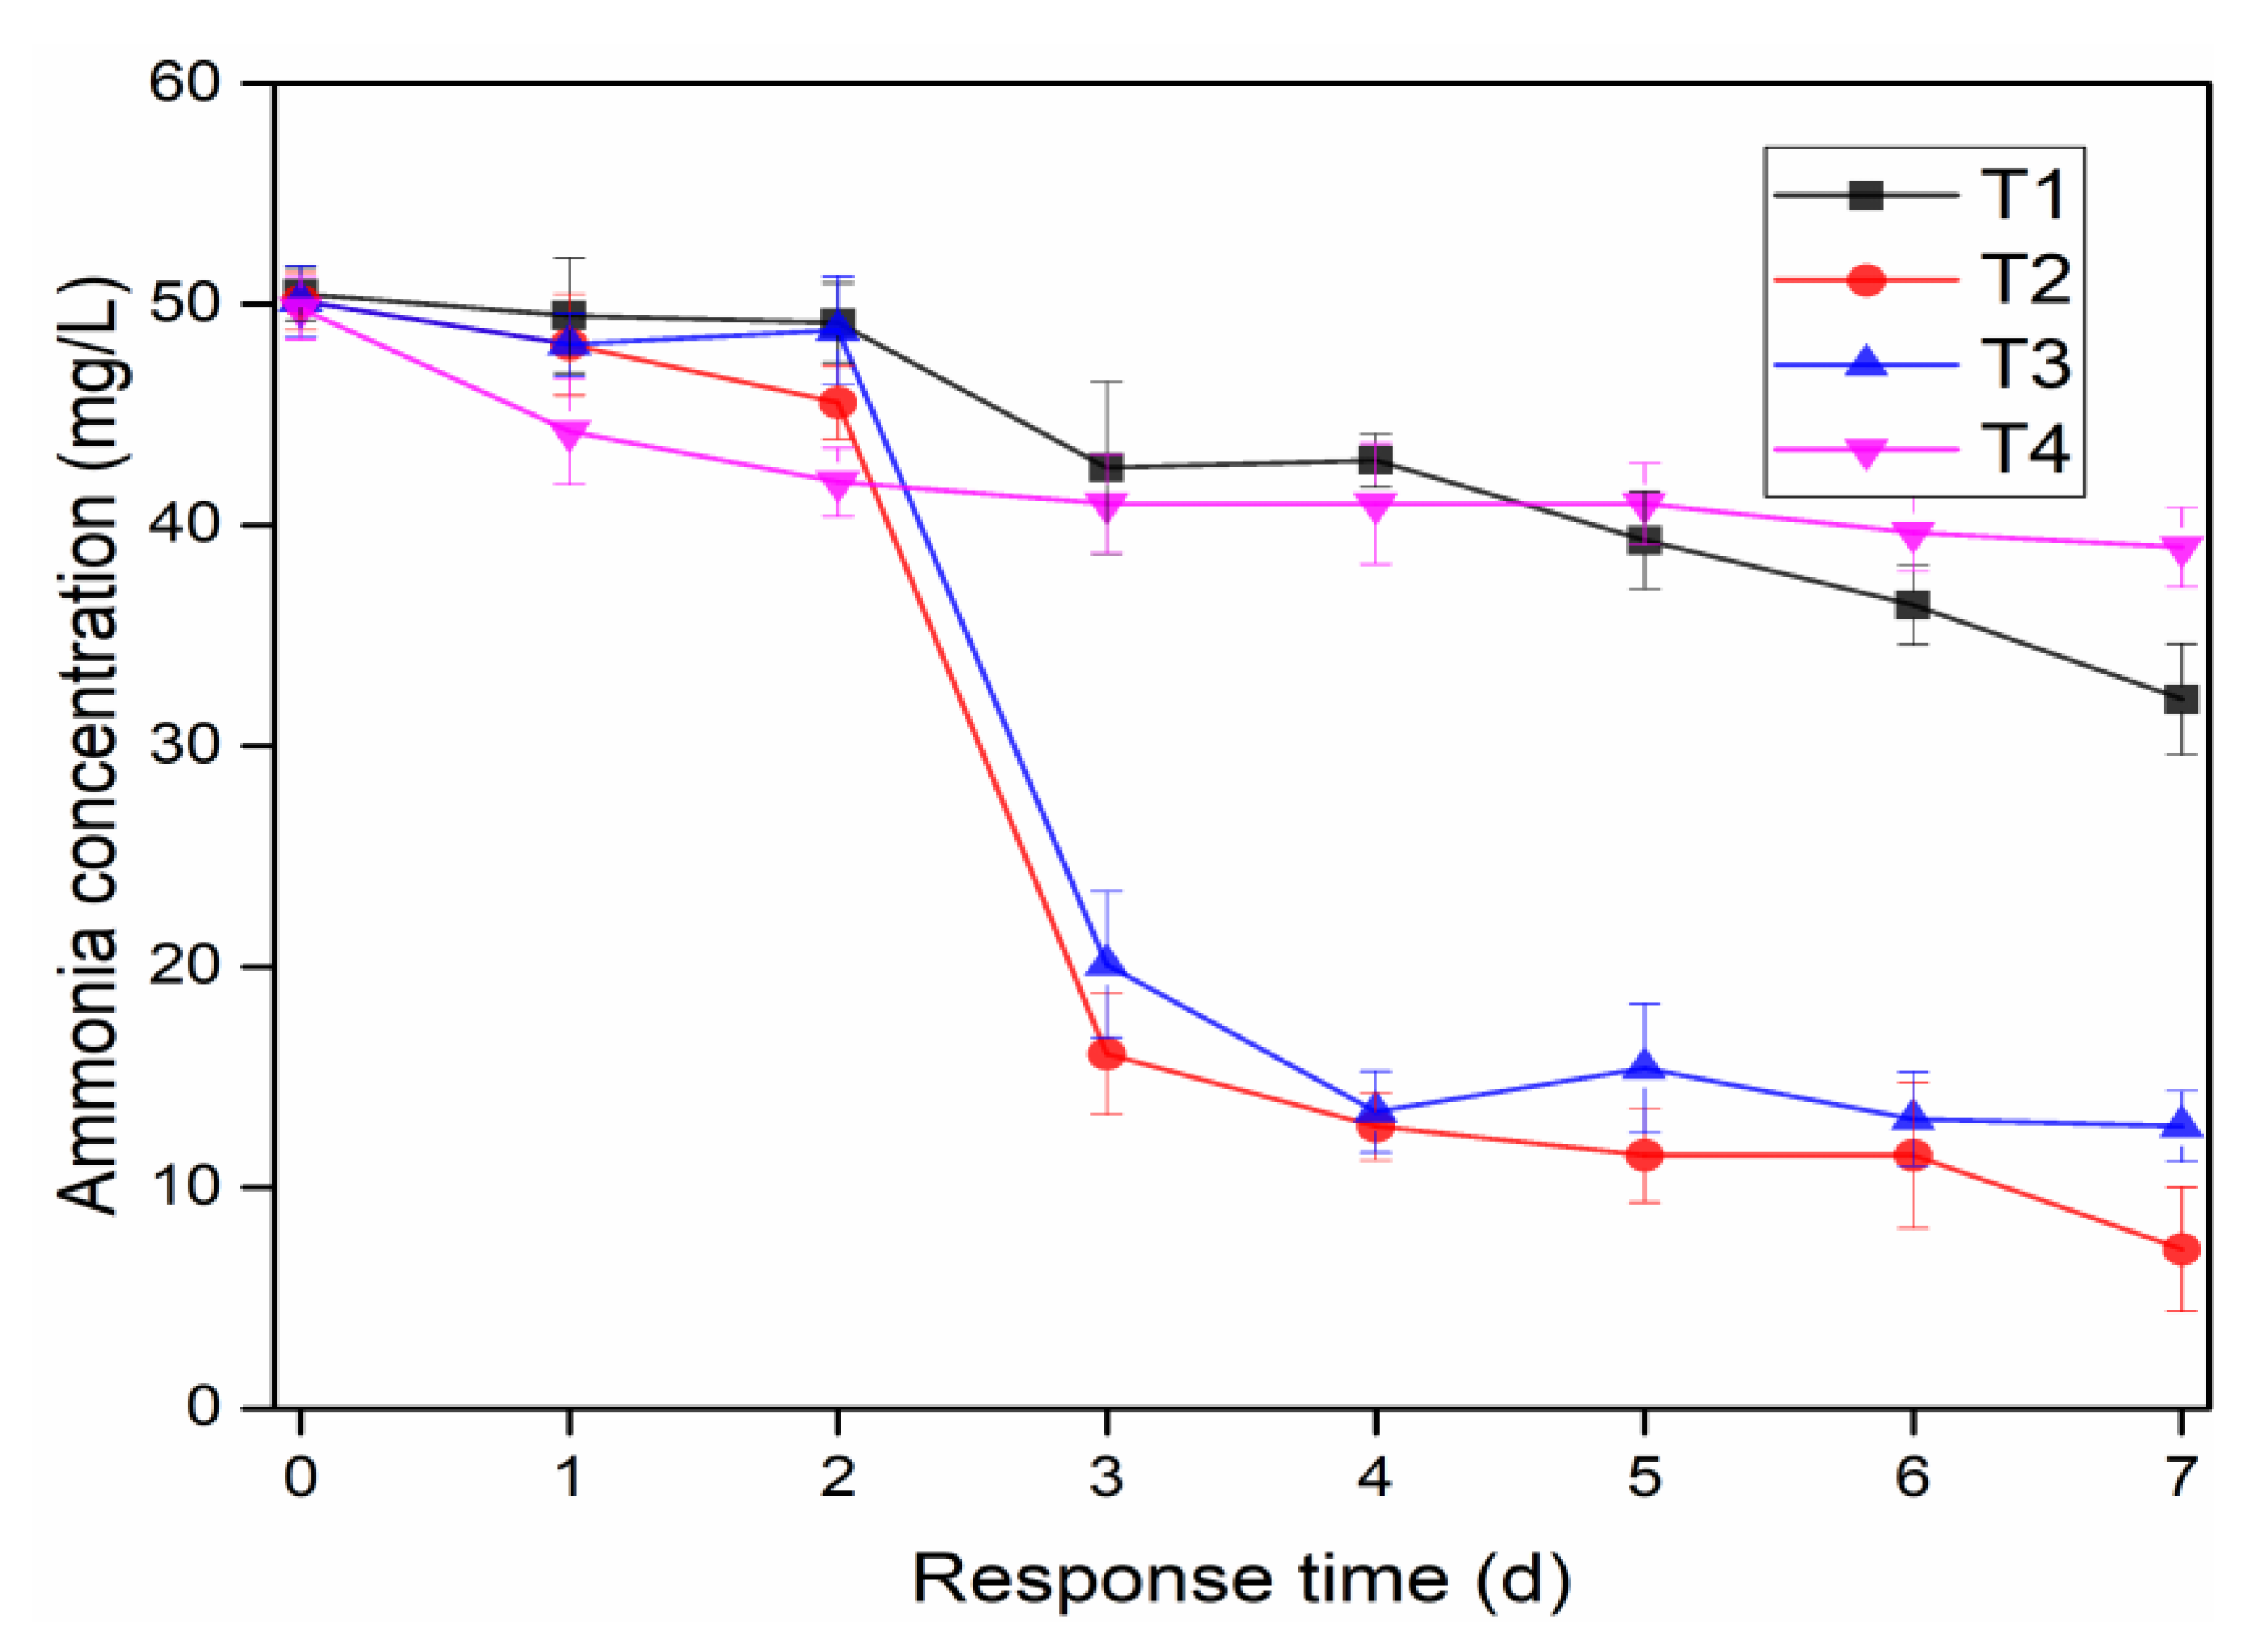
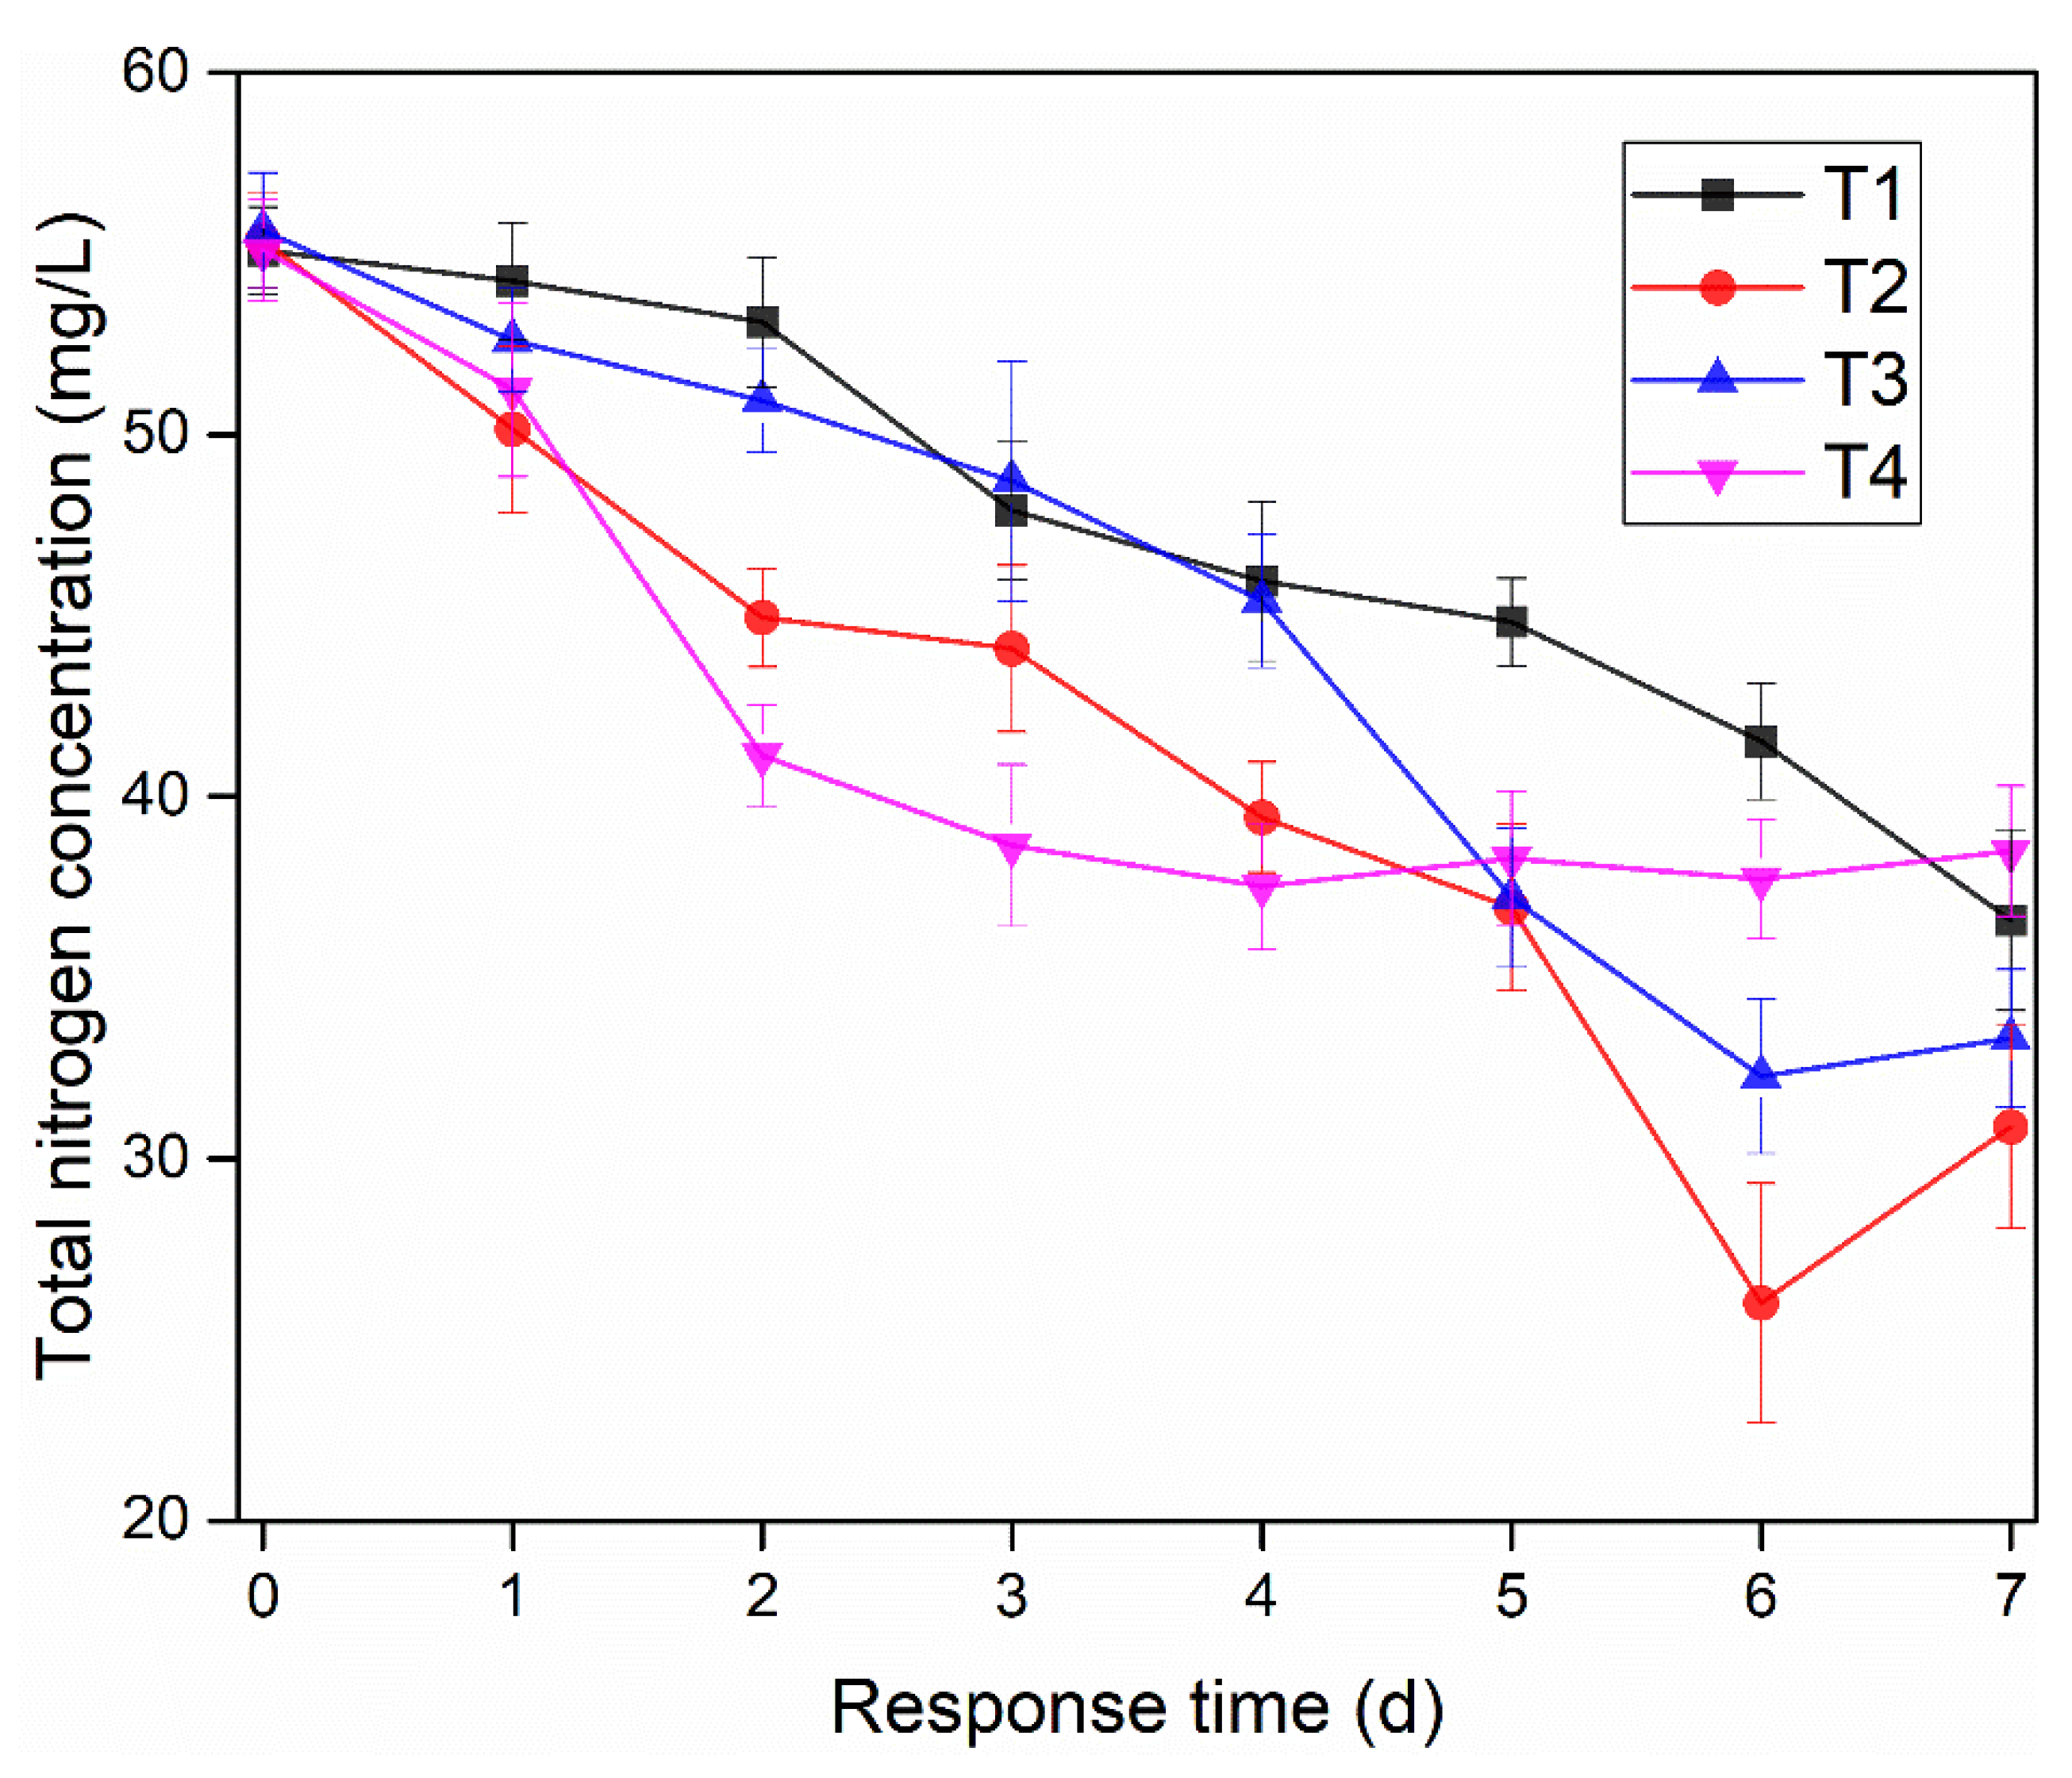
3.1. Effects of Microbial Nanospheres on NH4+-N and TN Removals

The optimal carrier material ratio of microbial nanospheres was established through the analysis of measured data of water purification effects. As shown in Figure 1 and Figure 2, the concentrations of NH4+-N and TN of each treatment showed a downward trend with the reaction time on the whole, and the removal rate of NH4+-N and TN in T2 treatment was the highest, followed by T3 and T4, while the lowest value was obtained by T1. After seven days of reaction, the removal rates of NH4+-N treated by T1, T2, and T3 were 35.18%, 84.86%, and 73.54%, respectively. The removal rates of TN were 31.60%, 43.69%, and 38.78%, respectively. The results showed that the microbial nanospheres could purify NH4+-N and TN in aquaculture wastewater and the difference in removal effect was caused by the different proportion of NBC powder in the carrier. NBC powder had a large specific surface area and a good bio-compatibility [29]. When the proportion of NBC powder in the carrier was lower, the carrier had smaller pores, poorer bio-compatibility and less microbes adsorbed, resulting in a lower removal of NH4+-N and TN in T1 treatment. However, when the components of NBC powder in the carrier were larger, the numbers of microbes adsorbed by the carrier would be increased, therefore the removal effects of NH4+-N and TN in T2 and T3 treatment were better than that of T1. Moreover, the concentrations of NH4+-N in T2 and T3 were decreased significantly on the third day of reaction compared with that before, and the removal rate of NH4+-N in T2 and T3 reached by 65.64% and 61.84%, respectively. It might be that in the early days, photosynthetic bacteria, yeast, and lactic acid bacteria in nanospheres carrier did not adapt to the new environment, so the removal rate was not high. With the increase of reaction time, photosynthetic bacteria, yeast, and lactic acid bacteria in nanospheres carrier began to play a role and resulted in NH4+-N concentration declined dramatically in third day. Our results were in line with those of the research using EM in moving bed biofilm reactor [30]. Results also exhibited the slight increase of TN concentration in T2 and T3 on the seventh day. It might be due to the shortage of carbon source required by microbes which inhibited denitrification during the continuous purification of aquaculture wastewater [31]. However, the maximum removal rates of NH4+-N and TN in T2 treatment were improved compared with that in T1 and T3 treatments, indicating that proper addition of NBC powder in microbial nanospheres could significantly improve the NH4+-N and TN purification effect.

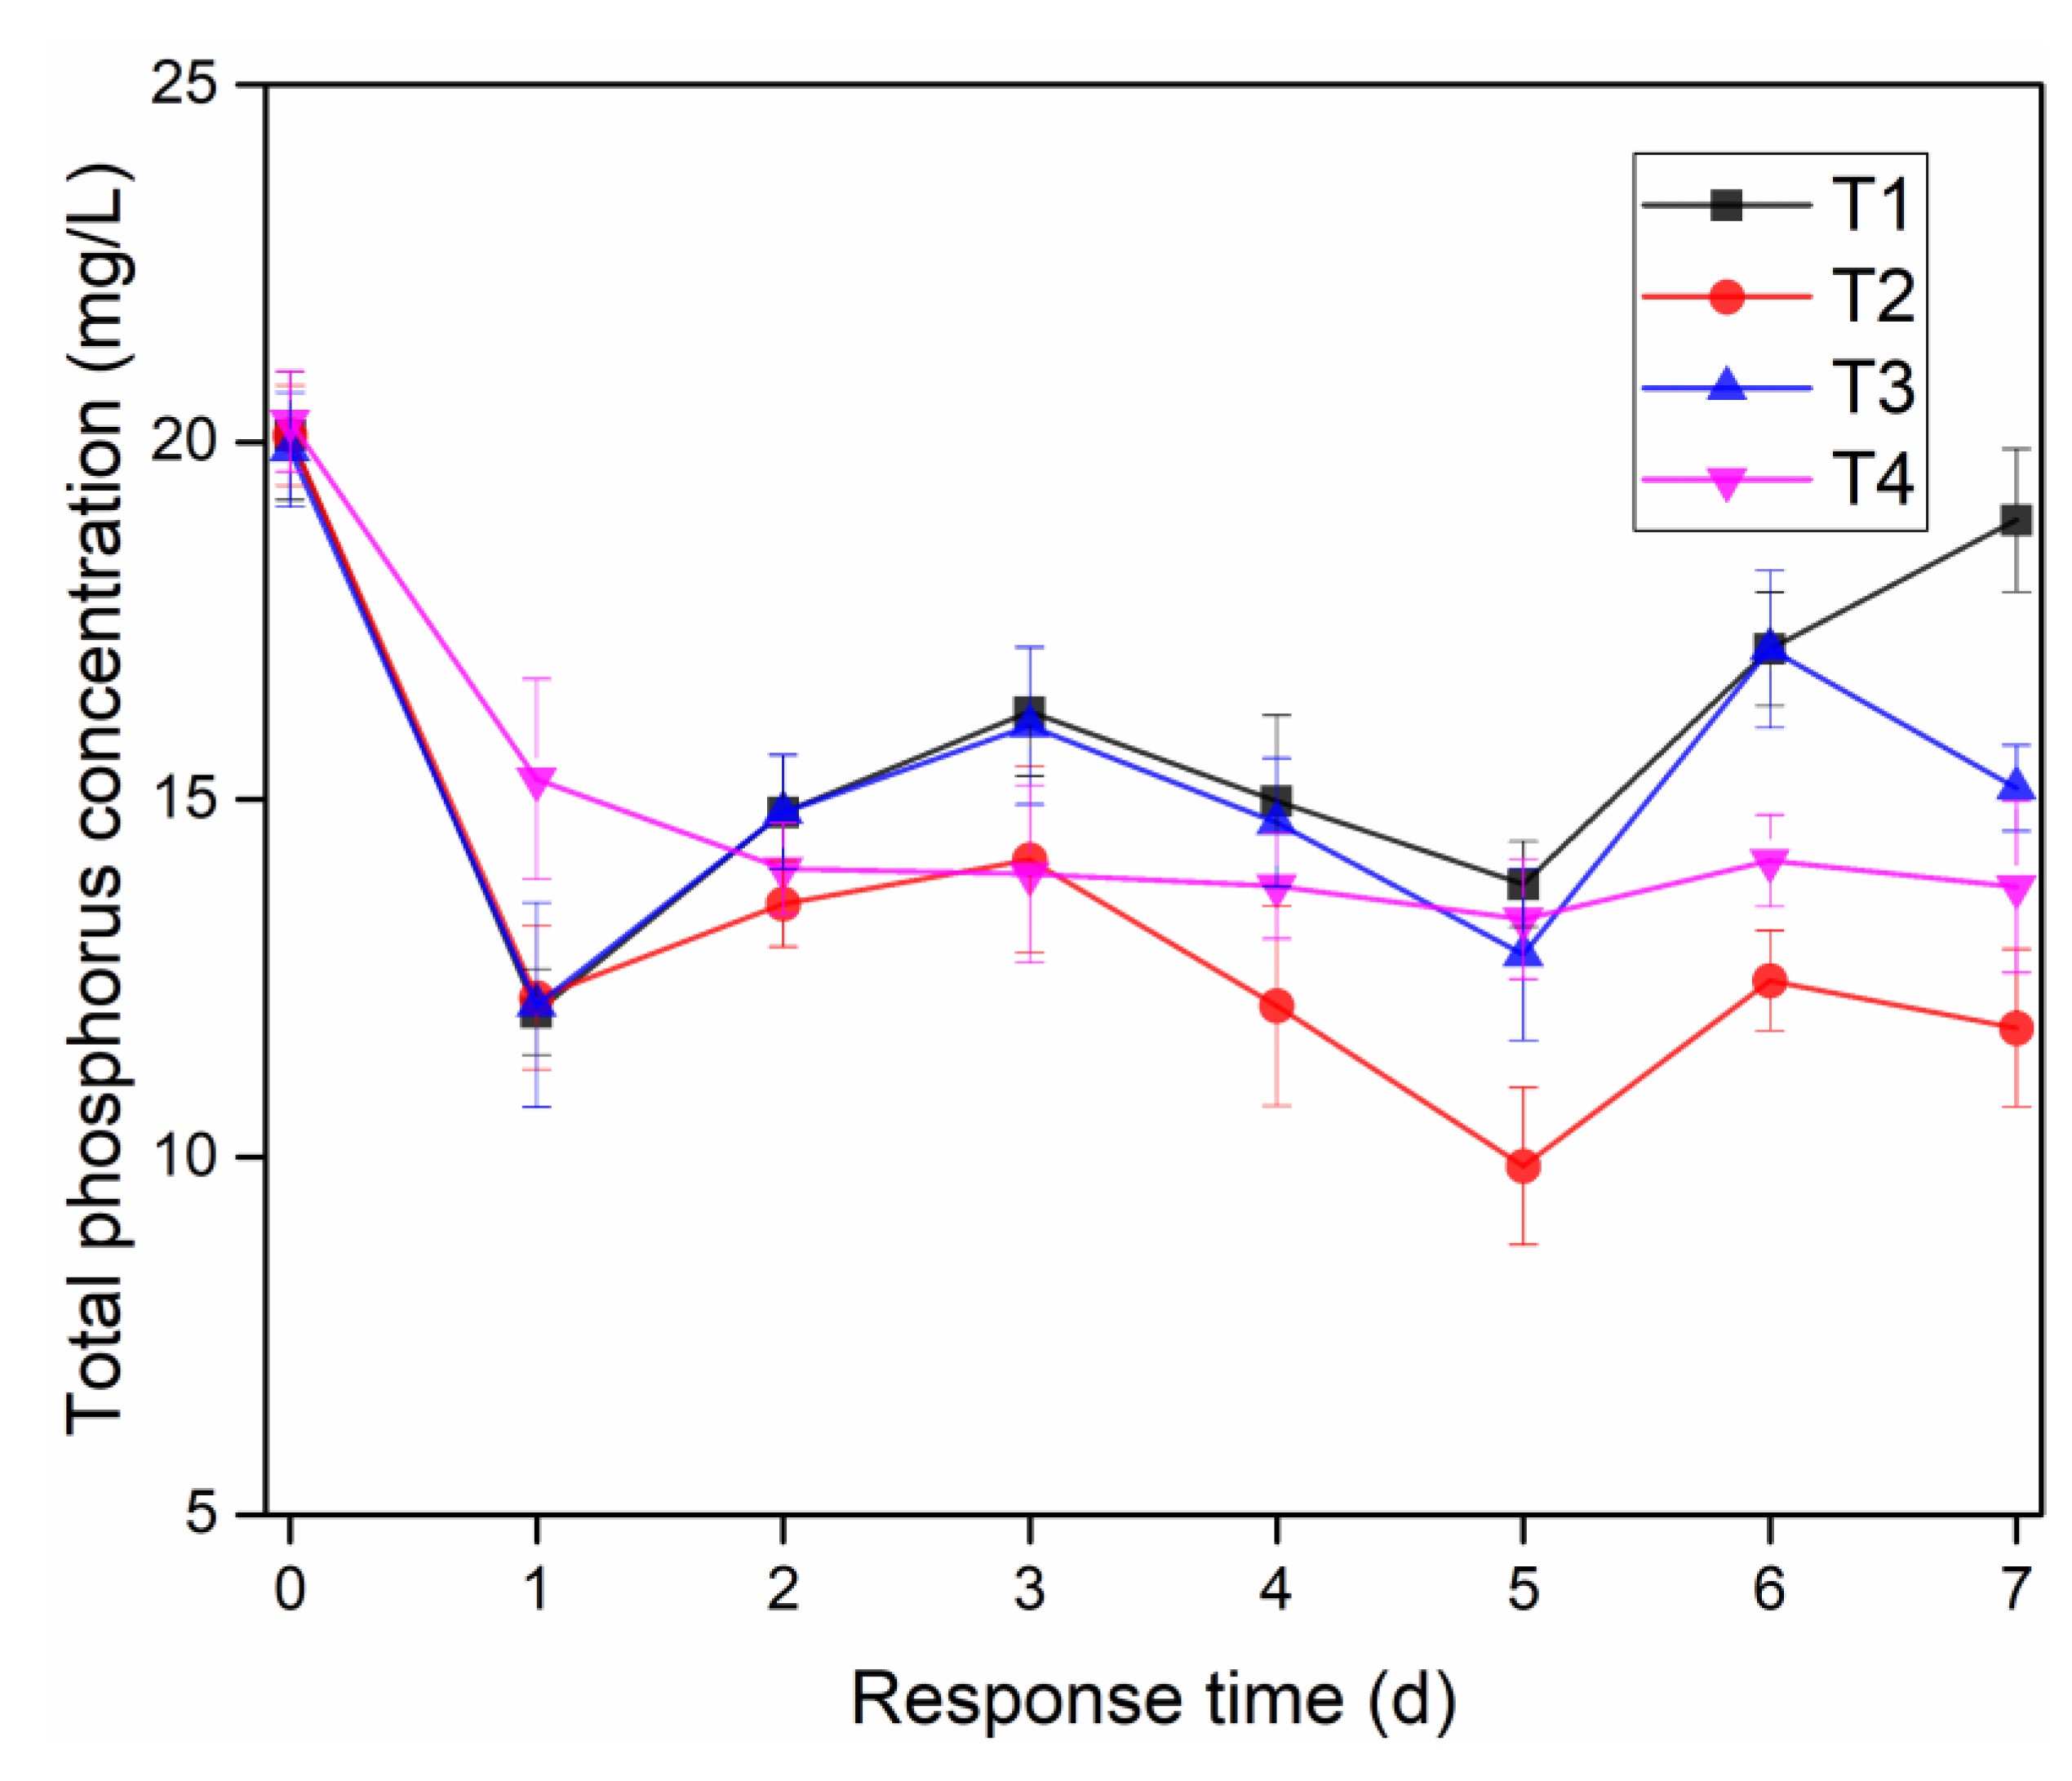
3.2. Effect of Microbial Nanospheres on the Removal of Total Phosphorus

As shown in Figure 3, the concentrations of TP for each treatment were decreased first, then followed by increasing and decreasing cycle with the response time, and the TP concentration in T2 was relatively lower than that for T1 and T3. Besides, the maximum TP removal rates of the T1, T2, and T3 were 30.25%, 50.35%, and 35.45%, respectively. This was mainly related to the mechanism of EM in nanospheres to remove TP. Under anaerobic conditions, the form of PO43−-P was released and then removed phosphorus under aerobic conditions by the action of polyphosphate bacteria in EM. After the nanospheres were added to the aquaculture wastewater, the polyphosphate bacteria contained in the EM nanospheres would absorb the phosphorus in the wastewater and occur the oxidative decomposition reaction under aerobic condition [32]. When the reaction proceeded to a certain extent, the oxygen content in the wastewater was insufficient. In the anaerobic state, the polyphosphate bacteria would release the absorbed phosphorus. Since the phosphorus deposits in the experiment were not eliminated on time, most of them could only be adsorbed by the carrier, so the TP removal rate was stable and not high [33]. From Table 3, the results showed that nanospheres with larger additive contents of NBC possessed higher BET specific surface area. Previous studies have reported that immobilized microbial carriers with larger specific surface area would possessed higher absorbability of cells [34,35]. As a result, a higher removal effect of TP was observed with T2 in comparison to T1. However, the TP removal effect of T3 was significantly lower than T2. A reasonable explanation was that too many EM accumulated in nanospheres consumed DO drastically. Under anaerobic conditions, EM activity was inhibited, while polyphosphate (poly-oly-P) degrades and orthophosphate was released to water [36]. Only appropriate addition of NBC powder to the carriers could increase the removal effect of microbial nanospheres.

3.3. Effect of Nanospheres With and Without Microbes on the Purification

The adhesion of microbes on the nanospheres is related to the surface shape on the one hand, and the pore structure on the other [37]. It is assumed that the pores of the nanospheres are in the shape of cylindrical pores, which can be divided into micro-pores below of 2 nm, meso-pores of 2 to 50 nm, and macro-pores larger than 50 nm, according to the pore radius [38]. As shown in Figure 4, the type-II isotherms could be observed in T2 nanospheres, which means mesoporous and macropores were the typical feature of T2. The SEM photos indicated that the surface of the T2 nanospheres was rough, with low smoothness and many grooves on the surface (Figure 5a). The rough surface distributed with abundant pore structures was beneficial for the microorganisms to grow onto the nanospheres. The pore volume recorded by T2 nanospheres was 0.43 cm3/g, and the average pore diameter was about 7.32 nm, while the total surface area of the nanospheres was about 45.01 m2/g. These pores provide a large surface area for the nanospheres (Table 3). Figure 5b indicated that microorganisms were immobilized in the nanosphere’s pores which maintain a high biomass concentration. As indicated in Figure 1, Figure 2, and Figure 3, after seven days of treatment, the removal rates of NH4+-N in T2 and T4 were 84.86% and 22.28%, the removal rates of TN were 54.60% and 31.04%, and the removal rates of TP were 50.35% and 31.95%, respectively. Without EM activated calcium liquid immersing, nanospheres also had certain purification effect for aquaculture wastewater, because the NBC and zeolite powder are multiple porous materials which have some physical adsorption for nitrogen and phosphorus of aquaculture wastewater [39].
The results mentioned above indicated that the physical adsorption was limited. Only obvious adsorption effect at the first and second day, the porous adsorption of nitrogen and phosphorus may be reached a fixed value and don't change anymore from the third day to seventh day. However, its removal effect of immobilizing microbes in the nanospheres for NH4+-N and TP are significantly high than those of T4, demonstrating microbes playing an important role in purifying pollutants in aquaculture wastewater.

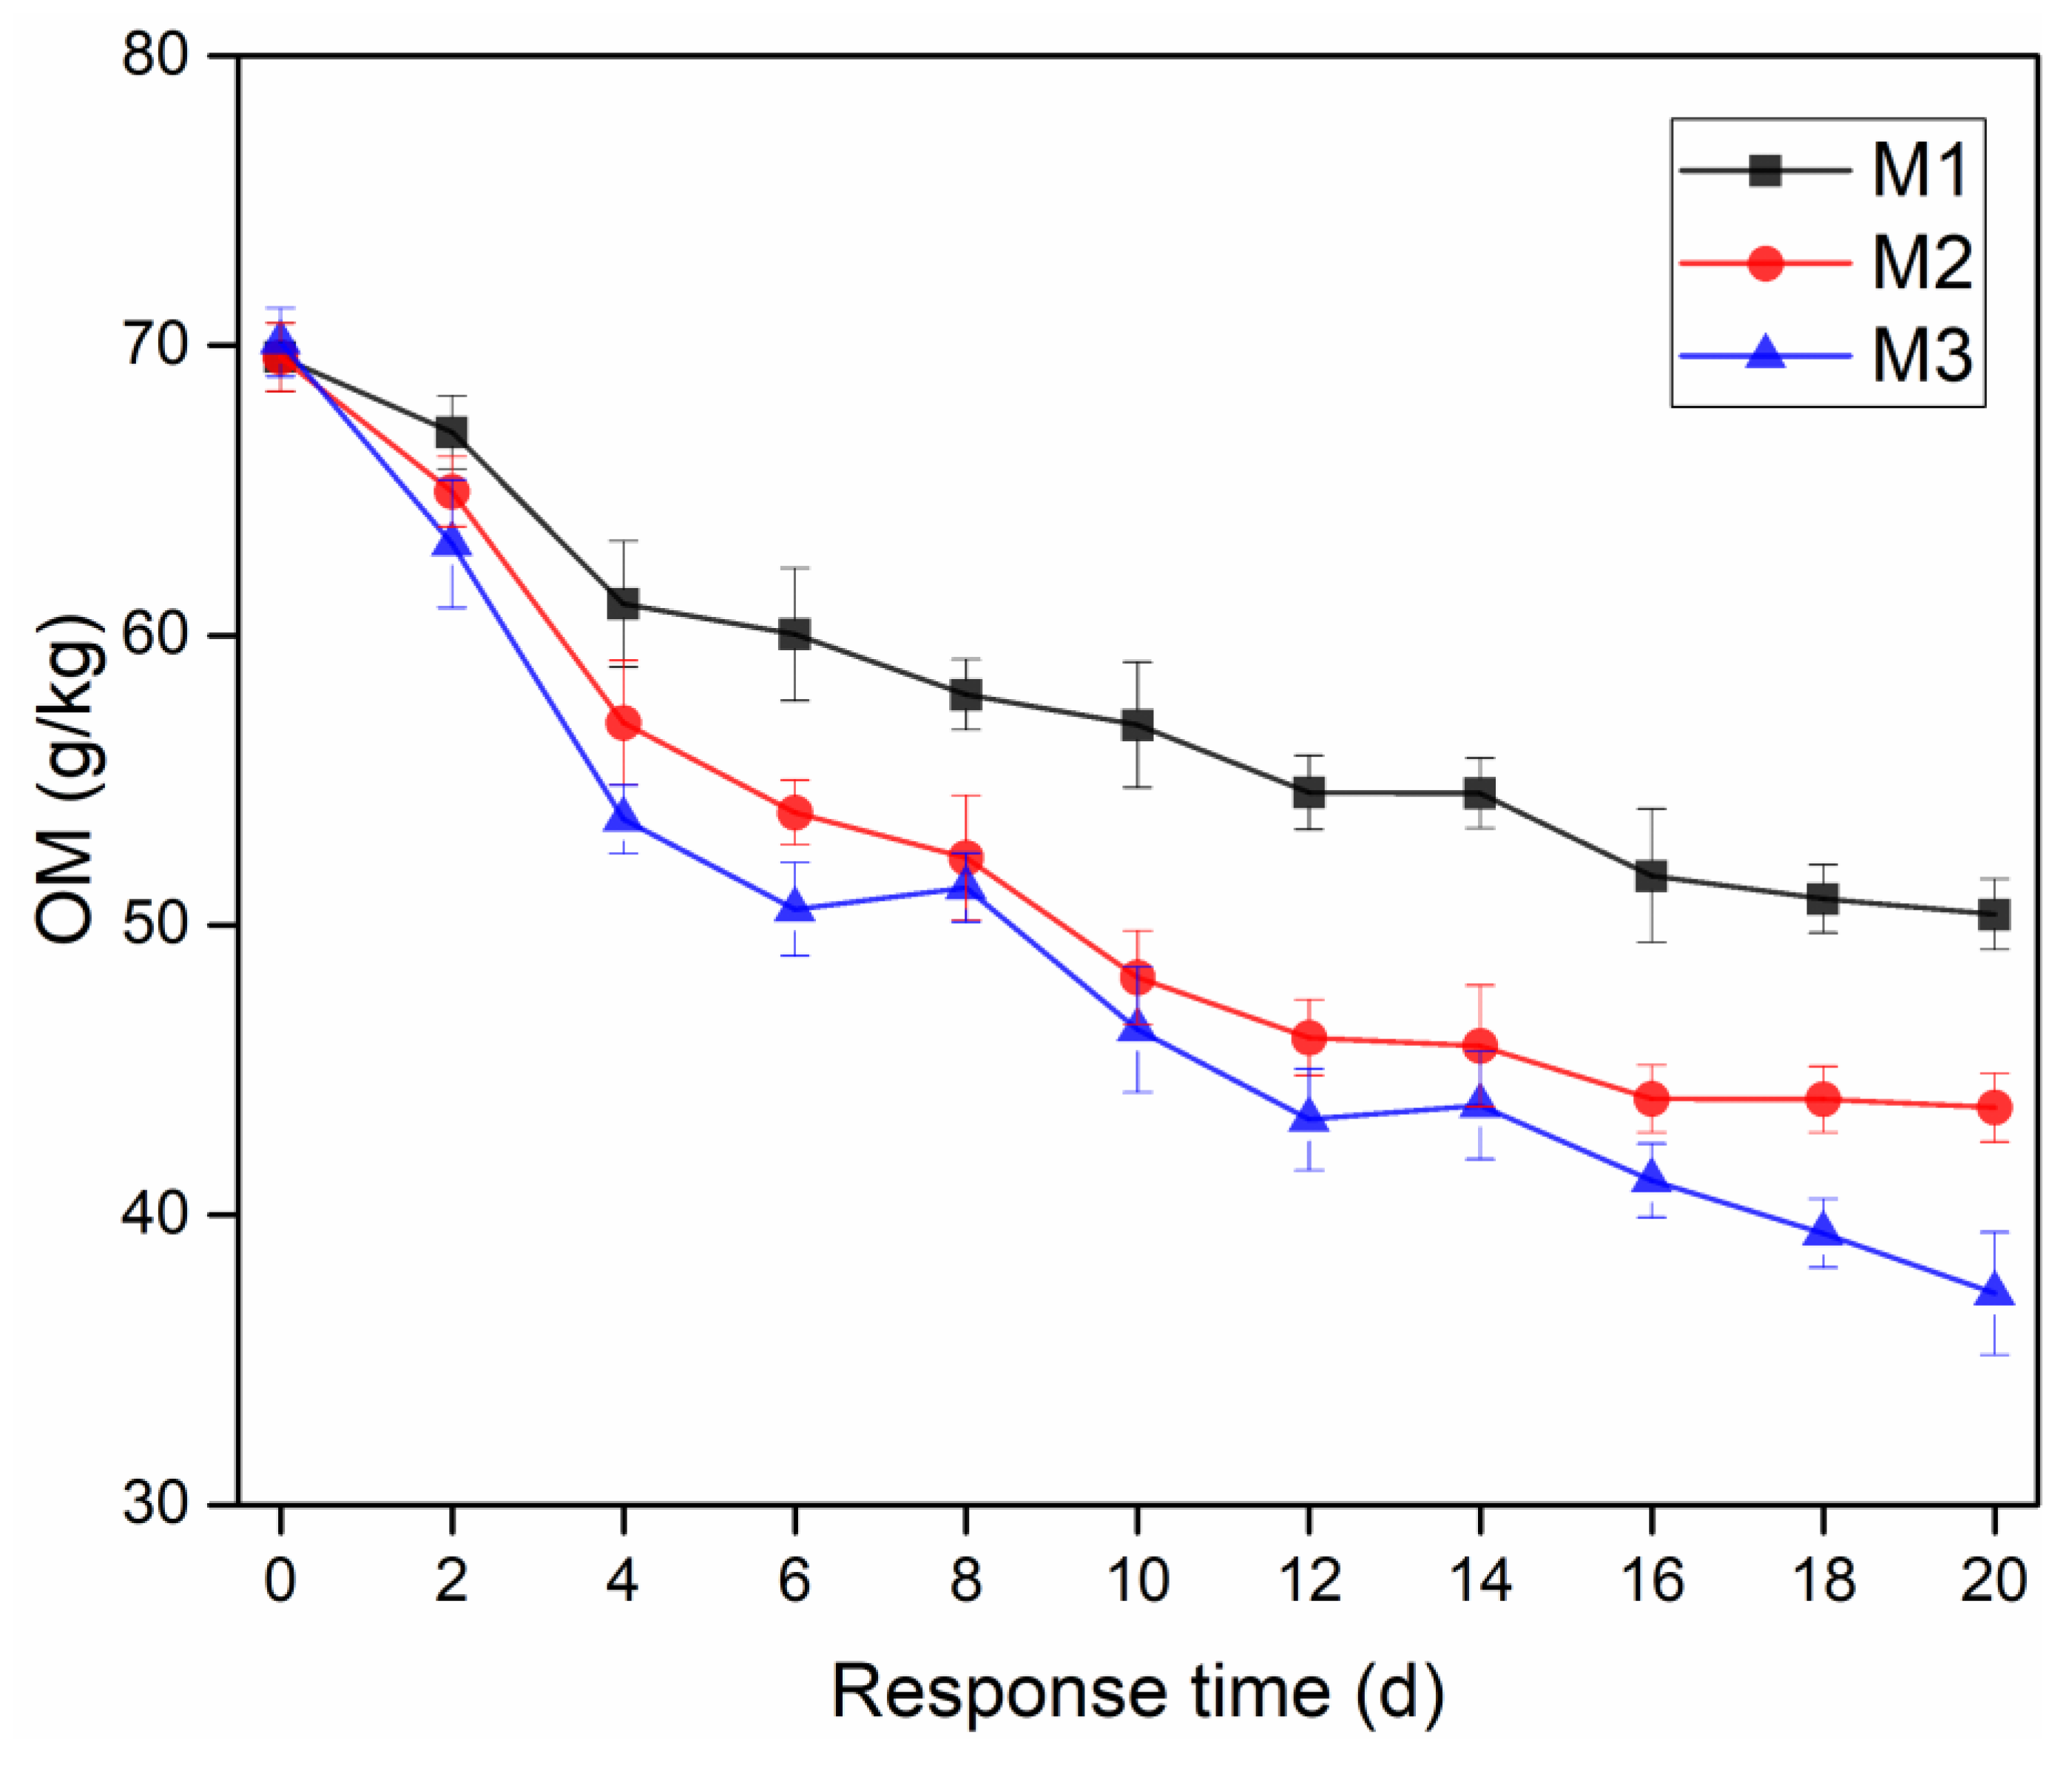
3.4. Effects of Dosage Methods on Removal of OM in Sediment

Higher OM in the aquaculture sediment might polluted the overlying waters and lead to black and smelly water body. Degrading the OM in the sediment and eliminating it is an effective way to control the water quality [40]. The degradation of OM in the aquaculture sediment was mainly affected by its content, environmental factors, and indigenous microorganisms. After the microbial nanospheres were put into the aquaculture water, the microbes along with the nanospheres sank to the bottom and formed the dominant flora by adapting to the environment to degrade the OM. Similar observation was noticed with those of Wang et al. [41].
As shown in Figure 6, the removal rate of OM was M3 > M2 > M1 after 20 days of treatment. The contents of OM in the M1, M2, and M3 groups were reduced by 19.17%, 25.99%, and 32.38%, respectively. The OM in the aquaculture sediment was decreased significantly in fourth day after the addition of microbial nanospheres, and then decreased at a slower rate. This might be that the microbes in the sediment had low activity due to insufficient bio-available nutrients in the reaction system as well as the lack of DO with the progress of the reaction. The nutrients required by the microbes for OM removal were insufficient compared with those at the initial stage of the experiments and the removal effect was weakened. The addition of microbial nanospheres improved the activity of indigenous microbes in the sediment to a certain extent and activated them to degrade OM. On the one hand, the results indicated that the method of multiple addition could ensure higher microbial activity to degrade more OM than that using one-time addition. Sahar et al. came to a similar conclusion about multiple addition measure to promote performance of pollutant purification in biological strengthening technology [42]. On the other hand, appropriate aeration could further improve the removal rate of OM in sediment. Aeration could ensure sufficient DO and relatively higher microbial activity in reaction system [43], thus accelerating microbial metabolism processes so as to increase the removal rate of OM.

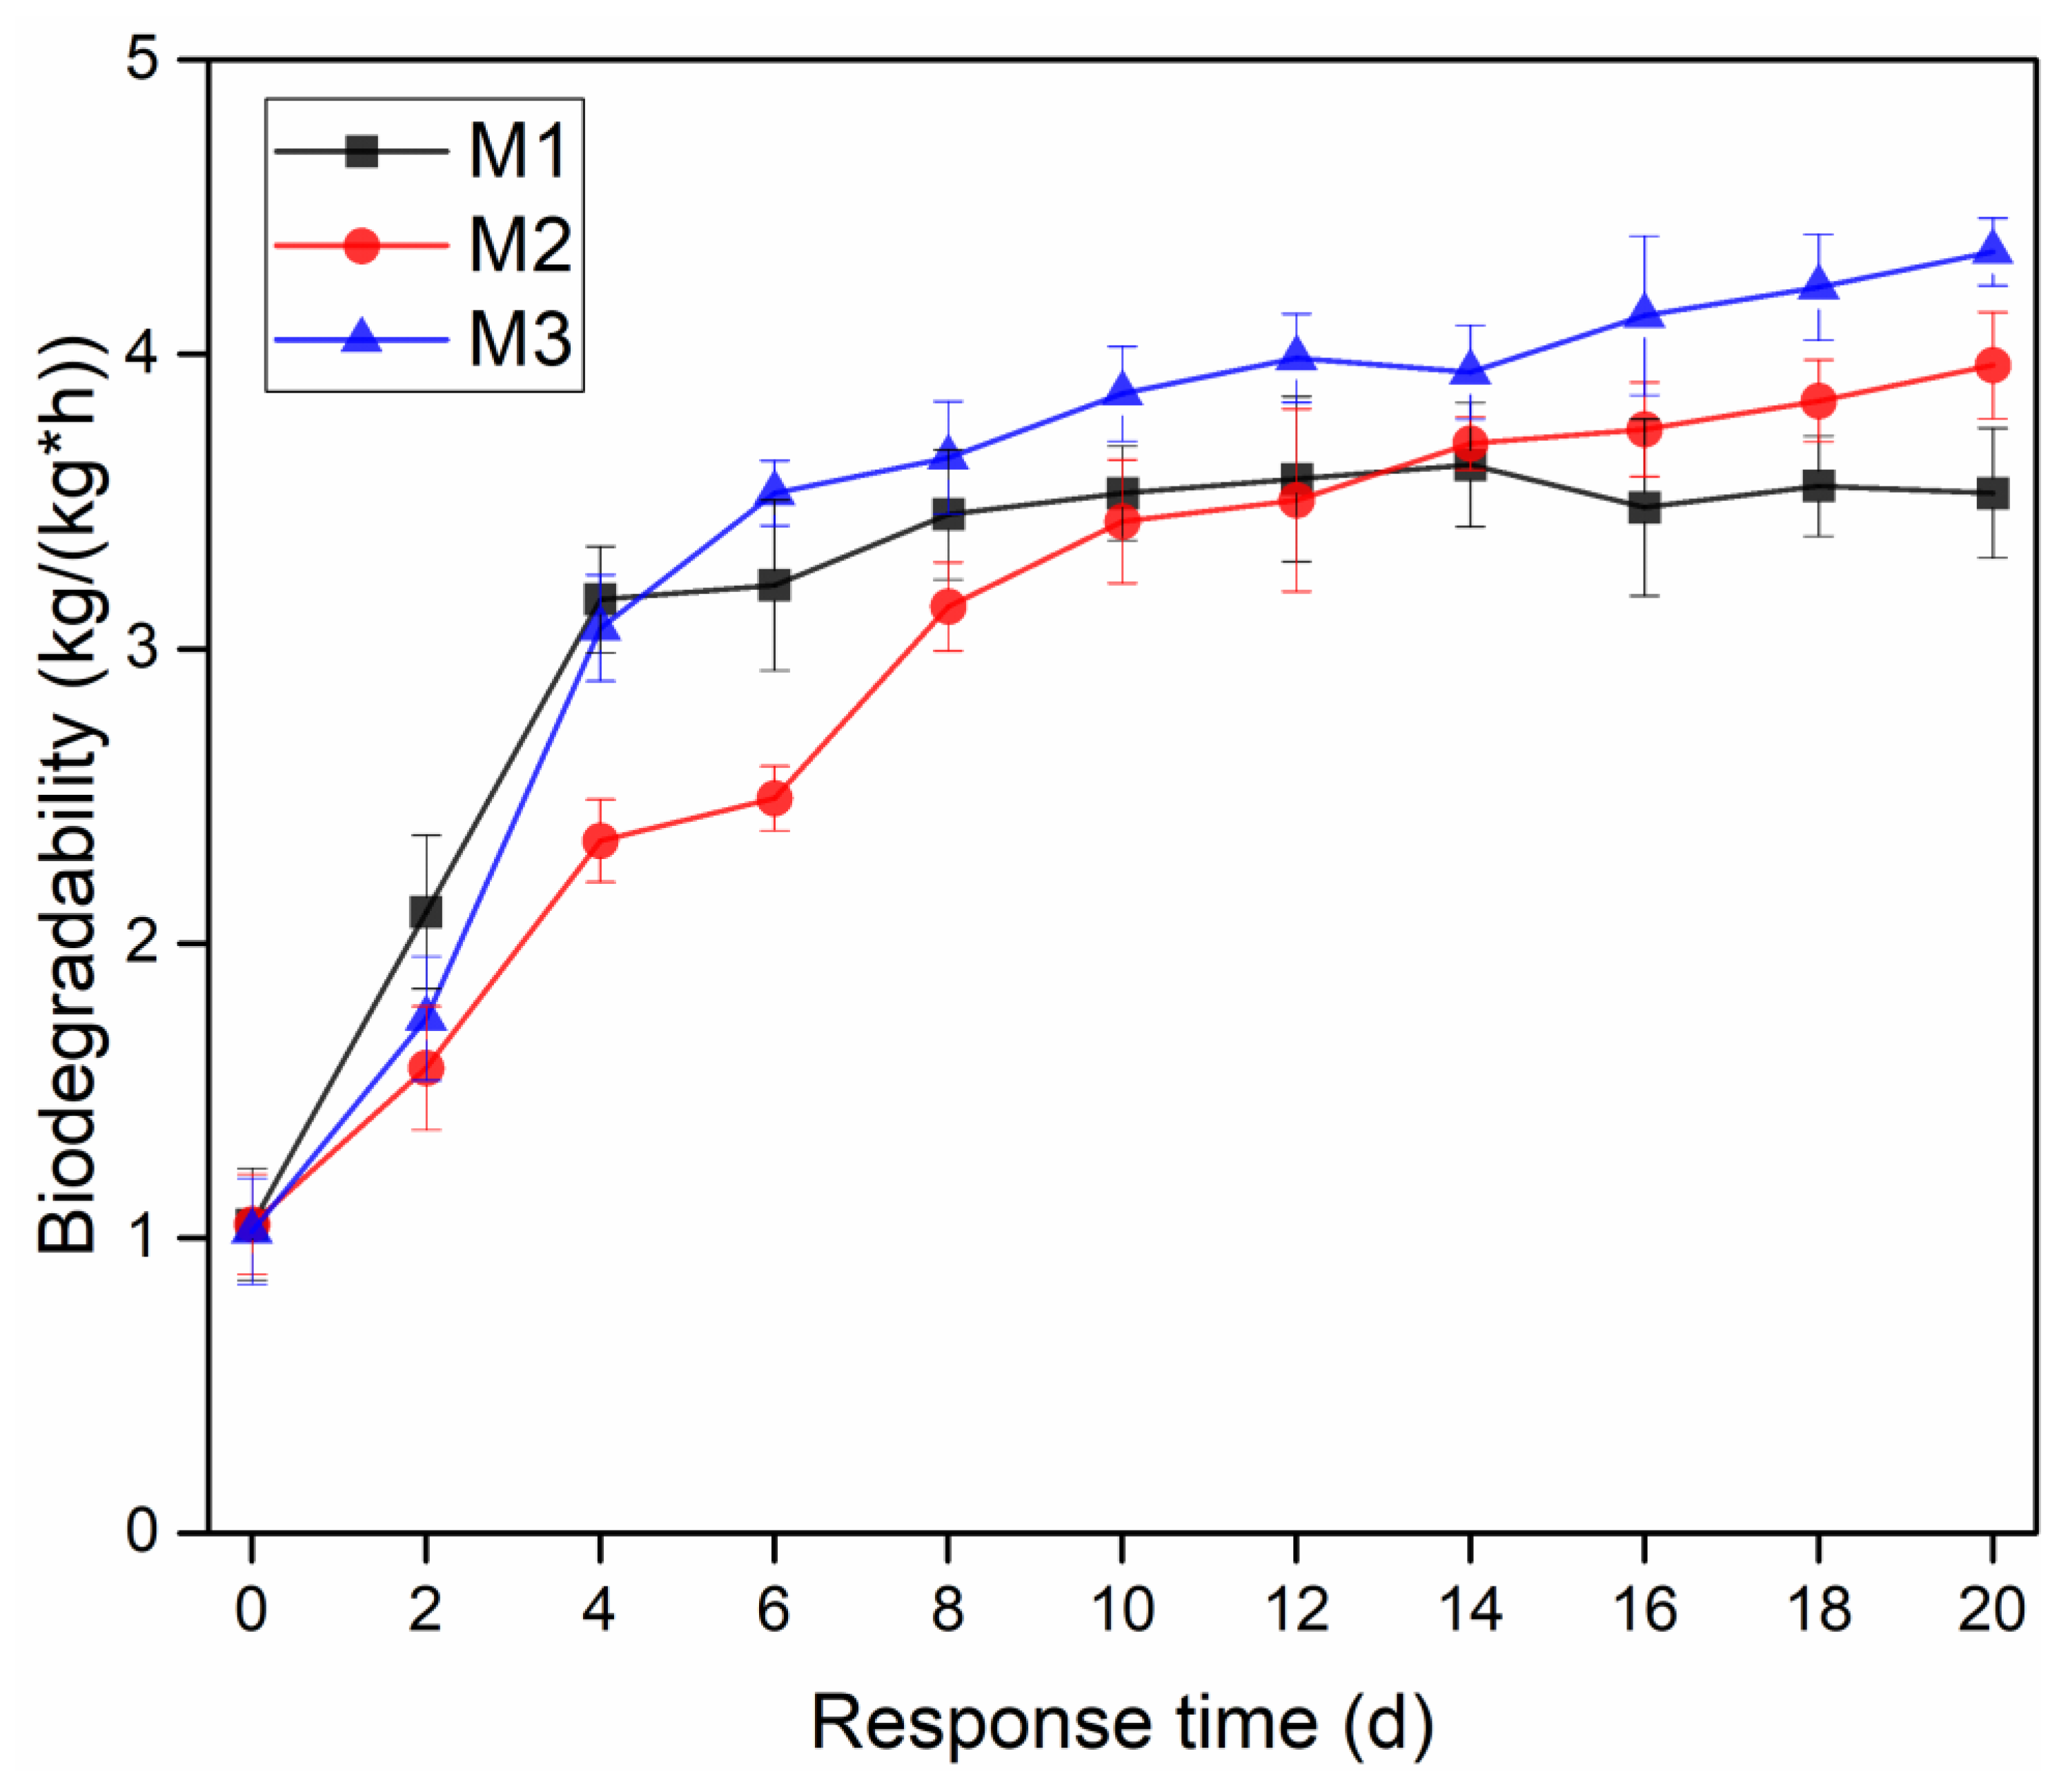
3.5. Effects of Dosage Methods on Biodegradability of Sediment

Biodegradability is an important characterization of microbial activity, reflecting the strength of bio-remediation [44]. Indigenous microorganism activity in the aquaculture sediment is relatively lower because of poor environment. In the system added the microbial nanospheres, the microbial activity could have large improvement and biodegradability was strengthened since microbial reproduction rate was accelerated. EM attached to the microbial nanospheres would also relieve the pressure of the indigenous microbial purification. In general, the high G value of the aquaculture sediment suggested a great improvement in biodegradation activity, which was closely linked to the mineralization of OM [45]. The G value of M1 increased the most in the first four days, and it was lower than that of M2 and M3 after ten days, as seen in Figure 7. On the 20th day, the G value was M3 > M2 > M1.
The results demonstrated that adding microbial nanospheres could effectively prompt microbial decomposition of organic pollutants, lessening the pressure of indigenous microorganisms in the aquaculture sediment. However, for M1 group, although early G value was bigger, nutrients were insufficient to meet the growth of microbial needed in reactive system as the reaction time gone on, a large number of microbes would die and G value would decline late. Fractional addition and aeration treatment (M3 group), on the other hand, could keep higher microbial activity and provide oxygen required in the process of microbial metabolism and degradation of organic matter, the G value was continually increased [46]. After 20 days of reaction, the G value of the M1, M2, and M3 treatment groups was 3.53 kg/kg·h, 3.99 kg/kg·h, and 4.37 kg/kg·h, respectively. It could be seen that fractional addition and aeration would effectively improve the biological activity and increase the G value.

3.6. Evaluation of Sediment Bioremediation in a Practical Aquaculture Pond

The field-scale test was carried out to verify the feasibility of the sediment bioremediation technology. The monitoring results of the corresponding sediment indexes are shown in Table 5. Under sediment bioremediation conditions, the mean sediment G value of pond II increased from 0.98 kg/(kg·h) to 3.12 kg/(kg·h), while the sediment G value of pond I without biological repair was gradually declined. The biodegradability of sediment was closely related to the species and number of sediment microorganism [47]. The addition of the microbial nanospheres makes the EM become the dominant microflora in aquaculture ponds and strengthens its pertinence and ability to degrade organic matter [48]. In general, the high G value of the sediment suggested a great improvement in sediment biodegradation activity, which is closely linked to the mineralization of OM [49]. The decrease of OM and sediment thickness (ST) in pond II further substantiated these findings. The results of the present study indicated that the integrated technique of the microbial nanospheres dosage with aeration had a good sediment biological purification effect, which is applicable to solve the problem of endogenous pollution in aquaculture ponds [50].

4. Conclusions

Results showed that the proportion of NBC powder in the immobilized carrier had a significant influence on the purification effect of pollutants on aquaculture wastewater. When the mixture ratio in the carrier for NBC powder: zeolite powder: bottom mud was 10%: 15%: 75%, the microbial nanospheres had the best purification effect on NH4+-N, TN, and TP in aquaculture wastewater. The maximum removal rates of NH4+-N, TN, and TP reached 84.86%, 52.29%, and 50.35%, respectively. Under the addition of equal amount of microbial nanospheres, the removal effect on OM in the sediment of one-time dosage was lower than the multiple addition. After 20 days, the OM content by adding microbial nanospheres in batches was reduced by 25.99% and it was significantly increased by 35.58% compared with the one-time dosage with microbial nanospheres. Moreover, the OM content was reduced by 32.38% in the treatment with aeration. Although the one-time addition of microbial nanospheres could significantly improve the G value in the initial stage, the latter G value was not as good as that of the multiple addition of microbial nanospheres. After 20 days of reaction, the G value of M1, M2, and M3 was improved by 253%, 299%, and 337%, respectively. It showed that the effect of improvement of G value by adding microbial nanospheres in batches was better than the addition of one time. Appropriate aeration treatment could further improve the G value. The results of in situ aquaculture pond experiment indicated that the microbial nanospheres dosage with aeration had a good sediment bio-remediation effect, which is applicable to solve the problem of endogenous organic pollution in aquaculture ponds.

Author Contributions

Conceptualization, S.Y. and Z.H.; methodology, S.Y.; software, W.L.; validation, S.Y., Z.H. and W.L.; formal analysis, M.M.A.E.; investigation, S.Y.; resources, S.Y.; data curation, M.M.A.E.; writing—original draft preparation, S.Y.; writing—review and editing, Z.H.; visualization, W.L.; supervision, Z.H.; project administration, S.Y.; funding acquisition, Z.H. All authors have read and agreed to the published version of the manuscript.

Funding

This research was funded by the Jiangsu Scientific Research Program, grant number BE2015705 and BE2017765; by the Fundamental Research Funds for the Central Universities, grant number 2019B45214 and 2019B18314 and 2017B692X14; by the Science and Technology Project for Nanjing Water Conservancy Bureau, grant number 20130317-1 and 2019-208-6; by the Postgraduate Research & Practice Innovation Program of Jiangsu Province, grant number KYCX17-0441 and by the Undergraduate Student Research Training Program of the Ministry of Education.

Acknowledgments

This work was financially supported by the Jiangsu Scientific Research Program (BE2015705, BE2017765) and the Fundamental Research Funds for the Central Universities (2019B45214, 2019B18314, 2017B692X14) and the Science and Technology Project for Nanjing Water Conservancy Bureau (20130317-1, 2019-208-6) and the Postgraduate Research & Practice Innovation Program of Jiangsu Province (KYCX17-0441) and the Undergraduate Student Research Training Program of the Ministry of Education.

Conflicts of Interest

The authors declare no conflict of interest.

References

  1. Ye, H.; Zhu, J.Q.; Li, G. Advances in Water Purification for Pond Freshwater Aquaculture. Adv. Mater. Res. 2018, 955–959, 3928–3932. [Google Scholar] [CrossRef]
  2. Wei, W.U.; Fan, L.M. Pollution and Control Measures of Aquaculture Environment. J. Agric. Sci. Technol. 2014, 56, 563–587. [Google Scholar]
  3. Wang, J.; Lina, L.I.; Chen, M.; Feng, X.; Qin, C.; Tang, G.; Jing, L. Research on total phosphorus and total nitrogen emission status of main pollution sources in China. Environ. Pollut. Control 2015, 43, 416–431. [Google Scholar]
  4. Wu, C.; Zhou, Y.; Sun, X.; Fu, L. The recent development of advanced wastewater treatment by ozone and biological aerated filter. Environ. Sci. Pollut. Res. 2018, 25, 8315–8329. [Google Scholar] [CrossRef] [PubMed]
  5. Chen, H.; Weng, Q.; Jindeng, L.U. Purification effect on water with different concentrations of TN by artificial floating bed cultivation of Ipomoea aquatica. J. Hubei Univ. 2016, 43, 21–32. [Google Scholar]
  6. Cui, Y. Review of Constructed Wetland Sludge Treatment Technology. J. Jilin Agric. Univ. 2017, 54, 145–154. [Google Scholar]
  7. Peng, G.; Liu, W.J.; Tong, J.; Yan, W.H.; Lu, Q.P.; Tang, J.Q. Ecological Aquaculture Analysis in a Recirculating Water Pond. Fish. Sci. 2010, 78, 326–331. [Google Scholar]
  8. Brown, T.W.; Tucker, C.S.; Rutland, B.L. Performance Evaluation of Four Different Methods for Circulating Water in Commercial-Scale, Split-Pond Aquaculture Systems. Aquac. Eng. 2015, 70, 33–41. [Google Scholar] [CrossRef] [Green Version]
  9. Górski, R.; Kleiber, T. Effect of Effective Microorganisms (EM) on nutrient contents in substrate and development and yielding of rose (Rosa x hybrida) and gerbera (Gerbera jamesonii). Ecol. Chem. Eng. 2010, 17, 505–513. [Google Scholar]
  10. Niu, J.; Cheng, Z.H. Effects of different nutrient concentrations on growth and nutrient absorbance of Gerbera jamesonii growing in substrates at flower budding stage. J. Northwest A F Univ. 2013, 682, 341–356. [Google Scholar]
  11. Khaliq, A.; Abbasi, M.K.; Hussain, T. Effects of integrated use of organic and inorganic nutrient sources with effective microorganisms (EM) on seed cotton yield in Pakistan. Bioresour. Technol. 2006, 97, 967–972. [Google Scholar] [CrossRef]
  12. Mirwandono, E.; Sitepu, M.; Wahyuni, T.H.; Ginting, N.; Siregar, G.A.; Sembiring, I. Nutrition quality test of fermented waste vegetables by bioactivator local microorganisms (MOL) and effective microorganism (EM4). Iop Conf. Ser. Earth Environ. 2018, 122, 012127. [Google Scholar] [CrossRef]
  13. Shan, H.; Obbard, J. Ammonia removal from prawn aquaculture water using immobilized nitrifying bacteria. Appl. Microbiol. Biotechnol. 2017, 57, 791–798. [Google Scholar]
  14. Liu, C.F.; Ding, X.F.; Ding, Z.L.; Yang, X.E. Purification of Tail Water by Combination of EM Fungi with Terrestrial Plants. China Water Wastewater 2013, 76, 130–133. [Google Scholar]
  15. You, Y.; An, L.; Pan, B. Research on Removal of Ammonia Nitrogen from Wastewater by Frozen Immobilized Nitrifying Bacteria. Environ. Prot. Chem. Ind. 2004, 23, 1150–1170. [Google Scholar]
  16. Gan, L.; Ping, H. Immobilization of Fenpropathrin Degradating-enzyme by Ca-alginate. J. Northwest For. Univ. 2006, 4, 123–141. [Google Scholar]
  17. Bao, T.; Chen, T.; Wille, M.-L.; Zou, X.; Frost, R.L.; Qing, C.; Chen, D. Preparation of iron oxide-based porous ceramsite from goethite and application for city wastewater treatment in biological aerated filters. Desalin. Water Treat. 2015, 57, 1–11. [Google Scholar] [CrossRef]
  18. Dongmei, L.I.; Pang, Z.; Zhao, X.; Gouhao, L.I.; Liu, B.; Qin, Z. Investigation on the optimum preparation process conditions of nano-iron oxide and nano-silicon oxide coated sand. Acta Sci. Circumstantiae 2013, 33, 1598–1604. [Google Scholar]
  19. Wang, Z.L.; Lin, Z.Z.; Fan, Z.H. Effect of nanometer Al_2O_3 addition on sintering characteristics of clay ceramsite. Appl. Chem. Ind. 2016, 45, 78–100. [Google Scholar]
  20. Min, X.; Ran, Z.; Gong, X.; Li, C.; Dong, W.; Xia, D. Denitration and adsorption mechanism of heat-treated bamboo charcoal. J. Environ. Chem. 2017, 5, 6194–6200. [Google Scholar]
  21. Wang, Y.; Zhang, Y.; Xiang, Y.U.; Bian, L.; Qin, G.; Qian, X.U. Investigation on Structure and Properties of PP/Nano-( Bamboo Charcoal) Composite. Plastics 2017, 12, 678–698. [Google Scholar]
  22. Soudejani, H.T.; Heidarpour, M.; Shayannejad, M.; Shariatmadari, H.; Afyuni, M. Composts Containing Natural and Mg-Modified Zeolite: The Effect on Nitrate Leaching, Drainage Water, and Yield. CLEAN Soil Air Water 2019, 47, 1123–1143. [Google Scholar]
  23. Wang, L.; Shao, X.H.; Mao, J.Q.; Mao, X.Y.; Yin, C.; Tang, Z.L.; Wang, T. Preliminary Study on Purification of Aquaculture Wastewater by Microbial Nano-Silica Ball. Adv. Mater. Res. 2014, 955–959, 2187–2191. [Google Scholar] [CrossRef]
  24. Ministry of Environmenta Protection of the People’s Republic of China. Water Quality of Total Nitrogen Determination of the Alkaline Potassium Persulfate Digestion of Ultraviolet Spectrophotometry; Ministry of Environmenta Protection of the People’s Republic of China: Beijing, China, 2012.
  25. Ministry of Land and Resources of the People’s Republic of China. The Determination of Water Quality of Ammonia Nitrogen Nessler’s Reagent Spectrophotometry; Ministry of Land and Resources of the People’s Republic of China: Beijing, China, 2009.
  26. Chen, J.; Lu, S.; Zhao, Y.; Wang, W.; Huang, M. Effects of overlying water aeration on phosphorus fractions and alkaline phosphatase activity in surface sediment. J. Environ. Sci. 2011, 21, 34–39. [Google Scholar] [CrossRef]
  27. Angassa, K.; Leta, S.; Mulat, W.; Kloos, H.; Meers, E. Organic Matter and Nutrient Removal Performance of Horizontal Subsurface Flow Constructed Wetlands Planted with Phragmite karka and Vetiveria zizanioide for Treating Municipal Wastewater. Environ. Process. 2018, 5, 115–130. [Google Scholar] [CrossRef]
  28. Xie, D.; Li, K.; Jiang, D. Study on effect of polluted sediments bioremediation on water body bioremediation of polluted urban rivers. Chin. J. Environ. Eng. 2009, 3, 1447–1453. [Google Scholar]
  29. Zhou, J.B.; Han-Ling, Y.E.; Zhang, H.L.; Zhang, Q.S. Study on technology for preparing biological bamboo charcoal and its application. Technol. Water Treat. 2008, 22, 4423–4441. [Google Scholar]
  30. Safwat, S.M. Performance of moving bed biofilm reactor using effective microorganisms. J. Clean. Prod. 2018, 185, 723–731. [Google Scholar] [CrossRef]
  31. Sun, H.; Yang, Z.; Wei, C.; Wu, W. Nitrogen removal performance and functional genes distribution patterns in solid-phase denitrification sub-surface constructed wetland with micro aeration. Bioresour. Technol. 2018, 263, 223–231. [Google Scholar] [CrossRef]
  32. Yu, H.; Li, M. Denitrifying and phosphorus accumulating mechanisms of denitrifying phosphorus accumulating organisms (DPAOs) for wastewater treatment-A review. Acta Microbiol. Sin. 2015, 55, 264–272. [Google Scholar]
  33. Jiang, C.; Jia, L.; Zhang, B.; He, Y.; Kirumba, G. Comparison of quartz sand, anthracite, shale and biological ceramsite for adsorptive removal of phosphorus from aqueous solution. J. Environ. Sci. 2014, 26, 466–477. [Google Scholar] [CrossRef]
  34. Yang, X.T.; Zhang, D.; Dai, L.L.; Dai, X.H. Research on Application of Microbial Carriers in an Anaerobic Digestion System. 2018, 11, 145–150. [Google Scholar]
  35. Yang, J.X.; Ma, F.; Zhao, Q.L.; Li, W.G.; Wang, Z.Y.; Jia, J. Removal of trace organic pollutants by immobilized microbe on biological activated carbon. J. Northeast. Norm. Univ. 2000, 32, 90–95. [Google Scholar]
  36. Wang, L.; Huang, L.-J.; Yun, L.-J.; Tang, F.; Zhao, J.-H.; Liu, Y.-Q.; Zeng, X.; Luo, Q.-F. Removal of Nitrogen, Phosphorus, and Organic Pollutants From Water Using Seeding Type Immobilized Microorganisms. Biomed. Environ. Sci. 2008, 21, 150–156. [Google Scholar] [CrossRef]
  37. Bao, T.; Chen, T.-H.; Qing, C.; Xie, J.J.; Frost, R.L. Development and application of Palygorskite porous ceramsite in a biological aerated filter (BAF). Desalin. Water Treat. 2016, 57, 1790–1803. [Google Scholar] [CrossRef] [Green Version]
  38. Wang, K.S.; Chiou, I.-J.; Chen, C.-H.; Wang, D. Lightweight properties and pore structure of foamed material made from sewage sludge ash. Constr. Build. Mater. 2015, 19, 627–633. [Google Scholar] [CrossRef]
  39. Yin, H.; Wang, J.; Zhang, R.; Tang, W. Performance of physical and chemical methods in the co-reduction of internal phosphorus and nitrogen loading from the sediment of a black odorous river. Sci. Total Environ. 2019, 663, 68–77. [Google Scholar] [CrossRef]
  40. Jiao, F.; Ren, L.; Wang, X.; Liu, W. Pollution characteristics and potential ecological risk assessment of metals in the sediments of Xiaoqing River, Jinan. Environ. Sci. Pollut. Res. 2017, 24, 15001–15011. [Google Scholar] [CrossRef]
  41. Wang, L.; Shao, X.; Xu, M.; Cheng, S. Bioremediation of nitrogen- and phosphorus-polluted aquaculture sediment by utilizing combined immobilized effective microorganisms and sediment aeration technology. Int. J. Agric. Biol. Eng. 2019, 12, 192–201. [Google Scholar] [CrossRef]
  42. Irankhah, S.; Ali, A.A.; Soudi, M.R.; Gharavi, S.; Ayati, B. Highly efficient phenol degradation in a batch moving bed biofilm reactor: Benefiting from biofilm-enhancing bacteria. World J. Microbiol. Biotechnol. 2018, 34, 164. [Google Scholar] [CrossRef]
  43. Chen, H.; Weng, Q.; Jindeng, L.U. Effects of intermittent aeration on pollutants removal in subsurface wastewater infiltration system. Bioresour. Technol. 2015, 191, 327–331. [Google Scholar]
  44. Ingerslev, F.; Halling-Sørensen, B. Biodegradability properties of sulfonamides in activated sludge. Environ. Toxicol. Chem. 2010, 19, 2467–2473. [Google Scholar] [CrossRef]
  45. Yu, G.; Lan, Q.; Lei, H.; Tao, B.; Qiang, Y.; Zhang, M. In situ biochemical technology to control black-odor of polluted sediments in tidal river. J. Biotechnol. 2008, 136, S665. [Google Scholar] [CrossRef]
  46. Fan, J.; Zhang, J.; Guo, W.; Liang, S.; Wu, H. Enhanced long-term organics and nitrogen removal and associated microbial community in intermittently aerated subsurface flow constructed wetlands. Bioresour. Technol. 2016, 214, 871–875. [Google Scholar] [CrossRef] [Green Version]
  47. Qualls, R.G.; Haines, B.L. Biodegradability of Dissolved Organic Matter in Forest Throughfall, Soil Solution, and Stream Water. Soil Sci. Soc. Am. J. 1992, 56, 578–586. [Google Scholar] [CrossRef] [Green Version]
  48. Sun, C.; Li, J.; Zhao, D.; Li, C.; Wu, J.; Wei, L. Regulating Effect of Multi-stage Biological Purification on Water Quality in a Closed Recirculating Aquaculture System. Fish. Sci. 2017, 66, 488–501. [Google Scholar]
  49. Labatut, R.A.; Angenent, L.T.; Scott, N.R. Biochemical methane potential and biodegradability of complex organic substrates. Bioresour. Technol. 2010, 102, 2255–2264. [Google Scholar] [CrossRef]
  50. Wu, H.; Fan, J.; Zhang, J.; Ngo, H.H.; Guo, W.; Liang, S.; Lv, J.; Lu, S.; Wu, W.; Wu, S. Intensified organics and nitrogen removal in the intermittent-aerated constructed wetland using a novel sludge-ceramsite as substrate. Bioresour. Technol. 2016, 210, 101–107. [Google Scholar] [CrossRef] [Green Version]
Figure 1. Changing curve of NH4+-N concentrations of different treatments along with response time.
Sustainability 12 01462 g001
Figure 2. Changing curve of TN concentrations of different treatments along with response time.
Sustainability 12 01462 g002
Figure 3. Changing curve of TP concentrations of different treatments along with response time.
Sustainability 12 01462 g003
Figure 4. N2 adsorption-desorption isotherm linear of T2 nanospheres.
Sustainability 12 01462 g004
Figure 5. Comparison of nanospheres before (a) and nanospheres after (b) in EM enrichment culture liquid under SEM 20,000-fold scan.
Sustainability 12 01462 g005
Figure 6. Changing curve of OM content in the sediment.
Sustainability 12 01462 g006
Figure 7. Changing curve of the biodegradability (G value) of the bottom sediment.
Sustainability 12 01462 g007
Table 1. Volume ratio of different materials in the configuration of EM active calcium solution.
2% Ca2+ Liquid
(mL)
EM Stock Solution (mL)Molasses
(mL)
Deionized Water (mL)
18.09.09.064
Table 2. Percentage of each material component in the carrier spheres.
TreatmentNBC Powder
(%)
Zeolite Powder
(%)
Pond Sediment (%)
T151580
T2101575
T3151570
Table 3. Physical properties of the carrier spheres.
PropertiesBET Surface Area
(m2·g−1)
Bulk Density
(g·cm−3)
Average Pore Diameter
(nm)
Average Pore Volume
(cm3·g−1)
T138.824.26.540.32
T245.014.07.320.41
T346.923.67.560.42
Note: BTE is the abbreviation of Brunauer–Emmett–Teller.
Table 4. The main chemical index in tested water sample.
Water Quality IndexpHNH4+-N
(mg/L)
TN
(mg/L)
TP
(mg/L)
Value8.050.255.820.3
Table 5. Sediment monitoring results in the field experiment.
Sampling PointTesting IndexTime (Days)
45678910
Pond I OM/g·kg−170.470.372.173.774.075.176.2
G/kg·(kg·h)−10.990.940.910.970.950.981.21
ST/cm20.320.620.520.821.121.521.4
Pond IIOM/g·kg−170.668.765.164.156.855.448.2
G/kg·(kg·h)−10.981.231.891.982.872.983.12
ST/cm20.120.019.719.217.917.016.8

