Article

A Multidimensional Evaluation of Renewable and Nuclear Energy among Higher Education Students

by
László Berényi
1,
Zoltán Birkner
2,* and
Nikolett Deutsch
3,*
1
Institute of Management Science, University of Miskolc, Miskolc 3515, Hungary
2
Institute of Applied Economics, University of Pannonia, Nagykanizsa 8800, Hungary
3
Department of Strategy and Project Management, Corvinus University of Budapest, Budapest 1093, Hungary
*
Authors to whom correspondence should be addressed.
Sustainability 2020, 12(4), 1449; https://doi.org/10.3390/su12041449
Submission received: 14 January 2020 / Revised: 7 February 2020 / Accepted: 10 February 2020 / Published: 15 February 2020

Abstract

:
Renewable and nuclear power technologies are considered alternatives to fossil-based power. However, which of the two is superior remains a matter of contention. Besides technological development, local access to resources, and energy policies, social acceptance is a key issue; informing future decisions on energy sources thus requires a complex approach. Personal attitudes to energy technologies may differ from professional opinions and national policies. The purpose of this study is to explore the attitudes and opinions regarding renewable and nuclear power generation technologies by pairwise comparison. This evaluation includes the return on the investment, the availability of said technologies, environmental impact, knowledge/need of use, and expectations for future of energy production. The research sample consists of 250 randomly selected Hungarian higher education students as representatives of future corporate decision-makers. The results show that the respondents demonstrate an appreciation of renewable energy technologies. Solar energy is appreciated, but confidence in nuclear power is low, except for its future role. These opinions are not consistent with the national energy policies or professional evaluations. These differences will allow us to refine communication and education in the field.

1. Introduction

A joint result of population growth and technical development is that the energy dependence of the economy and society is increasing [1]. Energy must be considered an essential ingredient of socio–economic development and economic growth [2]. However, it is fundamentally agreed that the depletion of fossil energy sources is inevitably approaching. Finding alternative energy sources is an essential but multifaceted challenge. Issues with energy generation are highly connected with climate change and environmental protection.
However, sustainable development could help solve these issues. The long-term strategy of the European Union regarding climate-neutrality [3,4] covers many issues that can be combatted using sustainable energy. According to Wolsink [5], policymakers and researchers present renewables as a solution to environmental problems, particularly global issues linked to fossil fuels and nuclear power. Both the European Union and the Hungarian government emphasize the importance of renewables [3,6]. These public efforts are encouraging, but statistics show that progress is slow.
Based on the EUROSTAT database [7], the share of energy produced by renewable sources increased from 11.3% to 17.5% in the European Union between 2008 and 2017; however, this remains below the target value of 20% for 2020 [8]. The share of renewables in Hungary is lower than the EU average, and the gap widened from 2013 to 2017 (Figure 1).
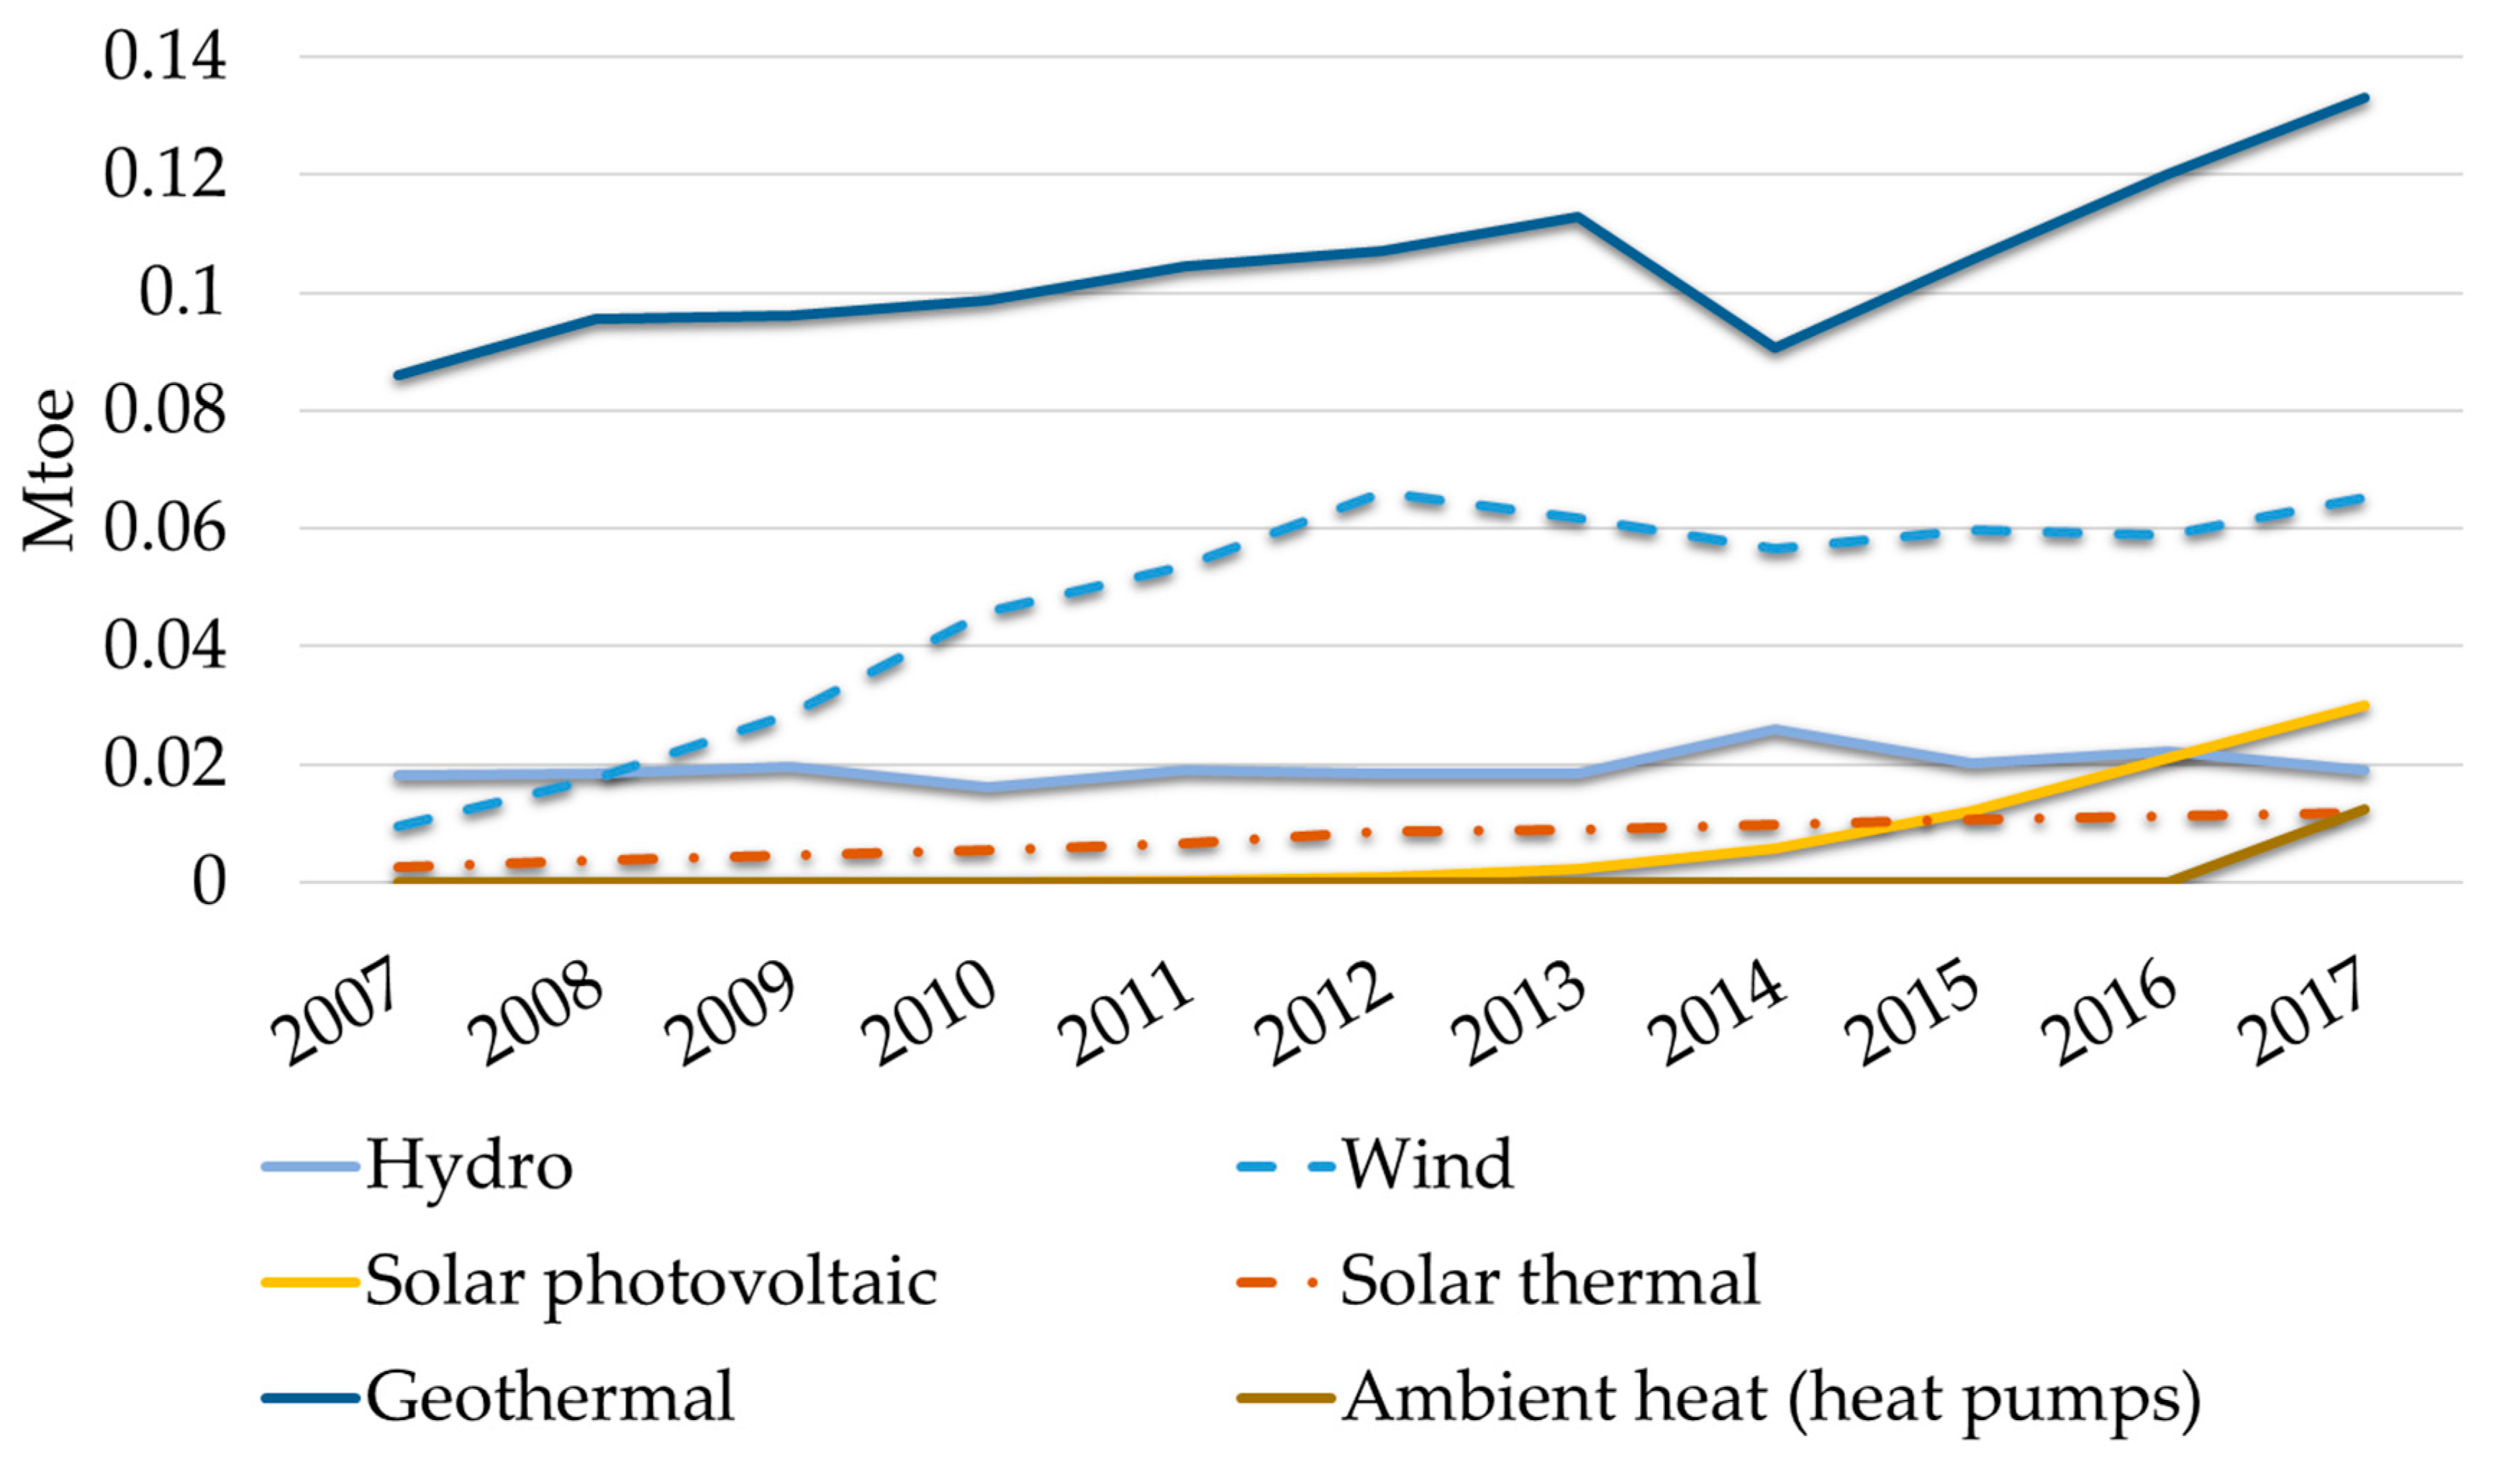
According to the energy statistics for the EU [9], the gross inland consumption of EU-28 countries was 674.92 Mtoe in 2017. The production was 45.37% of this (759.84 Mtoe), from which 29.82% was from renewables and biofuels and 27.73% was from nuclear sources. Hungarian energy consumption was 10.77 Mtoe (3.96% of the EU-28 consumption), and its production was 11.15 Mtoe (1.51% of the EU-28 production). Renewables and biofuels made up 28.63% of that production, and nuclear power comprised 36.64%. Of the renewables utilized for the gross inland consumption, biofuels and renewable waste were the most relevant sources, comprising 61.71%–68.75% of EU-28 consumption between 2007 and 2017, and were even more critical in Hungary (90.80%–94.12% during the same period). The pattern of the gross inland consumption of renewables (without biofuels and renewable waste) is presented in Figure 2 and Figure 3.
The National Energy Strategy 2030 of Hungary [6], published in 2012, offers a scenario entitled ‘Nuclear-Coal-Green’. This strategy aims at the long-term maintenance of nuclear energy in the energy mix, continuing to increase renewables depending on economic capacities and technological developments. The structure of energy production by sources shows that restructuring already began a few years earlier (Figure 4.).
However, the National Energy Strategy 2030 of Hungary includes maintaining coal-based energy production as a security reserve for economic or technical crises with a commitment to carbon dioxide capture and the full application of clean coal technologies. The wording reflects the complex socio–economical nature of the problem, including the need for education and professional training for the energy sector. Understanding these energy strategies and their technological background requires a broader approach.
Renewable and nuclear energy are two plausible alternatives to fossil fuel-based energy production [10]. Busu [11] formulated the idea to reduce CO2 emissions, and one of the solutions involves increasing the use of renewables. Both methods have several benefits and barriers, including the availability or social acceptance of the technology [12]. The effectiveness of nuclear energy production is undeniable, although its benefits are limited to the present phase. There are several risks to consider in a life-cycle approach, especially managing nuclear waste [13,14]. Not incidentally, the impacts of nuclear accidents [15] are horrifying. Understanding and appreciating nuclear power requires an awareness of risk and probability [16,17].
According to its ten-year network development plan, the Hungarian transmission system operator (MAVIR) elaborated five supply-side scenarios predicting the expected total installed electricity generation capacity in the short, medium, and long term [18]. The optimistic scenario assumes that large-scale power plant investments and decommissioning indicated by the owners will take place, meaning that the two new planned nuclear power plant units will be commissioned from 2028. Concerning CCGT (Combined-Cycle Gas Turbine) power plants, this scenario forecasts a slight increase. The installed capacity of renewable-based power generation plants is expected to increase in line with European trends. Thus, it is estimated that the capacity of weather-dependent small-scale renewable power plants will reach 3500 MW in the medium term and up to 4500 MW in the long-term. Scenarios A, B, C, and D, developed by MAVIR, differ in their realization of currently planned investments and decommissioning. Under ‘Scenario A’, the planned investments in CCGT power capacity will not be realized. Therefore, natural gas-based power plant capacity will be reduced. Similar to the optimistic forecasts, ‘Scenario A’ assumes that two new nuclear power plant units will be commissioned, but only around 2033.
Furthermore, it also presumes that power plant shutdowns are expected to increase in the medium term, leading to 1000 MW of reduction in large-scale power plant capacity by 2028. ‘Scenario B’ is the most pessimistic of the four scenarios. It assumes that none of the power plant investments will be realized, no nuclear power plant units will be commissioned, the number of shutdowns will increase, and the growth of small-scale renewable power plants will be very moderate. This is the riskiest scenario in terms of security of supply. ‘Scenario C’ presumes that only one nuclear power unit will be in operation by 2033, and the performance of CCGT power plants will only slightly decrease in the long run, similar to the optimistic scenario. In addition, more weather-dependent renewable power plant investment is projected. Finally, ‘Scenario D’ assumes that both of the new nuclear power units will be commissioned by 2033; this scenario predicts a higher rate of renewable power plant growth and assumes that the country’s CCGT power plant fleet will decline slightly. The short, medium, and long-term projections of the domestic energy mix are summarized in Table 1.
An important ingredient in the complexity of selecting the best alternative to fossil energy sources is the regional potential that also influences prices [19]. Since renewables are usually location-dependent, there is no ultimate answer for their use, even within a country [20]. Beyond technological and environmental issues, local policy intentions and social acceptance must be considered, but these tendencies have a prevailing direction. Wojuola and Alant [21] emphasized that the knowledge and beliefs of citizens regarding renewables will determine citizens’ attitudes toward renewables. Exploring personal opinions may contribute to changing attitudes in the desired direction defined by the policymakers in two ways:
  • Allowing refined communication about alternative energy sources to increase the acceptance of an energy policy;
  • Highlighting the necessary educational tasks, including technological knowledge.

2. Materials and Methods

2.1. Research Goal

The debate about the most appropriate energy sources has remained ongoing for a long time, since each option has remarkable limitations and risks. Professional evaluations of the various arguments are available in the recent literature considering technological, economic, ecological, or sustainability aspects. Moreover, the regional differences in the availability of renewable energy sources have been widely studied. Beyond these aspects, social acceptance is a relevant question. However, although most people cannot be considered experts in energy production, their non-professional opinions as users, corporate decision-makers, and voting citizens play an essential role in the spread of technologies. Assuming that the present students will become corporate and governmental decision-makers in the near future, focusing on their opinions offers several benefits in predicting behaviors and designating educational tasks.
This research aims to explore attitudes to renewable and nuclear energy using a multi-criteria evaluation with pairwise comparison. The goal of the research is to contribute to developing a knowledge base for supporting the development of energy policies, related communication, and education. Importantly, the authors do not intend to produce a rating of the energy sources from technological or economic perspectives.

2.2. Research Sample

The sample consists of the responses of students of various higher education institutions in Hungary in 2018 and 2019. Students in management courses were asked to fill out a voluntary survey in their field of study. Since data collection is not representative, a randomly selected sample of 250 students was selected for the analysis. The data collection is ongoing; the survey was not closed when preparing this study. The database for sample selection included 830 responses, but their distribution among the universities is not singular or proportional to the number of students. In order to reduce the dominance of some universities, a random selection was applied to the available data.
A total 58.8% of the respondents in the sample are females, and 41.2% are males. The representation of bachelor and master level students is 50%. 34% of them do not have any work experience. The average age is 24.4 years, and 88.8% of the respondents are younger than 30 years.

2.3. Survey Design

The survey was designed to explore the judgments of non-professionals about alternative energy sources. The data collection used an online self-administered questionnaire managed by the EvaSys Survey Automation Software. Data processing was performed via IBM SPSS 25 and Microsoft Excel.
The questionnaire provides four questions about attitudes to renewable energy sources (evaluated on a 5-point scale):
  • How do you think we currently use renewable energy sources compared to other European countries? (between ‘much less’ and ‘much more’)
  • Do you think people would pay more for energy if it were definitely from a ‘green’ source? (between ‘certainly not’ and ‘certainly yes’)
  • How much do you agree with the statement that people are increasingly striving to save energy in their everyday lives? (between ‘not at all’ and ‘totally agree’)
  • How do you think we will use renewable energy sources compared to other European countries in 10–15 years? (between ‘much less’ and ‘much more’)
The direct evaluation of energy generation technologies uses a pairwise comparison with five items (this means ten pairs of statements):
  • biomass energy;
  • nuclear energy;
  • solar energy;
  • hydropower;
  • wind power.
The respondents are asked to make a pairwise comparison of the items from 5 perspectives:
  • Return: In your opinion, which power generation technology has the highest financial return on investment?
  • Availability: In your opinion, which generation technology is the most accessible?
  • Environmentally friendly nature: In your opinion, which technology is environmentally friendly overall?
  • Knowledge: In your opinion, which energy generation technology can be utilized more simply, in general, i.e., with less specialized knowledge?
  • Future: In your opinion, which power generation technology will be the most decisive in the coming decades; which one will we use more?

2.4. Research and Analysis Methods

This research used a set of statistical methods for exploring attitudes, including descriptive statistics and cluster analysis. The ranking of renewable and nuclear energy technologies according to various aspects is performed by pairwise comparison.
Since all questions about attitudes fail the normality test (the 2-tailed significance level for the Kolmogorov–Smirnov test was 0.000 for each item, n = 250), the analysis of the relationship was conducted by a non-parametric Kruskal–Wallis test. A non-parametric correlation analysis was applied to test the possible interactions between the responses to the questions to prepare a cluster-analysis. This analysis found weak correlations. Therefore, all questions were included in the cluster-analysis without a dimensional reduction procedure. Ward’s method with squared Euclidean distance established 3 clusters that showed significant differences in attitudes. Other grouping factors (gender, age, and work experience) showed significant differences occasionally.
The direct evaluation of the power generation technologies uses pairwise comparison, with ten pairs for the five items ordered by the Ross-optimal solution [22]. The number of items is limited since more items would lead to a greater variety of statements (in the case of n items n*(n − 1)/2 statements) and may reduce the students’ willingness to participate in the evaluation.
The evaluation of the five perspectives repeated the list for each factor in a separate section of the questionnaire. Data processing included the measuring of the consistency of the responses according to the personal level of consistency (K) in the order of the factors (0 ≤ K ≤ 1, where 0 is the complete absence of consistency, and 1 indicates perfect consistency; the latter means that the respondent has a clear list of preferences) [23].
Sample and group-level preference orders are presented by rank values and orders, along with the weights calculated by the eigenvector method of Saaty [24]. These weights allow a comparison of the differences on a high measurement ratio scale.
Kendall’s coefficient of concordance is used for measuring the group level consensus for pairwise comparison (ν) [23] (the analysis is limited to cases where K = 1).

3. Results

3.1. Attitudes to Alternative Energy Technologies

The respondents felt that Hungary uses less renewable energy than other European countries. 79.2% ranked Hungary’s energy utilization as rather poor and only 2.4% noted that it is better than that in other European countries. The participants’ opinions about the future are more favorable than their thoughts on the present situation: 27.6% of participants believe that the utilization of renewables will be better than that in other countries, while 27.2% ranked it as lower level within 10–15 years. The respondents generally think that Hungarian citizens are striving to save energy (40% of them rated yes and 23.2% chose no), and only 24.4% of them assumed that people are willing to pay more for green energy (45.6% offered no opinion). The mean values measured on a 5-point scale are summarized in Figure 5. The differences according to various grouping factors were tested by a Kruskal–Wallis test that showed significant differences in one case. Students without work experience had a more positive opinion about the present utilization of renewable generation technologies in Hungary compared to other countries (xnowork = 2.08, xwork = 1.81, Kruskal–Wallis H = 5.454, df = 1, sig. = 0.020).
The non-parametric correlation analysis shows a weak but significant positive correlation between the questions for the present and future role of renewables compared to other European countries (Spearman’s rho = 0.335, n = 250, sig. = 0.000). Respondents who thought that we will use more renewable energy sources compared to other European countries in 10–15 years also believed that people would pay more for energy if it came definitively from a ‘green’ source (Spearman’s rho = 0.137, n = 250, sig. = 0.030) and stated that people are increasingly striving to save energy in their daily lives (Spearman’s rho = 0.185, n = 250, sig. = 0.003).
Three clusters were separated based on the answers (Figure 6, characteristics in Table 2):
  • A pessimistic approach (Cluster 1): The mean values are lower for each question than in other clusters. The members have less faith in the success and spread of renewable resources.
  • Optimistic approach (Cluster 2): The members have the best confidence in a greener future, including the utilization of renewable energy sources and people’s willingness to pay for greener energy sources.
  • Saving-oriented (Cluster 3): The members have only moderate faith in renewable energy technologies, but energy-saving is still considered an important and achievable solution.

3.2. Evaluation of Energy Technologies

Beyond preference orders, the questions prepared for the pairwise comparison of the power technologies allow calculation of the individual and group level consistency in shaping the orders.
The preference orders, according to all aspects of evaluation, are presented with the percentage of cases referring to other items. Results in the figure are limited to responses with a clear preference order. Figure 7 shows the results of the total sample, and Figure 8 summarizes the characteristics of the three clusters. Detailed tables of the results, including their weights, are outlined in Appendix A (Table A1, Table A2, Table A3, Table A4, Table A5 and Table A6) and Appendix B (Table A7, Table A8, Table A9, Table A10, Table A11 and Table A12).
Preference orders according to the total sample are shown in Table 3, which also presents the weights calculated by the eigenvector method of Saaty [24].
In all aspects investigated, solar energy is the most preferred solution by the respondents, followed by wind power. Nuclear energy received the lowest ratings, including its environmentally friendly nature and the required knowledge for its application. Nevertheless, the determining role of nuclear energy was rated as more important than the other roles by 37.9% of the respondents. The judgment by clusters was the most clear in the cases of nuclear energy and biomass. Respondents with an optimistic approach (Cluster 2) chose nuclear energy in 43.3% of the cases, while this ratio was 36.1% among pessimistic (Cluster 1) and 23.0% among saving-oriented (Cluster 3) respondents. Meanwhile, determining the future role has the highest ranking (42.2%) among pessimistic respondents. Biomass-based energy generation was considered more environmentally friendly (56.8% of the cases) by optimistic respondents. However, the return (42.5%) and future role (45.1%) showed the highest values among savings-oriented respondents.

3.3. Level of Consistency and Concordance of Opinions

A high level of consistency among the individual preference orders can be found in the sample. The averaged consistency level is between 0.922 (Future role) and 0.957 (Environmentally friendly nature). The proportion of students with a clear preference order (K = 1) is around 80% (Figure 9).
In addition to the preference orders and the consistency of the individual responses, the concordance of the responses carries valuable information. The group-level consensus is measured by Kendall’s coefficient of concordance for pairwise comparison [23]. Since the minimum value of the coefficient is not fixed, the comparative analysis uses a corrected indicator that presents the results as percentages. The indicator is calculated both for the total sample and the clusters (Figure 10). The greatest consensus pertains to the environmentally friendly nature of the energy technologies, and the most diffuse opinions concern the return of related investments. The savings-oriented respondents (Cluster 3) usually show a greater consensus than the others, except for the future role of energy sources.

4. Discussion

Regardless of the method and the aspects of the analysis, the present research clearly shows the preference order of the respondents. Solar energy is obviously highlighted as available, understandable, easy to utilize, and environmentally friendly. It is considered to be the most relevant future energy form. Although wind power and biomass potential are also remarkable in Hungary, these choices are less strongly preferred by the respondents. The perception of nuclear power is mixed; the respondents evaluated it as the least environmentally friendly and understood. However, its returns and future role are judged to be remarkable. Despite the high level of consistency and clear order of preferences, the results cannot be considered professional opinions, even when expanding the limitations of the selection of the research sample.
Nevertheless, an in-depth analysis of energy systems usually applies life cycle assessment (LCA), cost–benefit analysis (CBA), and/or multi-criteria decision aid (MCDA) with highly measurable performance indicators [25]; thus, personal opinions do not always reflect the outcomes or local policies of utilization. Developing new capacities requires a multi-criteria and multi-stakeholder evaluation procedure [26,27,28,29]. Due to the complexity of the potential environmental, social, and economic impacts of local specialties, the case studies on specific developments have an essential role in expanding the knowledge base in the field (e.g., [30,31,32,33]). Maghsoodi et al. [29] suggest using criteria relating to economic, technical, and social aspects for selecting renewable energy technology. This research indeed uses a detailed criteria system for the evaluation of environmental, social, economic, and time factors, as in-depth knowledge of these factors cannot be generally expected. More general and simultaneously more generous experience cannot be used in the decision preparation of investments. Instead, it should be used to support policymaking and communication. Understanding the patterns of thinking promotes this development [30].
Gallego-Carrera and Mack [34] presented a comprehensive evaluation of the social impacts of energy technologies. Table 4 highlights some results according to our research. The technologies are evaluated from different perspectives on a 5-point scale; the lower values in the table indicate better performance. Based on these results, coal power has the worst impact, and biomass offers the best solution. The social impact of nuclear energy is better compared to solar photovoltaic systems.
There are several indicators used for the evaluation of environmental impacts during the lifecycle. According to a recent analysis [35], biogas technology clearly has the lowest negative impact, and nuclear energy has the highest. Biomass or hydropower plants have a lower impact compared to photovoltaic technology (Table 5).
Economic evaluation and the forecast of energy technologies are available from the International Energy Agency (IEA) and the Nuclear Energy Agency (NEA) [36] based on 2015 data. Beyond capital and operating (O&M) costs, fuel, waste, and carbon costs are calculated by country. Table 6 highlight some Hungarian data. The projected cost per MWh shows that solar photovoltaic energy is the most expensive solution, while nuclear and wind power are remarkably cheaper. The change in interest rate has the greatest impact on solar technologies.
The results on the level of consensus (Figure 10) show that people have a much more united opinion about environmentally friendly nature than about economic components of return. Notably, from different perspectives, different solutions may seem to be more valid. Pidgeon et al. [37] found that nuclear plants are legitimized as offering a positive contribution to mitigating climate change. Acceptance of nuclear energy is the lowest in the sample; the positive evaluation of nuclear energy’s future opportunities may reflect a similar value.
Similarly, the return of solar power technologies is highly appreciated. Furthermore, the respondents find it simple to use and friendly to the environment. Europe represents 42.3% of the total installed photovoltaic capacity in 2015, with ongoing development [38], and household use is widely available. The literature agrees, however, that the return on photovoltaics used for electricity production, which most people think of as solar energy, is inadequate. Technological development, financial support system, and community solutions can improve this return on investment. In less mature renewable energy markets, innovation systems and the economy are notable delay factors [39]. Ntanos et al. [40] emphasized the impact of economic growth on the utilization of renewables.
The analysis of attitudes reveals a high level of trust in renewable energies in the future of Hungary (Figure 5). The weak positive correlations between the responses suggest that significant improvement is expected, even among the skeptical respondents. In parallel, better social acceptance is expected.
Social acceptance is a vital aspect of the evaluation of renewable energy technologies [30,41,42], as its absence can be a major barrier [12]. According to Wüstenhagen et al. [43], Wolsing [5] highlights that the socio-political acceptance of technologies, community acceptance of local facilities, and market acceptance by consumers and investors are different dimensions of acceptance.
Models for understanding the acceptance of a technology [44,45] emphasize cognitive responses to new technologies, including perceived usefulness and perceived ease of use that lead to affective responses (intention to use) and usage behavior. For renewable energy sources, these impacts are usually indirect, i.e., people do not need energy in its pure form; they use energy-based services through different tools and equipment. A consequence of this specialty is that investment in today’s education may return later; immediate changes in attitudes are not expected. The theory of reasoned actions [46] highlights the beliefs and evaluations that lead to attitudes toward behavior. Best practices and local examples promote progress. The UTAUT (Unified Theory of Acceptance and Use of Technology) model [47] combines critical factors including performance expectancy, effort expectancy, and social influence as influencing factors of behavioral intention.
Wilkins [12] distinguishes information exchange, education, and training barriers as the lack of access to information, the lack of skilled local labor and capabilities, and the lack of exchanging ideas and experience. This experience is in line with the conclusions of Liu et al. [31] that enhancing the knowledge and understanding of renewable energy would be conducive to winning public acceptance for its deployment. A relevant locus for changing people’s minds is school. Higher education institutions provide the last official chance to transfer basic knowledge in the field to students, including non-engineering students. Since renewable energy is instrumental to the success of Sustainable Development Goals [48], the comprehensive education of responsible management [49,50,51] must cover energy issues with dedicated programs [52] or hidden curricula [50].
According to Jabbour and Santos [53] and Jabbour et al. [54], Borges et al. [50] confirm the contribution of companies (and other organizations) to sustainable development through their product and production processes. The task of the education system is find and develop qualified and responsible managers to adopt appropriate forms. Work experience may have an important influence on thinking about sustainability, even during a person’s study period, but the analysis of variance in this research did not show significant differences in attitudes to the utilization of renewable energy among the respondents. The reason for this may be that the respondents do not have a say in, or any information about, the energy issues of the company; it could also be due to their level of knowledge. This suggests that the scope of energy issues must be explored to determine the appropriate methods and content of education. The low value of concordance in opinions indicates the need for financial education. A competency-based approach to developing academic programs [55] could be successful in shaping attitudes towards sustainability, but there is a need for a more complex approach in developing different levels of education [56]
The authors’ explicit purpose is to contribute the educational challenges. The relevant literature notes that local characteristics should be considered [57,58,59]. Certain studies [60,61] emphasize that the next generation’s attitudes are clearly very important because the next generation will be the beneficiaries of present decisions. For Hungary, Varga [62] found small but significant positive correlations between the knowledge and attitudes related to environmental issues. The educational challenges of energy consciousness are receiving increasing research interest in Hungary [63,64,65,66]. These results highlight the need to integrate the issues of energy consciousness into each level of education and to intensify the dissemination of such information to reduce the lack of knowledge in the field.
With a focus on higher education students, it is possible to draw up the typical patterns (clusters) of their attitudes. Next to the pessimistic and optimistic groups, a saving-oriented group can be defined. The saving-oriented group can be considered as economic or rational approach. While the composition of the clusters does not show differentiation by gender or work experience, the level of study show significant patterns. An optimistic attitude is more typical among bachelor students (63.7%), while masters students are overrepresented in the saving-oriented groups (59.7%).
This research includes an evaluation of nuclear powers. Based on the preference orders and the weights calculated, nuclear is rated in the last place, except for its future role (Table 3). Although nuclear offers economic benefits during the operating period [67,68], its accidents and catastrophes [15] have an impact on social acceptance of this technology. The acceptability of the risk of nuclear energy and the effectiveness of nuclear waste disposal have long been questionable (see [69]). Harris et al. [70] show that experts in nuclear power production have a better attitude toward nuclear power than most people. The responses reflect these risks. The environmentally friendly nature of solar-based power generation technologies was evaluated to be 63.17 times better than nuclear-based power production based on the weights calculated by the eigenvectors. This ratio is 38.33 for wind, 16.67 for biomass, and 13.50 for hydropower technologies. The return of solar technologies is found to be 3.79 times better than that of nuclear power. Furthermore, the future role of solar energy is rated as 8.02 times better in this relation. The cluster-related results (Appendix B) show that pessimistic respondents rated solar energy (74.14) as much more environmentally friendly than nuclear power compared to the optimistic respondents (53.60). For future role, the opposite is true, although the magnitude of difference is different (Figure 11).

5. Conclusions

The winner of the renewables versus nuclear energy debate is obviously renewables, based on the non-professional judgment of higher education students in Hungary. However, the outcome of this analysis does not have a direct impact on energy policy; these results are relevant in improving the social acceptance of present and future decisions. The remarkable differences in the weights calculated by the preference orders suggest a definite opinion. The preference orders confirm that solar energy is considered to be the most important element for every factor of the investigation, and nuclear energy is the least preferred in most aspects. The positive attitude toward the emerging role of renewables is encouraging (also stated by Domán et al. [60]), but these responses do not reflect the directions of the national energy strategy based on the professional opinions of policymakers. Personal views apparently do not reflect professional opinions about energy generation technologies. The prominent role of solar photovoltaic technology is not justified for any element of sustainability (Table 4, Table 5 and Table 6), and the marginalization of nuclear energy differs from professional opinions. Non-professional opinions are based on overemphasizing one or some aspects. The main implication of this research is that narrowing the gap between non-professional and professional opinions, as well as showing the importance of multidimensional evaluations, remain inevitable challenges.
As stated in the limitations of the research, the present responses are focused on higher education students. Considering that these students will be the corporate decision-makers in the near future, their opinions and attitudes are of particular importance. Assuming that corporations have a determinative role in the evolution of sustainability, management education must have a critical priority.
The relationship analysis found few significant differences by different grouping factors. Based on the represented attitudes, pessimistic, optimistic, and saving-oriented clusters were defined. This classification simplifies the preparation of both communication and learning materials.

6. Limitations

There are some limitations to consider when interpreting the present results. First, the investigations are limited to Hungary. Local access to renewable energy sources, as well as national energy policies, will undoubtedly lead to conflicting results from one country to another, so a direct comparison is not feasible. Another limitation arises from the data collection process; the analysis focused on higher education students. These respondents are not professionals in energy production and alternative energy sources and may not have their own households, but this is the intent of these investigations. Since we could not ensure that the distribution of the responses using any grouping factors would be representative, and because different universities provided a different number of students, a random selection of the respondents was applied. However, the authors did not find significant differences in the sample results and the database results, and this limitation may lead to information loss. Furthermore, due to the self-administered nature of the questionnaire, a bias of the responses may be presented, despite the careful planning of the survey, the large sample, and the random selection of the research sample.

Author Contributions

Conceptualization L.B. and N.D.; methodology L.B. and N.D.; data collection Z.B., L.B., and N.D.; formal analysis Z.B. and N.D.; writing, original draft preparation L.B. and N.D.; review and editing N.D. and Z.B.; visualization L.B.; funding acquisition Z.B. All authors have read and agreed to the published version of the manuscript.

Funding

This research was funded by the Széchenyi 2020 program under grant number EFOP-3.6.1-16-2016-00015. The APC was funded by the Széchenyi 2020 program under grant number EFOP-3.6.1-16-2016-00015.

Conflicts of Interest

The authors declare no conflict of interest.

Appendix A. Sample Characteristics and Results

Table A1. Explanation of symbols.
IndicatorContent of the Indicator
nsample size
n% (K = 1)the ratio of responses where K = 1
water, solar, nuclear, wind, biomassgroup-level rank sum of the items
νKendall’s coefficient of concordance
ν(min)the available minimum value of ν
ν(corr.) %Corrected value of Kendall’s coefficient of concordance (%)
dfdegrees of freedom for calculating ν
χ2value of χ2 for Kendall’s coefficient of concordance
usignificance test of Kendall’s coefficient of concordance
Table A2. Results on return.
ReturnTotal SampleCluster1Cluster2Cluster3
n2501038067
n% (K = 1)78.476.783.874.6
water34813611795
solar578244191143
nuclear27611411646
wind451175145131
biomass30712110185
ν0.13370.15600.08420.1832
ν(min)−0.0051−0.0127−0.0149−0.0204
ν(corr.) %13.813016.65389.768319.9520
df10.155210.393010.466310.6337
χ2273.5779135.224267.7586104.1337
u18.9970 *11.9972 *7.1766 *9.9295 *
* p < 0.05.
Table A3. Results on availability.
AvailabilityTotal SampleCluster1Cluster2Cluster3
n2501038067
n% (K = 1)80.080.683.874.6
water30712510280
solar684278234172
nuclear173765938
wind443180144119
biomass39317113191
ν0.30330.26690.31650.3304
ν(min)−0.0050−0.0120−0.0149−0.0204
ν(corr.) %30.675027.561032.656034.3840
df10.152010.373410.466310.6337
χ2619.7480234.6203225.7893179.3003
u30.8128 *17.2182 *16.7858 *14.4348 *
* p < 0.05.
Table A4. Results on environmentally friendly nature.
Environmentally FriendlyTotal SampleCluster1Cluster2Cluster3
n2501038067
n% (K = 1)85.283.587.585.1
water393158119116
solar687283218186
nuclear37141310
wind586238191157
biomass427167159101
ν0.45510.47590.42750.4629
ν(min)−0.0047−0.0118−0.0145−0.0175
ν(corr.) %45.762748.199043.567347.2167
df10.142610.360010.445510.5521
χ2984.0573424.5028314.0926279.2066
u39.9719 *24.6970 *20.6037 *19.1470 *
* p < 0.05.
Table A5. Results on knowledge need.
KnowledgeTotal SampleCluster1Cluster2Cluster3
n2501038067
n% (K = 1)88.893.283.888.1
water488218139131
solar607264187156
nuclear4417189
wind605258187160
biomass476203139134
ν0.35310.35540.34550.3485
ν(min)−0.0045−0.0105−0.0149−0.0169
ν(corr.) %35.599436.210935.508035.9310
df10.136810.321410.466310.5325
χ2797.5368355.1299245.4817219.7255
u35.5482 *22.2187 *17.6931 *16.4837*
* p < 0.05.
Table A6. Results on return future role.
FutureTotal SampleCluster1Cluster2Cluster3
n2501038067
n% (K = 1)82.080.682.583.6
water240888171
solar714289239186
nuclear3111409279
wind460193144123
biomass325120104101
ν0.28890.31390.30820.2283
ν(min)−0.0049−0.0120−0.0154−0.0182
ν(corr.) %29.232832.206731.864124.2092
df10.148310.373410.473610.5624
χ2605.2616274.1265217.0361140.7846
u30.3998 *18.9711 *16.3682 *12.2940 *
* p < 0.05.
The maximum level of Kendall’s coefficient of concordance is 1; on the other hand, the minimum is not fixed and depends on the number of cases (m): νeven = −1/(m − 1) and νodd = −1/m. In order to ensure the comparison, we calculated a corrected coefficient of consensus as follows [23]:
Ν c o r r .   i = 100   ν i   ν m i n 1   ν m i n .  
The significance test is as follows:
u =   2 χ 2 2 d f 1  
where γ shows the sum of the values below the main diagonal in the aggregated preference matrix, i.e., the number of non-preferred incidences; n is the number of factors, and χ2, df are as follows [23]:
χ 2 =   4 m 2 { γ 2 m γ +   ( m 2 ) ( n 2 ) 1 2 ( n 2 ) ( m 2 ) m 3 m 2 }  
d f =   ( n 2 ) m ( m 1 ) ( m 2 ) 2   .

Appendix B. Ranking and Preference Orders

Table A7. Explanation of symbols.
IndicatorContent
nsample size (cases where K = 1)
a% (rank)% of available cases in the item is preferred to other items (order in brackets)
Pweights by preference rate, P = (a + 0.5)/n
Sweights calculated by the eigenvector method, normalized to 1 (biomass)
Table A8. Results on return.
Total Sample Cluster1 Cluster2Cluster3
a%PSa%PSa%PSa%PS
n (K = 1)196 79 67 50
water44.4 (3)0.45511.1943.0 (3)0.44431.1643.7 (3)0.44930.6247.5 (3)0.48001.19
solar73.7 (1)0.68983.3777.2 (1)0.71774.1471.3 (1)0.670110.6171.5 (1)0.67202.79
nuclear35.2 (5)0.38160.9036.1 (5)0.38860.9843.3 (4)0.44631.4723.0 (5)0.28400.48
wind57.5 (2)0.56021.8755.4 (2)0.54301.8054.1 (2)0.53282.4965.5 (2)0.62402.29
biomass39.2 (4)0.41331.0038.3 (4)0.40631.0037.7 (5)0.40151.0042.5 (4)0.44001.00
Table A9. Results on availability.
Total Sample Cluster1Cluster2Cluster3
a%PSa%PSa%PSa%PS
n (K=1)200 83 67 50
water38.4 (4)0.40700.5637.7 (4)0.40120.5938.1 (4)0.40450.6440.0 (4)0.42000.79
solar85.5 (1)0.78404.2883.7 (1)0.76993.7487.3 (1)0.79855.6386.0 (1)0.78805.49
nuclear21.6 (5)0.27300.3422.9 (5)0.28310.3522.0 (5)0.27610.3719.0 (5)0.25200.36
wind55.4 (2)0.54301.1354.2 (2)0.53371.0853.7 (2)0.52991.1259.5 (2)0.57601.68
biomass49.1 (3)0.49301.0051.5 (3)0.51201.0048.9 (3)0.49101.0045.5 (3)0.46401.00
Table A10. Results on environmentally friendly nature..
Total SampleCluster1Cluster2 Cluster3
a%PSa%PSa%PSa%PS
n (K = 1)213 86 70 57
water46.1 (4)0.46900.8245.9 (4)0.46740.8542.5 (4)0.44000.5450.9 (4)0.50701.3
solar80.6 (1)0.74513.8082.3 (1)0.75814.4577.9 (1)0.72292.6881.6 (1)0.75264.77
nuclear4.3 (5)0.13470.064.1 (5)0.13260.064.6 (5)0.13710.054.4 (5)0.13510.08
wind68.8 (2)0.65022.3069.2 (2)0.65352.5268.2 (2)0.64571.9968.9 (2)0.65092.68
biomass50.1 (3)0.50091.0048.5 (3)0.48841.0056.8 (3)0.55431.0044.3 (3)0.45441.00
Table A11. Results on knowledge need.
Total SampleCluster1Cluster2Cluster3
a%PSa%PSa%PSa%PS
n (K = 1)222 96 67 59
water55.0 (3)0.53961.0756.8 (3)0.55421.1951.9 (3)0.51490.9755.5 (4)0.5441n.a.
solar68.4 (1)0.64681.8068.8 (1)0.65001.7169.8 (1)0.65821.9666.1 (2)0.6288n.a.
nuclear5.0 (5)0.13960.074.4 (5)0.13540.066.7 (5)0.15370.103.8 (5)0.1305n.a.
wind68.1 (2)0.64501.8167.2 (2)0.63751.7669.8 (1)0.65821.9467.8 (1)0.6424n.a.
biomass53.6 (4)0.52881.0052.9 (4)0.52291.0051.9 (3)0.51491.0056.8 (3)0.5542n.a.
Table A12. Results on return future role.
Total SampleCluster1Cluster2Cluster3
a%PSa%PSaPSaPS
n (K = 1)205 83 66 56
water29.3 (5)0.33410.6326.5 (5)0.31200.6230.7 (5)0.34550.6731.7 (5)0.35360.58
solar87.1 (1)0.79668.1087.0 (1)0.796410.6190.5 (1)0.824210.0083.0 (1)0.76435.02
nuclear37.9 (4)0.40341.0242.2 (3)0.43731.4734.8 (4)0.37880.8535.3 (4)0.38210.74
wind56.1 (2)0.54881.8258.1 (2)0.56512.4954.5 (2)0.53641.6954.9 (2)0.53931.38
biomass39.6 (3)0.41711.0036.1 (4)0.38921.0039.4 (3)0.41521.0045.1 (3)0.46071.00

References

  1. Högselius, P.; Kaijser, A. Energy dependence in historical perspective: The geopolitics of smaller nations. Energy Policy 2019, 127, 438–444. [Google Scholar] [CrossRef]
  2. Eltawil, M.A.; Zhao, Z.; Yuan, L. A review of renewable energy technologies integrated with desalination systems. Renew. Sustain. Energy Rev. 2009, 13, 2245–2262. [Google Scholar] [CrossRef]
  3. 28/11/2018—COM (2018) 773—A Clean Planet for All—A European Strategic Long-Term Vision for a Prosperous, Modern, Competitive and Climate Neutral Economy. Available online: https://eur-lex.europa.eu/legal-content/EN/TXT/?uri=CELEX:52018DC0773 (accessed on 12 November 2019).
  4. Gaduš, J.; Palková, Z. Analysis of existing and planned energy policies strategies. In Renewable Energy in Europe: Through the Policy, Education and People; Palková, Z., Horská, E., Eds.; Szent István University Nonprofit Publishing: Gödöllő, Hungary, 2015; pp. 8–41. [Google Scholar]
  5. Wolsink, M. Contested environmental policy infrastructure: Socio-political acceptance of renewable energy, water, and waste facilities. Environ. Impact Assess. Rev. 2010, 30, 302–311. [Google Scholar] [CrossRef] [Green Version]
  6. Nemzeti Energiastratégia 2030. Available online: https://2010-2014.kormany.hu/download/4/f8/70000/Nemzeti%20Energiastratégia%202030%20teljes%20változat.pdf (accessed on 11 November 2019).
  7. Share of Renewable Energy in Gross Final Energy Consumption (T2020_31). Available online: https://ec.europa.eu/eurostat/databrowser/view/t2020_31/default/table?lang=en (accessed on 12 November 2019).
  8. da Graça Carvalho, M. EU energy and climate change strategy. Energy 2012, 40, 19–22. [Google Scholar] [CrossRef]
  9. Energy Statistical Datasheets for the EU Countries. Available online: https://data.europa.eu/euodp/en/data/dataset/information-on-energy-markets-in-eu-countries-with-national-energy-profiles (accessed on 11 November 2019).
  10. Skamp, K.; Boyes, E.; Stanisstreet, M.; Rodriguez, M.; Malandrakis, G.; Fortner, R.; Kilinc, A.; Taylor, N.; Chhokar, K.; Dua, S.; et al. Renewable and Nuclear Energy: An International Study of Students’ Beliefs about, and willingness to act, in relation to two energy production Scenarios. Res. Sci. 2019, 49, 295–329. [Google Scholar] [CrossRef]
  11. Busu, M. The Role of Renewables in a Low-Carbon Society: Evidence from a Multivariate Panel Data Analysis at the EU Level. Sustainability 2019, 11, 5260. [Google Scholar] [CrossRef] [Green Version]
  12. Wilkins, G. Technology Transfer for Renewable Energy: Overcoming Barriers in Developing Countries; Earthscan Publication: London, UK, 2002. [Google Scholar]
  13. Dawson, J.I.; Darst, R.G. Meeting the challenge of permanent nuclear waste disposal in an expanding Europe: Transparency, trust and democracy. Environ. Politics 2006, 15, 610–627. [Google Scholar] [CrossRef]
  14. Hocke, P.; Renn, O. Concerned public and the paralysis of decision-making: Nuclear waste management policy in Germany. J. Risk Res. 2009, 12, 921–940. [Google Scholar] [CrossRef]
  15. Deutsch, N. The changing role of nuclear power in the European Union: Reflections from official scenarios released before and after the Fukushima Daiichi accident. Theory Methodol. Pract. Club Econ. Miskolc 2017, 13, 17–36. [Google Scholar] [CrossRef]
  16. Ratcliffe, M.; Grace, M. Science Education for Citizenship; Open University Press: Maidenhead, UK, 2003. [Google Scholar]
  17. Maslin, M. Climate Change: A Very Short Introduction; Oxford University Press: Oxford. UK, 2014. [Google Scholar]
  18. A Magyar Villamosenergia-Rendszer Közép-És Hosszú Távú Forrásoldali Kapacitásfejlesztése. Available online: https://www.mavir.hu/documents/10258/15461/Forr%C3%A1selemz%C3%A9s_2018_IG.pdf/fc043982-a8ea-e49f-6061-418b254a6391 (accessed on 9 January 2020).
  19. Wang, H.; Di Pietro, G.; Wu, X.; Lahdelma, R.; Verda, V.; Haasvisto, I. Renewable and Sustainable Energy Transitions for Countries with Different Climates and Renewable Energy Sources Potentials. Energies 2018, 11, 3523. [Google Scholar] [CrossRef] [Green Version]
  20. Cîrstea, S.D.; Martis, C.S.; Cîrstea, A.; Constantinescu-Dobra, A.; Fülöp, M.T. Current Situation and Future Perspectives of the Romanian Renewable Energy. Energies 2018, 11, 3289. [Google Scholar] [CrossRef] [Green Version]
  21. Wojuola, R.N.; Alant, B.P. Sustainable development and energy education in Nigeria. Renew. Energy 2019, 139, 1366–1374. [Google Scholar] [CrossRef]
  22. Ross, R.T. Optimum orders for the presentation pairs in the method of paired comparisons. J. Educ. Psychol. 1934, 25, 375–382. [Google Scholar] [CrossRef]
  23. Kendall, M.G. Rank Correlation Methods; Griffin: London, UK, 1970. [Google Scholar]
  24. Saaty, T.L. The Analytic Hierarchy Process; McGraw Hill: New York, NY, USA, 1980. [Google Scholar]
  25. Strantzali, E.; Aravossis, K. Decision making in renewable energy investments: A review. Renew. Sustain. Energy Rev. 2016, 55, 885–898. [Google Scholar] [CrossRef]
  26. Raven, R.P.; Joliver, E.; Mourik, R.M.; Feenstra, Y.C. ESTEEM: Managing societal acceptance in new energy projects A toolbox method for project managers. Technol. Forecast. Soc. Chang. 2009, 76, 963–977. [Google Scholar] [CrossRef]
  27. Zaunbrecher, B.S.; Ziefle, M. Integrating acceptance-relevant factors into wind power planning: A discussion. Sustain. Cities Soc. 2016, 27, 307–314. [Google Scholar] [CrossRef]
  28. Schirone, L.; Pellitteri, F. Energy Policies and Sustainable Management of Energy Sources. Sustainability 2017, 9, 2321. [Google Scholar] [CrossRef] [Green Version]
  29. Maghsoodi, A.I.; Maghsoodi, A.I.; Mosavi, A.; Rabczuk, T. Renewable Energy Technology Selection Problem Using Integrated H-SWARA-MULTIMOORA Approach. Sustainability 2018, 10, 4481. [Google Scholar] [CrossRef] [Green Version]
  30. Bronfman, N.C.; Jiménez, R.B.; Arévalo, P.C.; Cifuentes, L.A. Understanding social acceptance of electricity generation sources. Energy Policy 2012, 46, 246–252. [Google Scholar] [CrossRef]
  31. Liu, W.; Wang, C.; Mol, A.P. Rural public acceptance of renewable energy deployment: The case of Shandong in China. Appl. Energy 2013, 102, 1187–1196. [Google Scholar] [CrossRef]
  32. Batel, S.; Devine-Wright, P.; Tangeland, T. Social acceptance of low carbon energy and associated infrastructures: A critical discussion. Energy Policy 2013, 58, 1–5. [Google Scholar] [CrossRef]
  33. Zoellner, J.; Schweizer-Ries, P.; Wemheuer, C. Public acceptance of renewable energies: Results from case studies in Germany. Energy Policy 2008, 36, 4136–4141. [Google Scholar] [CrossRef]
  34. Gallego Carrera, D.; Mack, A. Energy Technology Roadmap and Stakeholders Perspective. Deliverable n 8.1.—RS 2b Quantification of Social Indicators for the Assessment of Energy System Related Effects. Available online: http://www.needs-project.org/2009/ (accessed on 17 November 2019).
  35. Bauer, C.; Cox, B.; Heck, T.; Zhang, X. Potentials, Costs and Environmental Assessment of Electricity Generation Technologies. An Update of Electricity Generation Costs and Potentials. Available online: https://www.psi.ch/sites/default/files/2019-10/CH%202050%20Update.pdf (accessed on 11 November 2019).
  36. Projected Costs of Generating Electricity. 2015 Edition. Available online: https://www.oecd-nea.org/ndd/pubs/2015/7057-proj-costs-electricity-2015.pdf (accessed on 17 November 2019).
  37. Pidgeon, N.F.; Lorenzoni, I.; Poortinga, W. Climate change or nuclear power—No thanks! A quantitative study of public perceptions and risk framing in Britain. Glob. Environ. Chang. 2008, 18, 69–85. [Google Scholar] [CrossRef]
  38. Honrubia-Escribano, A.; Ramirez, F.J.; Gómez-Lázaro, E.; Garcia-Villaverde, P.M.; Ruiz-Ortega, M.J.; Parra-Requena, G. Influence of solar technology in the economic performance of PV power plants in Europe. A comprehensive analysis. Renew. Sustain. Energy Rev. 2018, 82, 488–501. [Google Scholar] [CrossRef]
  39. Pegels, A. Renewable energy in South Africa: Potentials, barriers and options for support. Energy Policy 2010, 38, 4945–4954. [Google Scholar] [CrossRef]
  40. Ntanos, S.; Skordoulis, M.; Kyriakopoulos, G.; Arabatzis, G.; Chalikias, M.; Galatsidas, S.; Batzios, A.; Katsarou, A. Renewable Energy and Economic Growth: Evidence from European Countries. Sustainability 2018, 10, 2626. [Google Scholar] [CrossRef] [Green Version]
  41. Ruggerio, S.; Onkila, T.; Kuittien, V. Realizing the social acceptance of community renewable energy: A process-outcome analysis of stakeholder influence. Energy Res. Soc. Sci. 2014, 4, 53–63. [Google Scholar] [CrossRef]
  42. Kowalska-Pyzalska, A. An Empirical Analysis of Green Electricity Adoption Among Residential Consumers in Poland. Sustainability 2018, 10, 2281. [Google Scholar] [CrossRef] [Green Version]
  43. Wüstenhangen, R.; Wolsnik, M.; Bürer, M.J. Social acceptance of renewable energy innovation: An introduction to the concept. Energy Policy 2007, 35, 2683–2691. [Google Scholar] [CrossRef] [Green Version]
  44. Davis, F.D. A Technology Acceptance Model for Empirically Testing New End-User Information Systems: Theory and Results; Massachusetts Institute of Technology: Cambridge, UK, 1986. [Google Scholar]
  45. Venkatesh, V.; Davis, F.D. A theoretical extension of the technology acceptance model: Four longitudinal field studies. Manag. Sci. 2000, 46, 186–204. [Google Scholar] [CrossRef] [Green Version]
  46. Ajzen, I.; Fishbein, M. Understanding Attitudes and Predicting Social Behavior; Prentice-Hall: Englewood Cliffs, NJ, USA, 1980. [Google Scholar]
  47. Venkatesh, V.; Morris, M.; Davis, G.; Davis, F. User acceptance of information technology: Toward a unified view. MIS Q. 2003, 27, 425–478. [Google Scholar] [CrossRef] [Green Version]
  48. Barredo, L. Mapping Renewables to the Sustainable Development Goals. Available online: https://www.unsdsn.org/news/2018/02/27/mapping-renewables-to-the-sustainable-development-goals (accessed on 18 December 2019).
  49. Annan-Diab, F.; Molinari, C. Interdisciplinarity: Practical approach to advancing education for sustainability and for the Sustainable Development Goals. Int. J. Manag. Educ. 2017, 15, 73–83. [Google Scholar] [CrossRef]
  50. Borges, J.; Ferreira, T.C.; de Oliveira, M.S.B.; Macini, N.; Ferreira Caldana, A.C. Hidden curriculum in student organizations: Learning, practice, socialization and responsible management in a business school. Int. J. Manag. Educ. 2017, 15, 153–161. [Google Scholar] [CrossRef]
  51. Weybrecht, G. From challenge to opportunity e Management education’s crucial role in sustainability and the Sustainable Development Goals—An overview and framework. Int. J. Manag. Educ. 2017, 15, 84–92. [Google Scholar] [CrossRef]
  52. Schweizer, C.R.; Di Giulio, A.; Burkhardt-Holm, P. Scientific Support for Redesigning a Higher Education Curriculum on Sustainability. Sustainability 2019, 11, 6035. [Google Scholar] [CrossRef] [Green Version]
  53. Jabbour, C.J.C.; Santos, F.C.A. The central role of human resource management in the search for sustainable organizations. Int. J. Hum. Resour. Manag. 2008, 19, 2133–2154. [Google Scholar] [CrossRef]
  54. Jabbour, C.J.C.; Santos, F.C.A.; Fonseca, S.A.; Nagano, M.S. Green teams: Understanding their roles in the environmental management of companies located in Brazil. J. Clean. Prod. 2013, 46, 58–66. [Google Scholar] [CrossRef]
  55. Wiek, A.; Withycombe, L.; Redman, C.L. Key competencies in sustainability: A reference framework for academic program development. Sustain. Sci. 2011, 6, 203–218. [Google Scholar] [CrossRef] [Green Version]
  56. Palková, Z. Verification of demand on education in the field of renewable energy sources. In Renewable Energy in Europe: Through the Policy, Education and People; Palková, Z., Horská, E., Eds.; Szent István University Nonprofit Publishing: Gödöllő, Hungary, 2015; pp. 60–115. [Google Scholar]
  57. Bojic, M. Education and training in renewable energy sources in Serbia and Montenegro. Renew. Energy 2004, 29, 1631–1642. [Google Scholar] [CrossRef]
  58. Király, G.; Géring, Z. Introduction to ‘Futures of Higher Education’ special issue. Futures 2019, 111, 123–129. [Google Scholar] [CrossRef]
  59. Rahmawati, Y.; Sonhadji, A.; Sugandi, R.M.; Afandi, A.N. The necessity of teaching renewable energy (RE) at engineering schools. World Trans. Eng. Technol. Educ. 2018, 16, 410–414. [Google Scholar]
  60. Domán, S.; Palková, Z.; Horská, E.; Takács-György, K. Knowledge and attitudes of young age group connected with the sustainable development and renewable energy sources. In Renewable Energy in Europe: Through the Policy, Education and People; Palková, Z., Horská, E., Eds.; Szent István University Nonprofit Publishing: Gödöllő, Hungary, 2015; pp. 148–165. [Google Scholar]
  61. Takács-György, K.; Domán, S.; Tamus, A.; Horská, E.; Palková, Z. What do the youth know about alternative energy sources—Case study from Hungary and Slovakia. Visegr. J. Bioecon. Sustain. Dev. 2015, 4, 36–41. [Google Scholar] [CrossRef] [Green Version]
  62. Varga, A. Diákok környezeti attitűdjei. Iskolakultúra: Pedagógusok Szakmai-Tudományos Folyóirata 2006, 16, 58–64. [Google Scholar]
  63. Horváth-Baráti, I. Energiatudatosság a nevelésben és oktatásban. In Fenntartható Energetika az Épületszerkezetek Tervezésében és Oktatásában; Széll, M., Ed.; TERC: Budapest, Hungary, 2012; pp. 205–226. [Google Scholar]
  64. Barabás, J. A megújuló energiáról szóló ismeretterjesztés kezdetei és lehetőségei. In Fiatalok Megújuló Energiákkal 2012-13; Pajtók-Tari, I., Ed.; Agria Geográfia a Földrajz Oktatásáért, Kutatásáért és Alkalmazásáért Közhasznú Alapítvány: Eger, Hungary, 2013; pp. 15–22. [Google Scholar]
  65. Kovács, E. Energia-tudat az oktatásban. In Fiatalok Megújuló Energiákkal 2012-13; Pajtók-Tari, I., Ed.; Agria Geográfia a Földrajz Oktatásáért, Kutatásáért és Alkalmazásáért Közhasznú Alapítvány: Eger, Hungary, 2013; pp. 23–32. [Google Scholar]
  66. Revák-Markóczi, I.; Ütő-Visi, J.; Gartha, I.; Kovács, E.; Teperics, K. Role of Hungarian science and geography text books in education regarding energy awareness. J. Appl. Tech. Educ. Sci. 2018, 8, 7–28. [Google Scholar] [CrossRef]
  67. Deutsch, N.; Fiáth, A.; Virág, M.; Berényi, L. Nuclear power—Additions to wholesale electricity prices and margin of safety. WSEAS Trans. Bus. Econ. 2018, 15, 197–212. [Google Scholar]
  68. Suman, S. Hybrid nuclear-renewable energy systems: A review. J. Clean. Prod. 2018, 181, 166–177. [Google Scholar] [CrossRef]
  69. Pasqualetti, M.J.; Pijawka, K.D. (Eds.) Nuclear Power: Assessing and Managing a Hazardous Technology; Westview Press: Boulder, CO, USA, 1984. [Google Scholar]
  70. Harris, J.; Hassall, M.; Muriuki, G.; Warnaar-Notschaele, C.; McFarland, E.; Ashworth, P. The demographics of nuclear power: Comparing nuclear experts’, scientists’ and non-science professionals’ views of risks, benefits and values. Energy Res. Soc. Sci. 2018, 46, 29–39. [Google Scholar] [CrossRef]
Figure 1. Share of energy from renewable sources (%) [7].
Sustainability 12 01449 g001
Figure 2. Gross inland consumption of renewables without biofuels and renewable waste between 2007 and 2017 (EU-28 countries, Mtoe) [9].
Sustainability 12 01449 g002
Figure 3. Gross inland consumption of renewables without biofuels and renewable waste between 2007 and 2017 (Hungary, Mtoe) [9].
Sustainability 12 01449 g003
Figure 4. Composition of energy production by sources in Hungary (2007–2017) [9].
Sustainability 12 01449 g004
Figure 5. Attitudes to alternative energy sources (mean values measured on a 5-point scale).
Sustainability 12 01449 g005
Figure 6. Cluster characteristics (mean values measured on a 5-point scale).
Sustainability 12 01449 g006
Figure 7. Group level evaluation of the items by preferences in the total sample.
Sustainability 12 01449 g007
Figure 8. Group level evaluation of the items by preferences and clusters.
Sustainability 12 01449 g008
Figure 9. Consistency levels of the responses by evaluation aspects (%).
Sustainability 12 01449 g009
Figure 10. Corrected level of concordance by evaluation aspects (%).
Sustainability 12 01449 g010
Figure 11. The weight of solar energy compared to nuclear energy (solar weight/nuclear weight).
Sustainability 12 01449 g011
Table 1. Forecasts on the energy mix in Hungary [18].
2023OptimisticScenario AScenario BScenario CScenario D
Import10,36113,34013,34012,56212,562
Renewable60445612561260446044
Natural gas68644447444744474447
Oil43130130173173
Coal55265871587158285828
Nuclear14,33213,77113,77114,11714,117
Sum (GWh)43,17043,17043,17043,17043,170
2028OptimisticScenario AScenario BScenario CScenario D
Import85420,43520,43517,6772261
Renewable67366149614979128093
Natural gas50645199519950183572
Oil136271271226
Coal00000
Nuclear31,42113,15613,15614,37731,466
Sum (GWh)45,07444,93944,93944,98445,391
2033OptimisticScenario AScenario BScenario CScenario D
Import5061951325,30413,4023608
Renewable777967956888918511,106
Natural gas62324124435846863515
Oil94187328234187
Coal
Nuclear27,69426,242998119,35328,444
Sum (GWh)46,86046,86046,86046,86046,860
Table 2. Characteristics of clusters (sample size and distribution).
Clusters
Cluster 1
Pessimistic
Cluster 2
Optimistic
Cluster 3
Saving-Oriented
n1038067
Genderfemale66 (64.1%)44 (55%)37 (55.2%)
male37 (35.9%)36 (45%)30 (44.8%)
Level of studiesbachelor47 (45.6%)51 (63.7%)27 (40.3%)
master56 (54.4%)29 (36.3%)40 (59.7%)
Work experienceno34 (33.0%)29 (36.3%)22 (32.8%)
yes69 (67.0%)51 (63.7%)45 (67.2%)
Table 3. Preference orders by aspects for the total sample.
OrderReturnAvailabilityEnvironmentally FriendlyKnowledgeFuture
1solar3.37solar4.28solar3.79solar1.80solar8.10
2wind1.87wind1.12wind2.30wind1.81wind1.81
3hydro1.18biomass1.00biomass1.00hydro1.07biomass1.00
4biomass1.00hydro0.56hydro0.81biomass1.00nuclear1.01
5nuclear0.89nuclear0.34nuclear0.06nuclear0.07hydro0.63
Table 4. Social evaluation of energy technologies [34].
TechnologyWaste DisposalHealth ConcernsCatastro-phic OotentialFunctional DamageAesthetic ImpactNoiseEdu-cation
Coal power steam2.483.352.453.413.73.243.16
Nuclear power (European Pressurized Reactor)3.654.174.743.173.561.874.69
Nuclear power (Liquid Metal Fast-Breeder Reactor)3.714.154.793.123.531.874.71
Hydro power (Run-of-River)1.931.281.822.972.851.523.06
Solar power photovoltaics2.141.241.322.062.531.163.25
Wind power onshore1.711.661.913.143.852.663.44
geothermal1.91.92.5321.971.593.77
Table 5. Environmental impact of energy technologies [35].
Impact CategoryUnitWood CHPLHP: Run-of-RiverPV, Roof-Top, Multi-c SiWind OnshoreNuclear, BWRNuclear: PWR
Climate changekg CO2 eq2.31E−014.24E−037.46E−021.70E−021.27E−021.20E−02
Particulate matterkg PM2.5 eq3.13E−045.03E−068.31E−051.96E−052.22E−052.10E−05
Acidificationmolc H+ eq1.99E−032.27E−056.26E−041.21E−048.28E−057.87E−05
Terrestrial eutrophicationmolc N eq9.63E−036.55E−058.26E−042.19E−041.81E−041.71E−04
Land usekg C deficit3.87E+009.17E−039.56E−021.85E−011.90E−021.80E−02
Table 6. An economic evaluation of energy technologies, levelized costs (USD/MWh) [36].
Type of TechnologyCapital CostsO&M CostsFuel, Waste and Carbon CostsLCOE
7%3%7%10%
CCGT (dual fuel)11.797.6481.7796.94101.2105.08
Nuclear—Advanced Light-Water Reactor69.9510.49.653.989.94124.95
Solar PV—residential rooftop 209.7800164.13209.78250.35
Solar PV—commercial rooftop179.0400134.76179.04217.31
Solar PV—large, ground-mounted179.7630.30165.43210.07248.57
Onshore wind84.3432.31093.77116.65136.54

