1. Introduction
Free-floating bike sharing (FFBS) is an innovative approach to a public bike system that is station-free and incorporates Internet Plus. It has recently received increasing attention due to its flexible mobility services [
1,
2,
3,
4]. As a low-carbon, environmentally friendly, flexible and green mode of transport, FFBS has been adopted and developed rapidly in many Chinese cities since 2016, and Ofo and Mobike, the main brands of FFBS in China, have further expanded to other countries around the world such as Italy, Russia, the Netherlands and the United States [
5]. By the end of 2017, Ofo was operating in 21 countries and more than 250 cities worldwide, while Mobike was active in 11 countries [
6]. Unlike traditional public bikes that require riders to pick up or drop off at fixed docks, FFBS cyclists can park their bikes anywhere. Unfortunately, this has resulted a series of negative consequence, such as cyclists randomly parking on sidewalks and in other public spaces [
2,
7]. To limit the excessive expansion of shared bikes, Chinese local authorities have started regulating FFBS, and many companies offering shared bike services, such as Xiaoming Bike and Ofo, went bankrupt. Nevertheless, there is no doubt that FFBS is affecting individuals’ travel behavior and gradually bringing bikes back into the public consciousness again. By the end of 2018, the total number of free-floating shared bikes exceeded 20 million, which is far more than that of traditional public bikes, and FFBS is currently the most popular means of bike sharing in China.
Residents’ travel distances in Chinese cities have been increasing with the continuous expansion of urbanization [
8,
9], and the average commuting distance in more than 24 Chinese cities now exceeds 10 km. For instance, the average one-way commuting distance in Beijing reached 19.2 km in 2018 [
10]. This indicates that travelling by active modes such as walking or cycling can no longer meet most people’s travel needs on their own; instead, cars have become the main daily travel mode. As a result, traffic congestion and traffic-related air pollution are becoming more serious, with some Chinese metropolises having worst traffic congestion in the world. Local authorities struggling with traffic have been trying to promote the use of public transport, especially a combined approach to riding the metro and sharing bicycles. The combination of metro and FFBS systems (called a “metro–bikeshare” in this paper) can not only provide a “door-to-door” travel service for individuals, but can also expand the scope of metro services [
2]. It adds a green travel option for long distance travelers, and could potentially reduce the overall number of car trips in a city. However, in order to guide individuals to use metro–bikeshares more, it is important to understand the behavior surrounds the integration of metro and shared bicycle systems.
In China, the use of metro–bikeshares by individuals for daily trips is still in its trial stage, which is different from European countries such as the Netherlands, where shared bikes are popularly used by commuters to access trains [
11]. Nevertheless, many individuals in China, especially young people, are attracted to the idea of integrated metro–bikeshares. These individuals are likely to use metro–bikeshares for travelling occasionally, while still using other travel modes (such as cars, buses and buses to the metro) as their main travel mode. Since most metro–bikeshare users do not usually live within a walkable distance of a bus or metro station, low-frequency users are likely to shift to other motorized travel modes such as driving a car. For this reason, this paper assumes that the low-frequency users of metro–bikeshares are potential car users or passengers. To increase the utility of metro–bikeshares for these low-frequency users and prevent their dependence on using a car, the determinants of their current metro–bikeshare use frequency should be of special importance to researchers. There are many studies on the determinants of bike usage and its frequency, but the usage frequency of metro–bikeshares has been rarely considered. Little is known about what determines the use frequency of metro–bikeshare users.
This study aims to investigate the effects of personal and household social-demographics, travel-related characteristics, built environments and preferences on the use frequency of combined metro and shared bike systems. Taking Nanjing, China as a case study, a questionnaire survey was conducted at the entrances of seven functional metro stations. Before designing the questionnaire, the GPS data of shared bikes collected from the Mobike company in Nanjing City, China, the largest shared bike operator, were also used to analyze the spatiotemporal characteristics of metro–bikeshare users. This research contributes to a deeper understanding of the role of FFBS in encouraging individuals to use public transportation, and it provides policy implications on integrating metro and shared bike systems.
The rest of the paper is organized as follow:
Section 2 reviews the literature on the integration of metro and shared bike systems from the perspective of users.
Section 3 presents the methodology used in the paper.
Section 4 describes the empirical results of our analysis.
Section 5 discusses the findings and concludes the paper.
2. Literature Review
Since the first-generation of public bike systems was launched in the Netherlands in 1965, the integration of bikeshare and public transportation systems have been attracting much attention in the field of transportation. In order to promote the use of metro–bikeshare, numerous studies focus on the determinants of bike-sharing usage for metro access [
12]. However, due to a short history of FFBS development, the empirical evidence on how to effectively integrate FFBS and metro from the perspective of users is still limited [
13]. For this reason, existing studies on the use of integrated private bike/traditional public bike and metro by individuals are also included in this literature review. There are many factors influencing individuals’ decisions on the use of metro–bikeshares, which can be classified into four aspects: Personal and household demographic characteristics, travel-related characteristics, perception characteristics and the built environment.
As for personal and household demographic characteristics, evidence from different contexts show that the choice of the combined metro and bike mode is significantly associated with the socioeconomic characteristics of individuals and their family [
14]. These characteristics mainly include gender, age, education level, household income and car ownership in the household etc. For instance, Shelat et al. [
11] analyzed the user characteristics of bike-transit integration in the Netherlands. They found that individuals who are highly educated, have higher incomes, and are aged 17–27 are more likely to use the integrated bike and transit mode. The results are in line with the evidence from China which found high-income, high-educated and young metro passengers are more likely to use public bike to access metro [
14,
15,
16]. Recently, a study on the travel patterns of FFBS also pointed out that the users of combined FFBS and transit mode are more likely to be younger and more educated [
17]. In contrast to the above researches, Wang and Liu [
18] analyzed the characteristics of transit-bike users in the United States from 2001 to 2009. They found that the combined mode is more popular among those who have a low education level or come from a low-income household. One possible reason is that the high-income groups in the United States mostly live in the suburbs and prefer to travel by car. Besides, Kuhnimhof et al. [
19] found that individuals who have a personal car are less likely to use the combined transit-bike mode in Germany.
Among the travel-related characteristics, Puello and Geurs [
20,
21] analyzed the bike-and-ride systems in the Netherlands by using combined revealed and stated preference survey data. The results showed that factors influencing the choice of bike as an access or egress mode are travel purpose, travel distance, access and egress time and metro using frequency. Yang et al. [
22] investigated a mode shift of car commuters in suburban Nanjing, China to using public bikes to access the metro. The results revealed that middle- and long-distance car commuters are potential metro–bikeshare users. This was corroborated by the study of Zhao and Li [
14] and De Souza et al. [
23]. They found that travel distance between home and transit stations is the most important effect on the use of cycling for accessing/egressing metro. Chen et al. [
24] found that travel purpose is the main factor affecting metro passenger transfer. Passengers prefer to use public bike to access/egress metro for flexibility activities (i.e., shopping, visiting relatives and friends).
Regarding the factors related to the built environment, individual’s residential location, land use and bike infrastructure around metro stations seems to play important roles. Yang et al. [
22] found that residents living in suburbs prefer to use public bike to transfer to metro for commuting. Heinen and Bohte [
25] found that individuals prefer to cycle to access metro in residential zones. Zhang et al. [
26] pointed out that mixed land use has a positive impact on cycling. This is consistent with a study of Zhao and Li, who found that mixed land use and green parks in metro station areas are associated with higher rates of cycling transfer in Beijing [
14]. However, a study for Nanjing found that there is no effects of land use variables on the use of metro–bikeshare [
15]. In a recent study, Lin et al. [
27] presented a comparison study to clarity the associations of built environments with shared bike in Beijing, Taipei and Tokyo and found that the associations differ from one another despite their geographical and cultural proximity. This suggests that the use behavior of shared bike may vary across different built environments. Besides, many studies have found that the increase in bike lanes contributes to a higher likelihood of individuals in cycling [
14,
28,
29,
30].
Individual’s perceptions may also affect the use of bike to access to metro. For instance, Puello and Geurs [
20] found that the variations in train passengers’ perception of connectivity, attitude towards station environment and perceived quality of bike facilities significantly affect the bike-train share. Cheng and Liu [
16] pointed out that the environmental awareness of passengers significantly influence the use of integrated bike-transit mode. Zhao and Li [
14] found that metro passengers who prefer cheap travel are more likely to transfer by bike. Besides, the tolerance threshold of cycling distance between home and metro station plays an important role. Rastogi and Rao [
31] found that the mean acceptable access distance for cycling is 2.7 km in Mumbai, Indian.
Overall, there is no doubt that the integrated metro and shared bike mode can play an increasingly important role in improving the last/first mile problem and promoting the development of urban transport network. However, research on the use frequency of metro–bikeshare is still in its early stage, especially on the FFBS. None of the aforementioned studies examined the determinants of using FFBS as a feeder mode to access metro. Although FFBS belongs to bike sharing system, FFBS appears to be much more attractive than traditional public bikes. Firstly, FFBS is able to save precious land that surrounding metro stations by eliminating physical docks. Secondly, FFBS can be leased by almost all residents who have smartphones rather than an extra integrated circuit (IC) card. In order to promote the low-carbon transportation mode for long-distance, it is necessary to understand the determinations that influence the loyalty of metro–bikeshare users. Therefore, this paper focuses on the use frequency of an integrated metro–bikeshare by individuals and presents empirical evidences from Nanjing, China. By addressing the research gap, the current paper will offer more insights for policy makers to provide a better service or improve loyalty for metro–bikeshare users.
3. Methodology
3.1. Study Area
Nanjing, as the capital of Jiangsu Province, is an important city and commercial center in eastern China. By the end of 2017, the resident population of Nanjing was over 8.3 million, with an urbanization rate of 82.3%. The total area of Nanjing was 6587 km
2 and the built-up area was 1399.78 km
2 [
32]. As the urban space continues to expand, Nanjing’s metro has also been developed rapidly. Since the first metro line launched in 2005, there were 7 metro lines in Nanjing, a total of 129 metro stations with 409 entrances by 2017. In the same year, Nanjing launched the FFBS as a new bike sharing system. The shared bikes were mainly operated by five companies (Mobike, Ofo, Bluegogo, HelloBike and Coolqi), with a total of 0.2 million bikes at the beginning. Until the end of July 2017, the growing number of shared bikes has reached roughly 0.45 million, operated by 12 companies, of which Mobike held a considerable number of shared bikes with 0.12 million [
33]. Using one-day GPS data collected from Mobike Company in Nanjing City (one of the world’s largest FFBS operators) as a sample, the kernel density map of shared bikes uses in Nanjing is shown in
Figure 1. A high density of shared bike use around the metro station indicates that metro–bikeshare system with metro as the mainstay and FFBS as the feeder mode is formed.
3.2. Before Designing the Questionnaire
Before designing the questionnaire, something about metro–bikeshare use behavior of individuals living in Nanjing are firstly required to know due to our limited awareness. Since GPS data can truly reflect temporal and spatial characteristics of travelers, one-week GPS data collected from Mobike Company in Nanjing from 18 September 2017 to 24 September 2017 were used in this paper. The data mainly includes the origin and destination locations of each trip with corresponding latitude and longitude, trip start time, trip end time, user ID and bike ID. After the deletion of missing information, abnormal data and trips that last less than one minute and more than 120 min, 2,704,294 shared bike trips were retained, accounting for 92.34% of the original data.
Three travel-related spatiotemporal information were extracted from the data: (1) The distribution of walking distances between metro stations and shared bike parking lots; (2) the distribution of cycling times between origins/destinations and metro stations; and (3) the times when metro–bikeshare users pick up/drop off shared bikes to transfer to/from a metro. To obtain these characteristics, it is necessary to first identify metro–bikeshare users. Due to the lack of metro user data, in this study, shared bike users within the attractive scope of metro stations (buffer radius) are regard as the metro–bikeshare users. The buffer radius can be obtained by exploring the relationship between the cumulative frequency of shared bike use and the distance from the metro station (transfer distance). The transfer distance corresponding to the 85th percentile value of the cumulative distribution of bikeshare trips can be considered as the buffer radius, because it can cover most metro–bikeshare users’ trips [
34]. Based on this, multi-ring buffers were created at the 409 metro entrances in ArcGIS. Generally, 300 m is used as the maximum transfer distance for public bike to access/egress metro stations [
35,
36,
37]. Considering that individuals can pick up or drop off free-floating shared bikes close to the metro stations, a total of 25 buffers were constructed from 0 m to 250 m at an interval of 10 m for each metro entrance.
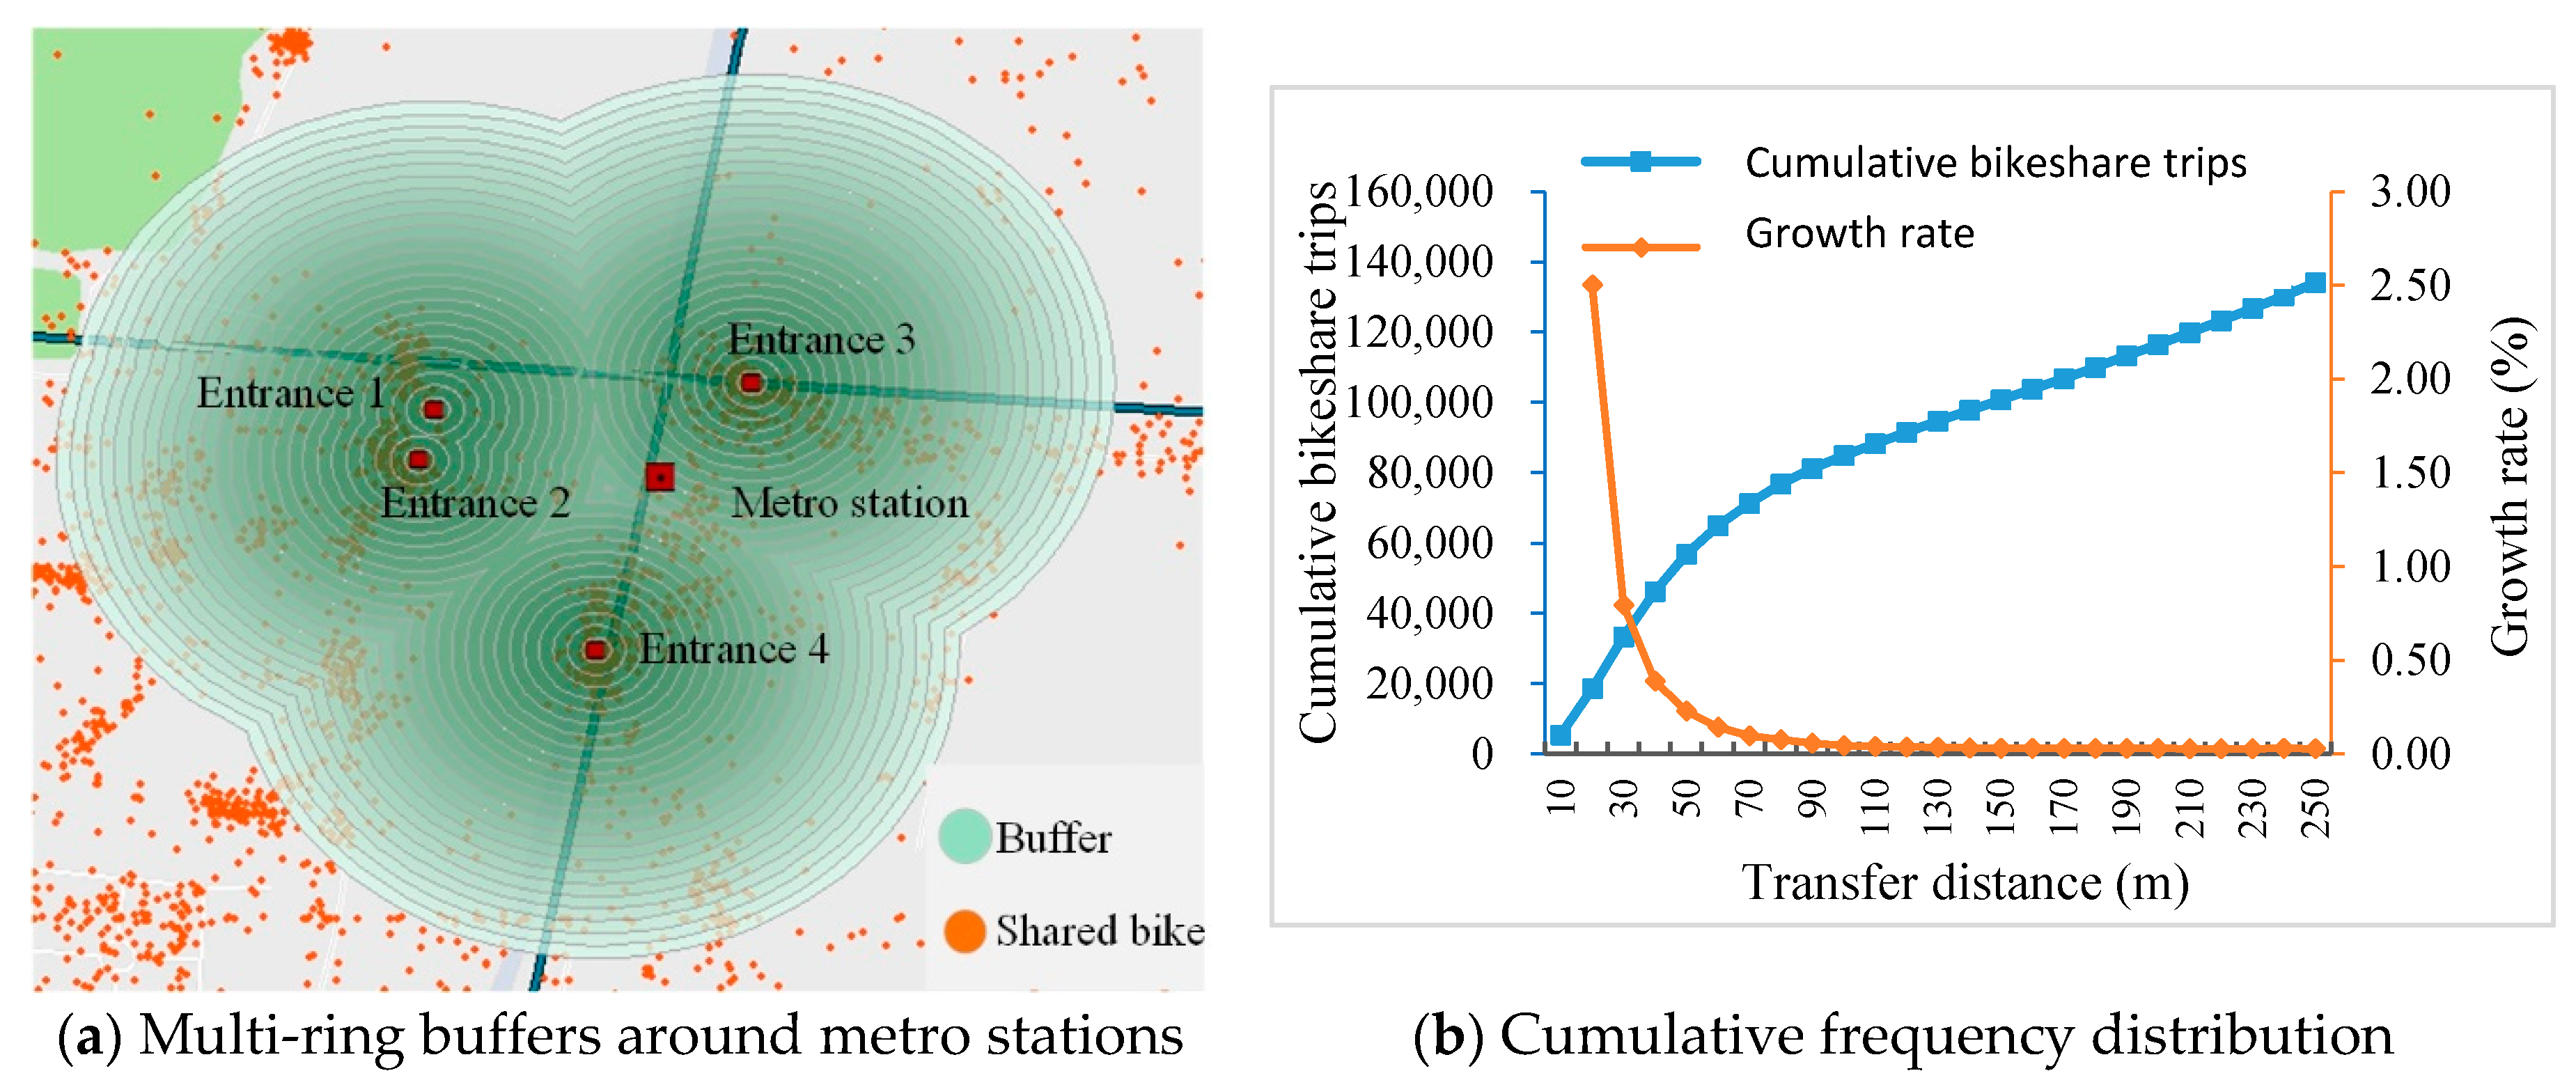
Figure 2a illustrates an example of the buffers created at the metro entrances. Further, the shared bike trips within all buffers have been calculated respectively. The cumulative frequency distribution of shared bike use within different buffers is shown in
Figure 2b.
Figure 2b shows that the cumulative curve increases sharply for the first 30 m and then the growth rate slows down. It reaches the 85th percentile value at around 150 m. In order to check whether the buffer around metro stations is reasonable, we further explored the spatial distribution of shared bike trips with origins or destinations falling into the 100, 150 and 200 m area around metro stations corresponding to the 70th percentile, 85th percentile and 90th percentile, respectively. We found that the distribution of bike trips is the most intensive in a 150 m area, and the distribution becomes uneven and sparse beyond 150 m. Therefore, it can be considered that 150 m is the acceptable transfer distance between the metro stations and shared bikes. Based on this, we identified 100,642 shared bike transferring trips, accounting for 18% of the total samples. This result is consistent with the previous research results which found that about 20% of shared bike trips are for accessing/egressing to metro [
6]. Using the identified data, the characteristics of shared bike were analyzed from three aspects: Picking up/dropping off time of day, cycling duration and cycling distance. The morning peak and evening peak of metro–bikeshare trips refer to 7:00–9:00 and 17:00–19:00, respectively. The other two characteristics of shard bike trips are shown in the
Table 1. These results can be used as a reference for the setting of travel-related options of shared bike in the questionnaire. Specifically, the intervals of the travel time on bikeshare, travel distance on bikeshare and transfer time of day can be set according to the spatiotemporal distribution. Notably, our results show that the trip distances by shared bikes are limited to 2 km. The main reason may be that metro–bikeshare users tend to finish their shared bike rides within 2 km.
3.3. Survey and Data Collection
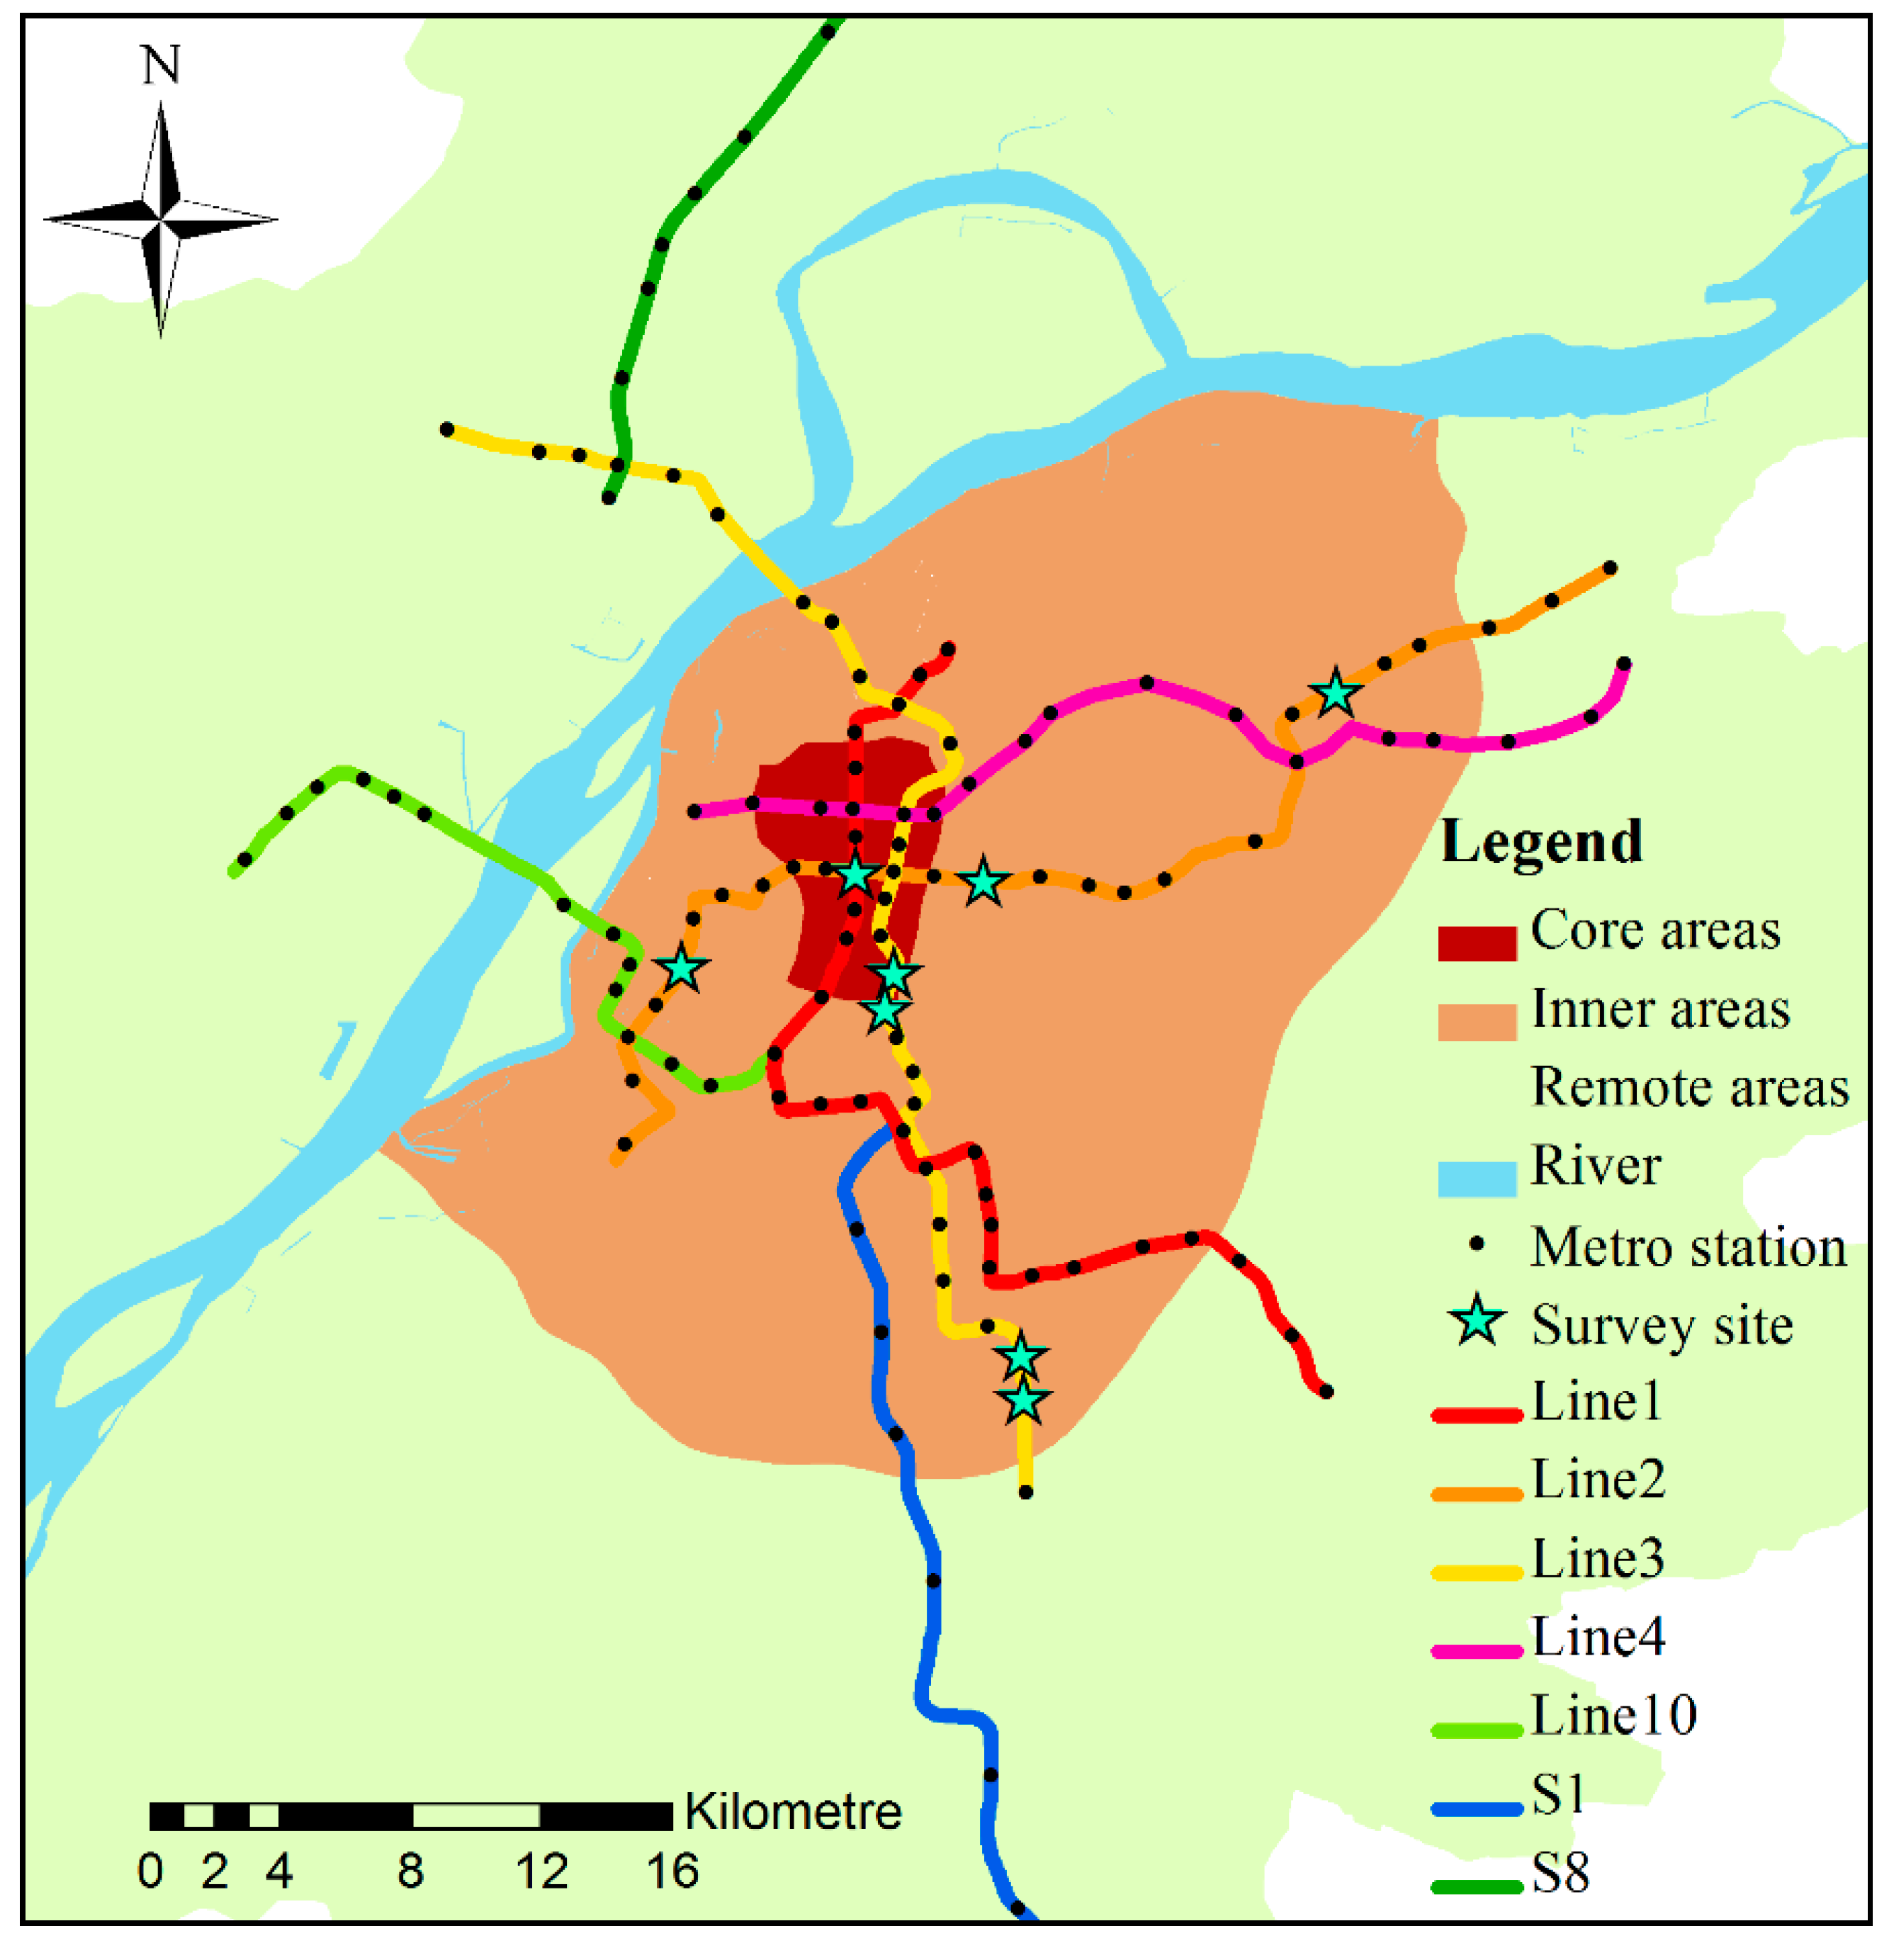
This study aims to explore the determinants of individuals’ use frequency of metro–bikeshare based on survey data. The possible factors influencing the use of the combined mode were considered in the questionnaire, including individual and household socioeconomics, travel-related characteristics, the built environment and perceptual characteristics. Due to the limitation of manpower and resources, it is impossible for the questionnaire to cover all metro stations in Nanjing. Thus, in order to maximize the universality of the survey results, it is necessary to select representative metro stations. Nanjing metro stations can be classified into seven categories according to the land use and metro ridership, including traffic hub and scenic spot stations, university influenced stations, employment-oriented stations, residential-oriented stations, spatial mismatched stations, mixed employment-oriented stations and mixed residential-oriented stations [
38]. We selected the metro station with the largest shared bike trips from each type as the survey site, as shown in
Figure 3. It is worth noting that because of the large number of spatial mismatched stations, an additional survey site for this type was selected.
Six interviewers were deployed to conduct a random sample survey in the eight metro stations from 10 October 2018 to 24 October 2018. Since our survey only focused on those who use shared bikes to access or egress metro, the acquisition of survey samples is not easy. Especially in the morning and evening rush hours, most metro–bikeshare users were in a hurry and refused to answer questions. Finally, a total of 406 metro–bikeshare users responded to the survey. The main information that were collected are as following:
The weekly use frequency of the integrated metro–bikeshare of the respondent, which refers to the use days per week because the number of days can better reflect the loyalty of the users. The use frequency was categorized into three options including ≤2 days per week (low frequency), 3–4 days per week (intermediate-frequency) and 5–7 days per week (high-frequency).
Sociodemographic of the respondent, including age, gender, education level, occupation, individual income, car ownership and driving experience.
Travel-related characteristics, namely travel time on metro, cycling time, travel purpose (multiple options) and transfer time of day. The options for shared bike were set according to the spatio-temporal characteristics obtained in the
Section 3.2.
Characteristics of the built environment, including residential district, workplace district and the continuity of bike lanes around home and workplace.
Characteristics of respondents’ perceptions, including the tolerance time threshold of searching a shared bike and the decisions when he/she fails to find a shared bike.
3.4. Descriptive Statistics
After removing the incomplete surveys and respondents, the final valid sample used in the study included the data from 374 respondents with the effective recovery rate of 92.12%. Approximately 71% of the respondents were under 30 years old. This may be because the use of shared bikes needs to scan the QR code with mobile phone for unlocking and paying the fee by WeChat Pay or Alipay, which is more popularly acceptable by young people. In addition, one of the survey sites is a university influenced station where many college students were interviewed, accounting for a larger percentage of young people.
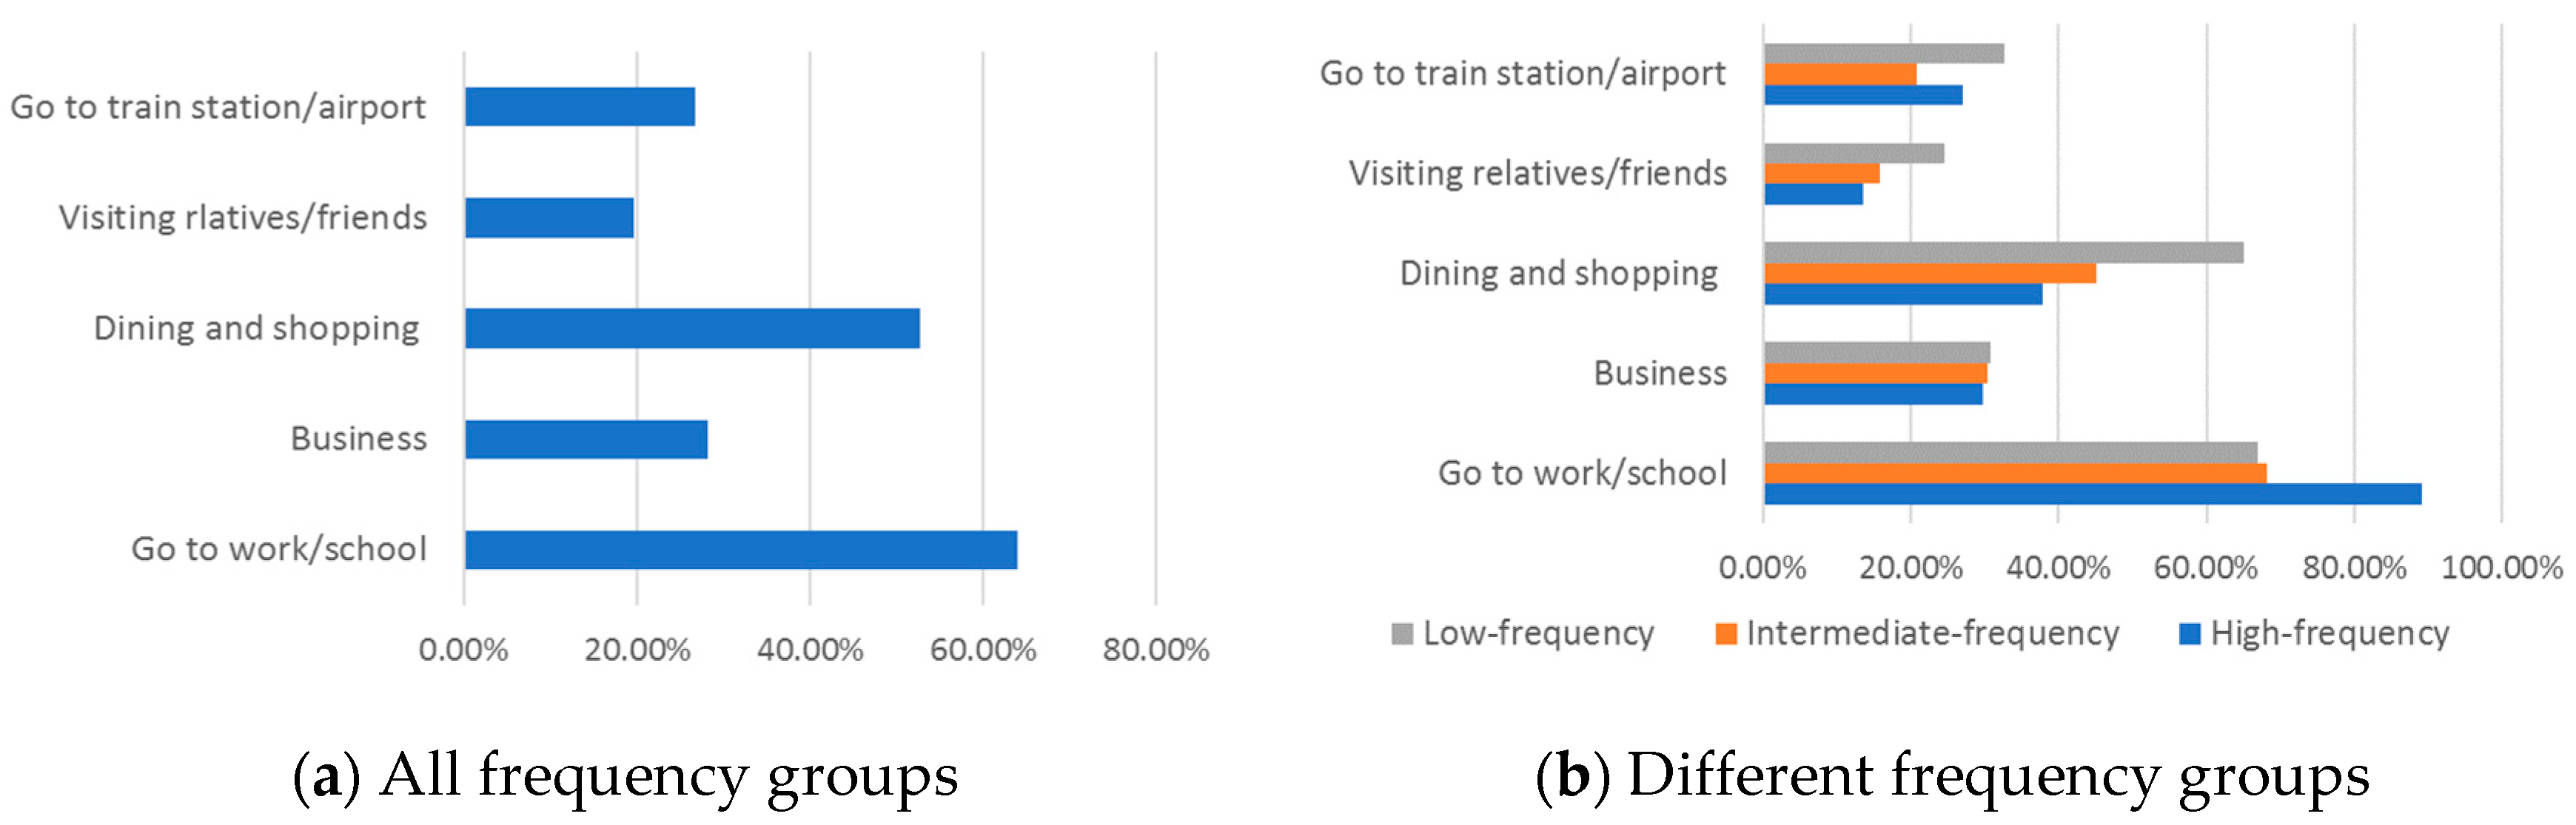
Moreover, the descriptive statistics on the use frequency of metro–bikeshares by individuals were made. The result shows that the high-, medium-, and low-frequency groups of metro–bikeshare users in Nanjing account for 9.92%, 21.98% and 68.1%, respectively. This means that although most individuals use shared bikes as a transfer mode to access/egress metro for less than three days a week, still more than 30% of individuals use metro–bikeshare as their main travel mode. We further analyzed the travel purpose of respondents using an integrated metro–bikeshare, as shown in
Figure 4.
Figure 4a shows that subsistence activities (i.e., go to work, go to school and go home) and leisure activities (i.e., dinning and shopping) were the main travel purposes of metro–bikeshare users, accounting for 83.91% and 61.39% respectively. However, the main travel purposes were different among the three frequency groups.
Figure 4b shows that respondents from the high frequency group preferred to use metro–bikeshares to commute, while those from the low-frequency group are more willing to use FFBS for dining and shopping. This indicates that the low frequency users are likely to commute by other travel modes and most of them only use metro–bikeshare for non-commute trips. Different from the above two groups, the intermediate group used FFBS for both subsistence activities and leisure activities. However, all respondents regardless of the frequency group hold the same view that FFBS as a feeder mode can significantly improve the accessibility for their daily activities.
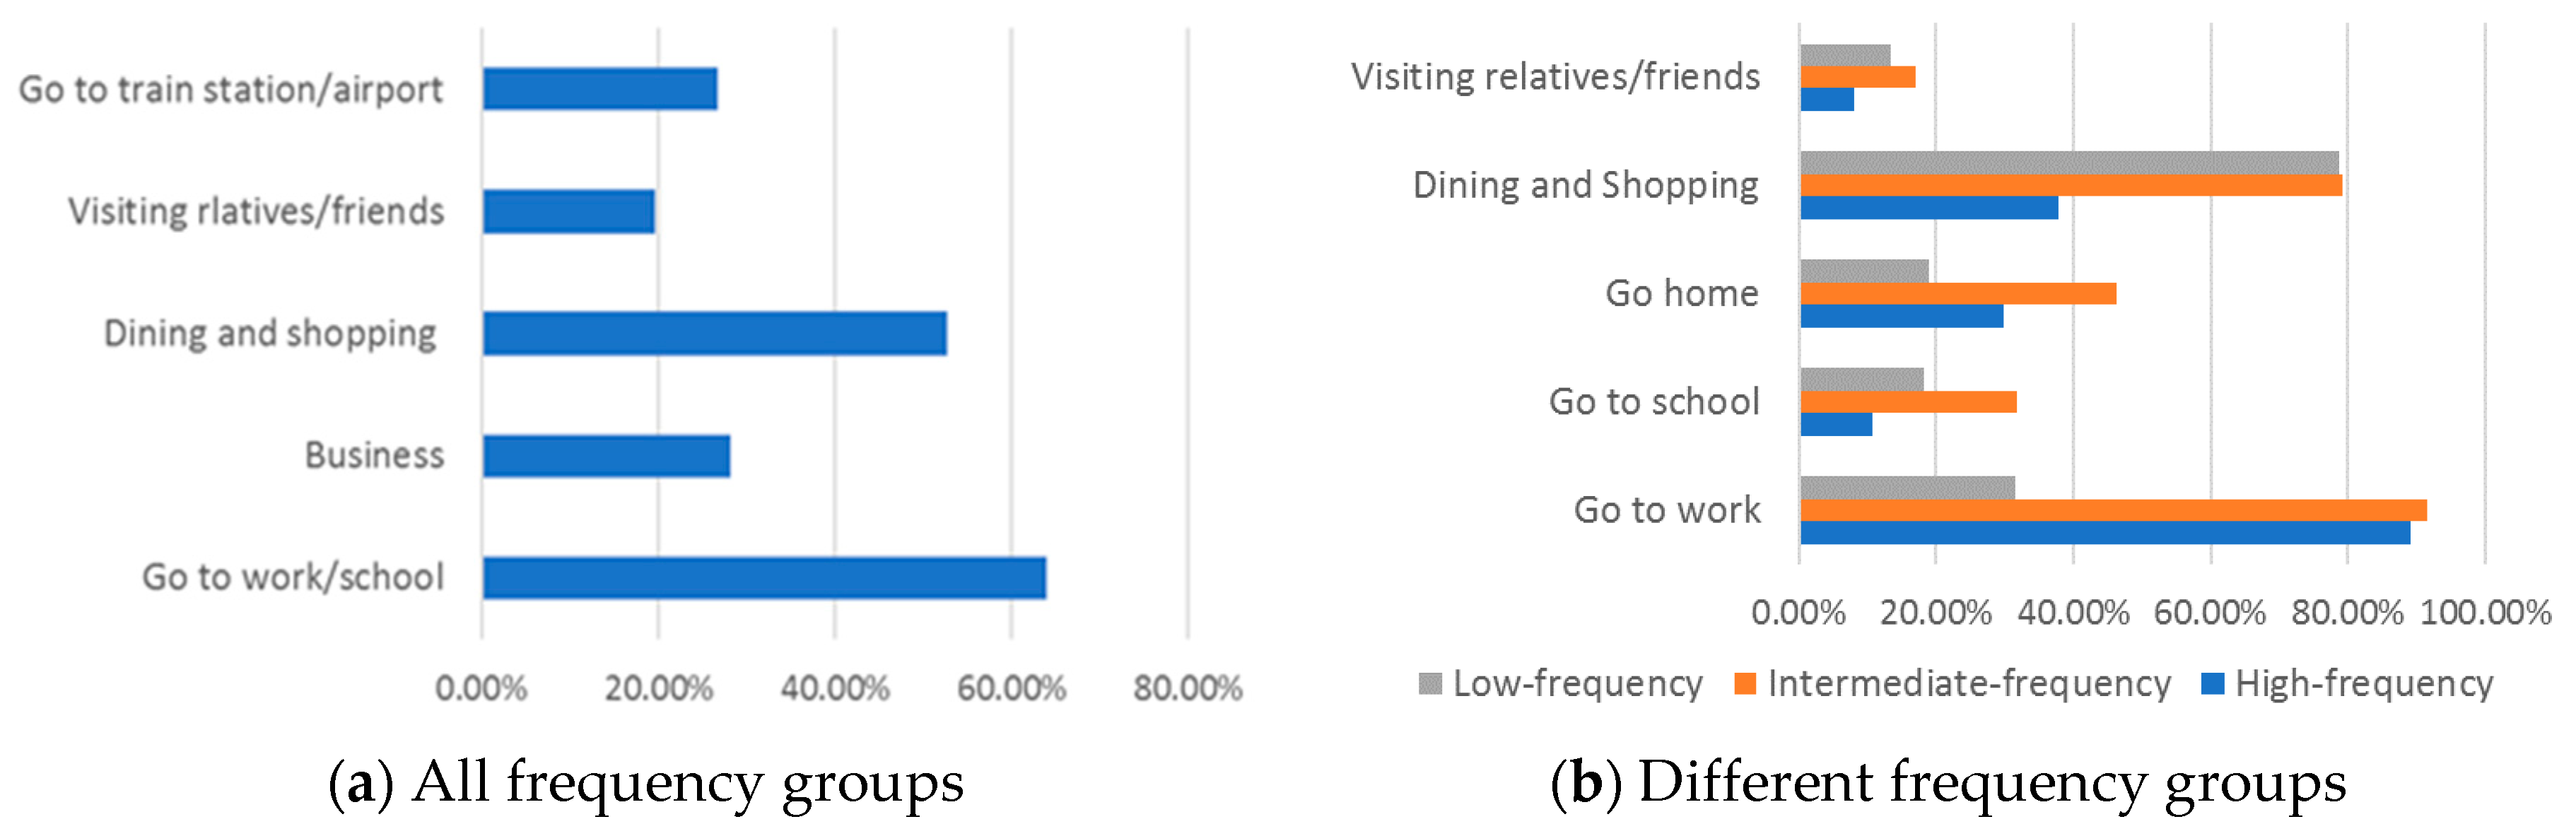
Figure 5 shows the daily activities which accessibility is improved by using the integrated metro and shared bikes.
As shown in
Figure 5a, more than 60% of the respondents expressed that FFBS makes it more convenient for them to work or go to school by metro, followed by dining and shopping. Similar proportional distribution can be found for different frequency groups, as shown in
Figure 5b. However, the proportion distribution of low-frequency group is not consistent with that of their travel purposes using metro–bikeshare. This indicates that although most metro–bikeshare users believe that FFBS improves their accessibility to work, still a considerable number of low-frequency users choose other travel mode for commuting trips.
Figure 5b also shows that high-frequency group considers that the FFBS has not improved the accessibility of their leisure activities. This may be the reason why they are less likely to use the metro–bikeshare for leisure activities. In addition, the statistical analysis results of other characteristics for the respondents by different frequency groups are shown in
Table 2. Options for some features have been merged due to few samples.
Our study sample shows that the proportion of male and female was almost the same. Individuals who were younger than 30 years old outnumber the other group, because they were more willing to be surveyed as stated before. Over half (62%) respondents possessed a college bachelor’s degree, and many of them were students. Most respondents earned less than 10,000 RMB (about 1425 dollars) per month. More than 70% of the respondents had a driving license, but only 38% of them ha one or more household cars. This indicates that most individuals in China, especially young persons, live in car-deficient households with more driving licenses than cars.
Due to the diversity in respondents’ travel purposes of using metro–bikeshare, their travel purposes as shown in
Figure 4 were classified into three categories, namely work-related activities, work-related and other activities, and other activities.
Table 2 shows that about 36% of respondents only used metro–bikeshare for non-commuting trips, but more than 40% of them used the mode for work-related trips. Most of respondents spent more than 30 min on the metro for their daily trips, and nearly half of them cycle between 10 and 20 min. This suggests that most metro–bikeshare users have a long travel distance. Moreover, only 30.56% of respondents used shared bike to access/egress metro during peak hours.
Table 2 also shows that more than half of the respondents lived in peripheral area and/or work in the same area. Since the frequency of individuals using metro–bikeshare may be related to the bike infrastructures around their daily activity space which cannot be exacted from the survey site, the condition of bike lanes around home and workplace were asked from respondents in our questionnaire. Many respondents claimed to have non-continuous bike lanes around their main activity places and some of them even had no bike lanes; only 27% of the respondents had continuous bike lanes.
The tolerance distance threshold of respondents searching for a shared bike peaked at the interval of [0, 50) m, and only 25.47% of the respondents stated that they can walk over 150 m for searching a shared bike. This result, to some extent, suggests that it is reasonable to use 150 m as the buffer around metro stations to identify metro–bikeshare users. Moreover, nearly 80% of the respondents claimed that they would give up the use of metro if they fail to find a shared bike.
3.5. Ordered Logistic Regression Model
Ordered logistic regression model is widely used to analyze the dependent variables with order relationships. In this paper, there is an order relationship among the three frequency groups, and thus ordered logistic regression model was used to analyze the relationship between the influencing factors and the use frequency of metro–bikeshares. For the dependent variable
, ordered logistic regression model [
39] is described as Formula (1).
where
is the group number;
is the dividing point of frequency containing
values,
;
is the regression intercept;
is the regression coefficient of the independent variable
;
is cumulative probability; and
is a function of
. For ordered logistic regression model, the odds can be calculated by the sequential accumulation of event probabilities [
40]. Cumulative probability is described as Formula (2).
After obtaining the cumulative probability, the probability belonging to a frequency group can be calculated. The maximum likelihood estimation method was used to calculate the parameters of ordered logistic regression model in this paper. It is worth noting that the test of parallel lines should be conducted firstly and this test could be the basis to evaluate whether the model is applicable. The p-value over 0.05 indicates that the regression coefficients of all the independent variables remain unchanged, regardless of the value of the dividing point of the dependent variable. Therefore, the regression coefficient of an independent variable has no relationships with the dividing point and the established ordered logistic regression model is applicable.
4. Results
Before inclusion of variables into the model, the multi-collinearity among variables should be examined. The variables that are highly correlated with the other variables should be removed. The correlation among variables is usually tested depending on their variance inflation factors (VIF). The correlation is considered to be high when the VIF is larger than 7.5. Accordingly, we tested for multi-collinearity and found that age is highly correlated with other variables with a VIF larger than 7.5. Therefore, we put all explanatory variables except for age into the model. The variables that were significant at the 95% level were retained, and then the other variables were removed one by one to ensure the best fit of the model. The fitting information and regression results of the final model are shown in
Table 3. It is noted that the variables, including gender, travel time on bikeshare and residential location have been retained as they can increase the goodness-of-fit of the model.
As shown in
Table 3, the test of parallel lines has a result as χ
2 = 20.495,
p = 0.115 (>0.05), which indicates that the order logistic regression model is applicable. The
p-value of the final model is 0.000 (<0.05), which shows that the model with three independent variables including personal socioeconomic, travel-related characteristics, built environment attributes is better fitting than the model with only constant terms. The significance test indicates that the variables including education level, individual income, travel purpose, travel time on metro, workplace location and bike lane infrastructure have a significant impact on the transfer frequency.
As for individual attributes, the estimated coefficient of responders with a high school education or less is positive. This indicates that individuals with a less education are more likely to use bikeshare frequently access/egress to metro, the frequency of which is 1.744 times that of the individuals with a college education or more. The main reason may be that the survey sample includes many college students, who use the integrated metro–bikeshares with relatively low frequency. The estimated coefficient of income below 5000 is −0.661, indicating that individuals with income below 5000 per month prefer to use bikeshares as a feeder mode to metro at low frequencies, when compared to individuals with income above 10,000 per month. However, no statistically significant difference exists between individuals with 5000–10,000 per month and the reference group. This indicates that 5000 is a turning point, after which a significant increase in the use of metro–bikeshares is observable. In addition, no statistically significant difference was found between male and female. Unexpectedly, metro passengers’ occupation and car-related attributes including driving license and household car ownership have no significant impact on their frequencies of using metro–bikeshare. One possible reason is that most of the metro–bikeshare users are youngers who usually live in car-deficient households with more driving licenses than cars, and household car is less likely to be assigned to them. Therefore, whether they have a driving license or a household car has little impact on their use frequency of metro–bikeshare integration.
In terms of travel-related characteristics, the estimated coefficient of responders travelling for work-related activities is 1.565, indicating that commuters prefer to use the combined metro and bike mode at high frequencies, which is 4.783 times that of those using the mode for non-commuting activities. Compared with the commuters whose travel time on metro is over 45 min, the commuters who travel on metro less than 30 min and between 30 and 45 min are less likely to use the combined mode at high frequencies, which odds ratios (OR) are 0.337 and 0.484, respectively. This result shows that the longer the metro commuting time is, the more likely the commuter will use the bikeshare to access/egress at high frequencies to the metro. One of the major reasons for this is that metro travel with a long distance may reduce the negative effects caused by transfer behavior. Unexpectedly, there is no significant difference in the use frequencies of the metro–bikeshare of travel time on bikeshare less than 10 min and between 10 and 20 min when compared to the reference group. Nevertheless, the positive coefficients indicate that those cycling for a short time use bike more frequently to transfer to/from a metro station.
As for built environment attributes, the estimated coefficient of responders working in peripheral areas is negative. This indicates that individuals who work in peripheral areas are more likely to use bikeshares as a feeder mode to metro at low frequencies, which is 0.289 times that of individuals who work in the central area. This may be resulted from the low density of metro stations and shared bikes in the peripheral areas. However, living in the peripheral area have no statistically significant impact on individuals’ use frequency when compared to those living in the core areas. This may be due to the complexity of the attributes of individuals living in urban areas. Interestingly, the model results also show that compared with individuals who have to cycle on non-continuous bike lanes, individuals riding on continuous bike lanes prefer to use metro–bikeshare at high frequencies. This indicates that friendly environments of cycling can improve the integration of metro and bikeshare.
5. Conclusions and Discussions
Our study reveals that people who have an education level of high or less is more possible to use FFBS as a feeder mode with a higher frequency. This finding is consistent with that of the United States [
18]. However, individuals come from low-income group have an opposite effect on their use frequency. One of the possible reasons for this is that individuals with a higher education level and low-income are university students who occasionally travel by metro for flexibility activities such as shopping and entertainment. This suggests that university students are being attracted to use the metro–bikeshare mode, albeit the low use frequency. Since university students are likely to be potential car users when they enter the workforce, more consideration should be given to them in policy making and facility planning. Another reason is that higher education level group may have better environmental awareness [
41]. This suggests that the concept of low-carbon travel should be more popularized in both schools and workplaces. Besides, our results show that the characteristics of car ownership and driving license have no effects on individuals’ use of metro–bikeshare, which is different from the situation in developed countries such as the Netherlands [
42] and Canada [
43]. This is probably because most individuals in China are from car-deficient households, therefore, some of them choose to travel by metro–bikeshares due to the lack of a second car in the household. A second car purchasing limitation may have a short-term effect, but the limitation can never be effective without promoting metro–bikeshare service.
Travel-related characteristics is another important factor influencing the frequency of metro–bikeshare use. Metro commuters prefer to use shared bike to access/egress metro for commuting and other flexibility activities, such as shopping, dining and entertainment. Therefore, a transit-oriented urban planning may contribute to a higher frequency of commuters using metro–bikeshares. Besides, our results show commuters travel with a long time has a higher possibility that they use the shared bikes to access/egress metro more frequently. This finding is consistent with previous research [
14,
22], which suggests that the integrated metro–bikeshare is an alternative of cars for long-distance commuters. However, still many residential areas in Nanjing have no shared bike facilities (including shared bikes and parking sites), especially those in remote areas; hence, parking sites for shared bike in those areas should be added. Notably, although there is no fixed station for free-floating shared bikes, FFBS companies such as Mobike have set up designated parking sites for their shared bikes to avoid disordered bike piling.
Another notable result is that individuals working in core areas are more likely to choose an integrated metro and bikeshare systems. On the one hand, the majority of shared bike facilities are distributed in the metropolitan core areas, which make the shared bike more accessible. Also, the land use around metro stations in core areas is mixed and concentrated. In other words, the origins/destinations of individuals are more likely to be located within the acceptable cycling distance. On the other hand, many of individuals, especially young commuters, who work in core areas may live in inner or remote areas due to the high housing prices in the city center. They are likely to go to work for a long commuting distance and prefer to use bike to access/egress metro. However, even though shared bikes in urban areas of Nanjing has reached saturation point, these passengers are still unable to borrow the bikes in many cases. Therefore, it is necessary to rebalance shared bikes for different types of metro stations and urban land use by intelligent management and operations. Besides, there is also strong evidence that continuous bike lanes around home and workplace has a positive effect on more use of metro–bikeshares. To encourage more people to use the integration of metro and shared bike systems, a well-developed infrastructure for continuous bike lanes is vital.
As the paper aims to study the determinants of individuals’ use frequency of combined metro and FFBS mode, it contributes an overview for the integration of FFBS system with metro at the early stage. The main factors influencing on the loyalty of metro–bikeshare users who are being attracted to use the integrated mode are obtained. Nonetheless, there are some limitations to the research. First, as stated before, about 72% of the respondents are young adults. Hence, our findings, to a large extent, mainly reflect the use frequency characteristics of young people. Second, due to the limitation of data, our study used the shared bike trips within 150 m distance from each metro station as the transfer trips to analyze the spatio-temporal characteristics of cyclists’ journeys. It may lead to some wrongly identification for the cyclists who did not access/egress to metro; hence, future studies will need to identify the metro–bikeshare trips by combining smart card data of metro. In addition, land use and other transport facilities such as the density of bus stop around individuals’ trip endpoint may also influence the use frequency. These will be addressed in future studies.


