1. Introduction
Globally, enhancing crop productivity has become a keenly sought after objective following the burgeoning population and rising income. Particularly, the failure to realize the maximum obtainable output from a given set of agricultural inputs is inconsistent with the “cleaner production concept.” Mwalupaso et al. [
1] describe this concept as prevention of waste in production (i.e., achieving lower output than expected from a fixed set of resources), while increasing efficiency in the use of agricultural inputs. Therefore, governments are looking for ways to improve food production for country-specific and globally held strategic crops. For example, in Kazakhstan, the agricultural stakeholders (government, farmers, and research institutes) are intensely searching for agricultural innovations to augment wheat output. In fact, the government has been promoting (through awareness programs and campaigns) and actively participating in certified seed validation [
2,
3,
4]. This move is motivated by the fact that damage/waste (especially poor-quality harvests) results from using uncertified seeds, culminating in a failure to adequately satisfy current food demands. They contend that prolonged use of uncertified seed causes a decline in fertility due to the infection from insects as well as the contamination of more weeds, and prevalence of broken seeds and empty shells [
5,
6].
The fact is that seeds are the basic units of plant propagation, and to a very large extent, they are the most crucial input in agricultural production. In this regard, using certified seeds is held to double crop yields, thereby enabling agriculture to play its food security role more credibly [
7,
8,
9]. The reasoning is that since certified seed is produced from seeds of known genetic origin and purity in a controlled and tested manner and processed and declared in accordance with the law on seeds, production is likely to be “cleaner.” In support, scholars [
10,
11,
12] assert that the continued dependence on uncertified seeds (farmer-saved seeds and from local markets) is not the best choice for achieving increased agricultural productivity. Thus, there is a strong case for promoting certified seed espousal, especially in wheat production. However, to date, certified seed adoption levels are still below the expected levels largely because of farmers’ financial constraints which do not permit them to purchase the relatively expensive seeds.
Wheat is a dominant crop, covering almost 75 percent of the total cultivated land [
13], making Kazakhstan an important producer and exporter of wheat worldwide. It is among the most important food grains that is consumed and traded internationally [
14,
15]. In the past, average production was overwhelmingly higher than domestic consumption [
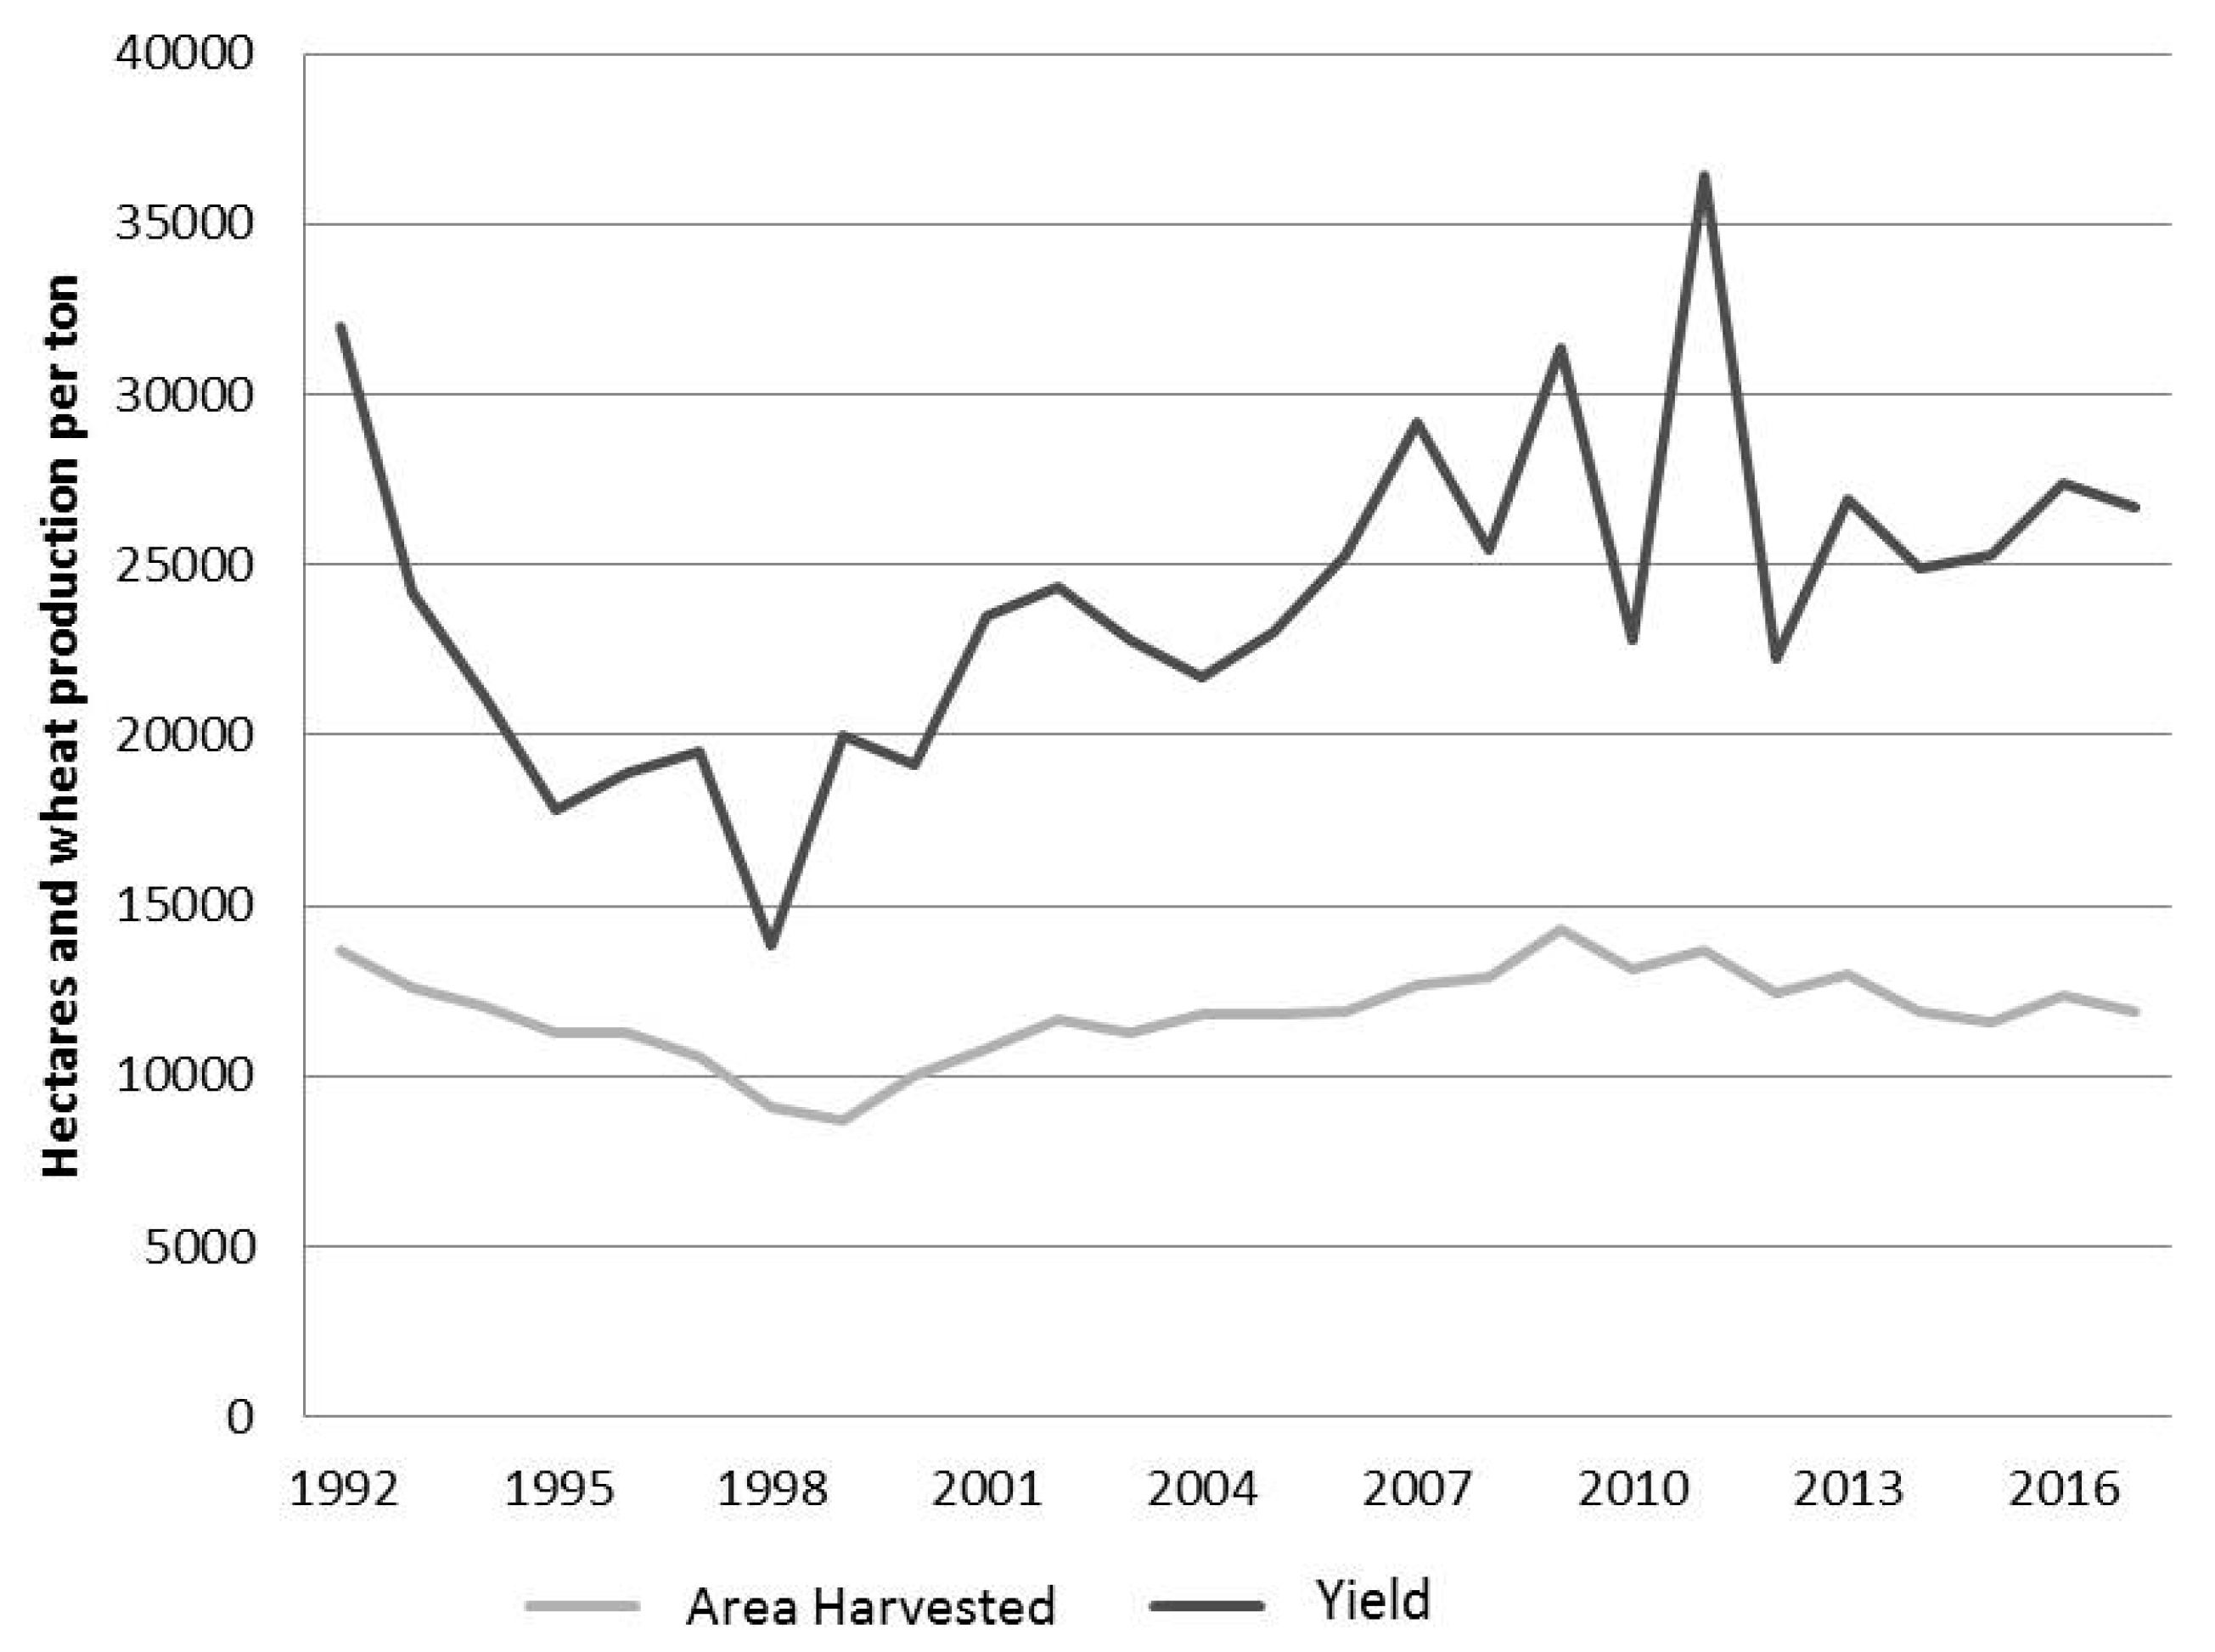
16], leading to substantial export without compromising domestic food security. The significance of wheat is accentuated by its essential role as a food for humans, raw material for alcohol, feed for livestock and an ingredient in bio-ethanol processing. Arguably, these are the dimensions of wheat use that make it highly essential for the sustainability of economic growth and human development. However, agro-physical factors, unpredictable weather conditions, and the frequent occurrence of plant diseases and pests are enormous impediments to improving Kazakh wheat production. Thus, in recent times the yields are lower and highly volatile [
16]. Ultimately, achieving and maintaining high output levels has become a national challenge. In view of the highly fluctuating wheat production over time (
Figure 1), increasing technical efficiency (the ability to produce maximum possible output from a given set of inputs under the available production technology) has become a topmost priority during current policy debates.
Consequently, a certification process guaranteeing seed quality has been developed on the premise that use of quality seeds is designated as a prerequisite for agricultural sustainability and the achievement of national food security goals [
10,
12]. The process starts with establishing the seed crop varieties, crop cultivation and testing by experts, and it ends with harvesting, processing, quality control and labeling under the supervision of the Ministry of Agriculture. This process is performed in strict accordance with the guidelines, and only the producers formally listed in the seed register can participate. In addition, while seed processing is performed at registered processing facilities, quality testing is performed at accredited laboratories and package labeling is issued by the organization approved by the Ministry of Agriculture. It is anticipated that this undertaking would assist farmers in growing healthy and bountiful crops because the processed seed is considerably better than the conventional uncertified seed in terms of uniform seed size and quality [
18].
Conceptually, many studies on adoption of improved agricultural technology have been conducted. For instance, in Asia and Latin America, Mathenge et al. [
19] reported that adoption of high yield varieties of maize, wheat and rice impacts poverty reduction and household welfare. Joshi et al. [
20] also conducted a study in Pakistan on the acceptance and competitiveness of new improved wheat varieties by smallholder farmers and found that improved seed could possibly ensure food security as an additional 0.3–0.5 tons of grain per hectare, sufficient to feed two to three persons per year, are realized by adopters. In Africa, Shiferaw et al. [
21] concluded that policies that enhance diffusion and adoption of modern wheat varieties should be central to food security strategies. The aforementioned studies clearly highlight that a likelihood of increased productivity gains, reduction in poverty and contribution to food security leads to the adoption of improved wheat varieties. However, whether espousal promotes cleaner production was hardly recognized and emphasized. There is a dearth of literature on this subject in Kazakhstan, prompting a lack of adequate comprehension among policymakers about the role of certified seeds and how their adoption could elicit cleaner production. Such a situation can be detrimental and poses real costs to society in terms of untapped potential in wheat production, which has significant socioeconomic and cleaner production implications.
Therefore, this study meticulously addresses the effect of certified seed adoption on wheat productivity and evaluates the determinants of certified wheat seed adoption in Kazakhstan. The results address two important scholarly and policy questions. First, is using certified seeds for wheat production warranted for improved technical efficiency? Second, how can certified seed adoption be promoted? The solutions to these questions could help to improve wheat production in Kazakhstan as well as improve its food security status. This country also provides a useful case for other developing countries to learn from because of the government’s strong commitment to ensuring that the certified seeds and production outlets conform to the highest standards.
Our study contributes to the literature in four ways. First, we apply robust econometric models that reliably address biases stemming from observed and unobserved variables. This approach aids in providing solid and reliable policy suggestions. Second, we attempt to establish a link between certified seed adoption and improved efficiency (cleaner production). Given that seeds are very useful inputs in production, the results of the study are important for many agricultural players and stakeholders who are seeking to promote the sustainability of wheat production and attainment of cleaner production. Third, unlike other studies, we specifically evaluate certified seed rather than generalizing about improved seed. This perspective is pertinent for establishing measures or solutions that are target specific. Finally, we focus on wheat, a strategic and priority crop for most developing countries, and as such, this study holds an indirect connection to food security campaigns and sustainable development goals (SDGs) – Goal 1 and 2.
The remainder of the paper is structured as follows:
Section 2 gives details on the material and methods;
Section 3 provides the empirical results and the discussion; and
Section 4 presents the conclusion and policy recommendations.
2. Materials and Methods
2.1. Data
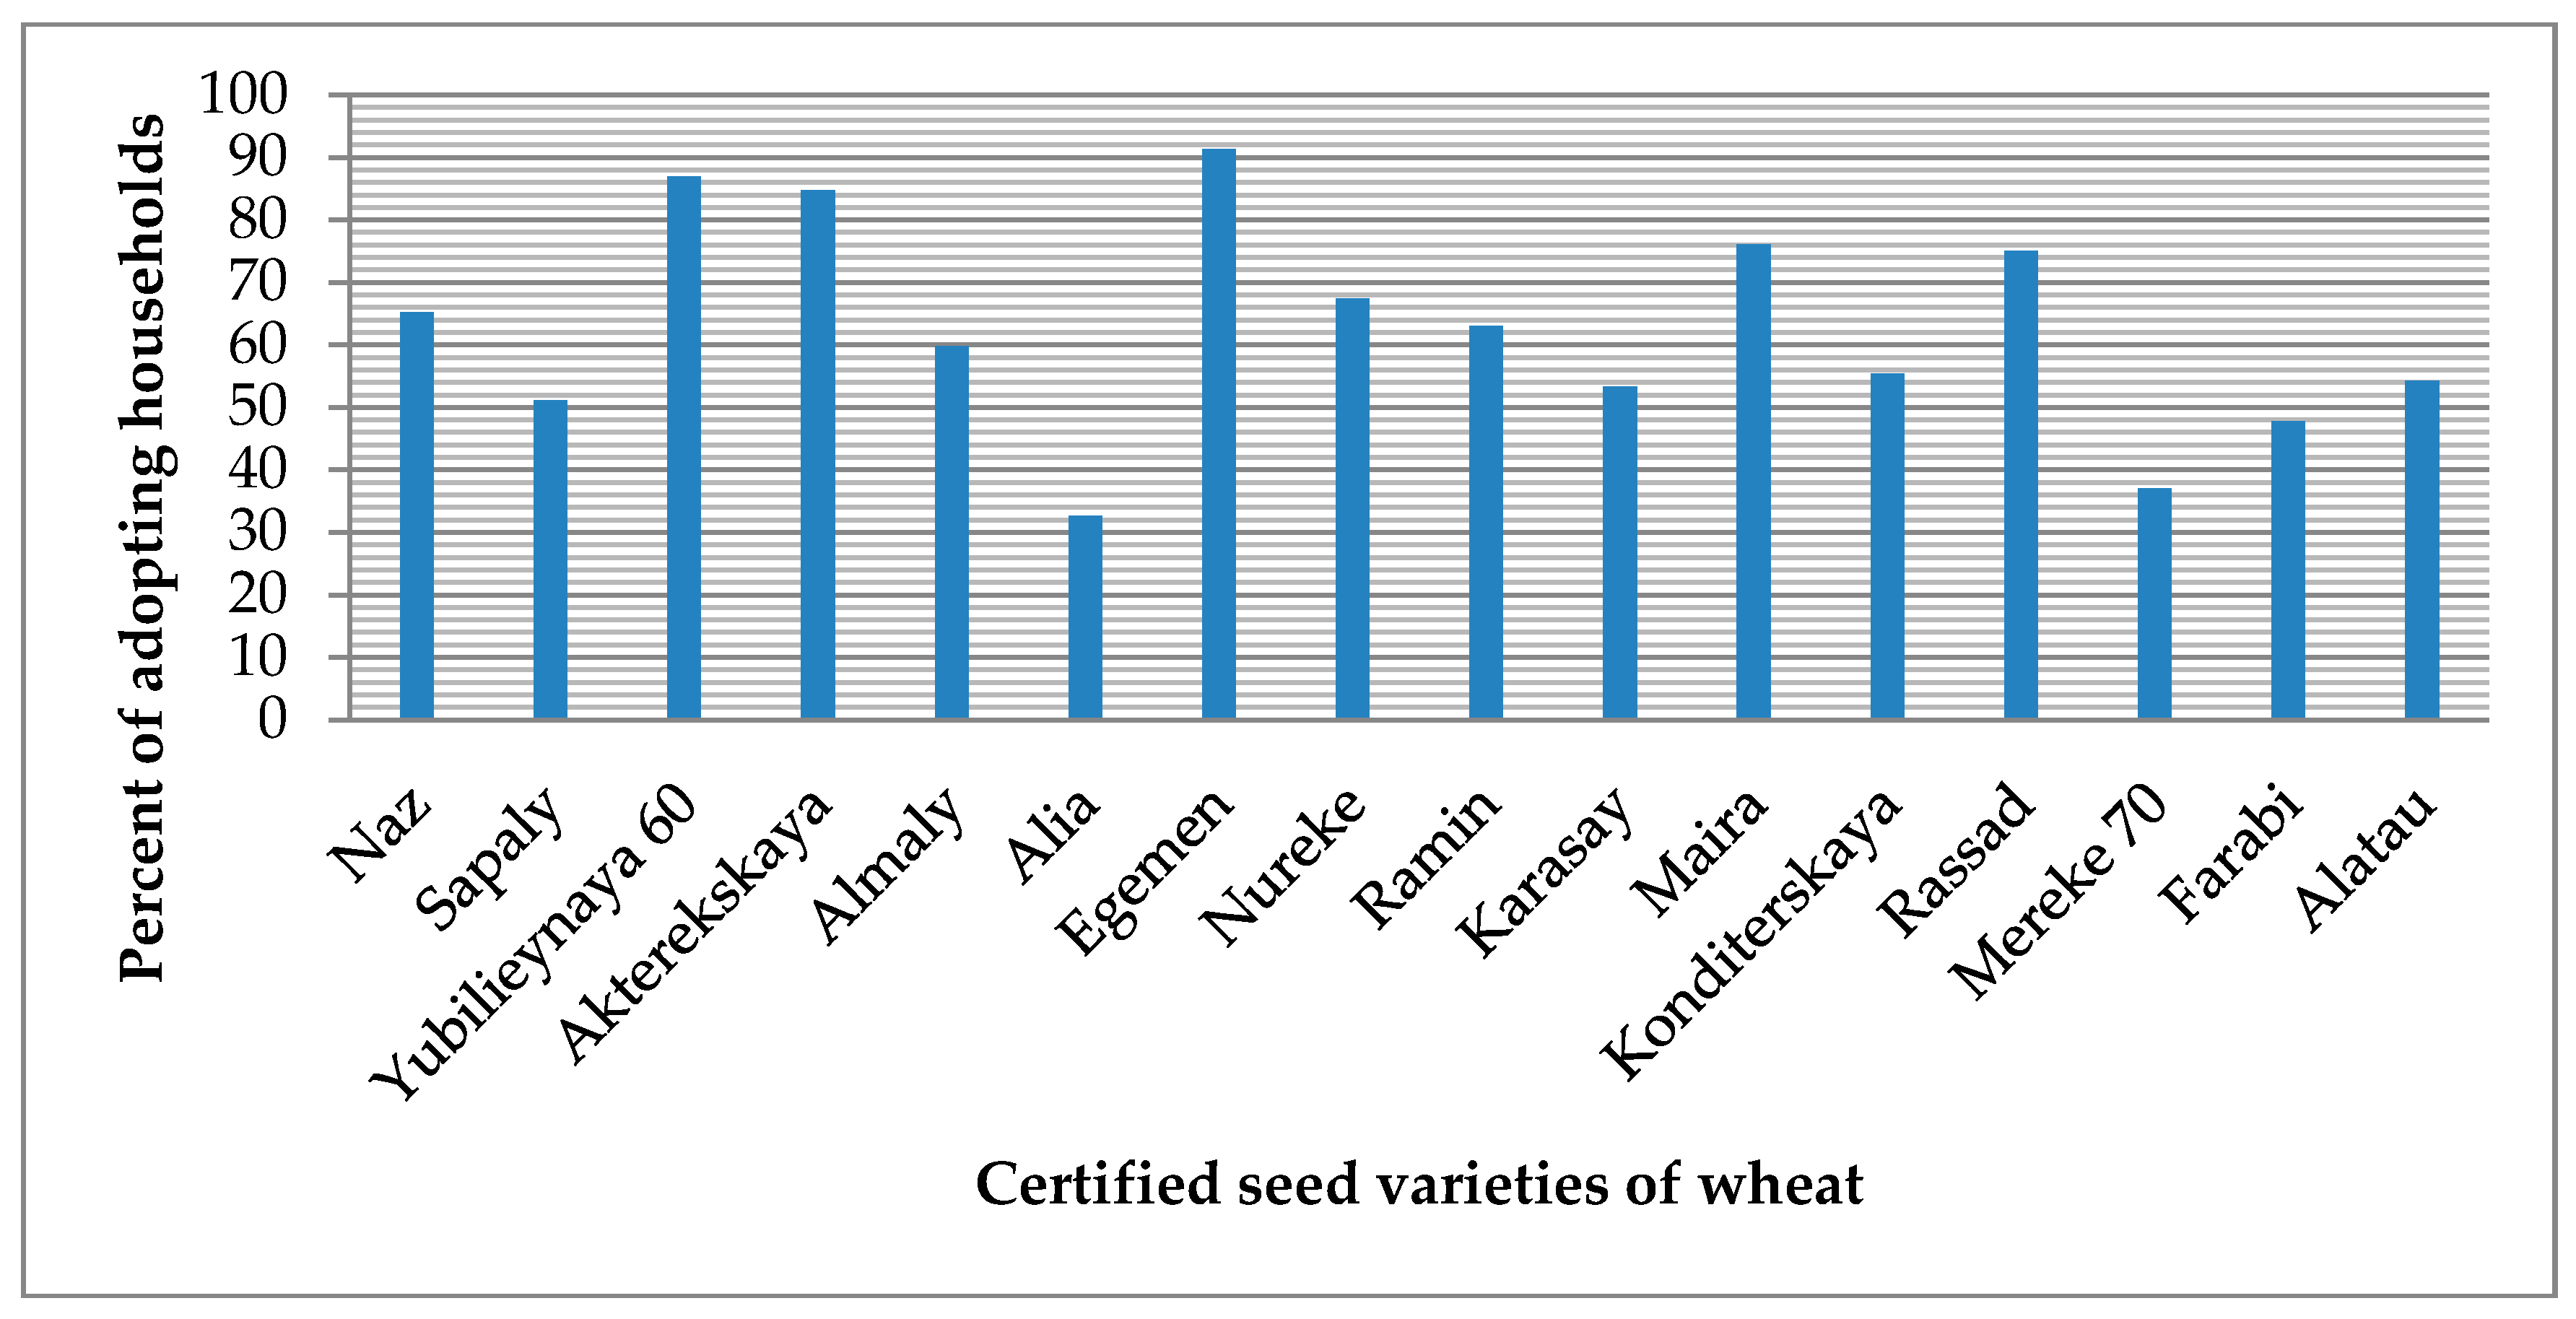
The data used in this study is from a household survey conducted in Kazakhstan’s northern region from April–June 2019. Given that more than 74% of the area is suitable for agricultural production, agriculture is one of the prime movers of the national economy. Various agricultural products like corn, rice, oats, cotton, potatoes, vegetables, sugar beets, and sunflowers are produced but wheat production is the most remarkable. Particularly, the study area produces wheat which accounts for about 80% of the country’s wheat production. Since the area is dominated by resource-poor smallholder farmers, wheat production is solely rain fed. Several certified wheat varieties have been released by the Red Fall Experimental Station since 2000 and the adoption intensity is shown in
Figure 2.
Using a multistage sampling approach, farmers were selected to constitute the sample for the study. In the first stage, three regions were conveniently selected. One of the key criteria for the selection of the regions was the degree (level) of adoption of certified seeds by wheat producers in the respective regions. The regions selected (Akmola, Kostanay and North Kazakhstan) have similar agro-ecologies and farming systems. In the second stage, the quota-sampling procedure was employed to choose three communities in each of the regions selected in stage one. Finally, 225 farmers were randomly selected using a farmers list (obtained from the ministry of agriculture in the locality) by choosing 25 households in each of the communities selected in the second stage. Tentatively, the sample was made up of 92 adopting and 133 non-adopting households. Luckily, all the enlisted farmers agreed to participate.
Regarding data collection, the questionnaire (structured and pretested) was the principal instrument and a household was the basic unit. To achieve rapid and truthful responses, participants remained anonymous and appointments were made at farmers’ convenience. Well-trained and experienced enumerators from the ministry of agriculture collected the data. To ensure that the instrument was substantially rich in content to warrant realistic and correct estimations, essential variables such as classical inputs, adoption status, and institutional, demographic and socioeconomic data were captured.
2.2. Key Variable Measurement
Certified seed adoption is the key explanatory variable. It was captured as a dummy variable where 1 was for adopters and 0 was otherwise. A household was considered an adopter if they utilized at least one type of certified wheat seed during the survey year. Other scholars [
21,
22,
23,
24] also measured adoption in this way.
For the output variable, technical efficiency (TE) of each wheat farmer was considered. The TE scores range between 0 and 1, where 1 was for a 100% efficient producer without any waste and 0 implied complete waste and no efficiency in production. Accordingly, any values in between exposes the level of efficiency and what was lost out or the potential-to-improve output. To calculate the technical efficiency scores, a stochastic frontier analysis was applied, and the details are contained in empirical strategy section. Intuitively, higher TE suggests that production is cleaner than those with lower TE scores.
2.3. Conceptual Framework
Consistent with the utility and production theory, the coherent adoption analysis views technology adoption within a conceptual framework that treats prospective adopters as agents who make decisions based on their maximum satisfaction. This is also true for the adoption of agricultural innovations such as certified seeds [
25,
26]. While the driving force in decision-making is optimization, there are some institutional and socioeconomic factors that influence the decision. Therefore, a household will choose to adopt certified seed if the utility (satisfaction) gained (cleaner production) from adopting is greater than that of not adopting this seed [
27,
28].
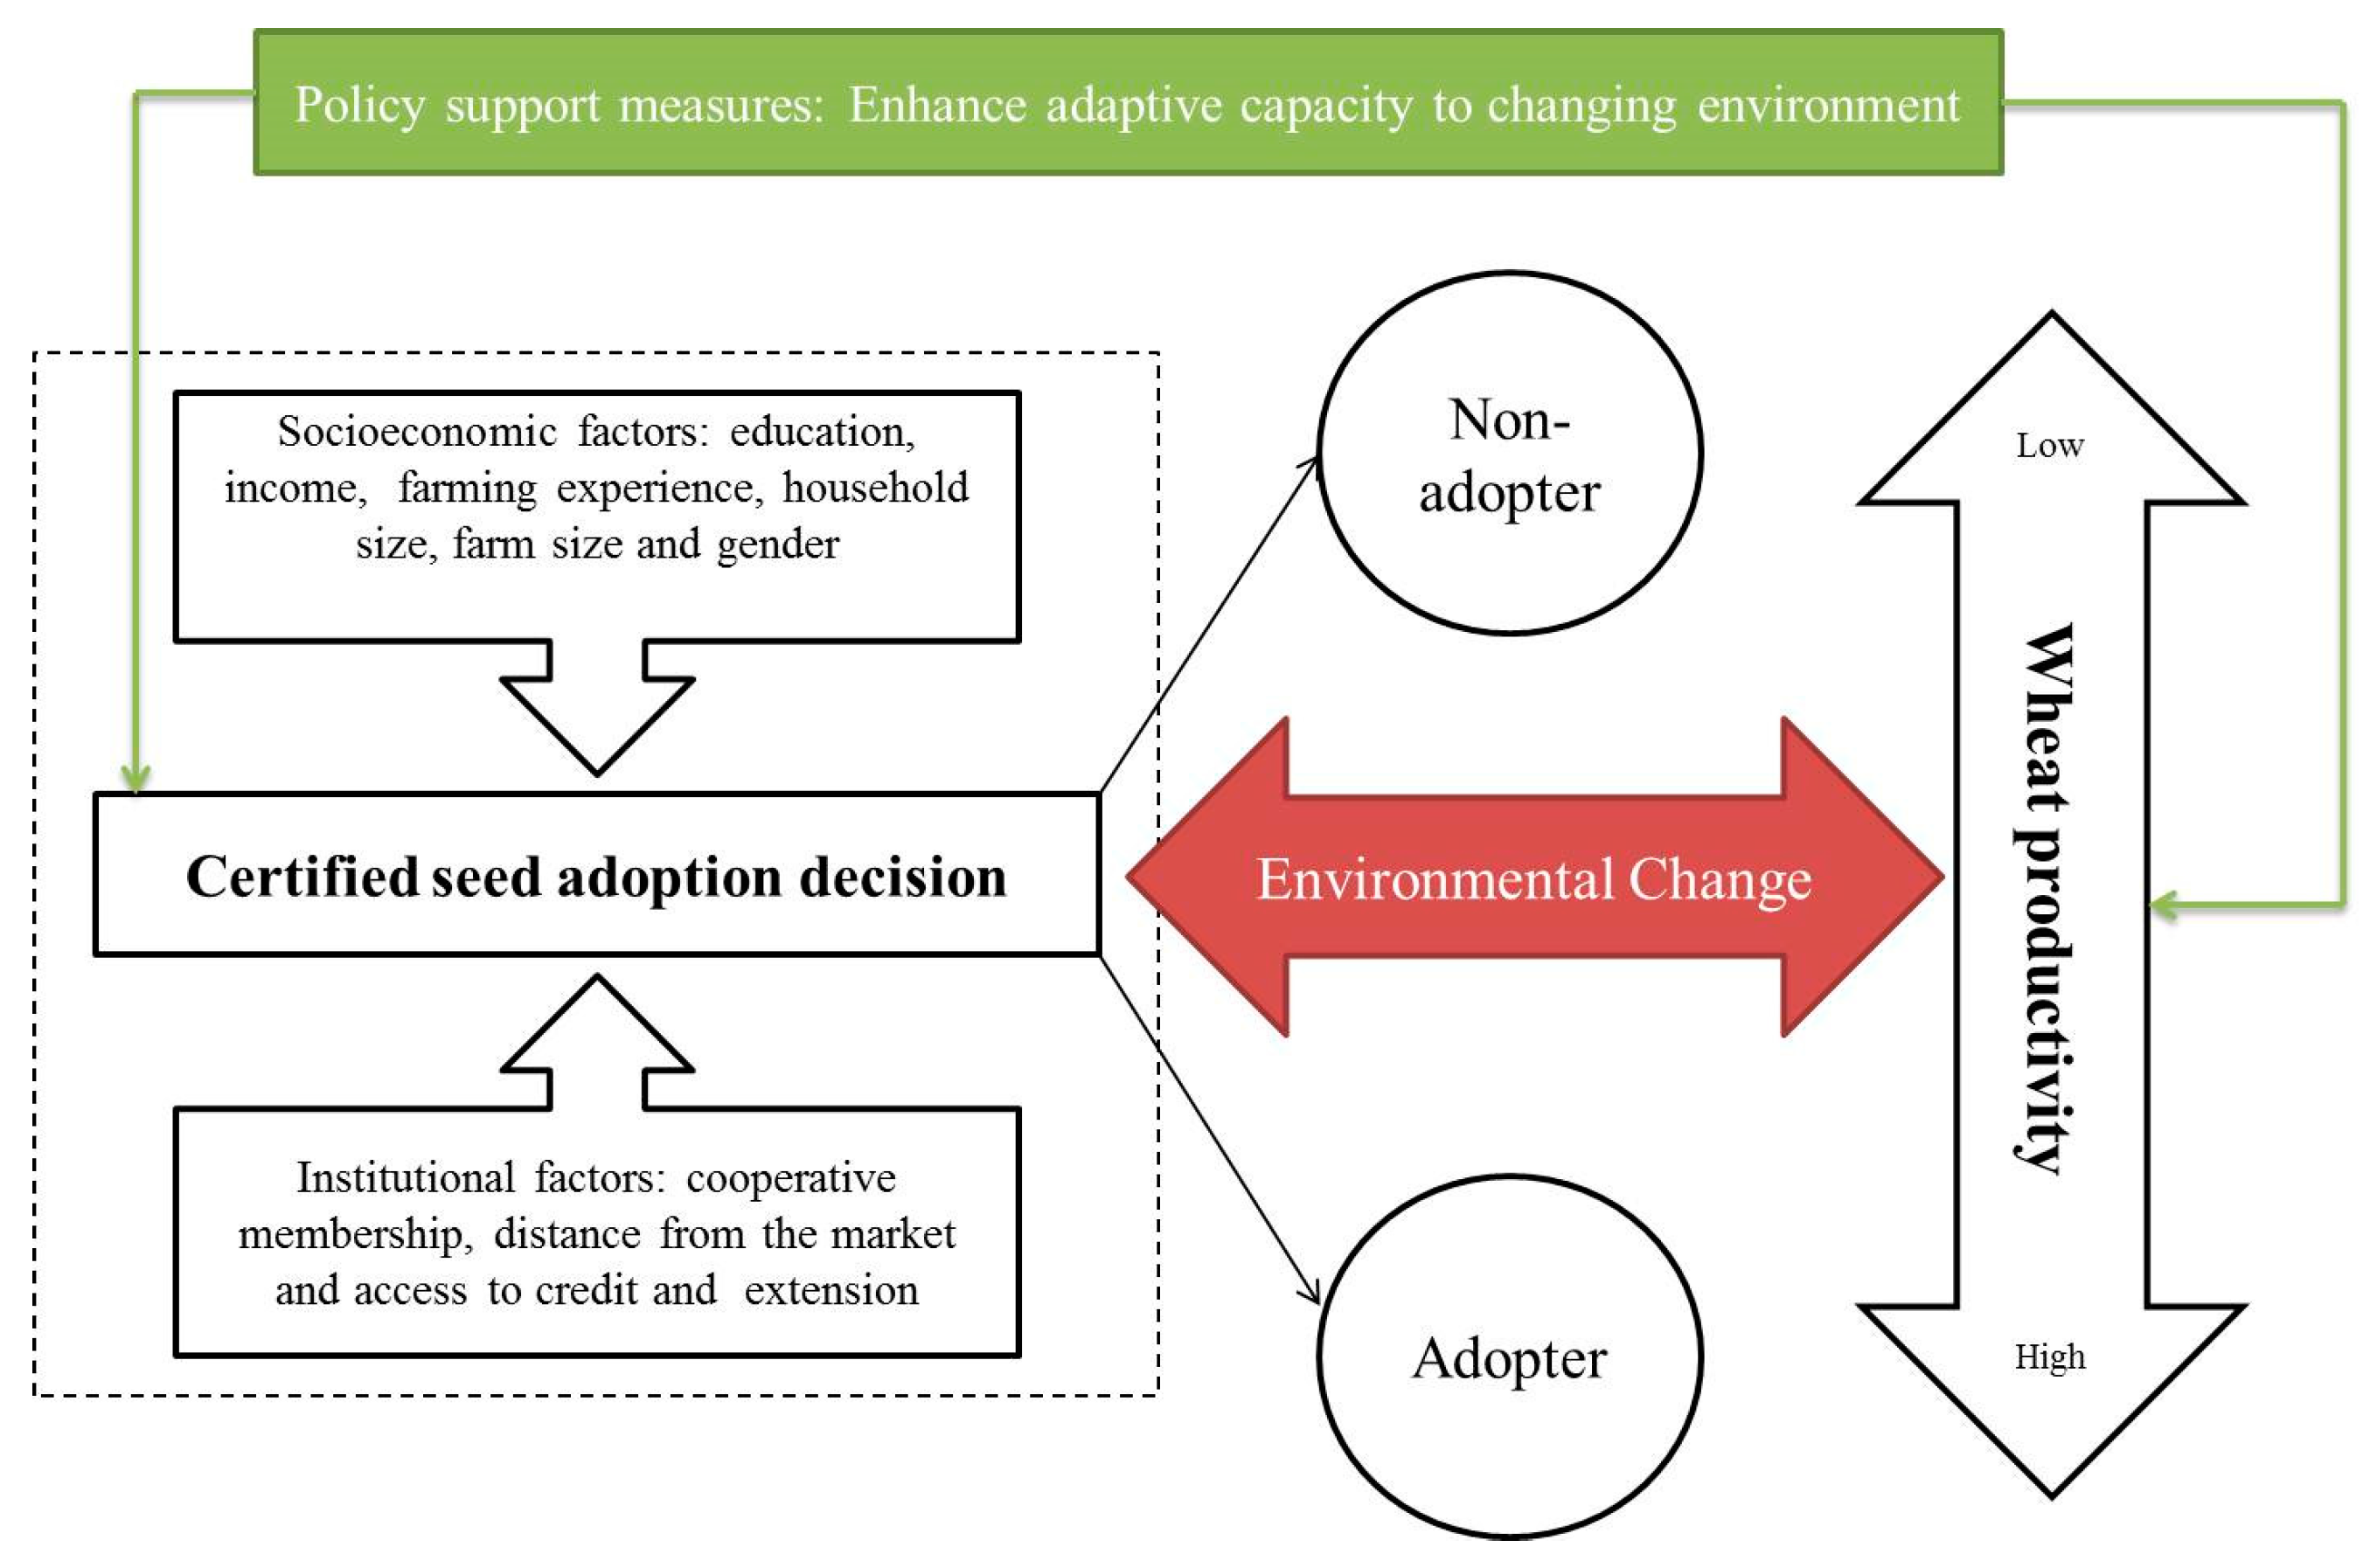
We also postulate that households make the adoption decision according to influences from the prevailing socioeconomics (gender, income, farming experience, household size and farm size) and institutional factors (access to credit, market and extension, and cooperative membership). In support, Rogers and Rogers [
29] contend that socioeconomic characteristics determine adoption decisions, which explains why some individuals adopt innovations earlier than others. Numerous studies have also examined the influence of socioeconomic variables on farmer decisions to adopt agricultural technologies. In addition, the relationship between institutional factors and farmer adoption has been repeatedly reported as positive by many authors. For example, a study conducted by Kansana et al. [
30] indicated that participation in training, access to communication sources and the number of information sources had positive associations with the level of knowledge and the adoption of improved wheat varieties. Similarly, Nkonya et al. [
31] reported that visits by extension agents had positive influences on improved maize yields and fertilizer use in Northern Tanzania. Therefore, the households maximize their utility through certified seed adoption decision, which is highly influenced by socioeconomics and institutional elements.
However, there are also other influences outside the farmer’s control such as environmental change and existing policy support measures. For instance, climate change, subsidy programs, changes in soil structure and prevalence of pests and diseases may not be under the farmers’ control yet are remarkable determinants of adoption. They directly influence productivity: they may or may not lead to some waste in production and may also affect efficiency. Given the incidence of adverse weather conditions coupled with low quality soil and the disadvantages or damage resulting from the use of uncertified seeds, non-adopting households are more susceptible to waste in production. Therefore, we hypothesize that farmers who adopt certified seeds have a cleaner production than their counterparts (
Figure 3). Ultimately, this choice could help to address food insecurity, poverty and hunger.
2.4. Econometric Framework and Estimation Strategy
Technical efficiency, one of the popular approaches of measuring productivity, is adopted in this study. However, there are two commonly used methods for measurement—Data Envelopment Analysis (DEA) and Stochastic Frontier Analysis (SFA). The distinctions are (i) while the SFA disintegrates the error term into the inefficiency term and statistical noise [
32], the DEA is a deterministic method that accredits the production frontier deviation to inefficiency; (ii) unlike SFA, DEA does not require any assumption for the underlying functional form of the production frontier. Mindful of the production reality of wheat production in Kazakhstan, the assessment of technical efficiency levels stemming from a DEA estimation would be inconsistent because a part of the deviations could be due to elements outside the farmers’ control, e.g., pests, weather, and plant diseases [
33]. Therefore, the SFA is preferred over the DEA for this study.
For SFA, different techniques are also applied. For example, Pitt and Lee [
34] and Kalirajan [
35] recommended a two-step approach. First, inefficiency is predicted after stochastic frontier estimation. Second, the predicted inefficiencies are used in a regression to determine the factors that influence the technical inefficiency. However, some issues have been raised in that the procedure is highly vulnerable to missing variable bias and the disadvantages of contradicting the distribution assumption of the inefficiency effects [
36,
37,
38]. In view of these considerations, Wang and Schmidt [
37] and Kumbhakar and Lovell [
32] have proposed using a maximum likelihood estimation (MLE), which is adopted in this study, and nonlinear least squares estima-tion (NLSE) approaches to estimate the stochastic frontier and the inefficiency model simultaneously.
A one-step SFA is applied to model the wheat farmer productivity by employing two techniques, conventional and sample-selection SPF. Using the sample-selection SPF, the association of certified seed adoption with technical efficiency and the determinants of certified seed adoption are estimated simultaneously.
2.4.1. Conventional SPF
The SFA is a parametric approach formulated by Aigner et al. [
39] on which efficiency measurements rest and is specified as follows:
where
is the output of the i-th farmer,
is a vector of the inputs,
β is a vector of parameters to be estimated, and
~N (0,
) and
~
),
] are the random error and the inefficiency term, respectively.
From Equation 1, Battese and Coelli [
36] indicate that the factors influencing technical efficiency can be estimated as follows:
Finally, TE is given by Equation 3
where
=
is the observed production with inefficiency and
=
) is the frontier output quantity with no inefficiency.
For robust model specification, we employed a likelihood ratio (LR) test, which is used to select the best model for the given data. after running the translog and Cobb Douglas (CD) as recommended by Belotti et al. [
40] and Kumbhakar et al. [
41], we found that the parameters of CD were appropriate and suitable in our case, as confirmed by the statistical insignificance (0.741) of the LR test. The general form of the LR test is specified as follows:
where
and
are the values of the likelihood function under the null and alternative hypotheses, respectively.
On the other hand, the CD function and its respective inefficiency function are given by:
where
is the wheat output,
is a vector of the four classical inputs (land, fertilizer, seeds, and labor),
,
,
,
and
are parameters to be estimated,
is a vector of other determinants of technical inefficiency other than certified seed adoption,
is a non-negative inefficiency component that follows a truncated-normal distribution and
is a random error following a normal distribution for the production function while
is a random error for the inefficiency model.
2.4.2. Sample-Selection SPF
While also used as a robustness check, the approach advanced by Bravo-Ureta et al. [
42] was applied to evaluate the factors influencing certified seed adoption as well as to re-estimate the stochastic production function. Unlike the conventional approach, sample-selection SPF circumvents the methodological weakness by addressing biases stemming from both unobserved and observed variables. Using this approach, we estimated the technical efficiency for adopters and non-adopters separately.
First, the adopters and non-adopters with observed comparable characteristics were matched using propensity score matching (PSM). This procedure helps to mitigate the bias emanating from the observed variables. In addition, according to Monteiro [
43], this action is a necessary condition to accurately measure the impact of the subject under scrutiny. Bearing in mind the benefits of the “1-to-1 nearest neighbor matching without replacement,” we adopted this procedure for the imposed region of common support because every adopter is matched with a non-adopter [
44]. The other advantage is that, unlike the other available alternatives, it is easy to implement and has the most intuitive interpretation [
45].
Second, we applied the model proposed by Greene [
46] to address biases from unobserved variables. Contrary to the model introduced by Heckman [
47], this model is internally consistent because it integrates selection bias into the stochastic frontier model. The model posits that the noise in the frontier is correlated with the unobserved characteristics in the selection model. Thus, the structure is as follows:
where
is a vector of exogenous origin for explaining the adoption of certified seed,
is the error term distributed as N (0,
), and
is a vector of parameters to be estimated. While
is the unobserved,
is observed through a dummy where 1 =user and 0 otherwise. On the other hand,
is the wheat output of the ith farmer while,
are the classical inputs used in wheat production.
is the vector of parameters to be estimated or the coefficients of the inputs, and
, where
~N (0,
) and
is a non-negative random factor that is assumed to be independently and identically distributed as a zero-truncated normal distribution
with
~N (0,1).
with
~N (0,1). Thus,
~
[(0,1),
where
captures the absence or presence of selectivity bias.
Given that the details of the model’s estimators are presented in Greene [
46] and Greene [
48], only the final log likelihood function is reported in this work. It is specified as:
The integral of Equation (8) does not exist in a closed form, so Greene [
46] proposes estimation by simulation. Where
, the model is reduced to a conventional stochastic function because the selection bias is absent. Thus, this approach addresses both endogeneity and selection bias.
3. Results and Discussion
3.1. Descriptive Statistics
The unconditional statistics for the unmatched and matched sample are presented in
Table 1. As already stated, adopters accounted for approximately 41 percent of the sample. We find significant mean differences between the groups in the unmatched sample.
Adopters were more educated, had higher incomes, greater credit and extension access, and resided closer to the markets than their counterparts. In view of the subject of adopting certified seeds, education was a key factor. Tadesse and Bahiigwa [
49] and Asfaw and Admassie [
50] posit that educational attainment is likely to facilitate technology adoption and cause farmers to be information-sensitive. When complemented with frequent extension contact, educated farmers are empowered to leverage the full benefits of a given technology. It was expected that adopters had a higher income and access to credit because certified seed adoption requires farmers to have a good source of income [
51,
52].
Distance from the markets was another difference between the two groups, and this factor displays the advantage of adopters. One plausible explanation is that prices may be cheaper near the market, leading to easier adoption for farmers closer to the market. However, adoption of certified seeds by the farmers is not only due to a presumably low price in nearby markets, but more importantly due to the farmers’ ability to access the seeds in such markets with ease and reduced transportation/transaction costs. In most cases, the price may not necessarily be very different in nearby and farther market centers. In addition, while farmers close to the markets may have access to off-farm employment opportunities (as risk countering avenues) and hence would not mind experimenting with the so-called certified seeds, majority of the farmers who live farther from the market centers may be extremely dependent on agriculture (probably, solely dependent on wheat production) and would prefer sticking to the traditional/uncertified seeds which may even be better suited to the local environment, without necessarily having to invest additional money into accessing certified seeds under an uncertain outcome. The other reason could be that being closer to the markets also increase farmers’ access to information, and this could consequently influence their adoption decision.
We also found that non-adopters were more experienced, had larger farm sizes and subscribed more frequently to cooperatives than their counterparts. Farming experience is very crucial for technology adoption because it enables the farmer to adequately filter the authenticity of the available technology [
53,
54]. However, Mwalupaso et al. [
55] noted that information access is desirable to facilitate better decisions using up-to-date information. Considering that cooperatives are information machines, they could help to inform farmers if the technology lies within their interest.
Regarding the production inputs, adopters have relatively smaller cultivated plots of land and thus may use less seeds than their counterparts. In view of this, ceteris paribus, if it is expensive to purchase certified seed, adoption would be costly and unlikely for non-adopting households. Interestingly, on the other hand, adopters use more fertilizer. This cannot be attributed to their adoption decision because fertilizer is meant to nourish the crop with the needed nutrients.
The discussed differences are likely to lead to the over or understatement of the estimation [
42]. Therefore, matching was performed to achieve an insignificant test of means (
Table 2).
The matching procedure paired 92 adopters with 92 non-adopters out of 133. Consistent with the guidance by Leuven and Sianesi [
56], we conducted t-tests before and after matching to gauge whether the means of the observed characteristics between the two groups were equal. This procedure indicates whether the bias was reduced.
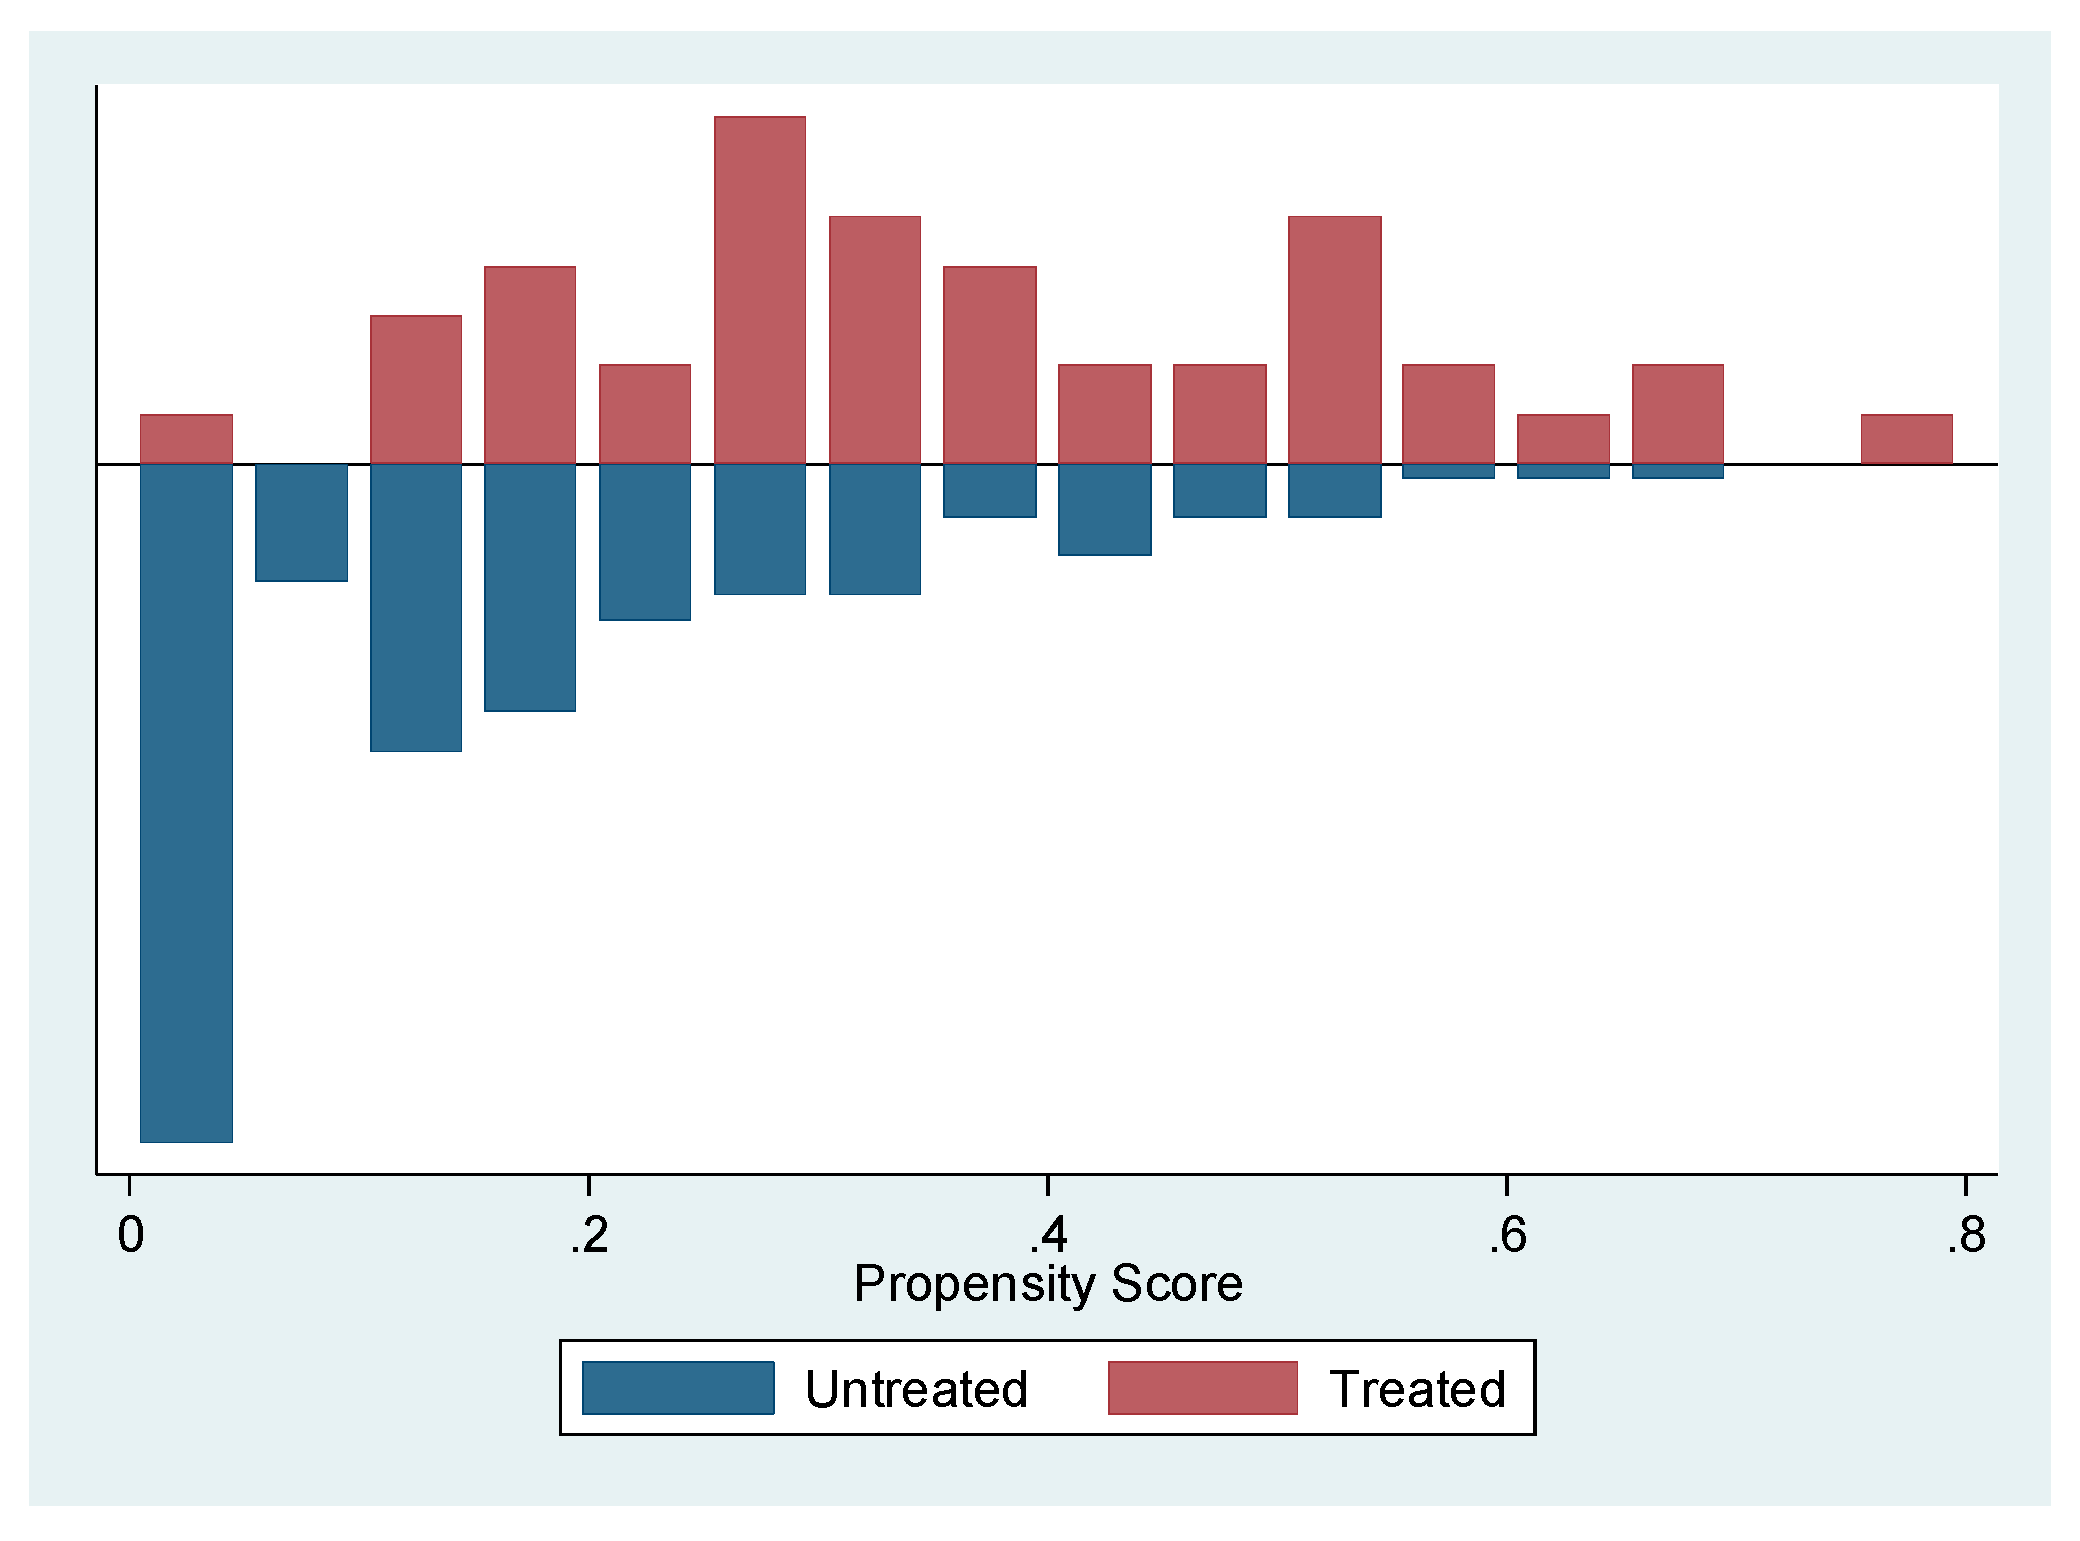
Table 2 reveals that the pseudo-R2 dropped endogeneity from 41% to approximately 2% before and after matching. The low mean standardized bias, low pseudo-R
2, and the insignificant p-values of the likelihood ratio test after matching suggest that the proposed specification of the propensity score is fairly successful [
57]. In addition,
Figure 4 shows that the balancing property of covariates is satisfied after matching.
3.2. Determinants of Certified Seed Adoption
Consistent with the empirical strategy, the result in
Table 3 is estimated simultaneously with the sample-selection model presented in
Table 4. Education, access to credit, income, cooperative, experience and distance from the market are significant determinants of certified seed adoption.
A year increase in the level of education of the household head increases the likelihood of adopting certified seeds. This finding is consonant with the discourse by Ogolla and Mugabe [
58], who conclude that farmers with higher education levels tend to have better farm resource use and are more likely to adopt new technology. Education empowers farmers because they are able to scrutinize information rather than making blind decisions. In addition, education equips farmers with some skill sets to maximize the benefits of the adopted technology [
59]. Therefore, education drives the farmer adoption decision.
Technology adoption is not a cheap venture in most cases [
22,
51]. It requires resources on the part of the farmers. Considering that most farmers are resource-poor, access to credit as well as increased income is likely to smooth adoption. Finances empower the farmers to relax about their choices regarding the best technology to adopt. Certified seed production is relatively costly for most farmers, especially when so many tests and procedures are performed and enormous sums of money are spent on research and development [
51]. The cost of the seeds will inhibit some farmers from adoption, even when they are well informed and convinced about the technology. Consistent with the aforesaid, access to credit and a dollar increase in income in a household increases the propensity of adopting certified seeds.
Membership in a cooperative is a source of information for farmers, and it is expected that farmers who are members access valuable information on certified seeds, leading to adoption. By contrast, household heads’ membership to cooperatives reduces the chances to adopt certified seed. In view of the revelation by Idiong [
60] that farmers who are members of a cooperative benefit from economies of scale, especially that they make input decisions as a group, it is logical to conclude that cooperatives prefer sticking to uncertified seeds. Thus, it is no surprise that membership would negatively influence the adoption decision as the perception is that uncertified seeds are better suited to the local environment.
Similarly, a year increase in farming experience of the household head reduces the propensity to adopt certified seeds. This is consistent with the finding of Mwalupaso, Korotoumou, Eshetie, Alavo and Xu [
1]. The fact is that farmers are easily accustomed to their normal way of doing things as they age, which makes it difficult to switch to newer technologies. Regarding seeds, farmers develop their own ways of storing the seeds that they perceive as being the best. Considering that the extension service is not effective, as seen from its insignificance in provoking adoption decisions, the experience of farmers becomes handy in making adoption decisions. Otherwise, contact with extension officers is expected to assist farmers in obtaining information and technical support on agricultural matters to improve their knowledge, skill and attitude.
Lastly, as the distance from the market increases by a kilometer, the probability of certified seed adoption is reduced. This trend is attributed to the fact that farmers who are close to markets have free information flow [
49,
61], can easily raise their income through sales of produce and participation in off-farm activities [
49] and that the cost of certified seed is relatively cheaper. With such a comparative advantage over farmers who live farther away from the market, certified seed adoption is more likely dependent on farmer proximity to the market.
3.3. Adoption of Certified Seed and Cleaner Production
The empirical results of the SFA estimated by maximum-likelihood for the conventional and sample-selection SPF are presented in
Table 4. The overall fitness of the model is guaranteed by the model specification tests already established. Majority of the classical inputs positively contribute to wheat outputs in both the conventional and sample-selection SPF models. Seed is a major driver for adopters in both SPFs, followed by land, which is the most important production factor for non-adopters.
Unlike the sample-selection SPF, the conventional SPF also models factors influencing the technical inefficiency (waste reduction and efficiency gains). The intuition is that there is a maximum obtainable output from a given set of inputs and production technology. In an event that it is achieved, there is no waste in production and the value of technical efficiency is 1. However, this is not usually the case. Due to the adoption of various agricultural innovations such as certified seed, the obtained output is habitually not the same for adopters and non-adopters. For the group that has technical efficiency closer to 1 than its counterpart, their production has a higher efficiency and less waste (output that could have been achieved). Thus, we would assert that such production approach is “cleaner.”
We find that given a fixed set of agricultural inputs, adopters produce wheat output closer to the maximum output than their counterparts [
62]. This result is plausible considering that the aim of seed certification is to maintain as well as make available superior quality and genetically pure seeds. Certified seeds are not only of good quality (i.e., free from damage or immature seeds and diseases) but also high in germination and vigor as well as genetic purity. Considering the 41% (92 adopters/ 225 wheat farmers) adoption rate, the obtained result is validated. In addition, Bernard et al. [
63] hypothesize that adopters of certified seed are likely to achieve higher yields (10–30%) than their counterparts because they are using higher quality seeds. The belief by adherents of certified seed adoption is that only seeds treated and processed at registered facilities meet the prerequisites required for a bountiful and healthy crop. The underlying reason is that the certified seeds are considerably higher than the seeds stored by farmers from their own production, especially in reference to the seed quality and uniformity of seed size. Certified seed adoption facilitates comparatively higher yields [
64] and this is confirmed from the average treatment effect of the treated (ATT) result (
Appendix A;
Table A1). This finding indicates that adopters produce 1661.7 kg/ha more than their counterparts. Therefore, adopting households produce more output which is necessary for household food security and poverty reduction.
Regarding other determinants, education attainment, gender, access to credit and family size are significant. Gender significantly influences technical efficiency. Particularly, we find that male-headed households are more efficient than female-headed households. This is due to the challenges in access to information and resources mainly experienced by female wheat farmers.
Our finding that higher levels of education improves technical efficiency is in agreement with that of Hyuha et al. [
65]. This is true because education expedites learning and eases the adoption of new technologies by advancing access to information and endorsing forward-looking attitudes [
66]. Similarly, larger families have more equitable labor distribution leading to technical efficiency improvement.
On credit access, farmers are empowered financially and this provides the means for them to opportunely procure inputs for wheat production. While the size of the available credit is what is very critical as contended by Feder et al. [
67], the general view is that access to credit reduces capital constraints of farmers and this facilitates technical efficiency improvements.
To understand the technical efficiency levels across groups to a satisfactory extent,
Table 5 presents the distribution. The efficiency scores lower than 80% under the sample-selection SPF is 34.15% for adopters, 63.42% for non-adopters and 48.79% for the pooled group. On the other hand, 65.86%, 36.58% and 51.22% for adopters, non-adopters and pooled are above 80% efficiency, respectively. While the adopters appear to be better off, the TE scores for both the adopters and non-adopters appear to be at least 80%. However, the finding suggests that more adopting households than non-adopting households are efficient and produce less waste in production. For instance, 29.27% (63.42–34.15%) more non-adopters than adopters produce less than 80% (which implies 20% waste in production) while 29.28% (65.86–36.58%) more adopters are above 80% than their counterparts. The implication is that there is comparatively less waste and more efficiency in production for adopting households that those that do not. This is plausible, given that the government is involved in the registration and monitoring of registered seed certification outlets.
T-tests relating to the technical efficiency levels and certified seed adoption were performed and the results are presented in
Table 6. A positive association is also detected. Notably, the mean TE of the adopters in the sample-selection SPF is significantly higher than that of non-adopters at a 1% significance level, while the difference is insignificant in the conventional SPF. The difference in the results is due to the correction of biases from observed and unobserved variables, which are incorporated into the sample-selection model. Since the conventional approach uses variables that are not comparable, the estimates are exaggerated by 10 percent, as can be observed from the differentials in
Table 6. This finding is consistent with Mwalupaso, Wang, Rahman, Alavo and Tian [
61], who only applied part of the sample-selection model.
In addition, the selectivity variable is statistically significant for adopters (please refer to the bottom of
Table 4), implying that the estimates from the conventional SPF are biased while at the same time justifying the use of the sample-selection SPF. Despite the selectivity variable being insignificant for non-adopters, the conventional SPF results are still inconsistent and biased as already explained.
Finally, based on the TE mean from the sample-selection SPF in
Table 6, with the current level of inputs, there is a potential to increase wheat production by 14% for non-adopters. Since the groups are matched, the difference in the mean TE is attributable to adoption. Therefore, with the same set of inputs, adopting households produce relatively less waste (1 minus 0.819 as compared to 1 minus 0.716) and also have higher efficiency than their counterparts. This suggests that certified seed adopters are “cleaner” (more efficient and produce less waste) in wheat production.
4. Conclusions and Policy Recommendations
Augmenting technical efficiency of food production is a critical developmental agenda in both developed and developing countries. Given the burgeoning population and rising incomes, ensuring food security through reduction of waste in production has become one of the major national priorities, particularly in Kazakhstan, a young developing nation with massive potential. However, despite being among the top global producers of wheat, its production in recent times is highly volatile. Thus, the adoption of certified seeds is strongly advocated by the government, but there is limited empirical evidence whether espousal improves technical efficiency of wheat production. Therefore, this study fills this gap by providing evidence on the factors that influence certified wheat seed adoption and whether espousal is associated with “cleaner production.”
We find strong evidence that certified seed adoption is significantly associated with cleaner production. In particular, adopters are 10.3% more efficient than non-adopters. The gap is a result of adoption of certified seed, which unlike uncertified seed, is free from infection with insects and diseases. Therefore, to increase the propensity of certified seed adoption by wheat farmers, we highly recommend policy directed at educational improvement, facilitating easy access to credit and the empowerment of farmers in a way that raises their income as basic requirements. These measures will culminate in cleaner production that will be a triple win: farmers will gain higher yields and income, the government will increase revenue from exports, and seed producing outlets will derive profits for more research and development.
Finally, to contribute further to the cleaner production literature, the present study has important implications for future research; the use of panel data in certified seed investigation could better explain the effects of the innovation over time. Evaluating the extent of the impact of uncontrollable factors (including weather conditions) on the adoption of certified seeds and on the efficiency of wheat production will remarkably enrich the discussion on the attainment of cleaner production in a changing local environment.


