1. Introduction
Water is the basic material condition related to the survival and social development of mankind, is a limited and irreplaceable valuable resource, and is also an important guarantee to realize the sustainable development of economy and society. While the world’s economy has rapidly grown and great achievements have been made in various fields of construction, great resource and environmental costs have been paid. Water pollution is one such cost, which makes the already severe shortage of freshwater resources more insufficient. Combined with the unreasonable use of water, the world is facing a water crisis. These water problems are threatening the survival and development of mankind. Therefore, only by insisting on sustainable development and saving water resources can we make the economy develop well and quickly. Since the 18th National Congress of the Communist Party of China, General Secretary Xi Jinping has conducted on-site inspections of various tasks in the Yellow River Basin. In September 2019, at the symposium on ecological protection and high-quality development in the Yellow River Basin, General Secretary Xi Jinping put forward the main goals and tasks of ecological protection and high-quality development in the Yellow River Basin. One of them is to vigorously promote agricultural water saving.
Drip irrigation technology has become one of the most widely used modern high-efficiency water-saving irrigation technologies due to its precision and controllability [
1,
2]. The emitter is the core component of a drip irrigation system. It can be easily clogged by particles, chemical precipitation, dissolved salts, dissolved organic matter, microorganisms, and other impurities in the water due to its narrow flow channel (0.5–1.2 mm) [
3,
4,
5]. Emitter clogging can lead to reduced irrigation uniformity of the drip irrigation system and even destroy the entire drip irrigation system. Emitter clogging has become an international problem in the field of drip irrigation [
6,
7,
8]. This problem is especially prominent in drip irrigation systems applying water from the Yellow River. The Yellow River is famous for its high sediment content. The average annual sediment content in the main stream is as high as 35 kg/m
3 [
9]. In addition, with the rapid social and economic development of the Yellow River Basin in recent years, sewage discharge has increased and water pollution has become increasingly serious. Under such complicated water quality conditions, the sediment particles of the Yellow River will also have a series of microdynamic behaviors with the microorganisms, nutrients, and organic pollutants, which results in the Yellow River sediments mainly existing in the form of microbial flocs or attached by a layer of biofilm (consisting of solid particles, microorganisms, and viscous polymers secreted by them) [
10,
11,
12]. These Yellow River sediments undoubtedly make the clogging process of the emitter more complex. The clogging process is significantly different from the simple physical blockage that many scholars recognize under normal circumstances. A large number of scholars have improved the emitter clogging problem by various methods such as a reasonable configuration of filters [
13,
14,
15] or chemical addition of acid and chlorine [
16,
17,
18]. However, the emitter clogging problem has not yet been effectively solved. Some of the main reasons are that the clogging mechanism is unknown, and the self-clogging resistance ability is also not high. Under the complex water quality condition, the core and key of solving the clogging problem is to ensure the movement characteristics of the clear water flow and particulate matter in the flow path of the emitter [
19,
20].
The computational fluid dynamics (CFD) method has become one of the main means to visualize the internal flow of irrigation devices. This is mainly due to its functions of internal flow prediction, numerical experiment, flow diagnosis, and the advantages that designers can easily evaluate and select multiple design solutions in the fastest and most economical way, and this method can greatly reduce the workload of physical experiments and testing [
21,
22]. Although some experts and scholars have studied the selection of suitable CFD simulation turbulence models and obtained some meaningful research results [
23,
24], it is rare to report about the selection of the model considering the macrohydraulic characteristics and microflow characteristics in the flow path of the emitter based on the typical solid–liquid two-phase complex turbulent motion.
Based on this, this study first determined the optimal turbulence model of the flow field in the flow path of the emitter by comparing the macrohydraulic characteristics and microfluid motion characteristics of the fluid in the flow path of the emitter. On this basis, the water flow movement characteristics and particulate matter transport characteristics in the flow path of emitter were calculated and analyzed, which provides a theoretical basis for solving the problem of the emitter clogging in the drip irrigation system applying water from the Yellow River.
2. Materials and Methods
2.1. Emitter Selection
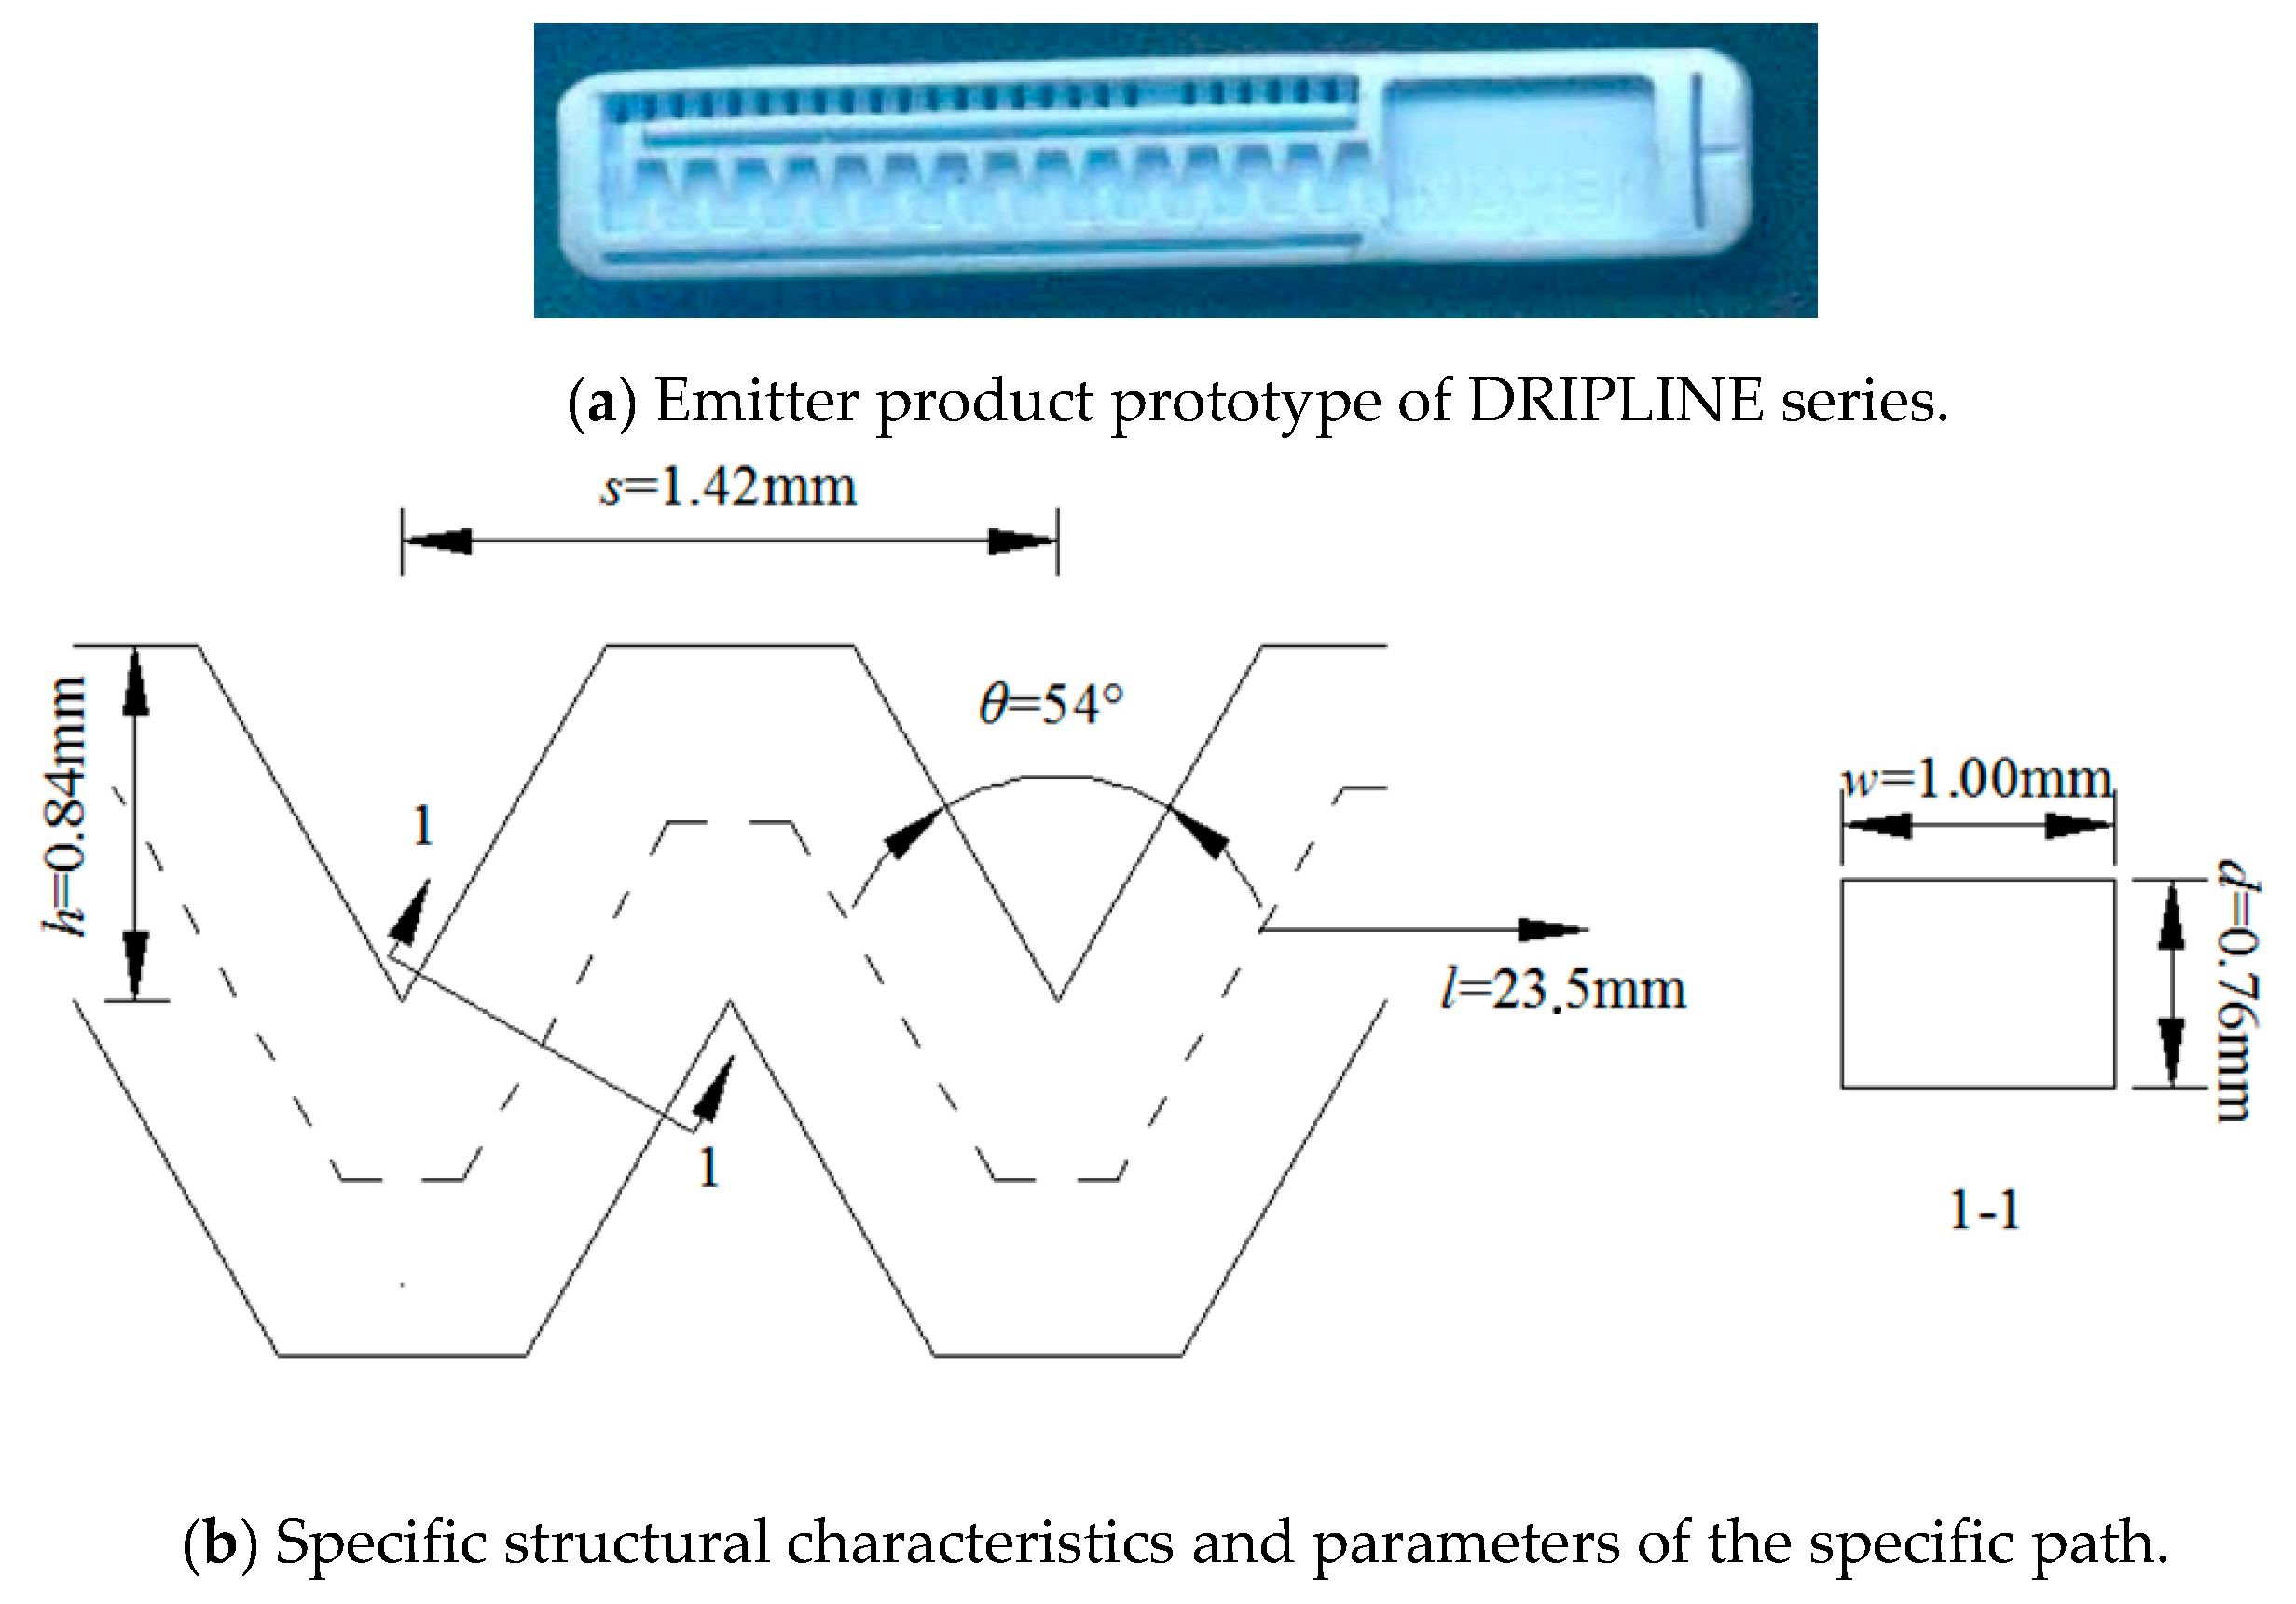
The laminar emitter of the DRIPLINE series from Netafim Company in Israel, which is recognized as one of the best companies in the field of drip irrigation at home and abroad, was selected as the physical prototype. Its rated flow is 1.38 L/h. The laminar emitter mainly includes inlet, flow path, and outlet, shown in
Figure 1a. The flow path consists of a sawtooth unit shown in
Figure 1b, including tooth heel and tooth tip. The size of the flow path is obtained by the high-precision CT scanning technique. The measurement accuracy was 0.001 mm. The specific structural characteristics and parameters of the path are shown in
Figure 1b.
2.2. Calibration Method of the Optimal Simulation Model by CFD
Large eddy simulation model (LES) and Reynolds-averaged Naiver–Stokes equations (RANS) (including standard k-ε model and Re- normalization group (RNG)
k-ε model) were selected for comparative analysis due to the relatively widely application in non-direct numerical simulation. The accuracies of different turbulence models for overall calculation were verified by flow–pressure relationship curves from a macroscopic point of view. And the accuracies of different turbulence models for calculating the fine motion characteristics of the internal fluid in the structural units of the flow path were verified by the results obtained with the digital particle image velocimetry (DPIV) technique from a microscopic point of view [
25].
The hydraulic performance curve of the emitter was obtained by the experiment according to the requirements of “technical specification and test method of agricultural irrigation equipment emitter (GB/T17187–1997)” [
26]. The flow state index and flow coefficient were calculated by the least square method based on changing the flow–pressure relation formula into a linear relation curve by logarithm, and it was used as a regression equation [
27].
2.3. Method for Simulation and Analysis of the Internal Flow of the Emitter
2.3.1. Physical Model Establishment and Meshing
A high-precision CT (Computed Tomography) scanning technique was used to accurately test the geometric parameters of the physical prototype of the emitter, and the three-dimensional mapping software UGS NX10.0 was used to establish a three-dimensional physical model of the flow path of the emitter. Meshing is the basis of numerical simulation. The quality of the mesh has an important impact on the accuracy and speed of the numerical simulation. In this study, ANSYS ICEM was used to mesh. The physical model was meshed by a hexahedral mesh with good quality and simple data structure. The near-wall surface and the corner of the tooth tip were encrypted to more accurately simulate the flow characteristics in the dramatic changes of the fluid motion region.
2.3.2. Solving Method and Boundary Conditions
The finite volume method was adopted to separate the governing equations in the numerical simulation, and the second-order upwind was adopted to separate the parameters such as the convection terms. The coupling of speed and pressure was solved by the SIMPLE (Semi-Implicit Method for Pressure Linked Equations) algorithm. For the turbulence model, the RNG k-ε two-equation turbulence model was selected after a comparative analysis of the flow change law with pressure and the velocity distribution inside the emitter measured by DPIV (Digital Particle Image Velocimetry) and simulated by the standard k-ε model, RNG k-ε model, and LES model. In the flow field calculation, the initial conditions are that the inlet of the emitter was set as a pressure inlet with 0.1 MPa and the outlet was set as a pressure outlet with 0 MPa. Except for the inlet and outlet of the calculation domain, all other fluid and solid surfaces were wall-type boundaries and set to non-slip boundaries. Standard wall functions were used to solve the near-wall flow. The multiphase flow model of standard Euler–Lagrange model was used to simulate particle motion. The sediment density was set to 2500 kg/m3, the volume fraction was 0.03, and the particle size was 100 μm.
2.3.3. Convergence Judgment and Postprocessing
The flow of the outlet and the residual value were used to judge the convergence. When the flow of the outlet was basically stable and the residual value was less than 10−5, the iteration was considered to converge. Tecplot 360 2011 was used for postprocessing the data.
2.3.4. Analysis Method of the Motion Characteristics of Water Flow and Particles
The pressure field, velocity field, and turbulence intensity distribution characteristics of the water flow in the emitter were mainly analyzed, and the particle motion of the full field, the velocity of the characteristic section, and the sand volume distribution were also analyzed.
3. Results
3.1. Optimal Simulation Model Calibration of CFD
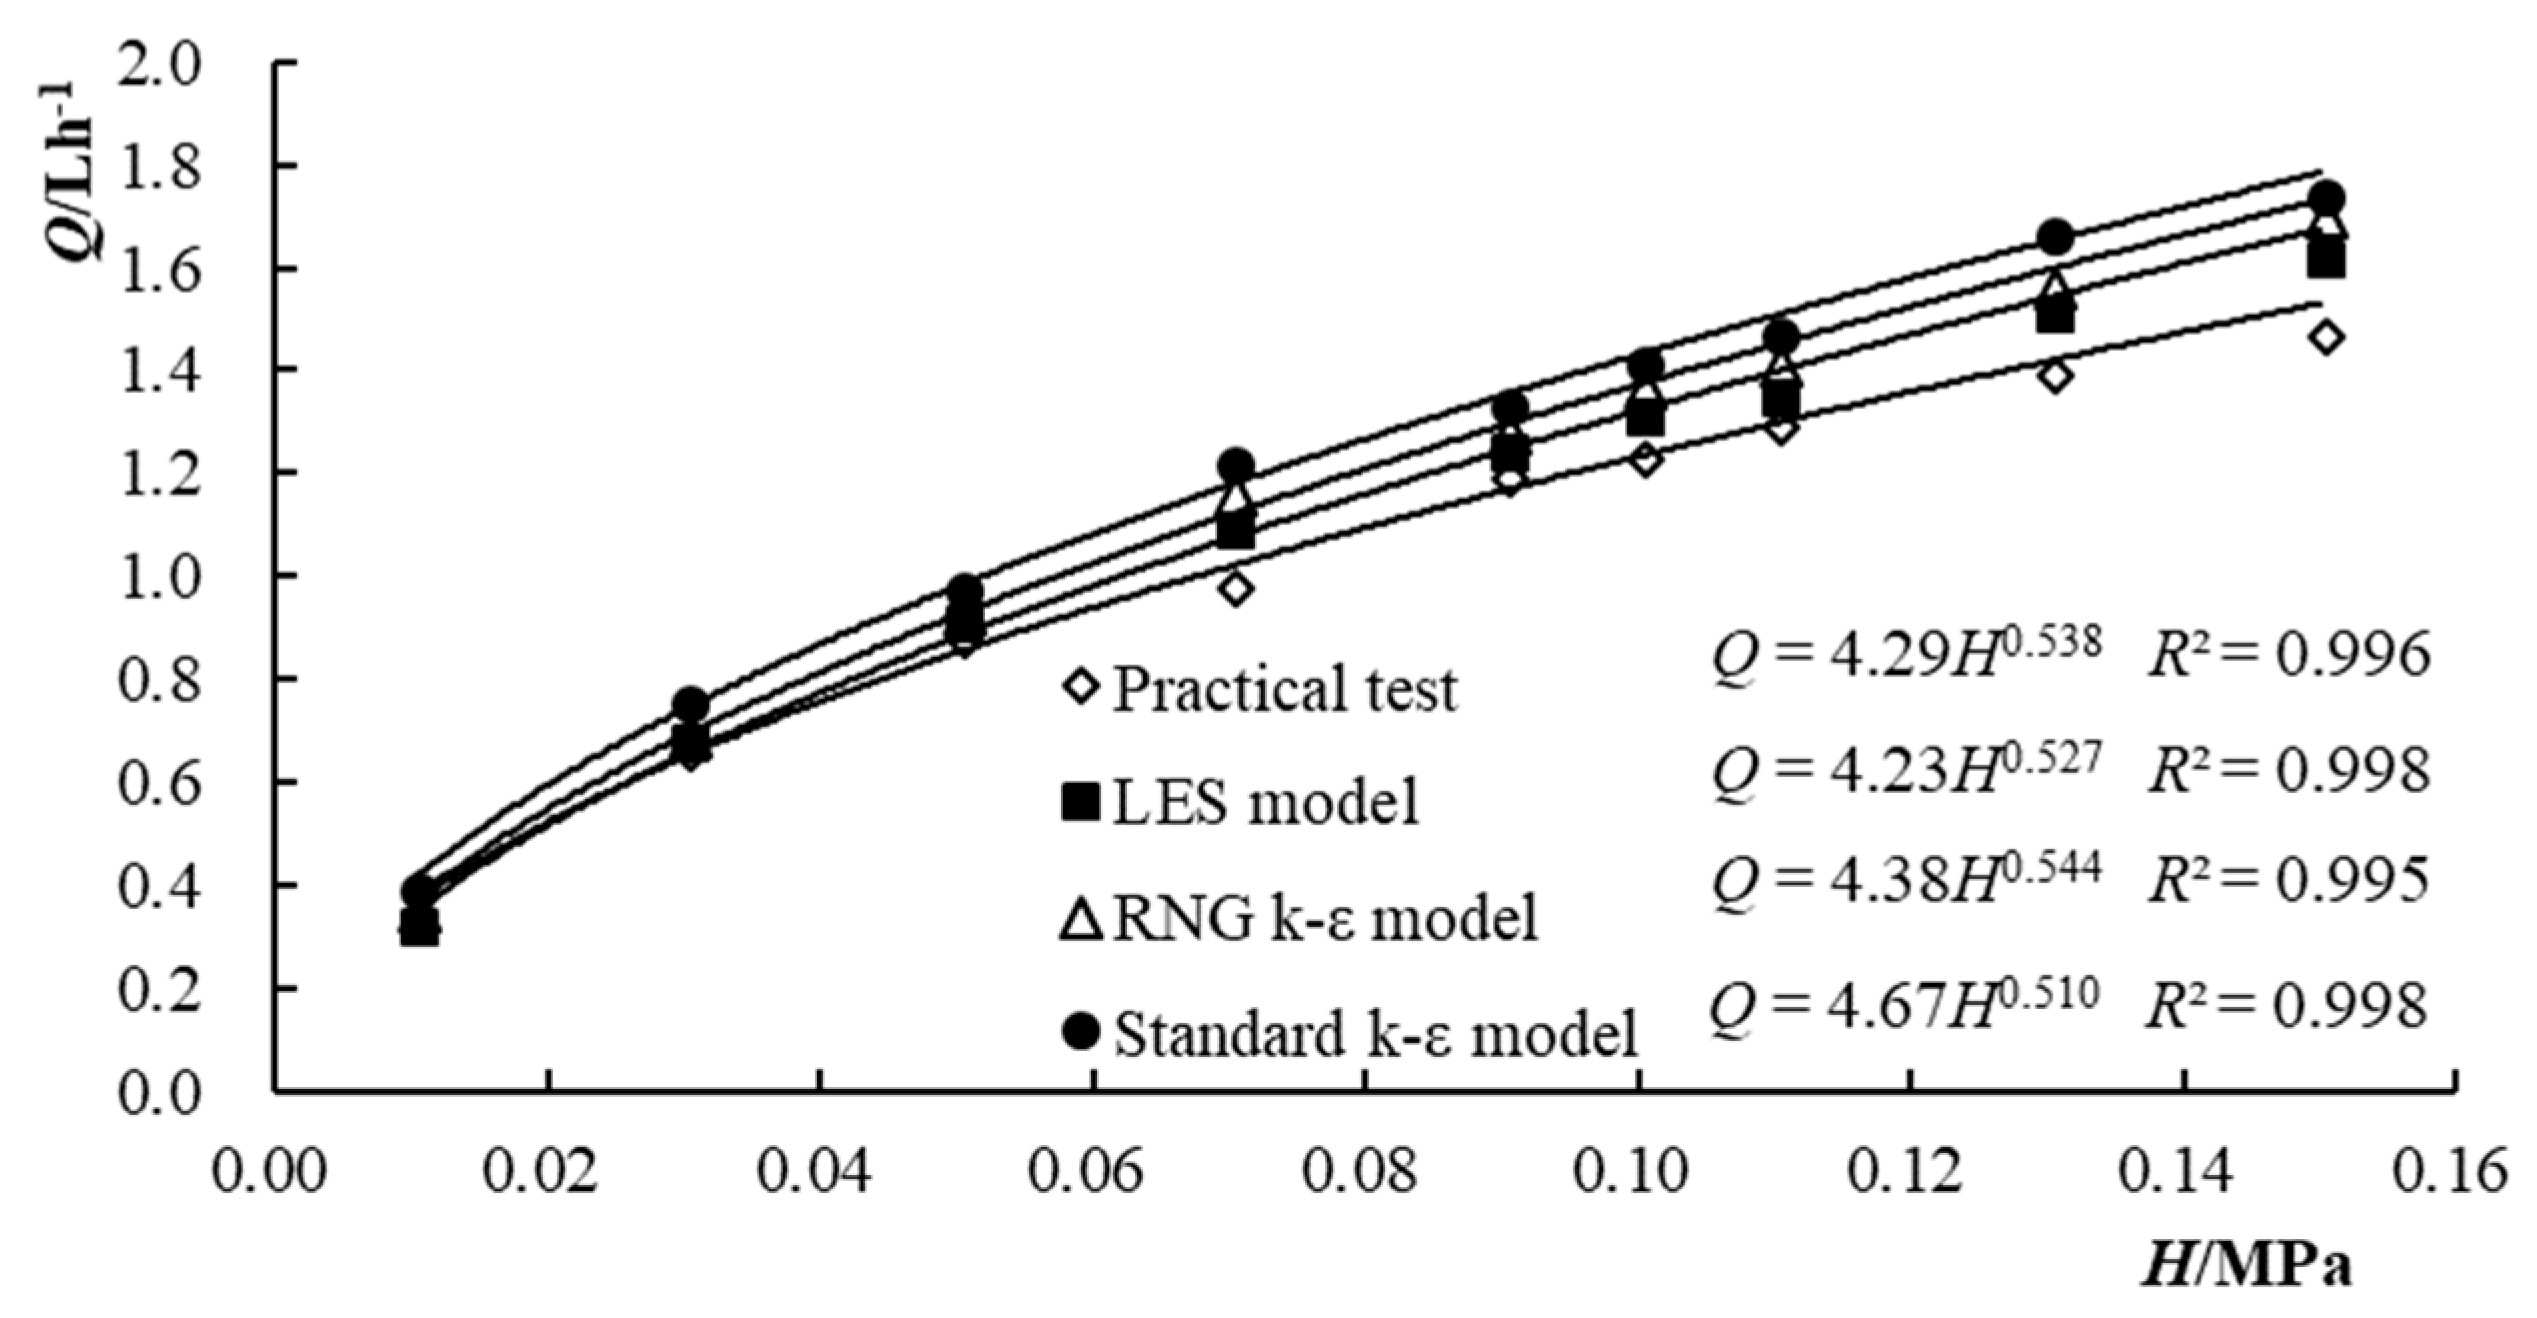
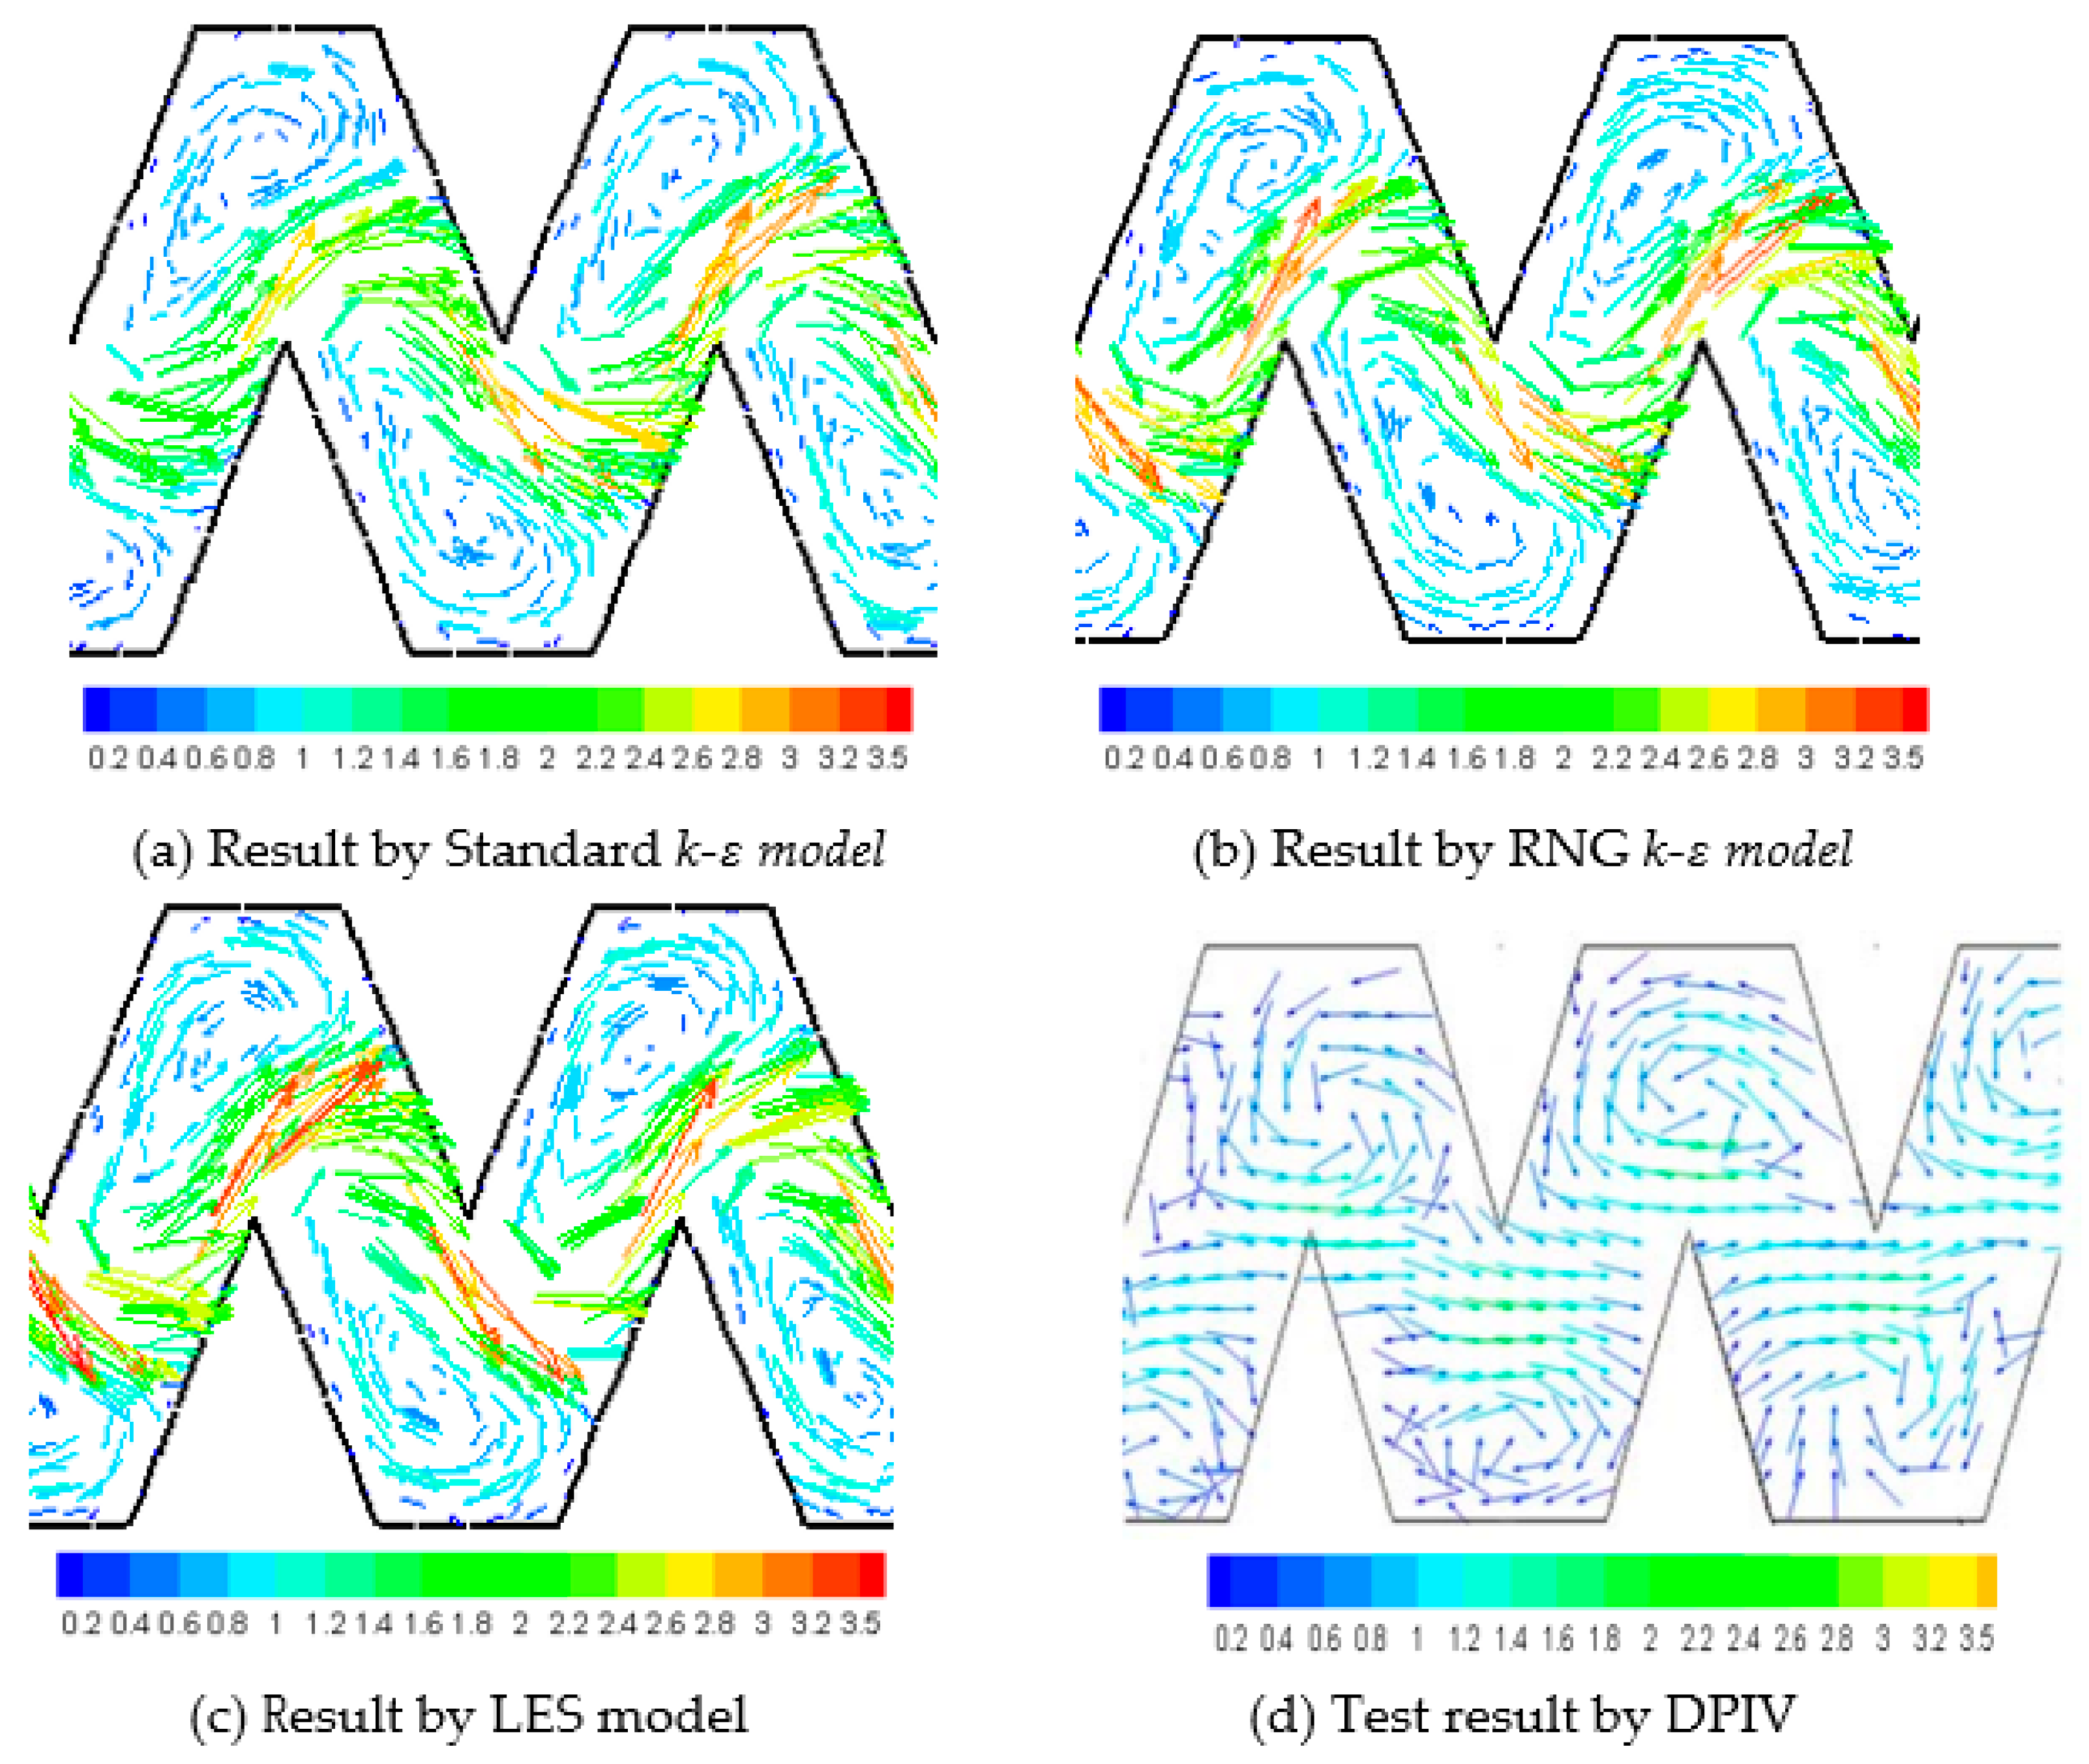
The flow change law with pressure and the velocity distribution inside the emitter are shown in
Figure 2 and
Figure 3 measured by DPIV and simulated by the standard k-ε model, RNG k-ε model, and LES model. Compared with the measured values, the flow coefficient errors simulated by the standard k-ε model, RNG k-ε model, and LES model were 8.9%, 2.1%, and 1.4%, respectively; and the flow index errors were 3.8%, 0%, and 1.9%. In general, the calculation error of the Standard k-ε model was the greatest, and the calculation results of the LES model and the RNG k-ε model were relatively small. In
Figure 3, the most accurate distribution position of the vortex area was simulated by the LES model, and the distribution position simulated by standard k-ε model had the farthest deviation from the position measured by DPIV. The characteristic flow velocity values simulated and measured in the characteristic area of the interior of the emitter (vortex center area, mainstream area, sharp angle disturbance area) are shown in
Table 1. The velocity value errors between the values measured and calculated by the standard k-ε model, RNG
k-ε model, and LES model in the center of the vortex were 12.50%, 8.33%, and 4.17%, respectively; in the mainstream area were 7.12%, 1.95%, and 1.30%; and the average speed errors at sharp angles area were 11.31%, 7.69% and 4.07%, respectively. The calculation error simulated by the LES model was the smallest, and the calculation error simulated by the Standard k-ε model was significantly larger than that simulated by the other two models.
Through macro and micro verification, the simulation accuracy by the LES model was the greatest, the one by the RNG k-ε model was in second place, and the one by the Standard k-ε model was the lowest. Although the simulation accuracy by the LES model was the highest, the LES model required more special mesh scale. The mesh must be encrypted enough to distinguish turbulent structures. The LES model was a non-steady-state calculation method. It took a long time to calculate the fluid motion and had high requirements for computer performance. Therefore, the LES model was not the main method for solving the complex turbulent flow field of the emitter. By the comprehensive analysis of the calculation accuracy and calculation efficiency, the RNG k-ε turbulence model was most suitable for the simulation of the flow field in the emitter.
3.2. Analysis of the Motion Characteristics of Water Flow and Particles in the Emitter
3.2.1. The Motion Characteristics of Water Flow
Distribution of Pressure Field
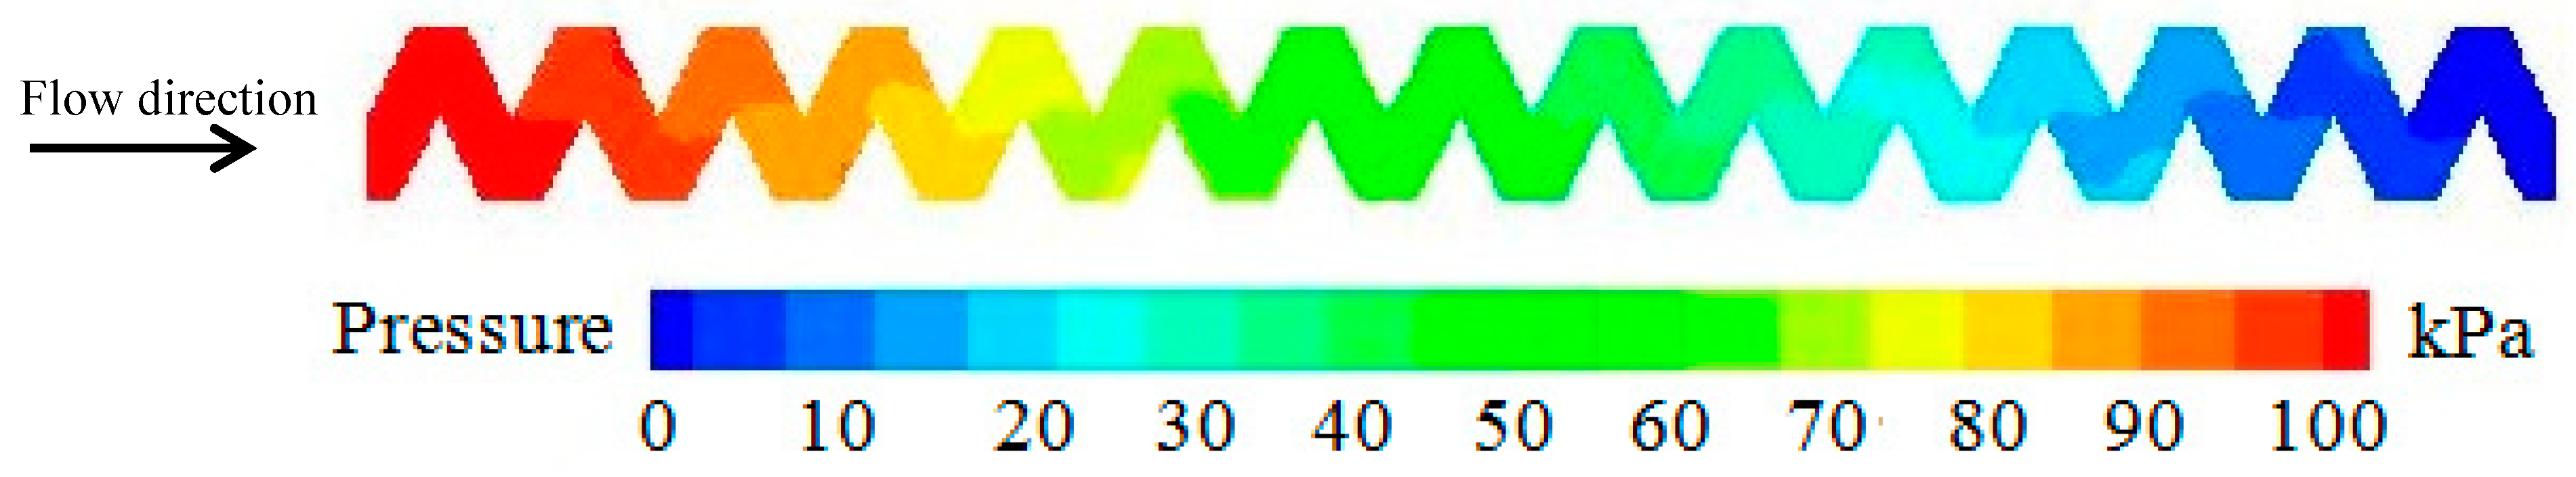
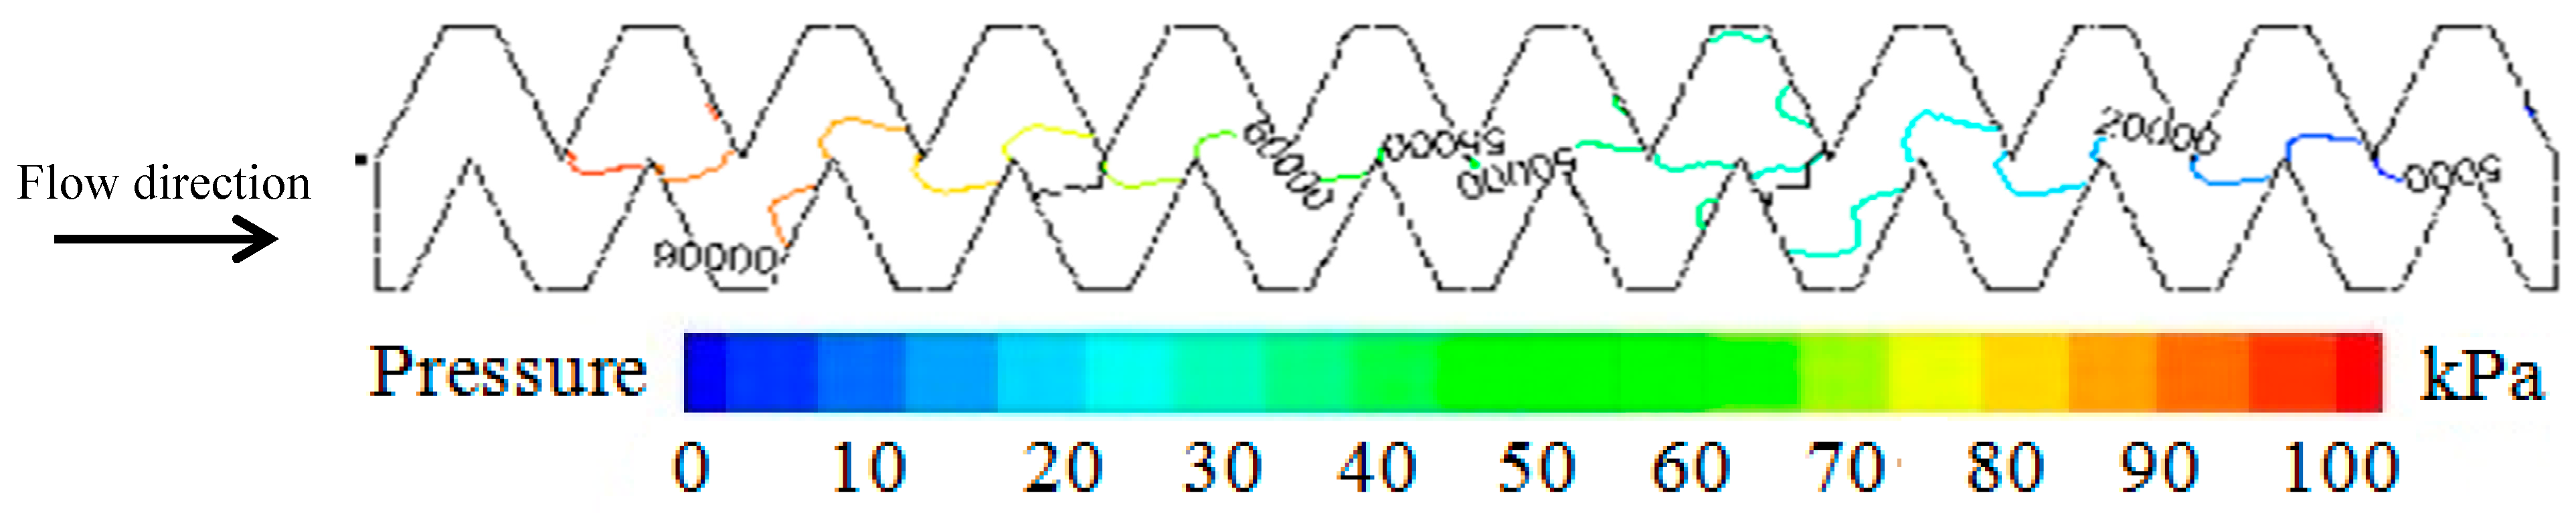
At 0.1 MPa, the cloud map and contour map of pressure distribution of the water flow inside the emitter are shown in
Figure 4 and
Figure 5, respectively. The pressure of the water flow in the flow path showed a uniform downward trend along the flow direction. The pressure at the beginning of the flow path was the largest. After the water flowed through the entire flow path, the pressure dropped to 0 when it reached the outlet at the end of the flow path. The pressure change was more obvious at the location where the tooth tip of the flow path or the sites of the water flow changed rapidly.
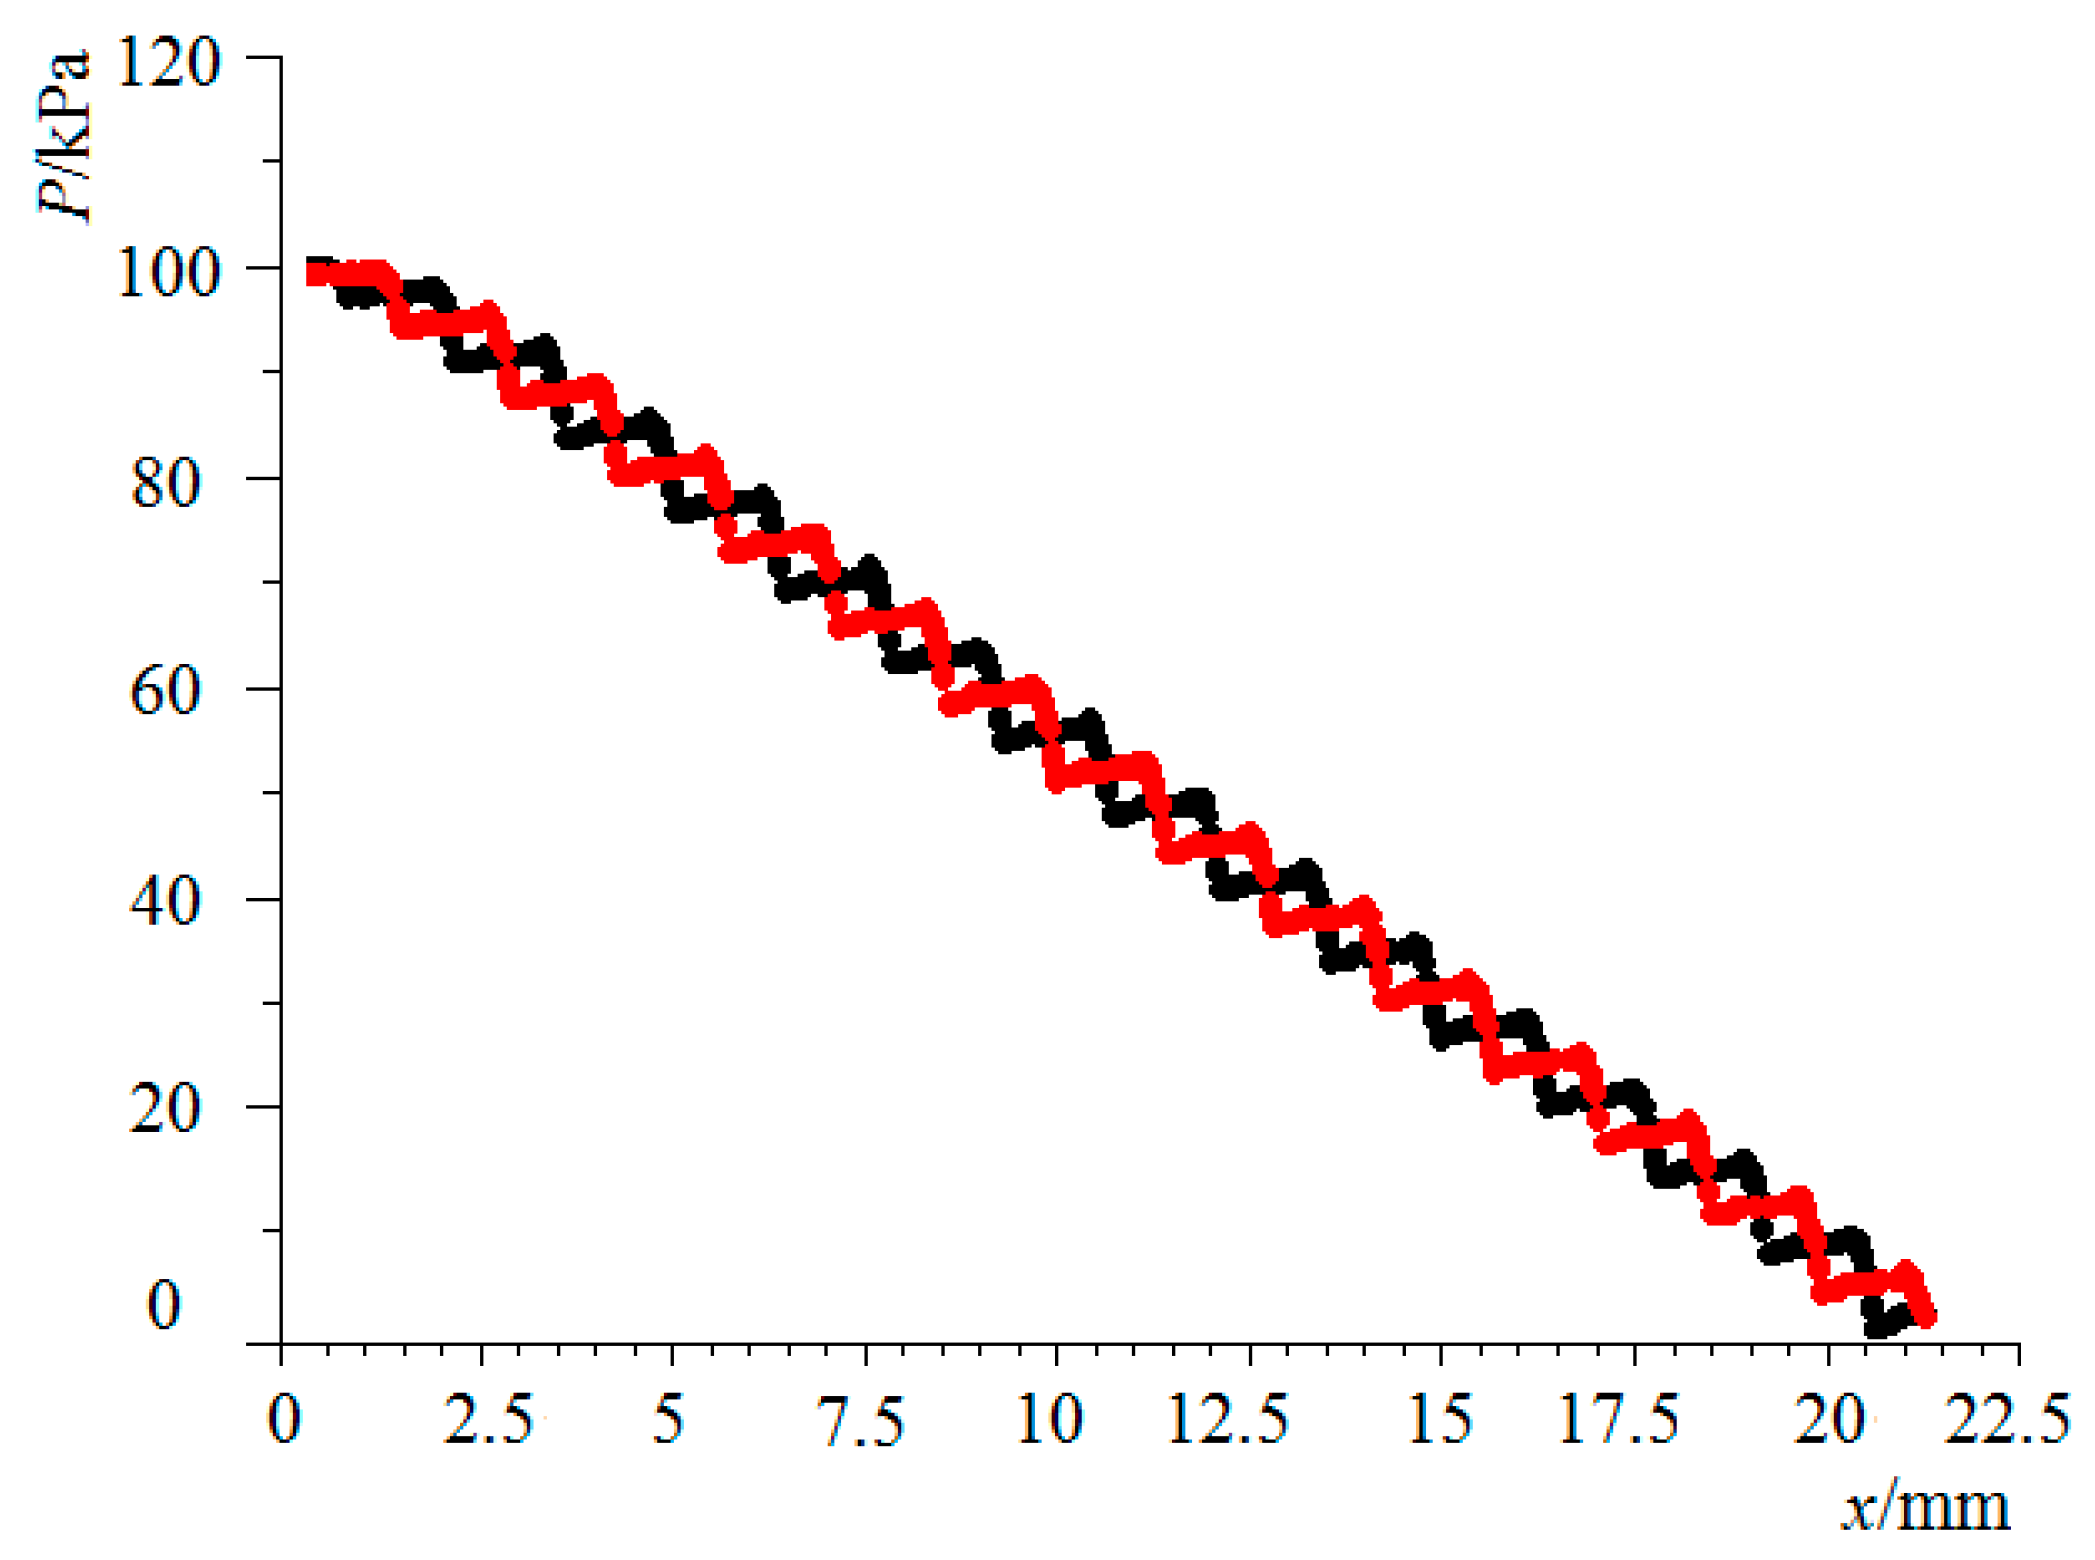
At 0.1 MPa, the pressure distributions of the water flow along the flow direction at the longitudinal sections with the depth of 0.01 mm away from the cross-section of z = 0.5D of the emitter flow path are shown in
Figure 6. The pressure showed a step-like uniform decrease along the flow direction, and the pressure sharply dropped at the sudden change of the flow path structure.
Distribution of the Velocity Field
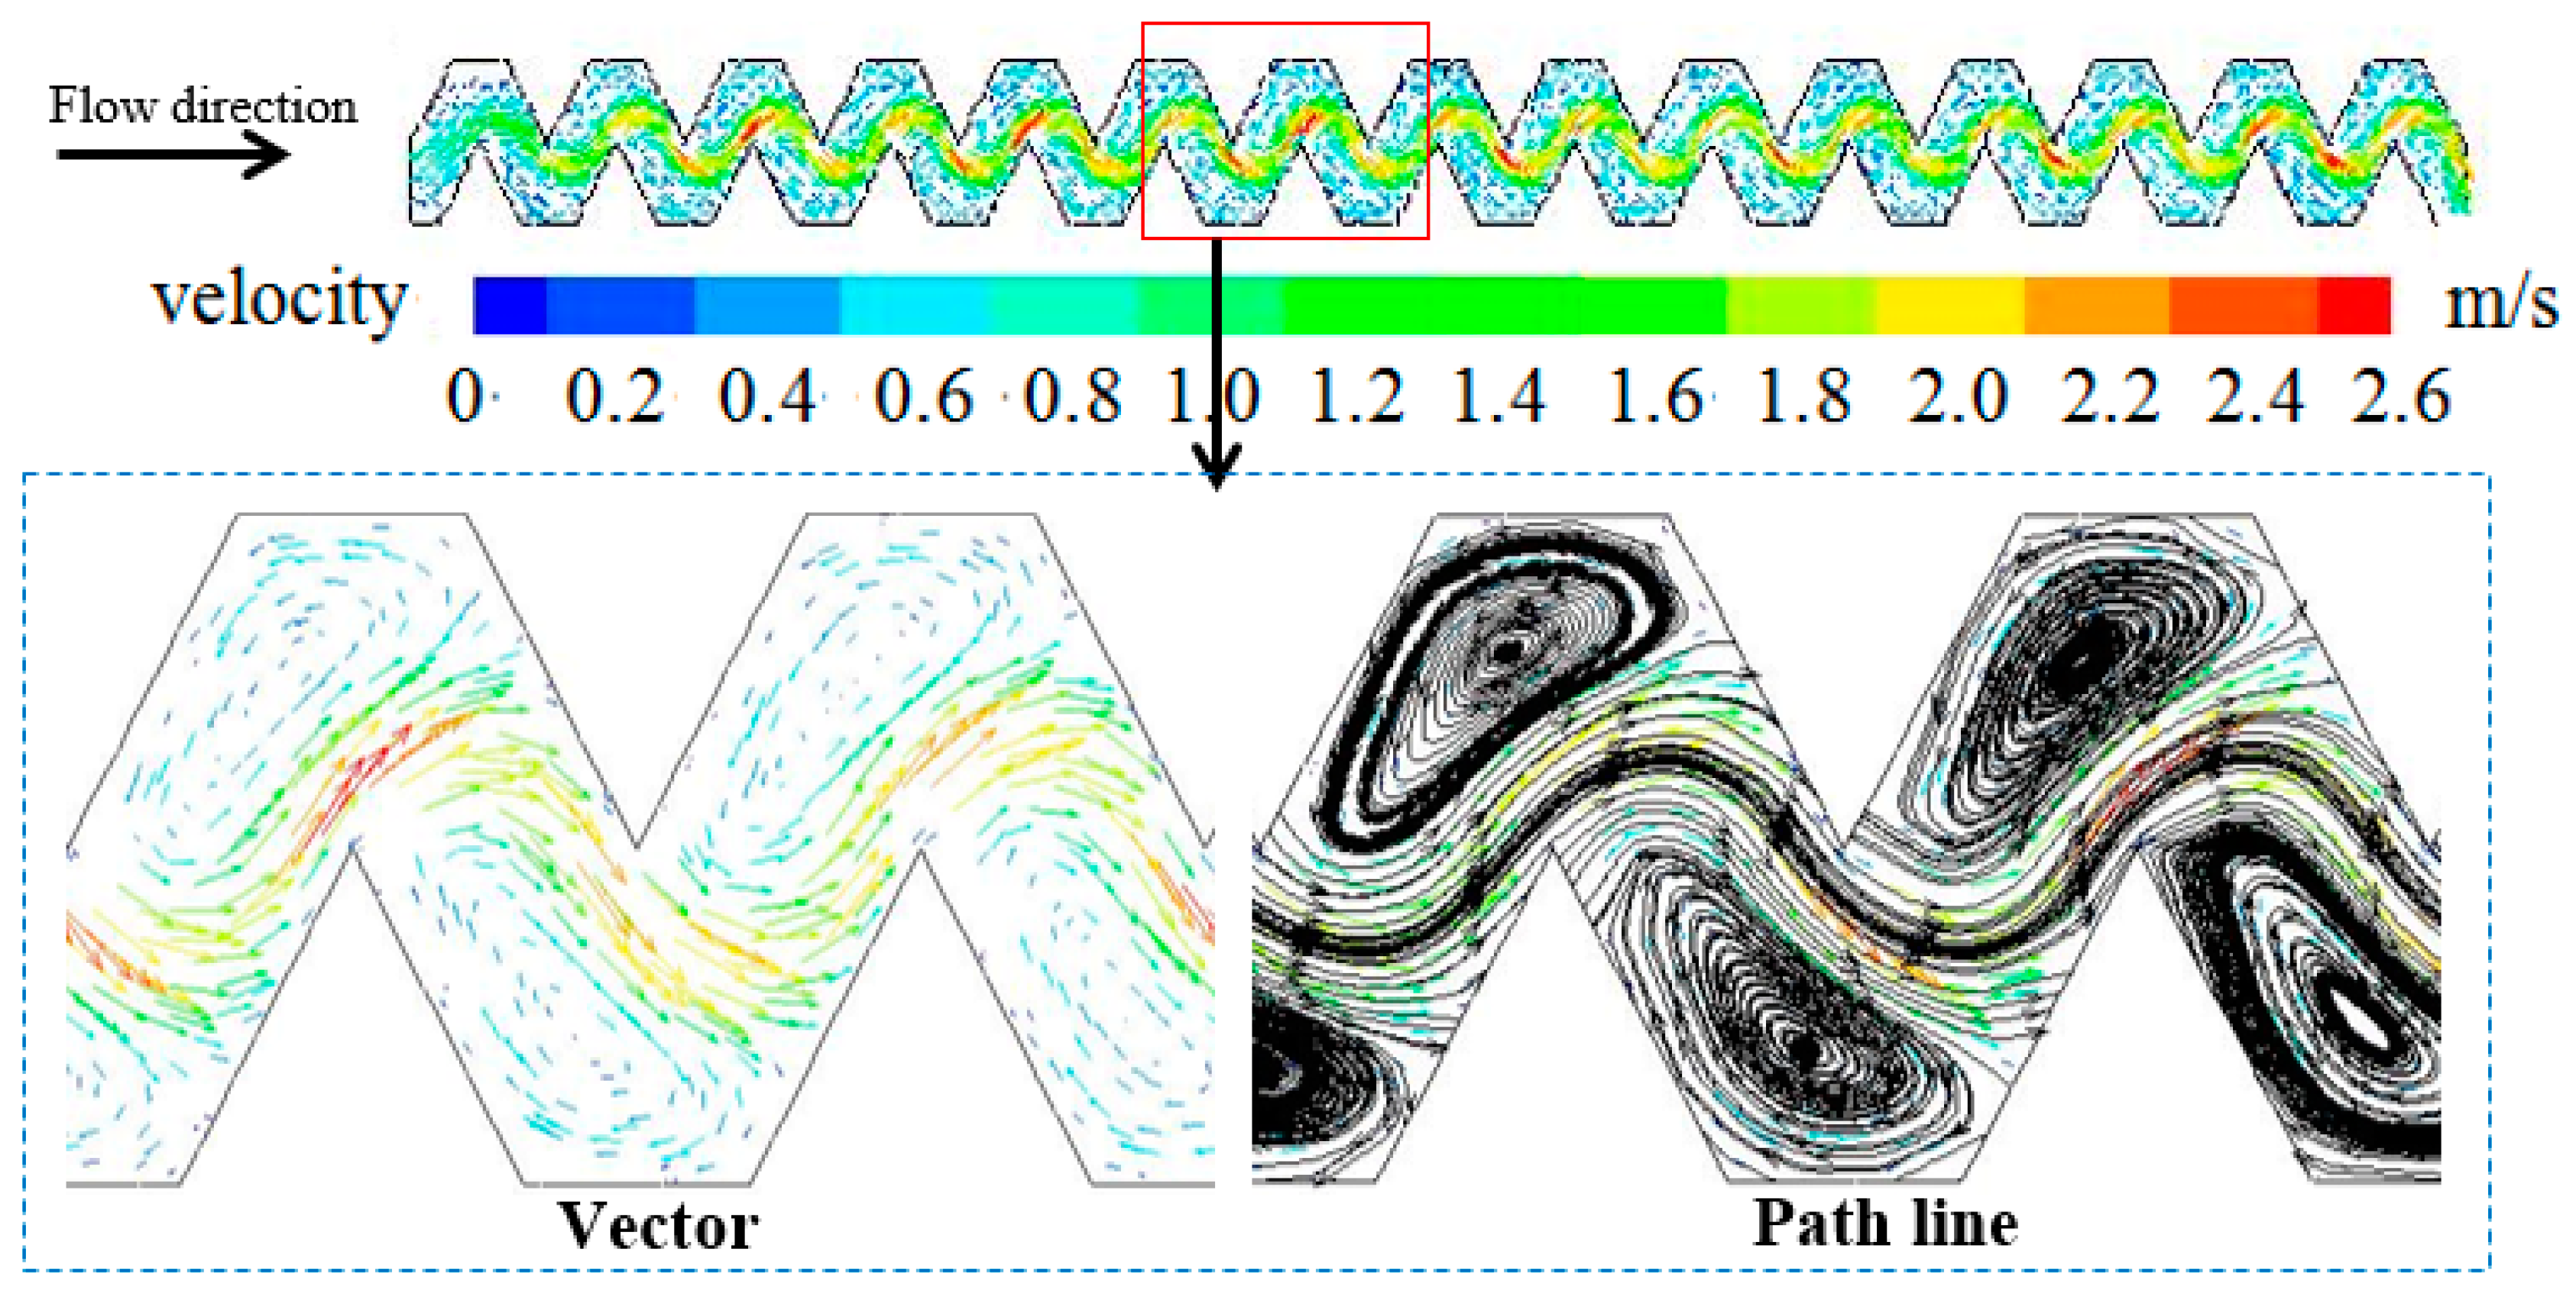
At 0.1 MPa, the streamline distribution of velocity vector in the flow path of the emitter is shown in
Figure 7. The fluid movement in the flow path was clearly divided into a high-speed mainstream region and a low-speed non-mainstream region. The velocity ranges in two regions were 1.5–2.6 and 0–1.6 m/s, respectively. In the near-wall surface area of the flow path, the velocity was smaller and accompanied by the generation of vortices. The velocity distribution among different structural units was relatively consistent, showing a state of periodic change.
Distribution of Turbulence Intensity
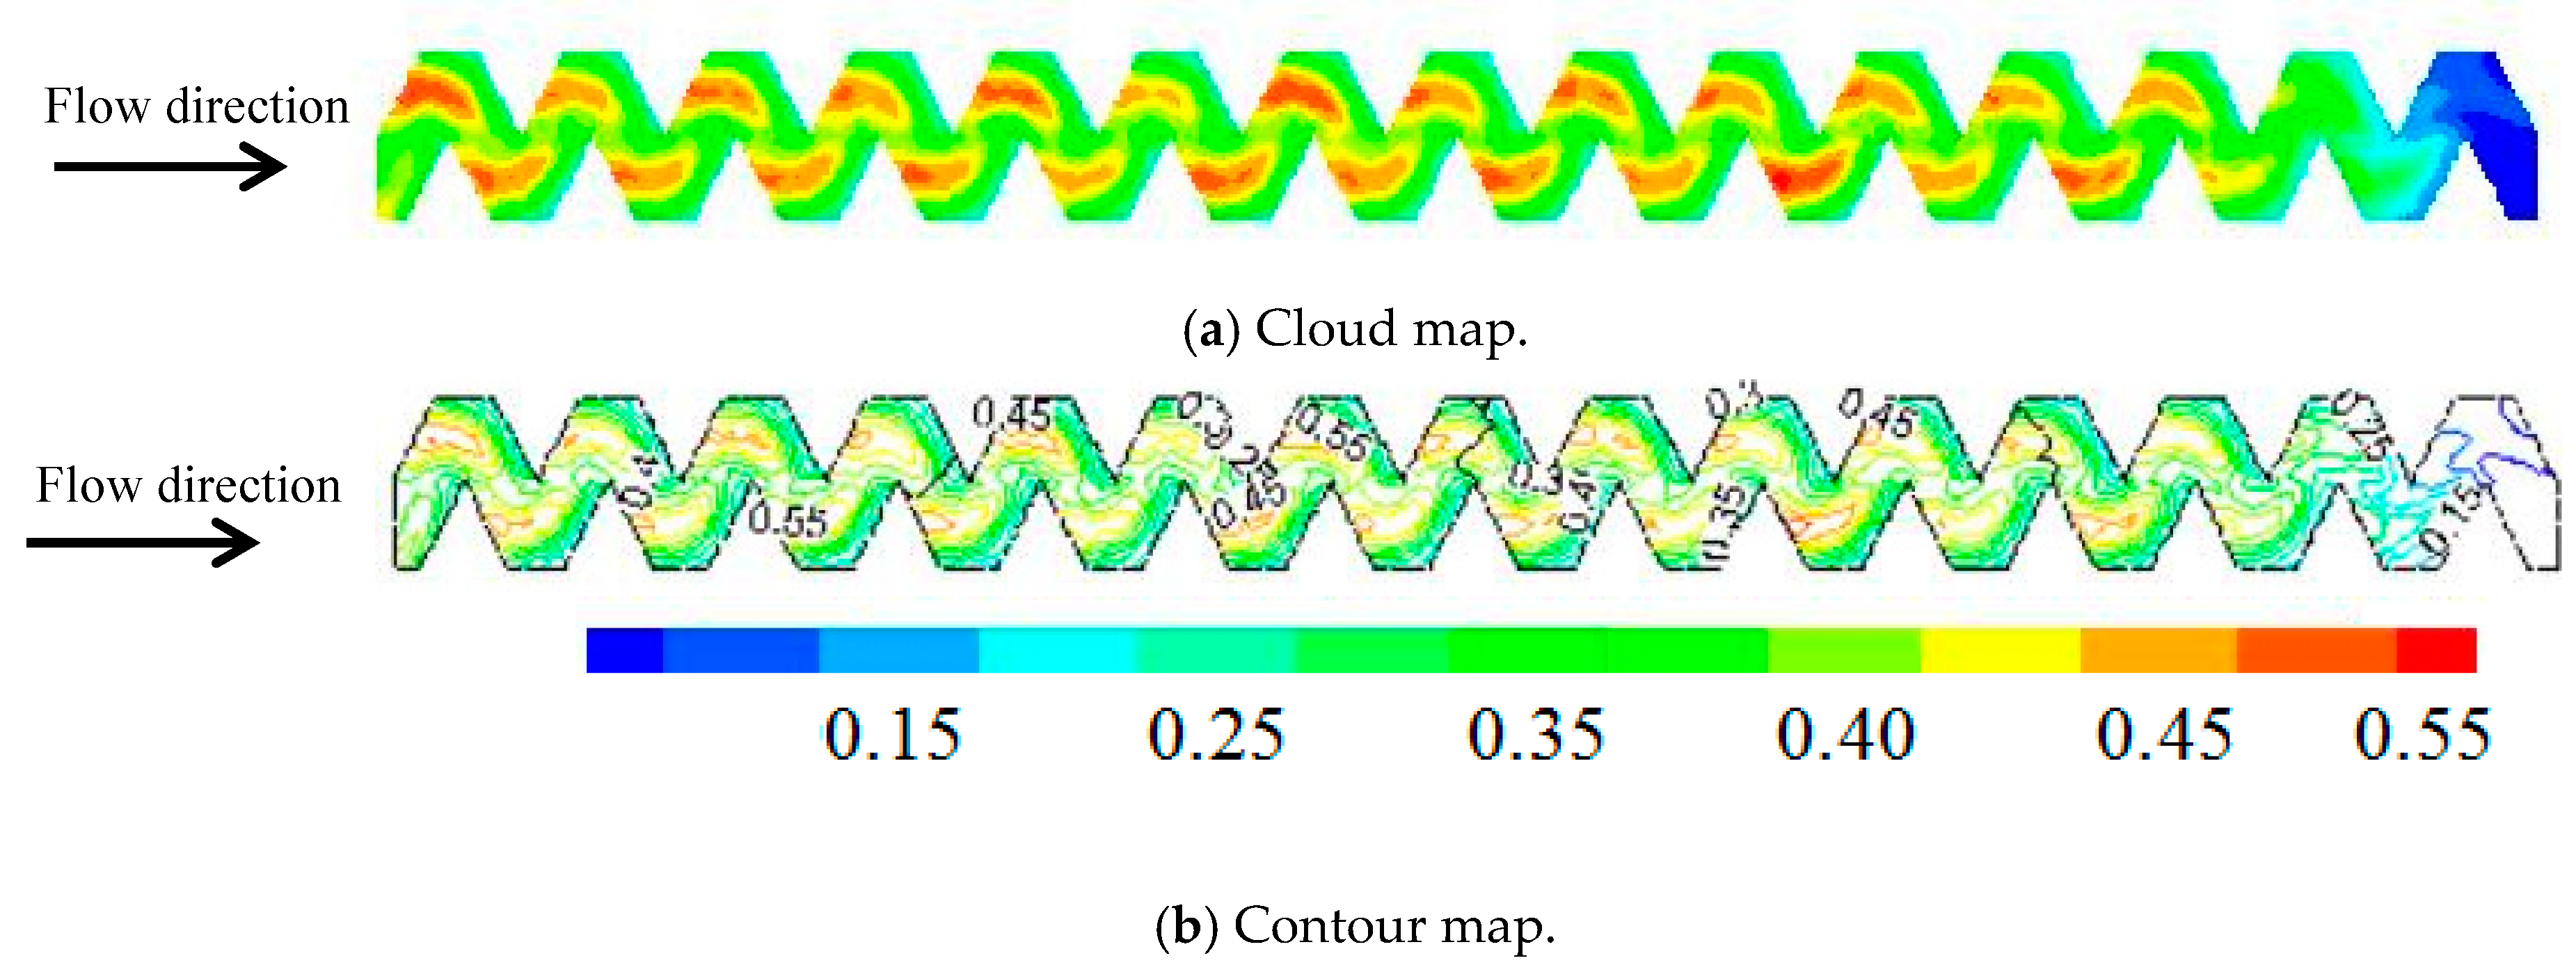
The turbulence intensity can be used as an indicator for characterizing the hydraulic and anti-clogging performance of the emitter. The cloud map and contour map of the turbulent intensity distribution in the middle longitudinal section (z = 0.5D) of the flow path are shown in
Figure 8. The turbulence intensity fields all showed the obvious intensity gradients. The turbulence intensity in the mainstream region was higher, and the turbulence intensity in the non-mainstream region was lower. The extremum of turbulence intensity appeared near the sudden change position of the flow path structure, which illustrates the fluid was the most disturbed and the fluid has the strongest turbulence ability, and it gradually decayed along the flow direction. This is consistent with the distribution results of the velocity field and pressure field inside the emitter measured by DPIV.
3.2.2. Movement Characteristics of Particulate Matter in the Flow Path of the Emitter
Distribution of the Velocity Field
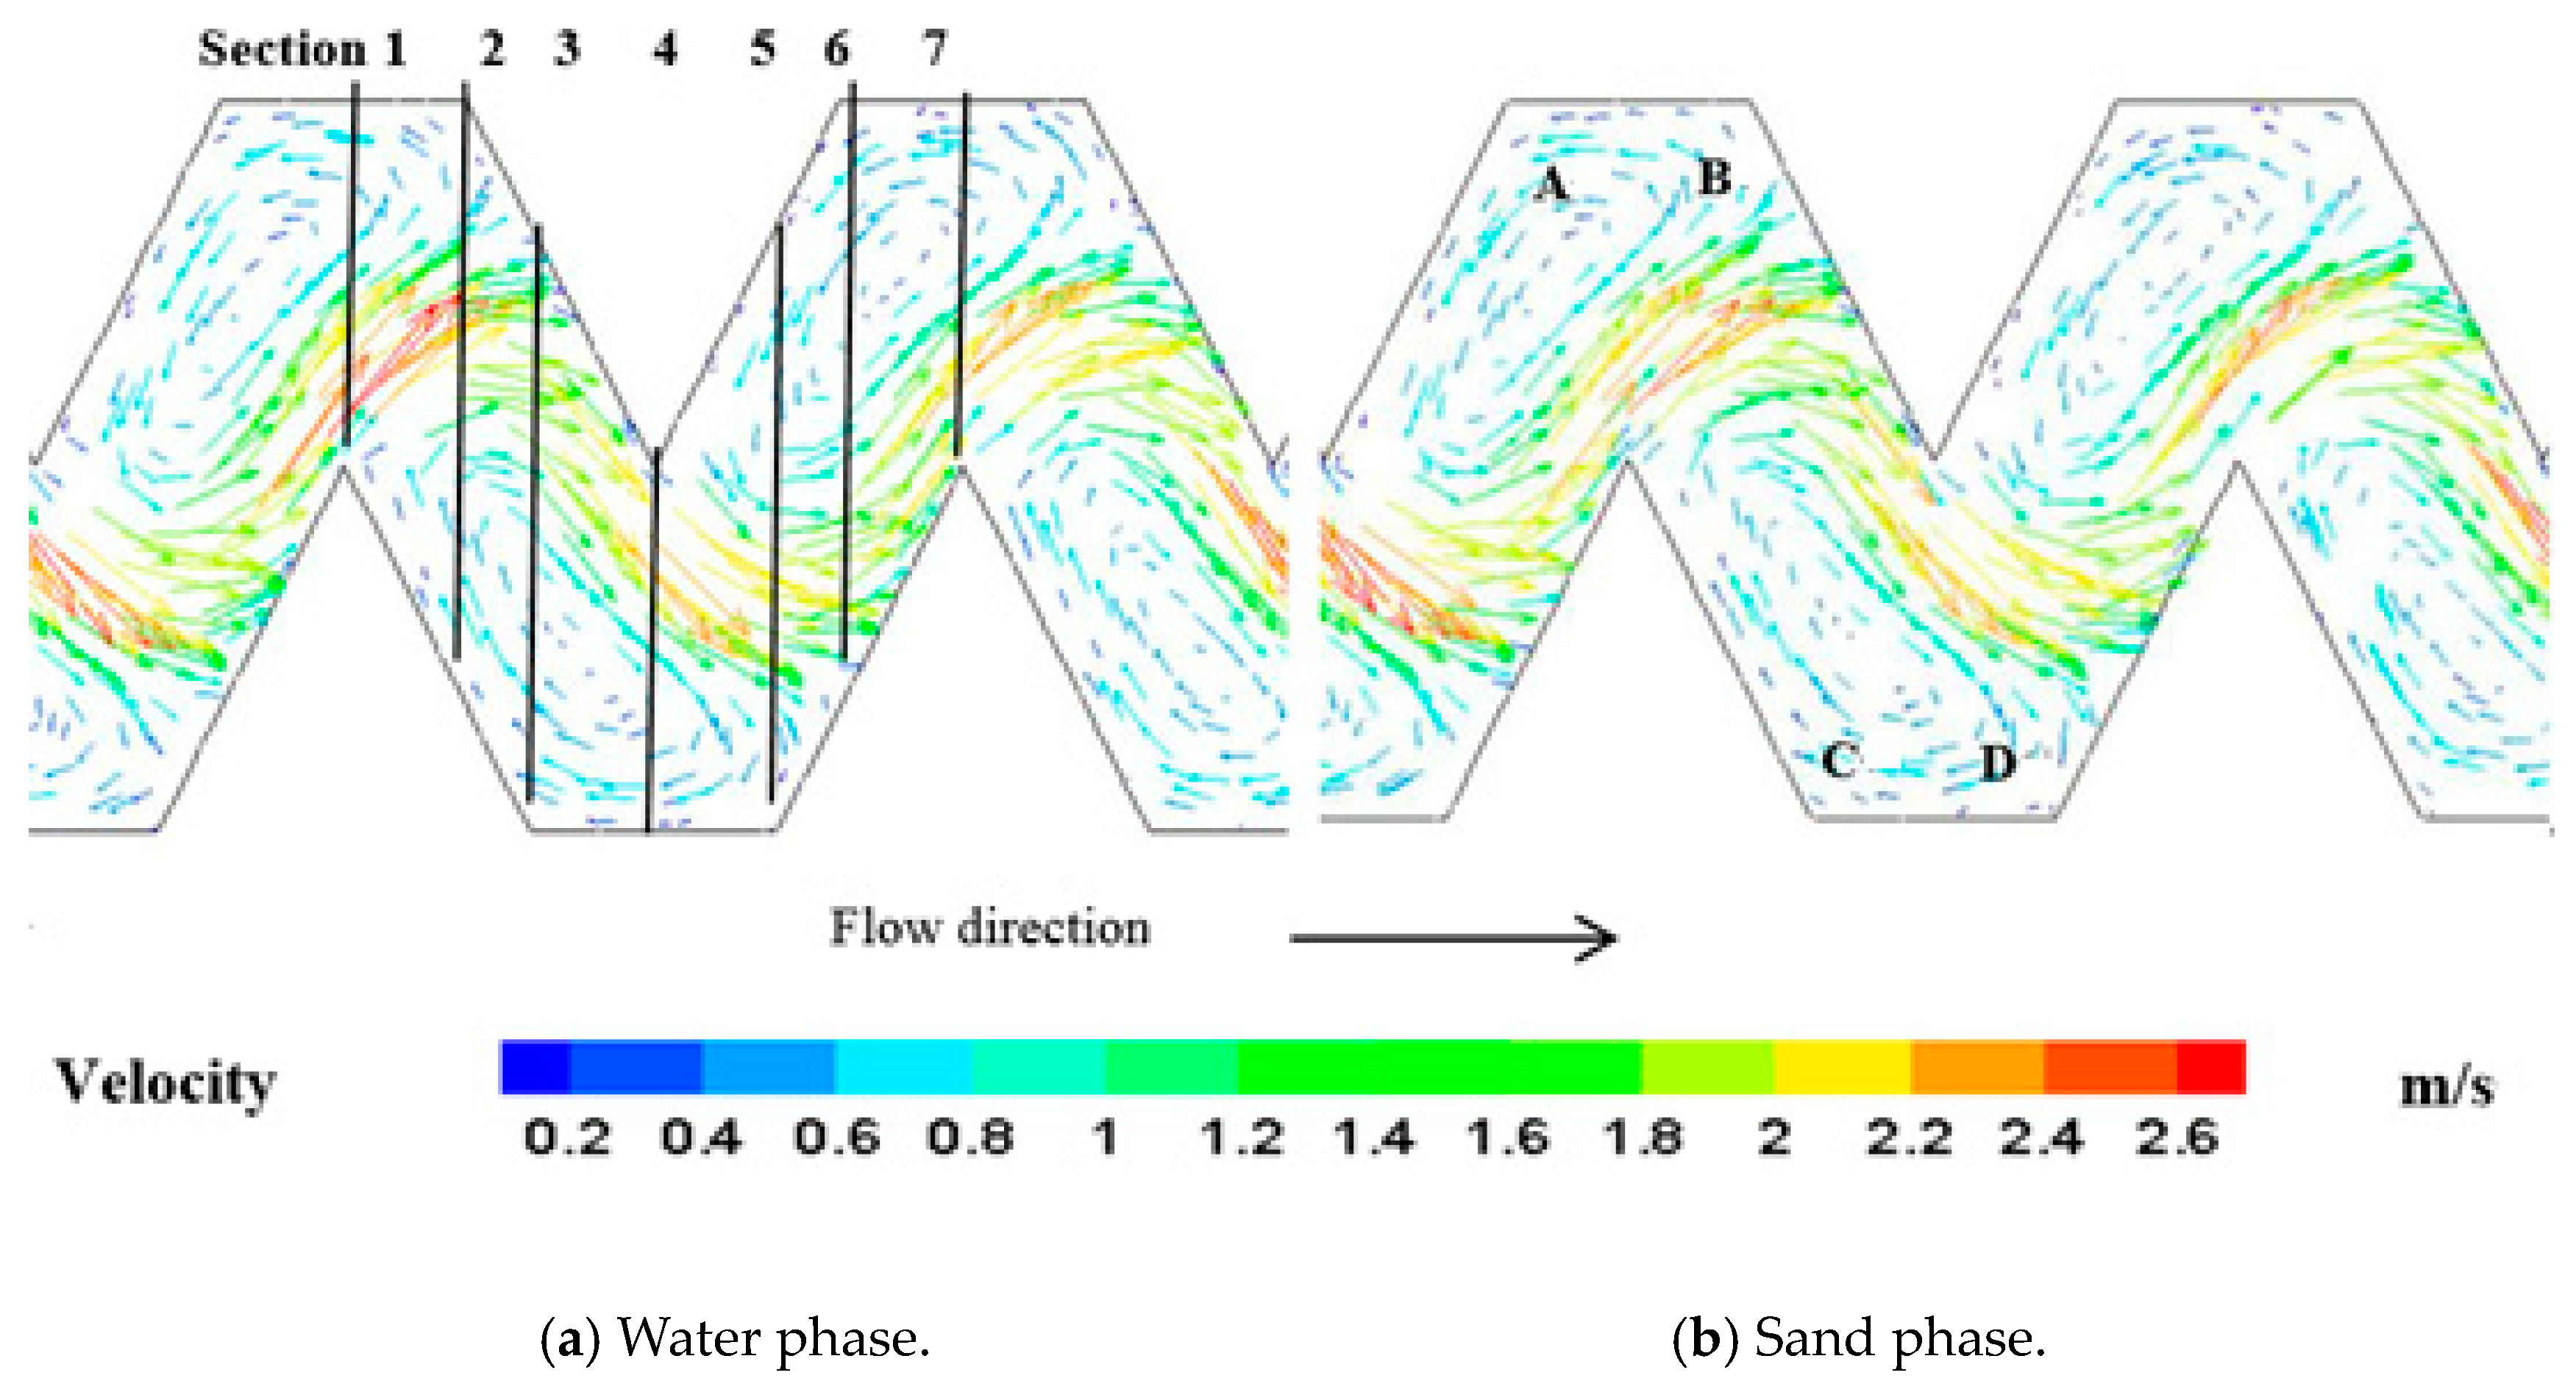
The distributions of the velocity vector of water phase and sand phase in the intermediate structural unit (seventh and eighth structural unit) are shown in
Figure 9. The velocities of water and particles were basically the same, and the velocity of the water phase was slightly greater than the velocity of the particle phase. This is because the two-phase flow model used in this calculation was the Eulerian model. In this model, the momentum equation was established for each phase in the calculation domain during the calculation, and the multiphase flow was regarded as a continuous medium. Therefore, the velocity distribution and values of the water phase and particle phase were relatively close.
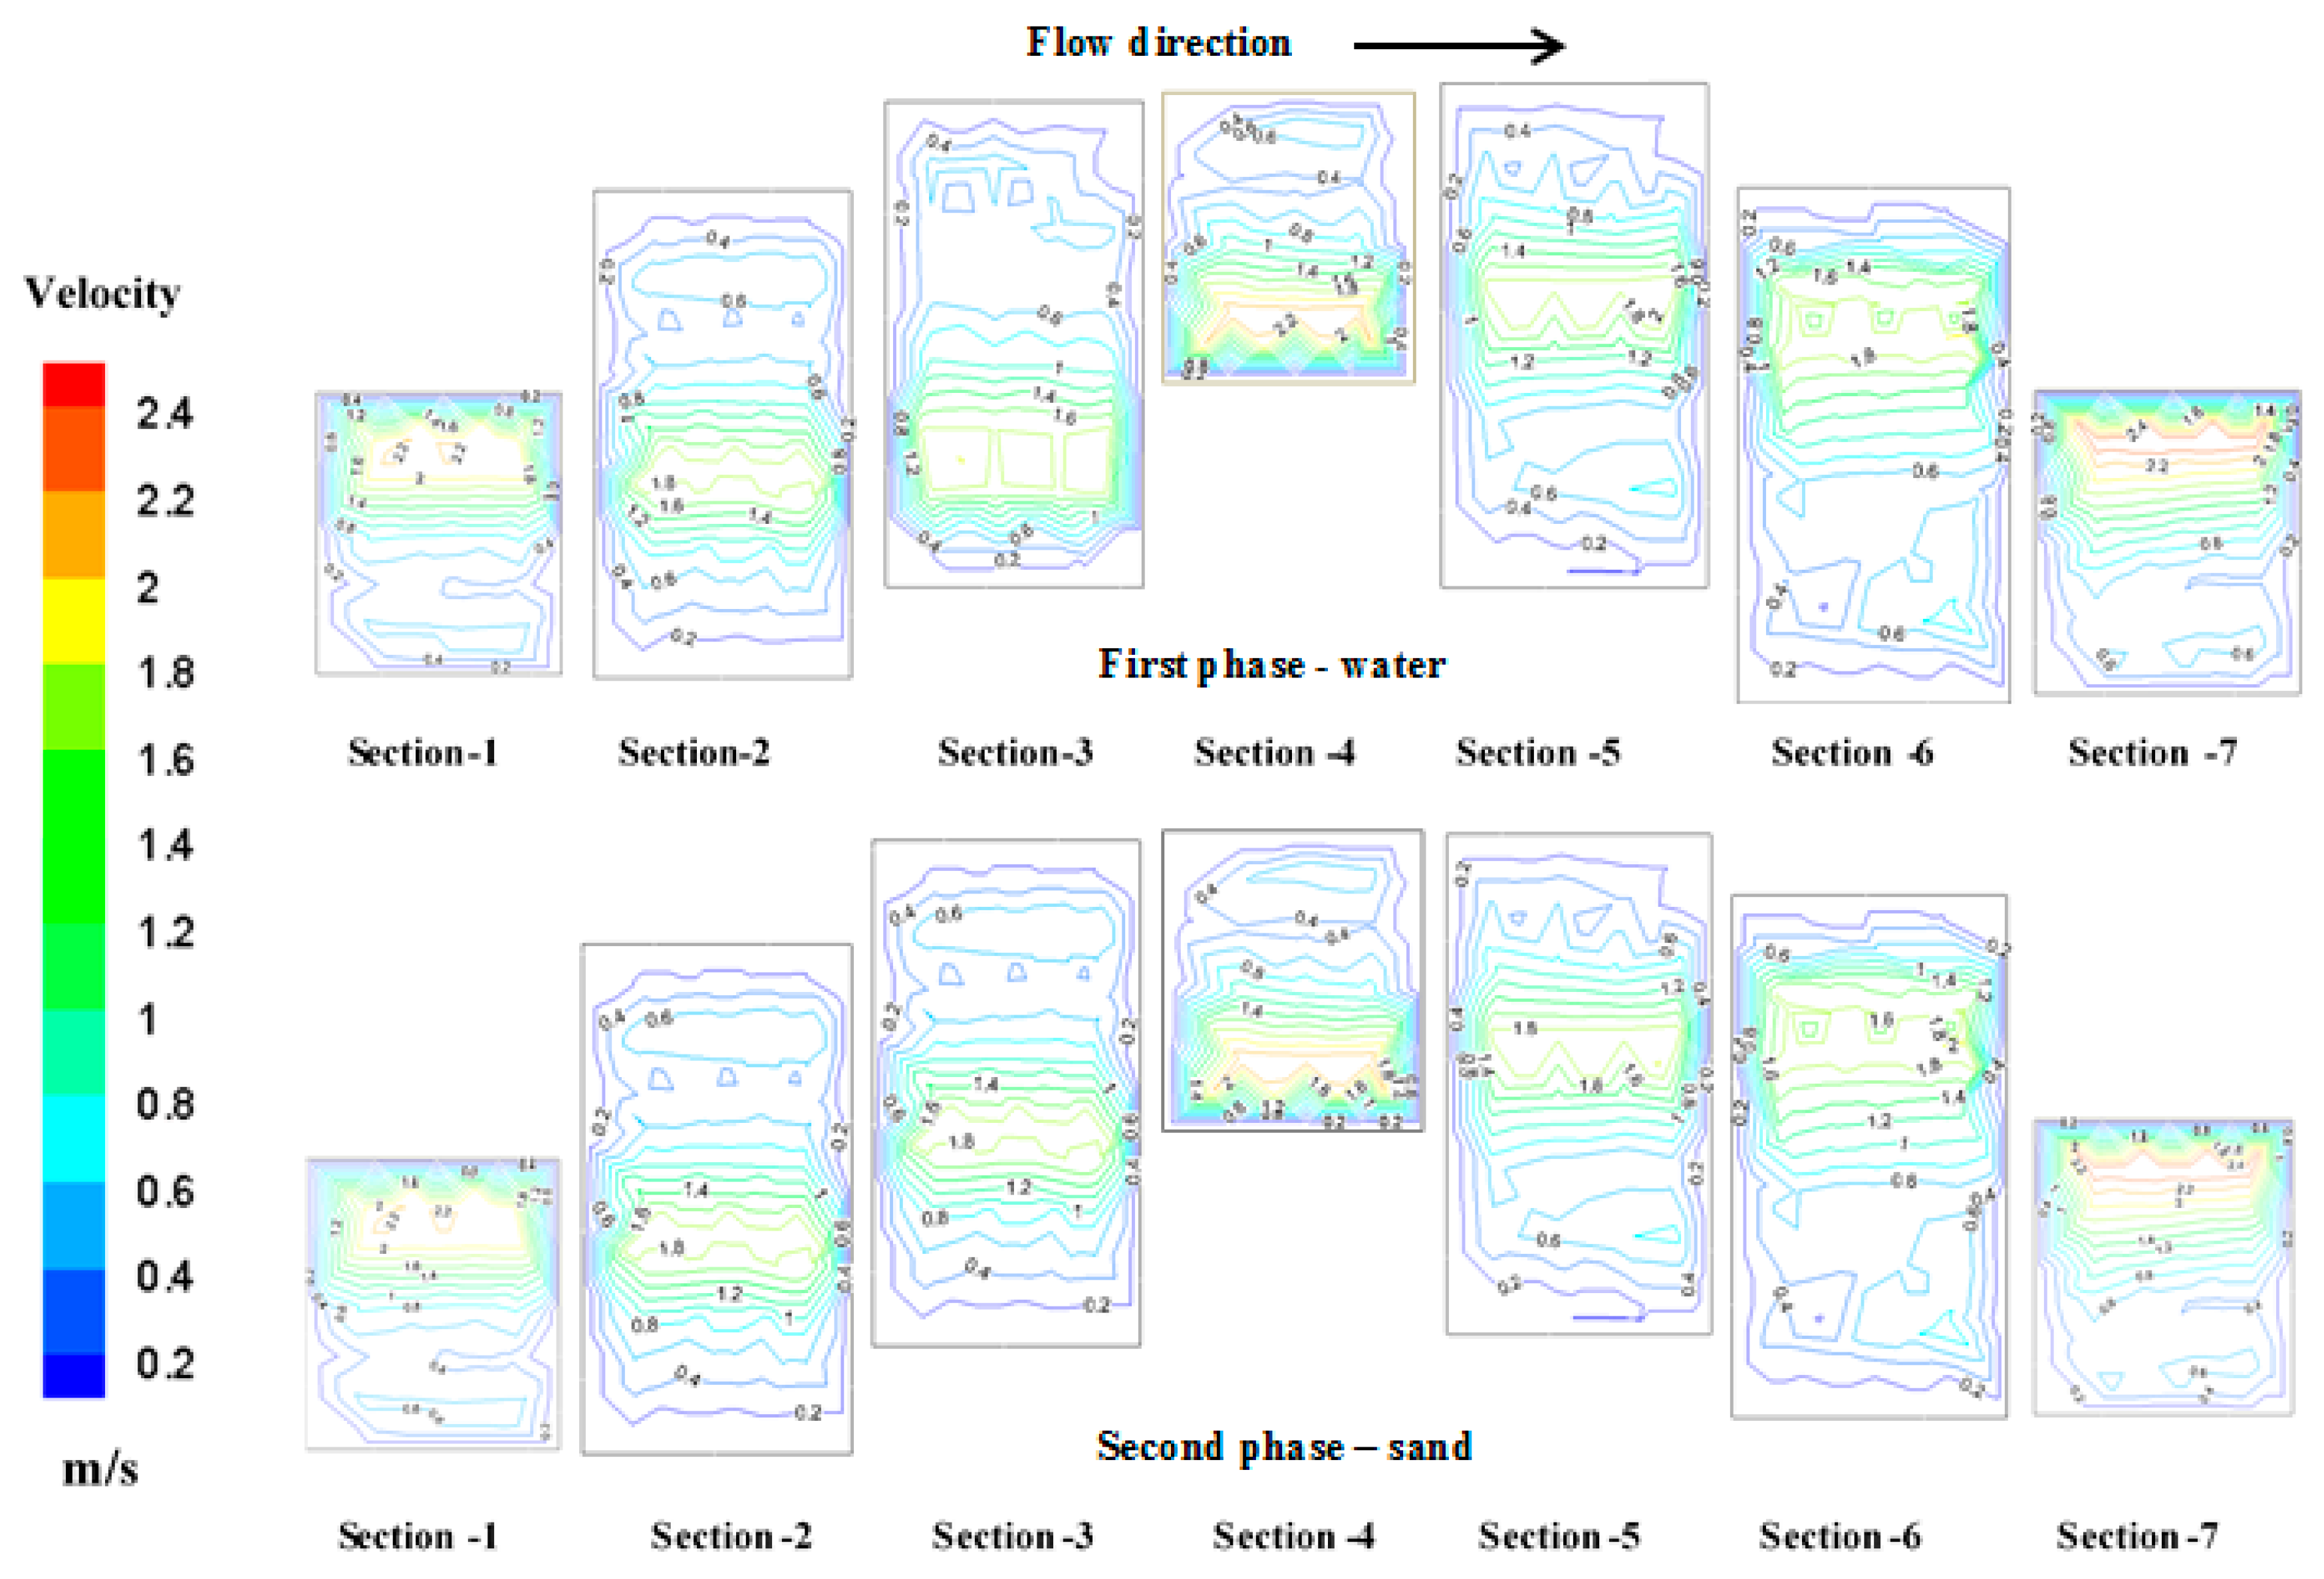
Seven representative cross-sections were selected in the flow path structural unit (shown in
Figure 9), and the contour maps of the velocity distribution of water and particulate matter at the different cross-sections are shown in
Figure 10. The velocity distributions of the two phases were relatively close, and the velocity of the particle phase was slightly lower than that of the water phase. The velocity near the wall of each section was lower. The velocity distribution along the depth of the flow path was relatively uneven, with the maximum velocity and the largest change gradient at the tooth tip.
Distribution of the Sand Phase
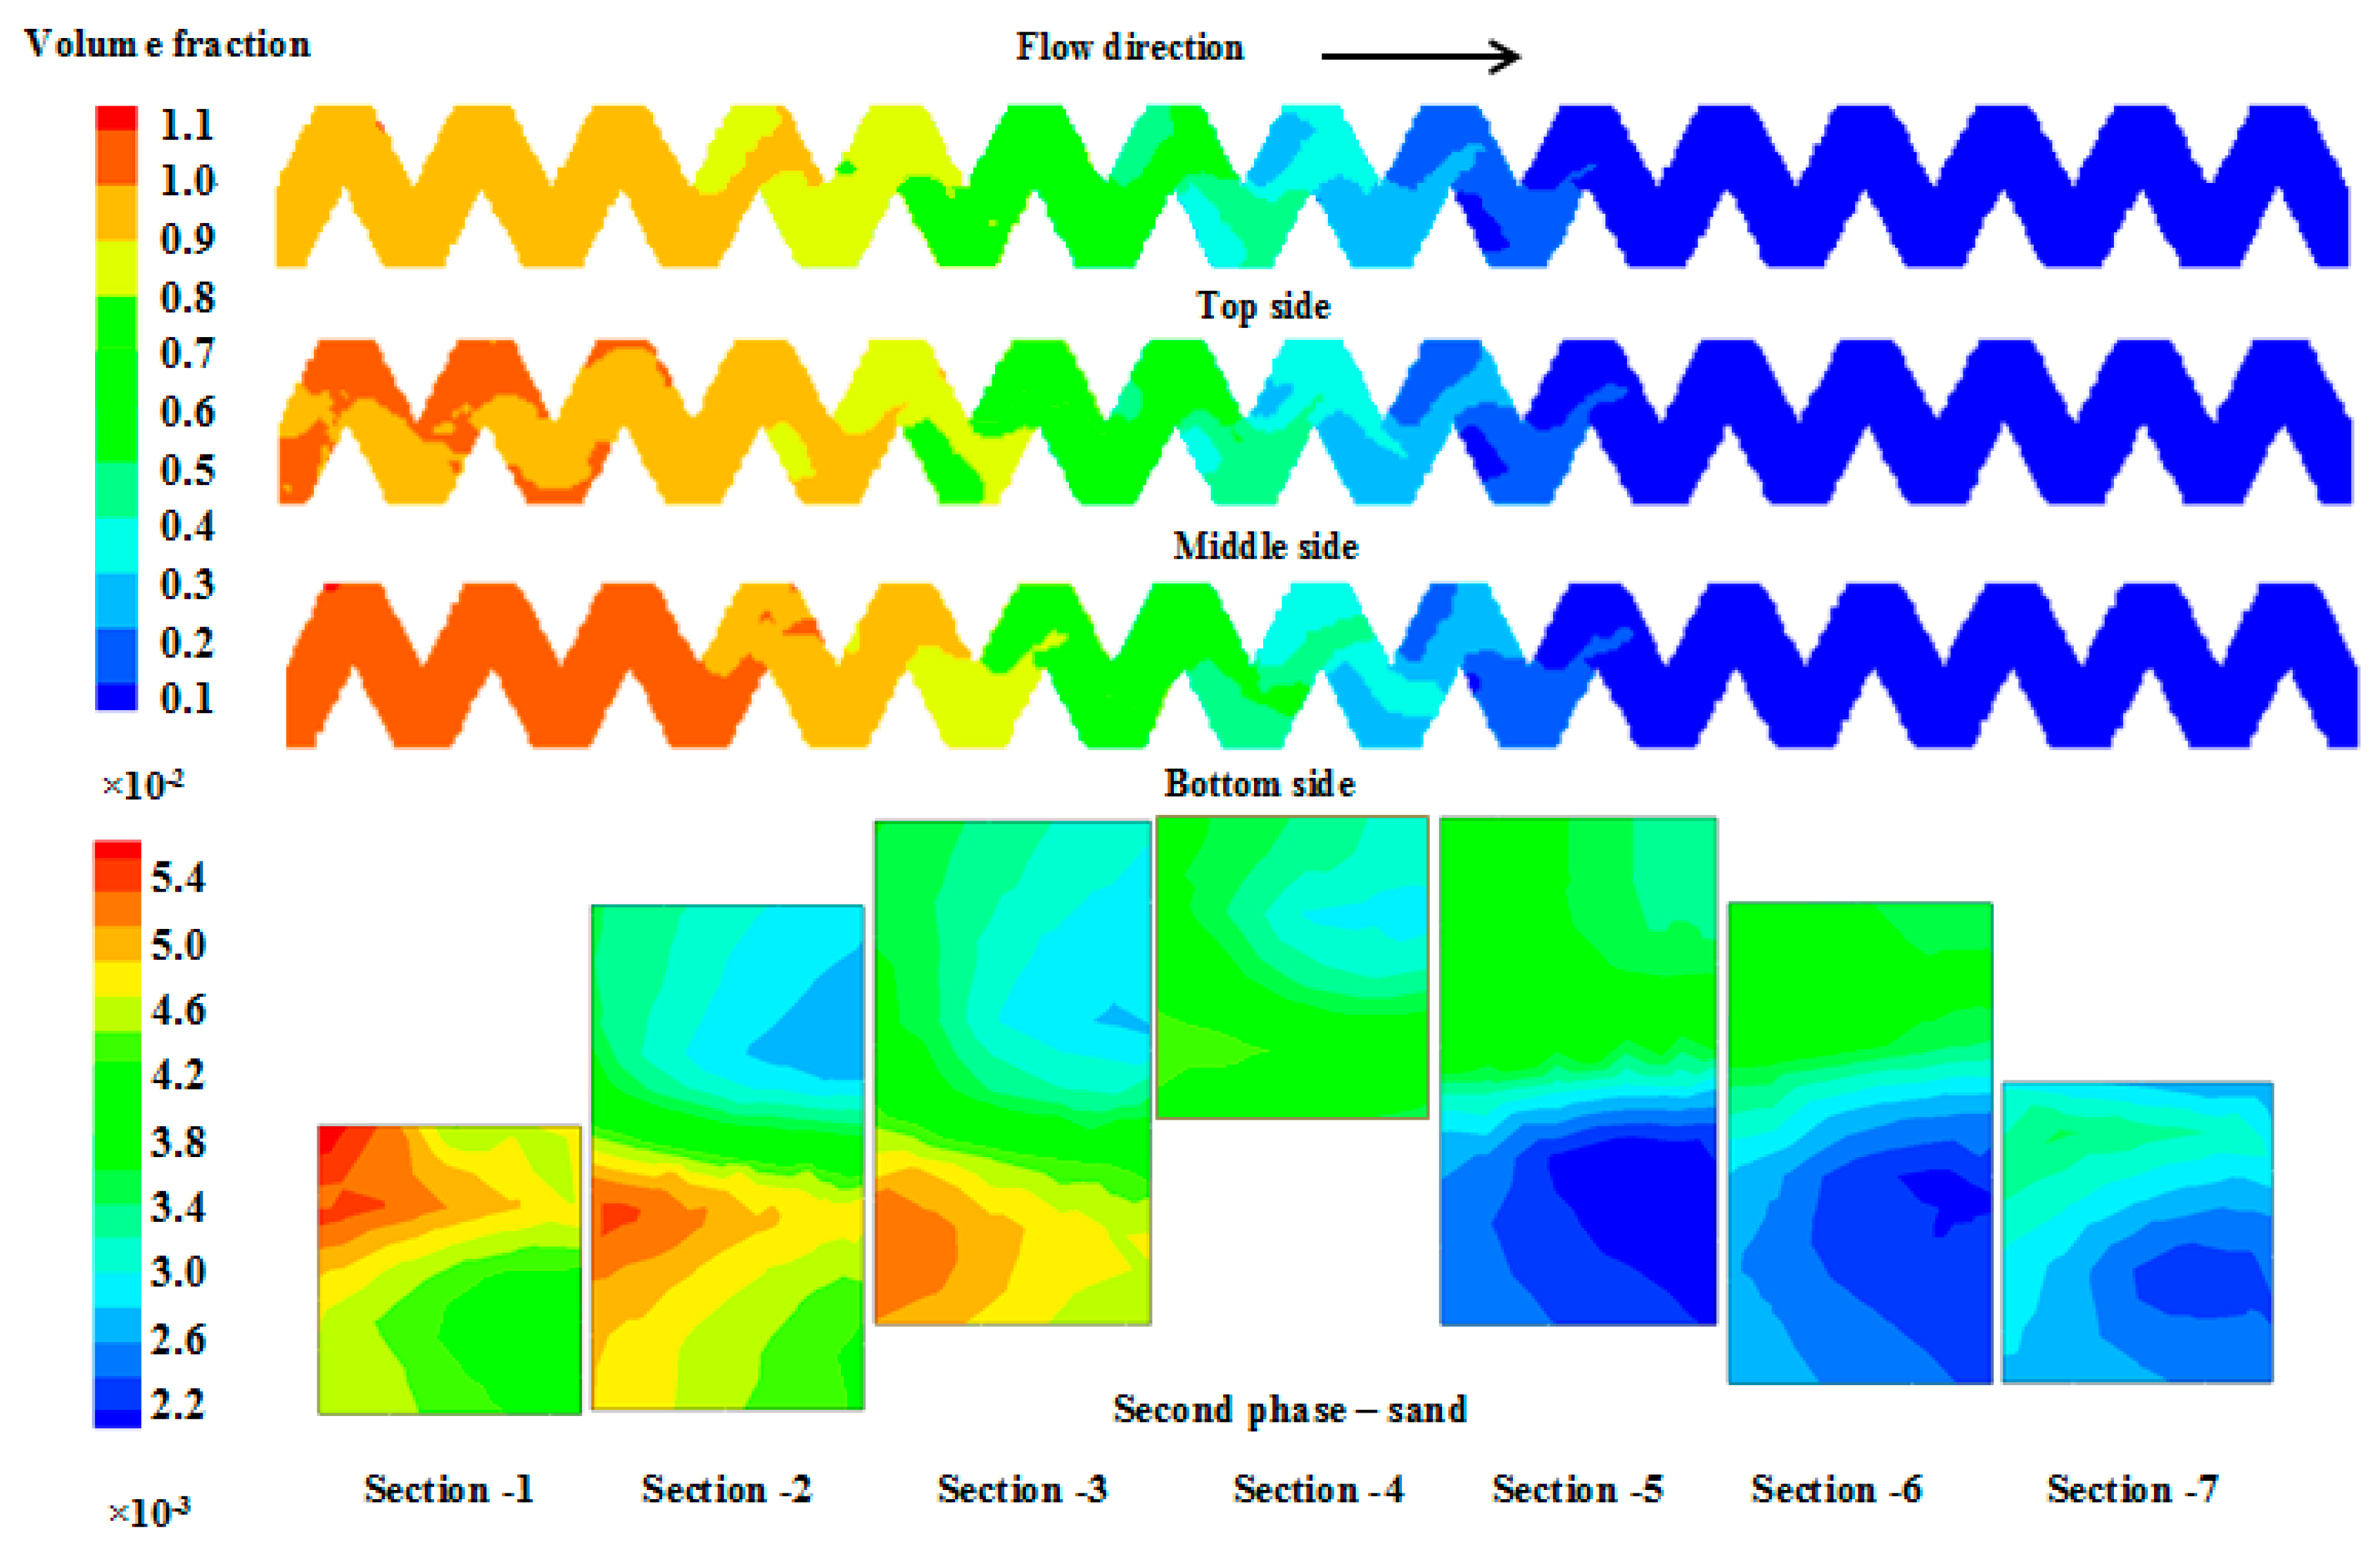
The particle volume distributions along the flow path depth direction and different cross-sections are shown in
Figure 11. Under certain hydraulic condition and particulate matter conditions, the amount of particulate matter that the water stream can carry was limited. With the increase of the depth of the flow path, the volume fraction of the particle phase at the same position of the flow path showed an increasing trend, indicating that during the forward movement of the water flow, the particles were continuously deposited under the action of gravity. Sediment was mainly deposited in the first half of the flow path.
According to the particle phase volume fractions at different cross-sections of the flow path, the particle content distributions were very uneven along the depth direction of the flow path. Along the movement direction of water flow, the particulate matter contents in the area of the tooth tip facing water (B area) and the area of the tooth heel dorsal water (C area) were the highest, and the particulate matter contents were the lowest in the area of the tooth heel facing water (D area) and the area of the tooth tip dorsal water (A area). Therefore, the structure of the A and C areas needs to be optimized to make the sediment hard to deposit and easy to discharge outside the emitter.
4. Discussion
In this paper, the RNG
k-ε turbulence model was determined as the optimal simulation turbulence model of the flow field in the emitter flow path by comparing the macroscopic hydraulics and microfluid motion characteristics. Based on this model, the flow characteristics of fluid and particulate matter transport were calculated and analyzed. Through the analysis of the flow characteristics of the flow movement inside the emitter flow path, the pressure was reduced from the maximum to 0 after flowing through the whole flow path. This is due to the continuous energy dissipation effect of each structural unit of the flow path. When the fluid flowed through the whole path, its energy was eventually consumed, resulting in the formation of water droplets [
28]. In addition, according to the distributions of the pressure field, velocity field, and turbulence intensity, it can be seen that there were significant changes of the pressure and velocity at the abrupt change of the flow path structure, and the fluid was greatly disturbed. This is because the abrupt change of the flow path structure (tooth tip) caused the fluid movement to be sharply adjusted, the flow velocity distribution to be reorganized, and the flow line to be denser. In this process, the relative motion between the viscous liquid particles was strengthened and the internal friction was increased, and then the energy loss was more serious. Therefore, the abrupt region of the flow path structure was the main area of the energy dissipation, and the effect of energy dissipation was the most significant [
29].
By the analysis of the internal fluid flow and particle movement characteristics in the emitter flow path, it can also be found that the flow in the flow path presented the mainstream area and the non-mainstream area, and there were vortices. The formation of a low-speed vortex in the non-main zone is because of the following three factors: the fluid velocity differences between two zones at the junction of the mainstream zone and the non-main zone, the fluid viscosity, and the obstruction of the flow path wall. Due to the low velocity in the vortex zone, it is easy to deposit the clogging material, which is also the essential reason for the emitter clogging [
30]. Therefore, it is necessary to improve the flow path structure of the emitter to make the vortex fully developed as far as possible, to increase the velocity of the vortex zone and its scouring effect on the inner wall of the emitter, and to make the clogging material not deposit and easily discharge with the water flow. This is also the most fundamental way to improve the anti-clogging performance [
31].
5. Conclusions
The following conclusions can be got:
(1) The RNG k-ε turbulence model was the most suitable for the simulation of the internal flow field of the emitter based on the macroscopic hydraulic performance and the microclogging resistance of the emitter, the comprehensive calculation accuracy, and the calculation efficiency.
(2) The pressure showed a step-like uniform decrease along the flow direction in the flow path of the emitter. The fluid flow presented regional motion characteristics—the mainstream region and non-mainstream region. The abrupt change sites of the flow path structure were the most important part of the energy dissipation of the emitter.
(3) The velocity of particle phase was slightly lower than that of the water phase. The near-wall velocity was lower than that in the center of the flow path, and the velocity along the depth of the flow path and the volume distribution of the sand phase were relatively uneven. The sediment was mainly deposited in the front half of the path.
The research in this paper only studies the water flow and particulate matter movement characteristics of a certain kind of emitters and the flow path structure under the condition of drip irrigation from the Yellow River. The most important thing is that the water quality of the Yellow River is complex, and the impact of complex water quality on the simulation results is not fully considered in the simulation process. Therefore, in future research we suggest:
(1) Simulating the fluid motion characteristics of various emitter products and flow path structures under the condition of drip irrigation from the Yellow River.
(2) In determining the CFD simulation model, consider the impact of water quality on model selection.
Author Contributions
Conceptualization, J.F. and W.W.; methodology, H.L.; software, J.F.; validation, J.F., H.L., and W.W.; formal analysis, J.F.; investigation, J.F.; resources, J.F.; data curation, J.F.; writing—original draft preparation, J.F.; writing—review and editing, H.L.; visualization, H.L.; supervision, J.F.; project administration, J.F.; funding acquisition, J.F. All authors have read and agreed to the published version of the manuscript.
Funding
Both this research and the article processing charge (APC) were funded by the Scientific Research Project of Beijing Vocational College of Agriculture, grant number XY-YF-19-19 and the Beijing Outstanding Talent Training Funding Program, grant number 2018-14.
Conflicts of Interest
The authors declare no conflict of interest.
References
- Markku, J.L.; Michaela, L.; Ilkka, T.; Arja, H.; Terttu, V.; Pertti, J.M. The effects of changing water flow velocity on the formation of biofilms and water quality in pilot distribution system consisting of copper or polyethylene pipes. Water Res. 2006, 40, 2151–2160. [Google Scholar]
- Zhou, B.; Li, Y.; Xue, S.; Feng, J. Variation of microorganisms in drip irrigation systems using high-sand surface water. Agric. Water Manag. 2019, 218, 37–47. [Google Scholar] [CrossRef]
- Duran-Ros, M.; Puig-Bargués, J.; Arbat, G.; Barragán, J.; Ramírez de Cartagena, F. Effect of filter, emitter, and location on clogging when using effluents. Agric. Water Manag. 2009, 96, 67–79. [Google Scholar] [CrossRef]
- Chandra, A.; Madramootoo, J.M. Advances and challenges with micro-irrigation. Irrig. Drain. 2013, 62, 255–261. [Google Scholar]
- Megh, R.G. Management of Drip/Trickle or Micro Irrigation; Apple Academic Press: Waretown, NJ, USA, 2012. [Google Scholar]
- Wei, Q.; Lu, G.; Wang, L.; Jincan, Z. Experimental study on the multisegment regime of the water flow in drip emitters. J. Irrig. Drain. Eng. ASCE 2010, 136, 254–260. [Google Scholar]
- Li, Y.; Feng, J.; Xue, S.; Muhammad, T.; Chen, X.; Wu, N.; Li, W.; Zhou, B. Formation mechanism for emitter composite-clogging in drip irrigation system. Irrig. Sci. 2019, 37, 169–181. [Google Scholar] [CrossRef]
- Liu, Z.; Xiao, Y.; Li, Y.; Zhou, B.; Feng, J.; Han, S.; Muhammad, T. Influence of operating pressure on emitter anti-clogging performance of drip irrigation system with high-sediment water. Agric. Water Manag. 2019, 213, 174–184. [Google Scholar] [CrossRef]
- Liu, C.; Fu, G. Water World Today; Tsinghua University Press: Beijing, China, 2000; pp. 127–131. [Google Scholar]
- Liu, Y. Study on heavy metals and ecological risk assessment from Gansu, Ningxia and Inner Mongolia Sections of the Yellow River, China. Spectrosc. Spectr. Anal. 2013, 33, 3249–3254. [Google Scholar]
- Fang, H.; Chen, M.; Chen, Z. Surface Characteristics and Models of Environmental Sediment; Science Press: Beijing, China, 2009. [Google Scholar]
- Zhou, B.; Li, Y.; Song, P. Study on the characteristics of dynamic changes and the inducing mechanism of the dripper in the drip irrigation system of the Yellow River. J. Irrig. Drain. 2014, Z1, 123–128. [Google Scholar]
- Zhai, G.; Chen, G.; Zhao, W. Filtration and backwash test of quartz sand filter for micro-irrigation. J. Agric. Eng. 2007, 23, 46–50. [Google Scholar]
- Mailapalli, D.R.; Marques, P.A.A.; Thomas, K.J. Performance evaluation of hydrocyclone filter for microirrigation. Eng. Agric. 2007, 27, 373–382. [Google Scholar] [CrossRef]
- Veerapen, J.P.; Lowry, B.J.; Couturier, M.F. Design methodology for the swirl separator. Aquac. Eng. 2005, 33, 21–45. [Google Scholar] [CrossRef]
- Coelho, R.D.; Resende, R.S. Biological Clogging of Netafim’s Drippers and Recovering Process Through Chlorination Impact Treatment; ASAE: Washington, DC, USA, 2001; p. 012231. [Google Scholar]
- Zhang, W.; Niu, W.; Li, X.; Lu, M.; Yang, X.; Wen, S. Determining the first flushing time and period of capillary tubes to reduce the risk of drip blocking. Trans. Chin. Soc. Agric. Eng. 2019, 35, 70–77. [Google Scholar]
- Wang, X. Study on Anti-Blocking Performance and Structural Parameter Optimization of Drip Irrigation Bidirectional Flow Channel Irrigation Device; Xi’an University of Technology: Xi’an, China, 2019. [Google Scholar]
- Li, Y.; Li, G.; Qiu, X. Computational fluid dynamics simulation of the hydraulic characteristics of a maze dripper. J. Agric. Eng. 2005, 21, 12–15. [Google Scholar]
- Zhang, J.; Wei, G.; Zhao, W. Analysis of solid-liquid two-phase flow field in an arc-shaped flow channel in an irrigation device. China Mech. Eng. 2007, 18, 589–593. [Google Scholar]
- Yan, D.; Yang, P.; Ren, S. Analysis and CFD simulation of particulate matter transport in the dripper channel. J. Agric. Mach. 2007, 38, 71–74. [Google Scholar]
- Wei, Z.; Ca, M.; Liu, X.; Tang, Y.; Lu, B. Flow behaviour analysis and experimental investigation for emitter micro-channels. Chin. J. Mech. Eng. 2012, 25, 729–737. [Google Scholar] [CrossRef]
- Meng, G. Numerical Simulation of Flow Field in Labyrinth Dripper Channel and Optimization Design of its Structure. Ph.D. Thesis, Xi’an Jiaotong University, Xi’an, China, 2004. [Google Scholar]
- Wang, W. Study on the Dynamic Characteristics of the Flow Inside the Maze Dripper. Ph.D. Thesis, China Agricultural University, Beijing, China, 2007. [Google Scholar]
- Liu, H.S.; Li, Y.K.; Liu, Y.Z.; Yang, P.-L.; Ren, S.-M.; Wei, R.-J.; Xu, H.-B. Flow characteristics in energy dissipation units of labyrinth path in the drip irrigation emitters with DPIV technology. J. Hydrodyn. 2009, 21, 137–145. [Google Scholar] [CrossRef]
- National Technical Supervision Bureau. Agricultural Irrigation Equipment Dripper Technical Specifications and Test Methods; GB/T 17187-1997; China Standard Press: Beijing, China, 1997. [Google Scholar]
- Wei, Z.; Tang, Y.; Zhao, W. Experimental research on the structure and hydraulic performance of drip irrigation irrigation labyrinth maze. J. Agric. Mach. 2005, 36, 51–55. [Google Scholar]
- Liu, H.; Sun, H.; Li, Y.; Feng, J.; Song, P.; Zhang, M. Visualizing particle movement in flat drip irrigation emitters with digital particle image velocimetry. Irrig. Drain. 2016, 65, 390–403. [Google Scholar] [CrossRef]
- Sun, H.; Li, Y.; Feng, J.; Liu, H.; Liu, Y. Effects of flow path boundary optimizations on particle transport in drip irrigation emitters. Irrig. Drain. 2016, 65, 417–425. [Google Scholar]
- Feng, J.; Li, Y.; Sun, H.; Song, P.; Liu, H. Visualizing particle movement in cylindrical drip irrigation emitters with digital particle image velocimetry. Irrig. Drain. 2016, 65, 404–416. [Google Scholar] [CrossRef]
- Feng, J.; Li, Y.; Wang, W.; Xue, S. Effect of optimization forms of flow path on emitter hydraulic and anti-clogging performance in drip irrigation system. Irrig. Sci. 2018, 36, 37–47. [Google Scholar] [CrossRef]
© 2020 by the authors. Licensee MDPI, Basel, Switzerland. This article is an open access article distributed under the terms and conditions of the Creative Commons Attribution (CC BY) license (http://creativecommons.org/licenses/by/4.0/).


