Article

Mapping Worldwide Environmental Suitability for Artemisia annua L.

1
State Key Laboratory of Resources and Environmental Information System, Institute of Geographical Sciences and Natural Resources Research, Chinese Academy of Sciences, Beijing 100101, China
2
College of Resources and Environment, University of Chinese Academy of Sciences, Beijing 100049, China
3
Key Laboratory of Carrying Capacity Assessment for Resource and Environment, Ministry of Land and Resources, Beijing 100101, China
4
China Academy of Chinese Medical Sciences, Beijing 100700, China
5
State Key Laboratory Breeding Base of Dao-di Herbs, National Resource Center for Chinese Materia Medical, China Academy of Chinese Medical Sciences, Beijing 100700, China
*
Authors to whom correspondence should be addressed.
These authors contributed equally to this work.
Sustainability 2020, 12(4), 1309; https://doi.org/10.3390/su12041309
Submission received: 6 January 2020 / Revised: 3 February 2020 / Accepted: 4 February 2020 / Published: 11 February 2020
(This article belongs to the Section Environmental Sustainability and Applications)

Abstract

:
Artemisinin, which is isolated from the naturally occurring plant Artemisia annua L. (A. annua; Qinghao in traditional Chinese medicine), is considered to be the active ingredient in the most effective treatment for malaria. Current malaria eradication plans rely on an affordable and robust supply of artemisinin, resulting in the demand to expand the area of A. annua under cultivation. However, there is no reliable assessment of the potential land resources suitable for planting A. annua at the global scale. By explicitly incorporating the assembled contemporary occurrence records of A. annua with various spatial predictor variables, a species distribution modelling procedure was adopted to produce the first global environmental suitability map for A. annua with high geographic detail (5 × 5 km2). The estimated map reveals that the total amount of potential land resources suitable for planting A. annua is approximately 1496.56 million hectares, mainly distributed in Asia (516.50 million hectares), Europe (378.82 million hectares), North America (354.56 million hectares) and South America (172.01 million hectares). The relationships between the relevant variables and A. annua were explored, and these illustrated that the most noteworthy predictor variables were meteorological factors, followed by solar radiation factors, soil factors and topographical factors. The map provides a rigorous environmental niche baseline to support the reasonable expansion of the A. annua cultivation area.

1. Introduction

Malaria is a life-threatening parasitic disease present in vast regions of sub-Saharan Africa, South East Asia, the Americas, the Western Pacific and the Eastern Mediterranean which caused an estimated 219 million infection cases in 87 countries and approximately 435,000 deaths worldwide in 2017 [1,2]. The causative pathogen is transmitted to humans via the bites of the infective female Anopheles species of mosquito, with more than 1 billion people living in high-risk disease-transmission areas [3]. The disease impedes economic and social development through multiple channels (i.e., effects on premature mortality and fertility) [4]. To prevent malaria disease, several measures are typically used, such as deploying vector control interventions, employing rapid diagnostic tests and developing vaccines and antimalarial drugs [2,5,6].
The artemisinin or qinghaosu derivatives, the active compound isolated from the naturally occurring plant Artemisia annua L. (A. annua), have served as effective first-line antimalarial drugs that have received global attention due to the artemisinin-based combination therapies (ACTs) since the 1990s [7,8]. Efforts to eradicate malaria rely on the long-term availability and affordability of artemisinin drugs, which increases the demand to expand the area of A. annua under cultivation [3,9]. To guide reasonable expansion, research on the environmentally suitable distribution of A. annua has received increasing attention. For example, Luo et al. used meteorological indicators to classify the climate suitability of A. annua, revealing that the suitable areas were concentrated in Youyang and Xiushan of the Wuling Mountain region [10]. Huang et al. developed a geographic information system (GIS) approach to assess the potential distribution of A. annua, indicating that the bioclimatically suitable habitats were mainly distributed in the area of Guizhou, Chongqing, Hunan and Hubei [11]. Zhang et al. adopted a maximum entropy model to estimate the potential ecologically suitable areas for A. annua, showing that the more ecologically suitable areas were mainly distributed in parts of Eastern Sichuang, Guangxi, parts of Western Yunnan, Guizhou, and parts of Western Chongqing [12]. Previous studies estimating the environmental suitability distribution of A. annua were carried out at regional or national scales. However, there is no reliable assessment of the potential land resources suitable for planting A. annua at a global scale.
The growth of A. annua is affected by various environmental variables, while the influence mechanism is not clear. In this case, species distribution techniques, which could combine occurrence points with environmental variables to produce an environmental suitability map, are usually adopted to overcome it [13]. The present study aims to analyze marginal effect plots and the relative contribution of related environmental variables based on the assembled contemporary occurrence records of A. annua and a formal species distribution modelling procedure. Then, the inferred patterns are combined with maps of environmental correlates to generate the first global environmental suitability map for A. annua with high geographic detail (5 × 5 km2), which could provide a rigorous environmental niche baseline to support the reasonable expansion of the A. annua cultivation area.

2. Materials and Methods

The relationships between A. annua and environmental covariates were complex. In the present study, the boosted regression tree (BRT) modelling procedure that has been used to map potential distributions of other plants (i.e., sweet sorghum and cassava) was adopted [14,15]. The functional form of the BRT model can be found elsewhere [15]. To map the environmental suitability of A. annua, two key elements were required: 1) a series of high-resolution environmentally related spatial predictor covariates and 2) comprehensive occurrence records of known A. annua with detailed geographical coordinate information and a set of background points. It is important to note that the WGS-84 coordinate system was adopted, and various spatial predictor covariates were unified to a grid with a 0.05 × 0.05 degree (approximately 5 × 5 km2) resolution in the present study. In the data preprocessing stage, ArcMap 10.2 (http://www.esrichina.com.cn/) and Python 2.7.0 (https://www.python.org/) were used in conjunction with other extension packages, including GDAL 2.1.0 (http://www.gdal.org/) and Proj4 5.0.0 (https://proj4.org/).

2.1. Data

2.1.1. Spatial Predictor Covariates

The growth of A. annua is influenced by several environmental factors [16,17,18]. In the present study, four categories of factors, such as meteorology, solar radiation, soil and topographic conditions, were considered as important limitations affecting the potential spatial distribution of A. annua.
The first category of predictor variables included annual cumulative precipitation, mean annual temperature and mean annual water vapor pressure, which have been linked to the growth of A. annua [19]. For example, high temperatures could cause the vegetative growth of A. annua to slow, which is also not conducive to the synthesis and accumulation of artemisinin in the plant [10]. In addition, the seedlings of A. annua have strict requirements related to water supply and are susceptible to drought and waterlogging [20]. In the present study, the first category of predictor variables was downloaded from the website of the WorldClim version 2.0 database (http://www.worldclim.com/).
The second category of predictor variables was indicative of solar radiation. The growth of plants is inseparable from solar radiation. In the present study, the mean solar radiation dataset, taken from the website of the WorldClim version 2.0 database was adopted to reflect the intensity of solar radiation at a given location.
The third set of predictor variables was soil factors. Previous studies have illustrated a link between soil factors and the growth of A. annua [11,12]. For instance, seedlings grow more easily in a moist soil environment than in other environments [17]. Taking into account the availability of soil-related datasets at a global scale, soil water content, soil class and soil depth were adopted in the present study and were obtained from the World Soil Information (http://www.isric.org/) website.
The last set of predictor variables was indicative of topography conditions. This set included elevation and slope, which play important roles in the growth of plants [17,21]. From the website of the Consultative Group on International Agricultural Research (CGIAR) Consortium for Spatial Information (http://srtm.csi.cgiar.org), the global elevation dataset with a 90 m spatial resolution was downloaded. In addition, the slope dataset was generated by the tools of ArcGIS 10.2 based on the elevation dataset. Detailed information on the related spatial predictor covariates used in this study is shown in Table 1.

2.1.2. Occurrence Records and Background Points

The assembled contemporary occurrence records of A. annua consisted of two parts. The first part contained 3341 records of A. annua occurrence points observed with detailed geographical coordinate information, which were obtained from the website of the Global Biodiversity Information Facility (http://www.gbif.org). The second part contained 1956 records of A. annua occurrence points observed in China, which were obtained from the National Resource Center for Chinese Materia Medical (http://www.nrc.ac.cn/), China Academy of Chinese Medical Sciences. To map the environmental suitability of A. annua, the BRT modelling procedure also required background points as input data. Based on the website of the Ecocrop database (http://ecocrop.fao.org/), in comparison to other areas, areas where the mean temperature is <10 °C or where the annual cumulative precipitation is <600 mm or >1300 mm are less suitable for planting A. annua and were used as the basis for screening the background points.

2.2. Modelling Analyses

The R version 3.3.3 statistical programming environment was used in combination with the extension packages (i.e., dismo, caret and gbm) to build the BRT model and evaluate simulation accuracy. Notably, the assembled contemporary occurrence records of A. annua needed to be converted to grid units with a 0.05 × 0.05 degree (approximately 5 × 5 km2) resolution based on geographical coordinate information. In the present study, 1498 grid units reflecting suitable environmental conditions were obtained. In addition, the same number of background points reflecting unsuitable environmental conditions for growing A. annua was randomly selected. To reduce the influence of background points on the simulation, the step of randomly selecting background points was performed 100 times. During each iteration, 2996 samples were constructed and divided into training samples and validation samples. In the present study, training samples and validation samples accounted for 50% of the total sample. An ensemble of 100 BRT models was fitted, and a ten-fold cross-validation method was used to avoid over-fitting during the training process. The main parameters (i.e., tree.complexity = 4, learning.rate = 0.005, step.size = 10 and bag.fraction = 0.75) of the BRT models were tuned according to the experiences noted in previous studies [22,23], and the other parameters were set at default values. The area under the curve (AUC) was adopted to assess the performances of the ensemble BRT models. In addition, a relative contribution (RC) indicator was used to quantify the contribution of each spatial predictor variable to the ensemble BRT models.

3. Results

3.1. Relative Contribution of the Spatial Predictor Variables

Table 2 reveals the relative contribution (RC) of the related spatial predictor variables during the modelling analysis process. In the present study, the meteorological factors, accounting for 78.88% of the variation explained by the ensemble BRT models, were the most important predictor variables in the model, followed by the solar radiation factors (RC 15.16%), soil factors (RC 3.04%) and topographical factors (RC 2.92%). In parallel, the most noteworthy predictor variables were, in decreasing order of RC values, mean annual temperature (RC 40.03% ± 3.98%), accumulated annual precipitation (RC 27.50% ± 4.86%), mean annual water vapor pressure (RC 11.35% ± 4.55%), mean solar radiation (RC 15.16% ± 1.80%), soil water content (RC 1.94% ± 0.96%), elevation (RC 1.73% ± 0.37%), slope (RC 1.19% ± 0.30%), soil class (RC 0.72% ± 0.59%), and soil depth (RC 0.38% ± 0.20%). Figure 1 presents the marginal effect curves of the main spatial predictors (RC > 1.50%) over all 100 BRT ensembles. The relationship between the probability of suitable land for A. annua and the mean annual temperature was complex. For example, an increase in the probability of suitable land for A. annua was observed as the mean annual temperature initially increased, while there was a negative association when the mean annual temperature was higher than 15 °C. The profiles of accumulated annual precipitation, solar radiation and elevation also showed complex associations. For the mean annual water vapor pressure and soil water content, the profiles depicted positive associations.

3.2. Potential Environmental Suitability for A. annua Worldwide

Figure S1 shows the regions where it is potentially suitable for growing A. annua that were generated by calculating the mean prediction values across all models for each 5 × 5 km2 grid cell. The potentially suitable areas are predicted to be distributed primarily around the mid-latitude regions: Eastern North America and the West Coast of North America, Central South America, Europe, Central and Southern Africa, Central and Eastern Asia and Southeast Oceania. In North America, the potential areas suitable for A. annua are mainly distributed in Southern Canada, Central and Southern Mexico and most parts of the United States. In South America, the potential areas are mainly located in the coastal area, which includes Ecuador, Peru, Chile, Argentina, Uruguay and the southeastern coast of Brazil. The suitable areas in Europe are primarily distributed in the Mediterranean region. In Africa, northern regions are not suitable for growing A. annua, whereas parts of the central and southern regions (Rwanda, Burundi, Angola, Swaziland and Lesotho) are suitable. In Asia, the potential areas suitable for A. annua are mainly distributed in Central and Eastern Asia, which includes Kyrgyzstan, Tajikistan, China, Japan and Korea. In Oceania, the southeast coast of Australia and New Zealand are suitable for growing A. annua. In addition, the estimated potential environmental suitability maps produced from the lower and upper bounds of the 95% confidence intervals of the ensemble BRT models are shown in Figure S2.

3.3. Accuracy Evaluation

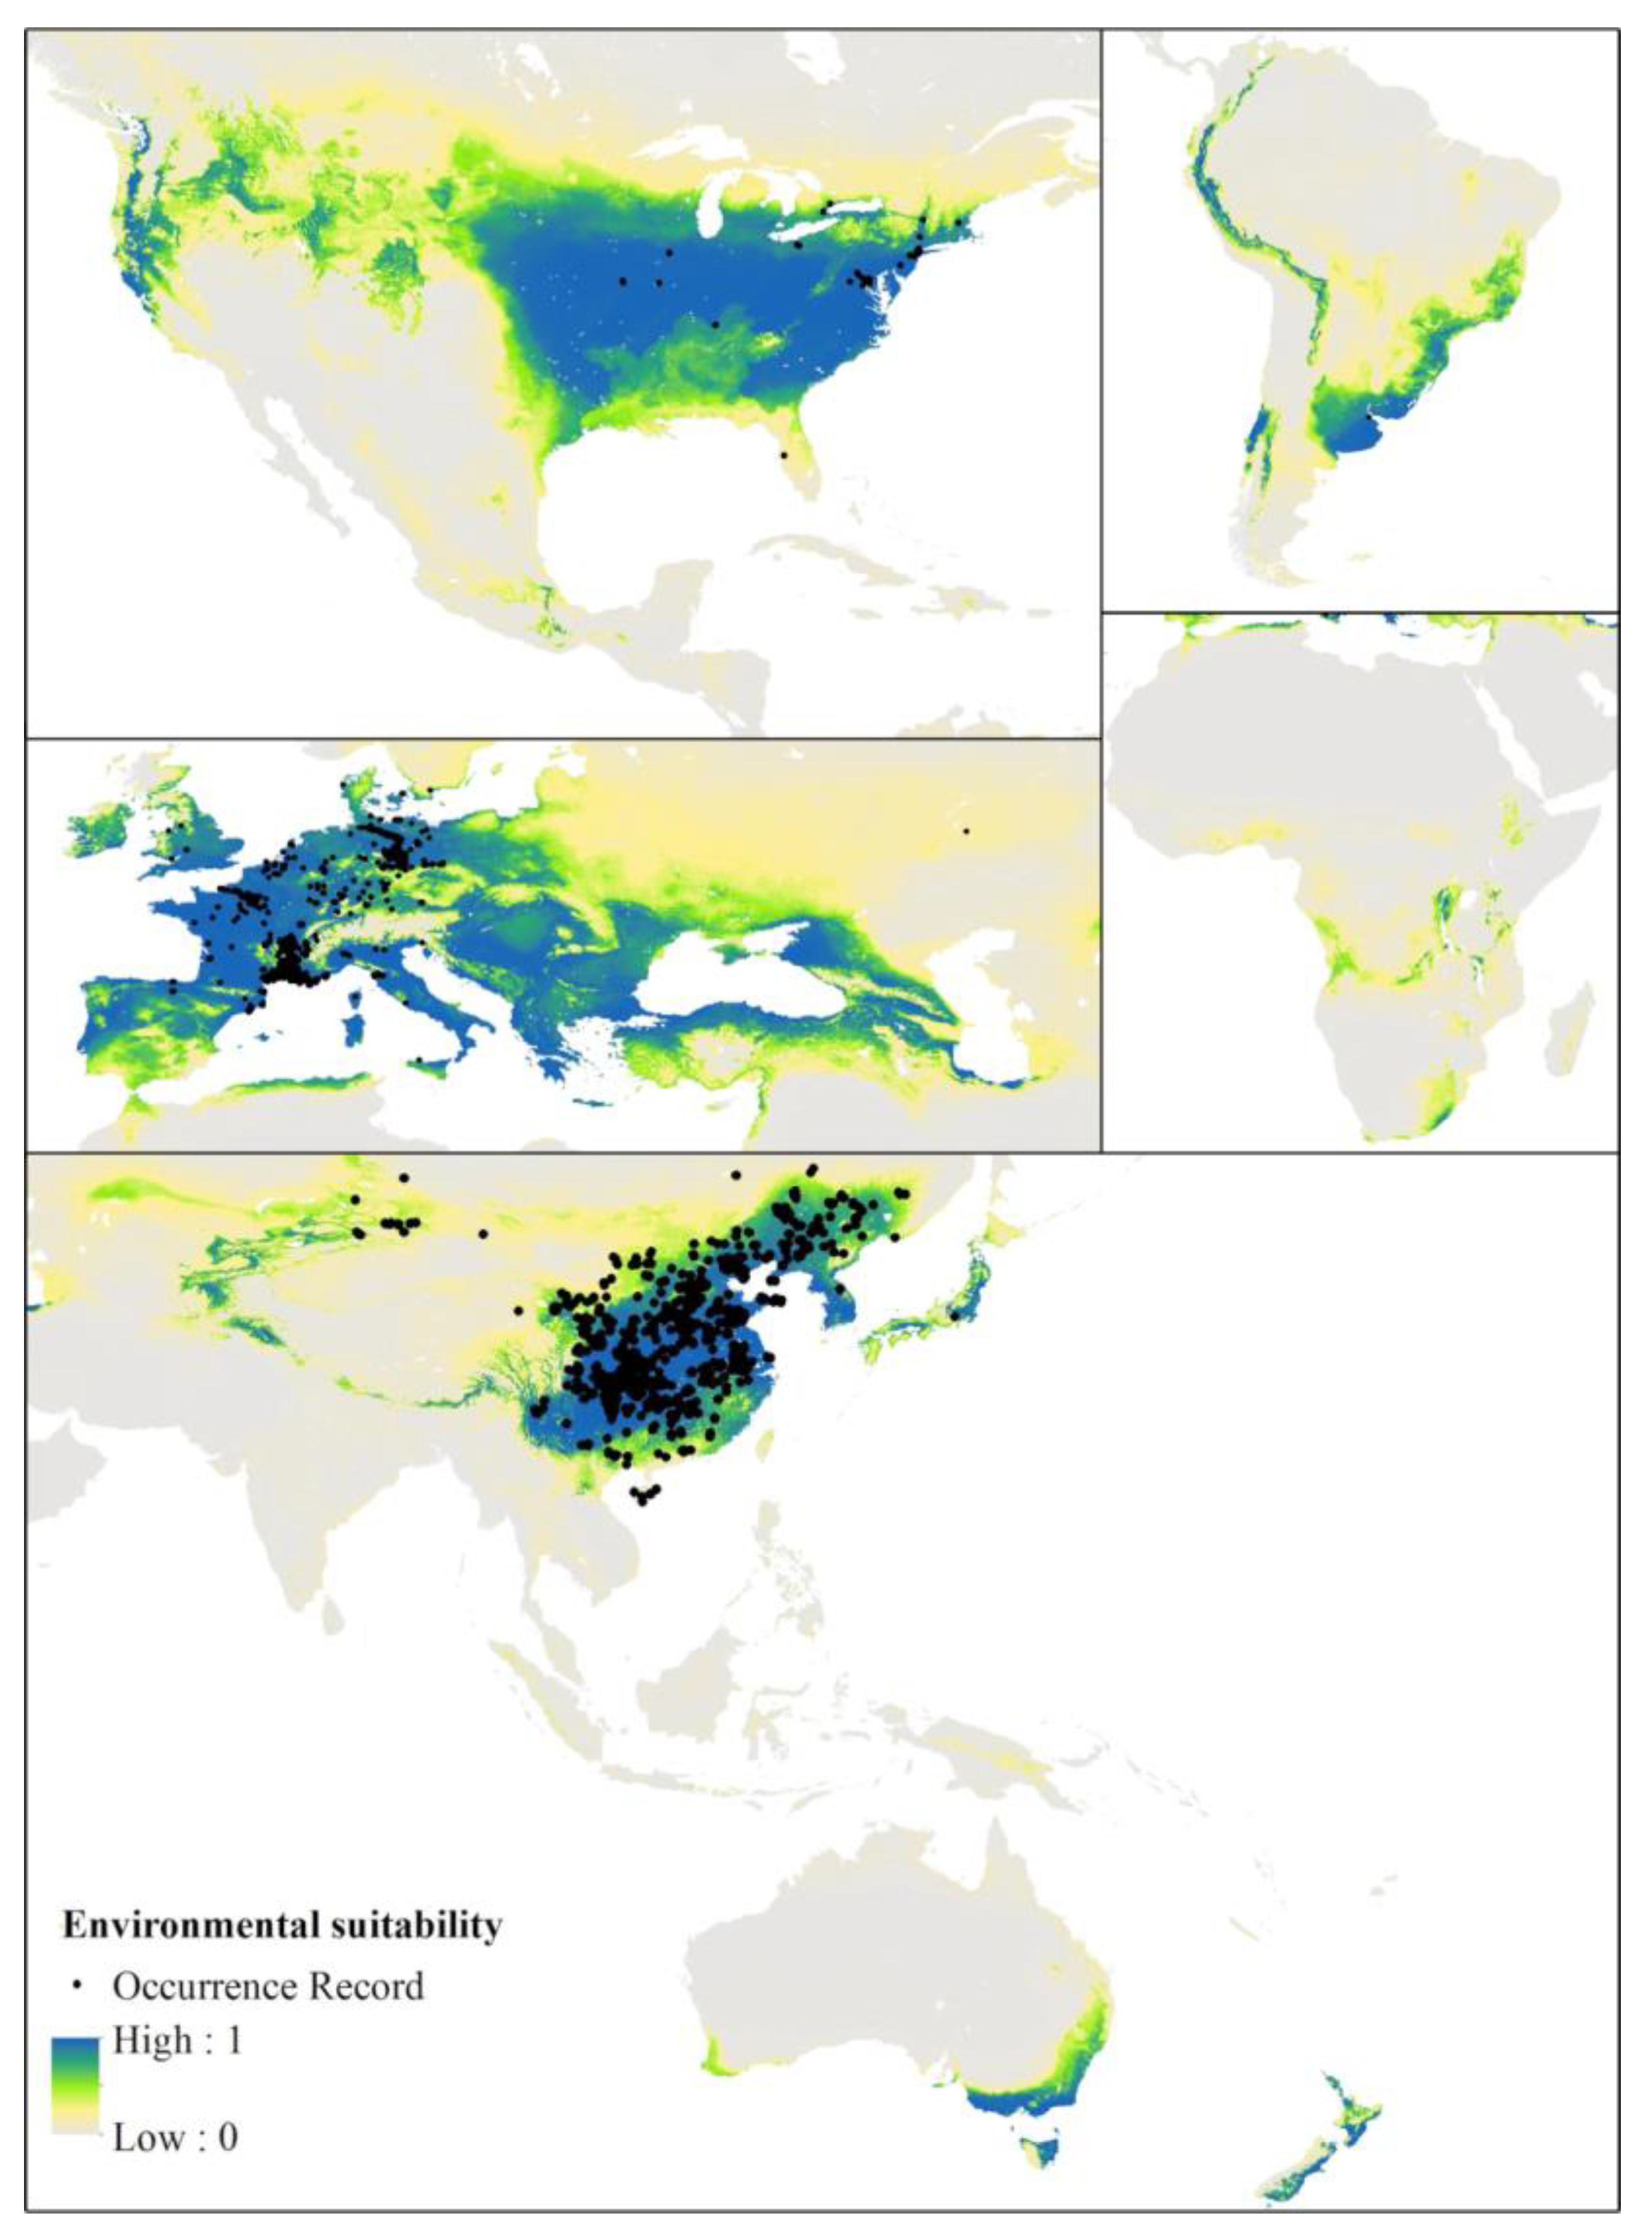
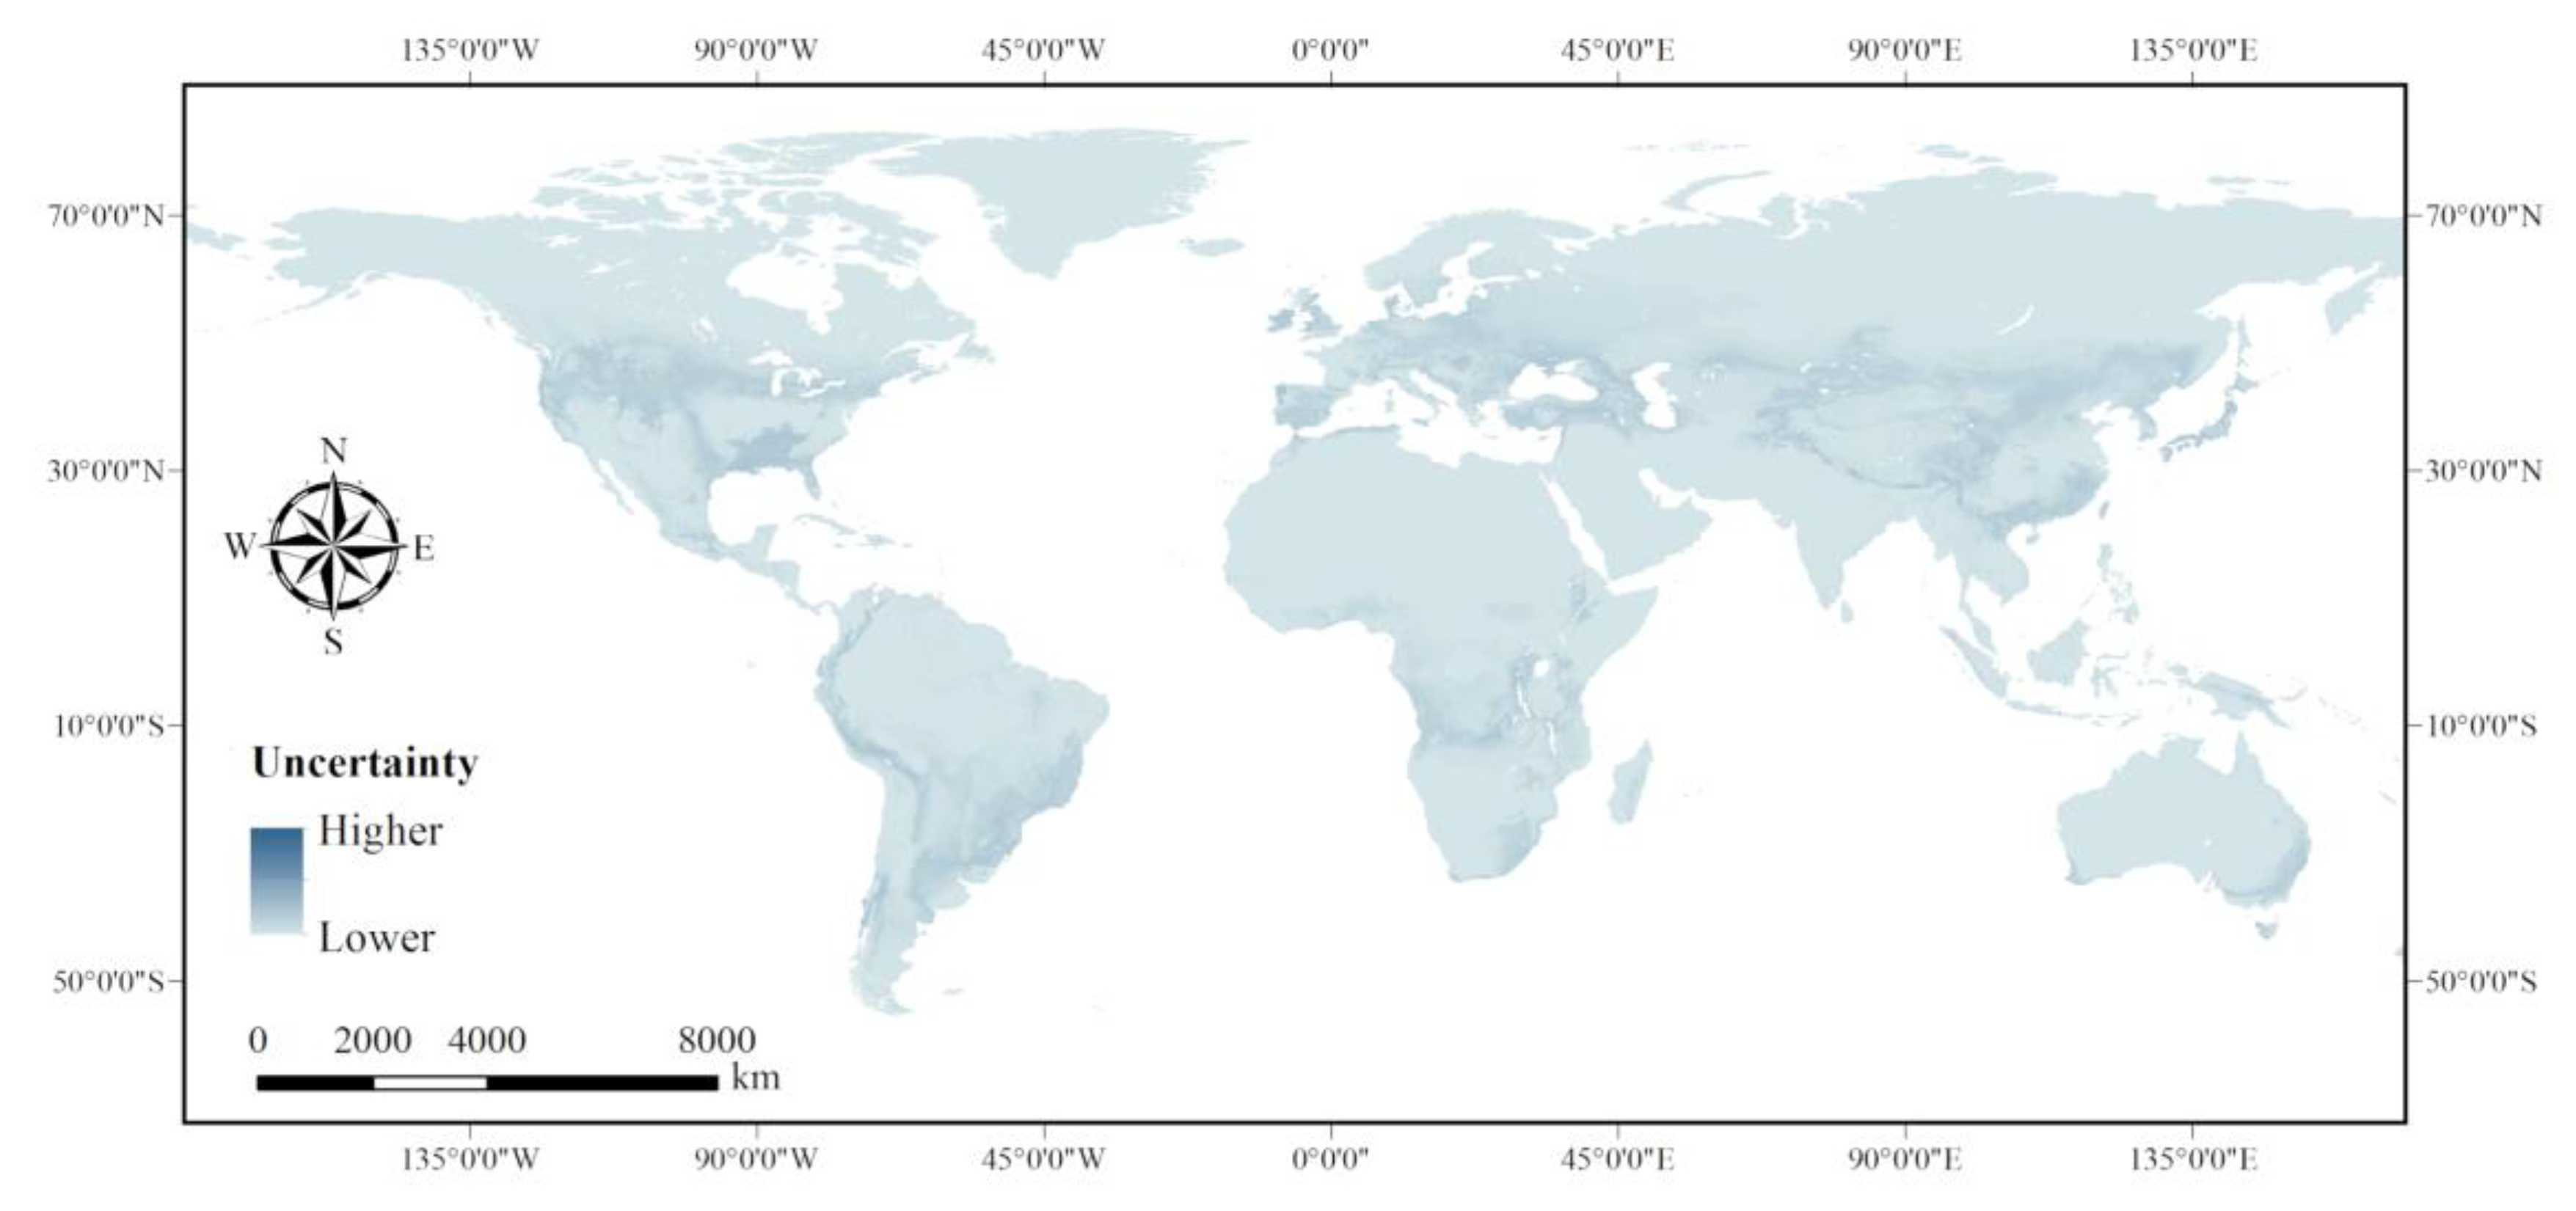
The known global occurrence data of A. annua include 5297 points, which are shown in Figure 2. These sample points are scattered around the world, most of which are located in Central North America, Western Europe and China. Viewed in terms of visual effects, the environmental suitability is relatively higher in some regions where the occurrence points are distributed than in other regions. The BRT model obtained good predictive performance for both training datasets (a 10-fold cross-validation of AUC = 0.983 ± 0.002) and test datasets (AUC = 0.983 ± 0.002). Moreover, the uncertainty of the spatial prediction is quantified in Figure 3 using standard deviation values, which indicates that the uncertainty is at a low level on the whole.

3.4. Potential Land Resources Suitable for A. annua

The environmental suitability map was transformed into a binary map by defining 0.5 as the threshold, which distinguished each 5 × 5 km2 grid cell as to whether the land resource was suitable or unsuitable for growing A. annua. The global potential area suitable for growing A. annua was estimated and is listed in Table 3. The total amount of suitable land worldwide is 1496.56 million hectares. Asia has the largest A. annua suitable land area of 516.50 million hectares, the second largest suitable land area is in Europe with 378.82 million hectares, followed by North America with 354.56 million hectares. Africa has the smallest suitable land area with only 25.50 million hectares, which is less than Oceania’s 49.17 million hectares and South America’s 172.01 million hectares. Of the top ten countries with the most suitable land, China has the largest suitable growing area for A. annua, with 391.49 million hectares, followed by the United States (349.60 million hectares), Argentina (61.10 million hectares), France (60.25 million hectares) and Brazil (52.65 million hectares). In addition, the suitable land area in any of the remaining eight countries is less than 40.00 million hectares, such as Spain (39.10 million hectares), Germany (36.49 million hectares), Turkey (36.36 million hectares) and Italy (28.71 million hectares). In addition to the ten countries mentioned above, there are 96 other countries that have suitable land for A. annua, with a total of 405.89 million hectares. The global potential area suitable for growing A. annua was also analysed based on the estimated potential environmental suitability maps produced from the lower and upper bounds of the 95% confidence intervals of the ensemble BRT models, as shown in Table S1.

4. Discussion

The global health community is reaching a consensus that malaria eradication is a favorable investment both morally and economically [24]. Current malaria eradication plans rely on the long-term availability and affordability of artemisinin. Given the high cost of the chemical synthesis of artemisinin, expanding the area of A. annua under cultivation seems to be the only current solution. In the present study, a species distribution modelling procedure was combined with the assembled contemporary occurrence records of A. annua and various spatial predictor variables to generate the first global environmental suitability map for A. annua with high geographic detail (5 × 5 km2). The estimated map could assist in the rational layout of the cultivation area of A. annua at a large scale.
A. annua is widely distributed in subtropical, temperate and cold regions of North America, Europe and Asia, such as Canada, the United States, France, Italy and China [17,25,26], which is consistent with the final estimated map. The estimated map also revealed that the potential land resources suitable for A. annua are mainly distributed around the mid-latitude regions (i.e., the southeastern coast of Brazil and Australia), and land resources are minimal in Africa. However, the global malaria burden is concentrated in the tropical and subtropical zones, especially in Africa [4,27]. For example, according to a report of the WHO, 92% of malaria cases and 93% of malaria deaths worldwide occurred in Africa in 2017, and 98% of ACT treatment courses delivered by national malaria programs were also in the region during the period from 2010 to 2017 [2]. Thus, the international community should strengthen cooperation to resolve the spatial mismatch between the malaria burden and the land resources suitable for planting A. annua.
In the present study, the potential land resources suitable for planting A. annua were analyzed from the perspective of environmental suitability. It is important to note that the environmental-related spatial predictor variables used in the present study may not be comprehensive, and other constraints (i.e., carbon dioxide concentration and mineral nutrition) [16,18] were not adopted due to the lack of high-spatial-resolution data. A reasonable expansion of the A. annua cultivation area is a complex plan. For example, cutting trees to plant A. annua will destroy the ecosystem, and the remoteness of the planting area will increase transportation costs [17]. In future research, the development of the A. annua industry with better economic benefits and less loss of the ecological environment will be explored based on a biophysical biogeochemical model (i.e., GEPIC). Additionally, a general circulation model will be combined with BRT models to investigate the potential effect of global warming impacts on the artemisinin production area for the years 2030 and 2050.

5. Conclusions

For the four categories of factors, the inferred patterns derived from the ensemble BRT models revealed that meteorological factors are the most important predictor variables in the present study. In terms of the RC of the individual factors, the most noteworthy predictor variables were mean annual temperature, accumulated annual precipitation, mean annual water vapor pressure, mean solar radiation, soil water content and elevation (RC > 1.50%). The estimated first global environmental suitability map for A. annua illustrated that the potential suitable areas are mainly distributed around the mid-latitude regions, including Eastern North America and the West Coast of North America, Central South America, Europe, Central and Southern Africa, Central and Eastern Asia and Southeast Oceania. In addition, potential land resources suitable for A. annua in each region were also evaluated. The final map provided a rigorous environmental niche baseline to support the reasonable expansion of the A. annua cultivation area.

Supplementary Materials

The following are available online at https://www.mdpi.com/2071-1050/12/4/1309/s1, Figure S1: The estimated potential environmental suitability map for A. annua with environmental suitability levels from 0 (grey) to 1 (bluish green), Figure S2: The estimated potential environmental suitability maps produced from the lower (a) and upper (b) bounds of the 95% confidence intervals of the ensemble BRT models, Table S1: The estimated potential land resources suitable for A. annua within the top ten countries and major global regions based on the estimated potential environmental suitability maps produced from the lower and upper bounds of the 95% confidence intervals of the ensemble BRT models.

Author Contributions

Conceptualization, F.D., X.Z. and D.J.; Methodology, F.D.; Resources, L.H. and D.J.; Software, F.D., Q.W. and S.C.; Supervision, D.J.; Validation, F.D. and D.W.; Visualization, F.D., T.M. and M.H.; Writing—original draft, F.D. and T.M.; Writing—review & editing, F.D., X.Z. and D.J. All authors have read and agreed to the published version of the manuscript.

Funding

This research was funded by the Strategic Priority Research Program of the Chinese Academy of Sciences (XDA19040305), the Fourth National General-survey on the Chinese Material Medica Resources (GGY-KJS-2018-004) and the Special Project for Basic Work of Science and Technology “Spatial Grid Fusion and Sharing for Chinese Material Medica Resources and Its Relevant Basic Data” (2013FY114500).

Acknowledgments

We thank Qiaoling Zhu for providing valuable suggestions and myriad research staff who participated in compiling the most comprehensive occurrence dataset of A. annua.

Conflicts of Interest

The authors declare no conflict of interest.

References

  1. Vlassov, V. Global, regional and national incidence and death for HIV, tuberculosis and malaria during 1990–2013: A systematic analysis for the global burden of disease study 2013. Lancet 2011, 384, 1005. [Google Scholar]
  2. WHO. World Malaria Report 2018; World Health Organization: Geneva, Switzerland, 2018. [Google Scholar]
  3. Graham, I.A.; Besser, K.; Blumer, S.; Branigan, C.A.; Czechowski, T.; Elias, L.; Guterman, I.; Harvey, D.; Isaac, P.G.; Khan, A.M.; et al. The Genetic Map of Artemisia annua L. Identifies Loci Affecting Yield of the Antimalarial Drug Artemisinin. Science 2010, 327, 328–331. [Google Scholar] [CrossRef] [PubMed]
  4. Jeffrey, S.; Pia, M. The economic and social burden of malaria. Nature 2002, 415, 680–685. [Google Scholar]
  5. Koenraadt, C.J.M.; Takken, W. Integrated approach to malaria control. Science 2018, 359, 528–529. [Google Scholar] [PubMed]
  6. Greenwood, B. Progress with the PfSPZ Vaccine for malaria. Lancet Infect. Dis. 2017, 17, 463–464. [Google Scholar] [CrossRef]
  7. Klayman, D. Qinghaosu (artemisinin): An antimalarial drug from China. Science 1985, 228, 1049–1055. [Google Scholar] [CrossRef] [Green Version]
  8. Wang, J.; Xu, C.; Liao, F.L.; Jiang, T.; Krishna, S.; Tu, Y. A Temporizing Solution to Artemisinin Resistance. N. Engl. J. Med. 2019, 380, 2087–2089. [Google Scholar] [CrossRef]
  9. Dondorp, A.M.; Fairhurst, R.M.; Slutsker, L.; MacArthur, J.R.; Breman, J.G.; Guérin, P.J.; Wellems, T.E.; Ringwald, P.; Newman, R.D.; Plowe, C.V. The threat of artemisinin-resistant malaria. N. Engl. J. Med. 2011, 365, 1073–1075. [Google Scholar] [CrossRef] [Green Version]
  10. Luo, Z.Z.; Yang, S.Q.; Zeng, Y.M. Study on the Climate Adaptability and Division of Artemisia annua. Chongqing J. Southwest Univ. 2013, 35, 139–143. [Google Scholar]
  11. Huang, L.; Xie, C.; Duan, B.; Chen, S. Mapping the potential distribution of high artemisinin-yielding Artemisia annua L. (Qinghao) in China with a geographic information system. Chin. Med. 2010, 5, 18. [Google Scholar] [CrossRef] [Green Version]
  12. Zhang, Q.; Wen, J.; Guo, J.; Sun, C.; Xie, C. Production regionalization of medicinal sweet wormwood Artemisia annua. J. Plant Prot. 2018, 45, 501–503. [Google Scholar]
  13. Pecchi, M.; Marchi, M.; Burton, V.; Giannetti, F.; Moriondo, M.; Bernetti, I.; Bindi, M.; Chirici, G. Species distribution modelling to support forest management. A literature review. Ecol. Model. 2019, 411, 108817. [Google Scholar] [CrossRef]
  14. Jiang, N.; Ma, T.; Ding, F.; Fu, J.; Hao, M.; Wang, Q.; Chen, S. Mapping Global Environmental Suitability for Sorghum bicolor (L.) Moench. Energies 2019, 12, 1928. [Google Scholar] [CrossRef] [Green Version]
  15. Jiang, N.; Wang, Q.; Ding, F.; Fu, J.; Hao, M. Potential marginal land resources of cassava worldwide: A data-driven analysis. Renew. Sustain. Energy Rev. 2019, 104, 167–173. [Google Scholar] [CrossRef]
  16. Herrmann, S.; Jessing, K.K.; Jørgensen, N.O.; Cedergreen, N.; Kandeler, E.; Strobel, B.W. Distribution and ecological impact of artemisinin derived from Artemisia annua L. in an agricultural ecosystem. Soil Boil. Biochem. 2013, 57, 164–172. [Google Scholar] [CrossRef]
  17. Ferreira, J.F.; Laughlin, J.C.; Delabays, N.; De Magalhães, P. Cultivation and genetics of Artemisia annua L. for increased production of the antimalarial artemisinin. Plant Genet. Resour. 2005, 3, 206–229. [Google Scholar] [CrossRef] [Green Version]
  18. Aftab, T.; Ferreira, J.F.S.; Khan, M.M.; Naeem, M. Artemisia annua—Pharmacology and Biotechnology; Aftab, T., Ferreira, J.F.S., Khan, M.M., Naeem, M., Eds.; Springer: Heidelberg, Germany, 2014. [Google Scholar]
  19. Thu, B.T.T.; Van Minh, T.; Lim, B.P.; Keng, C.L. Effects of Environmental Factors on Growth and Artemisinin Content of Artemisia annua L. Trop. Life Sci. Res. 2011, 22, 37–43. [Google Scholar]
  20. WHO. Artemisia annua Plantation and Harvest Quality Management Practices; WHO: Geneva, Switzerland, 2007. [Google Scholar]
  21. Jiang, D.; Hao, M.; Fu, J.; Zhuang, D.; Huang, Y. Spatial-temporal variation of marginal land suitable for energy plants from 1990 to 2010 in china. Sci. Rep. 2014, 4, 5816. [Google Scholar] [CrossRef] [Green Version]
  22. Zheng, C.; Jiang, N.; Ding, F.; Fu, J.; Hao, M. Spatiotemporal Patterns and Risk Factors for Scrub Typhus from 2007 to 2017 in Southern China. Clin. Infect. Dis. 2018, 69, 1205–1211. [Google Scholar] [CrossRef]
  23. Messina, J.P.; Kraemer, M.U.; Brady, O.J.; Pigott, D.M.; Shearer, F.M.; Weiss, D.J.; Golding, N.; Ruktanonchai, C.W.; Gething, P.W.; Cohn, E.; et al. Mapping global environmental suitability for Zika virus. eLife 2016, 5, 15272. [Google Scholar] [CrossRef]
  24. Chen, I.; Cooney, R.A.; Feachem, R.G.; Lal, A.; Mpanju-Shumbusho, W. The Lancet Commission on malaria eradication. Lancet 2018, 391, 1556–1558. [Google Scholar] [CrossRef]
  25. Wang, H.; Li, H.; Zeng, F.-L.; Xie, C.-X. Spatial Distribution and Global Potential Suitability Regions of Artemisia annua. J. Chin. Med. Mater. 2015, 38, 460. [Google Scholar]
  26. Chen, S.; Xiang, L.; Li, L.; Wu, L.; Huang, L.; Zhang, N.; Sun, P. Global strategy and raw material production on artemisinin resources regeneration. Chin. Sci. Bull. 2017, 62, 1982–1996. [Google Scholar] [CrossRef]
  27. Hay, S.I.; Guerra, C.A.; Tatem, A.J.; Noor, A.M.; Snow, R.W. The global distribution and population at risk of malaria: Past, present, and future. Lancet Infect. Dis. 2004, 4, 327–336. [Google Scholar] [CrossRef] [Green Version]
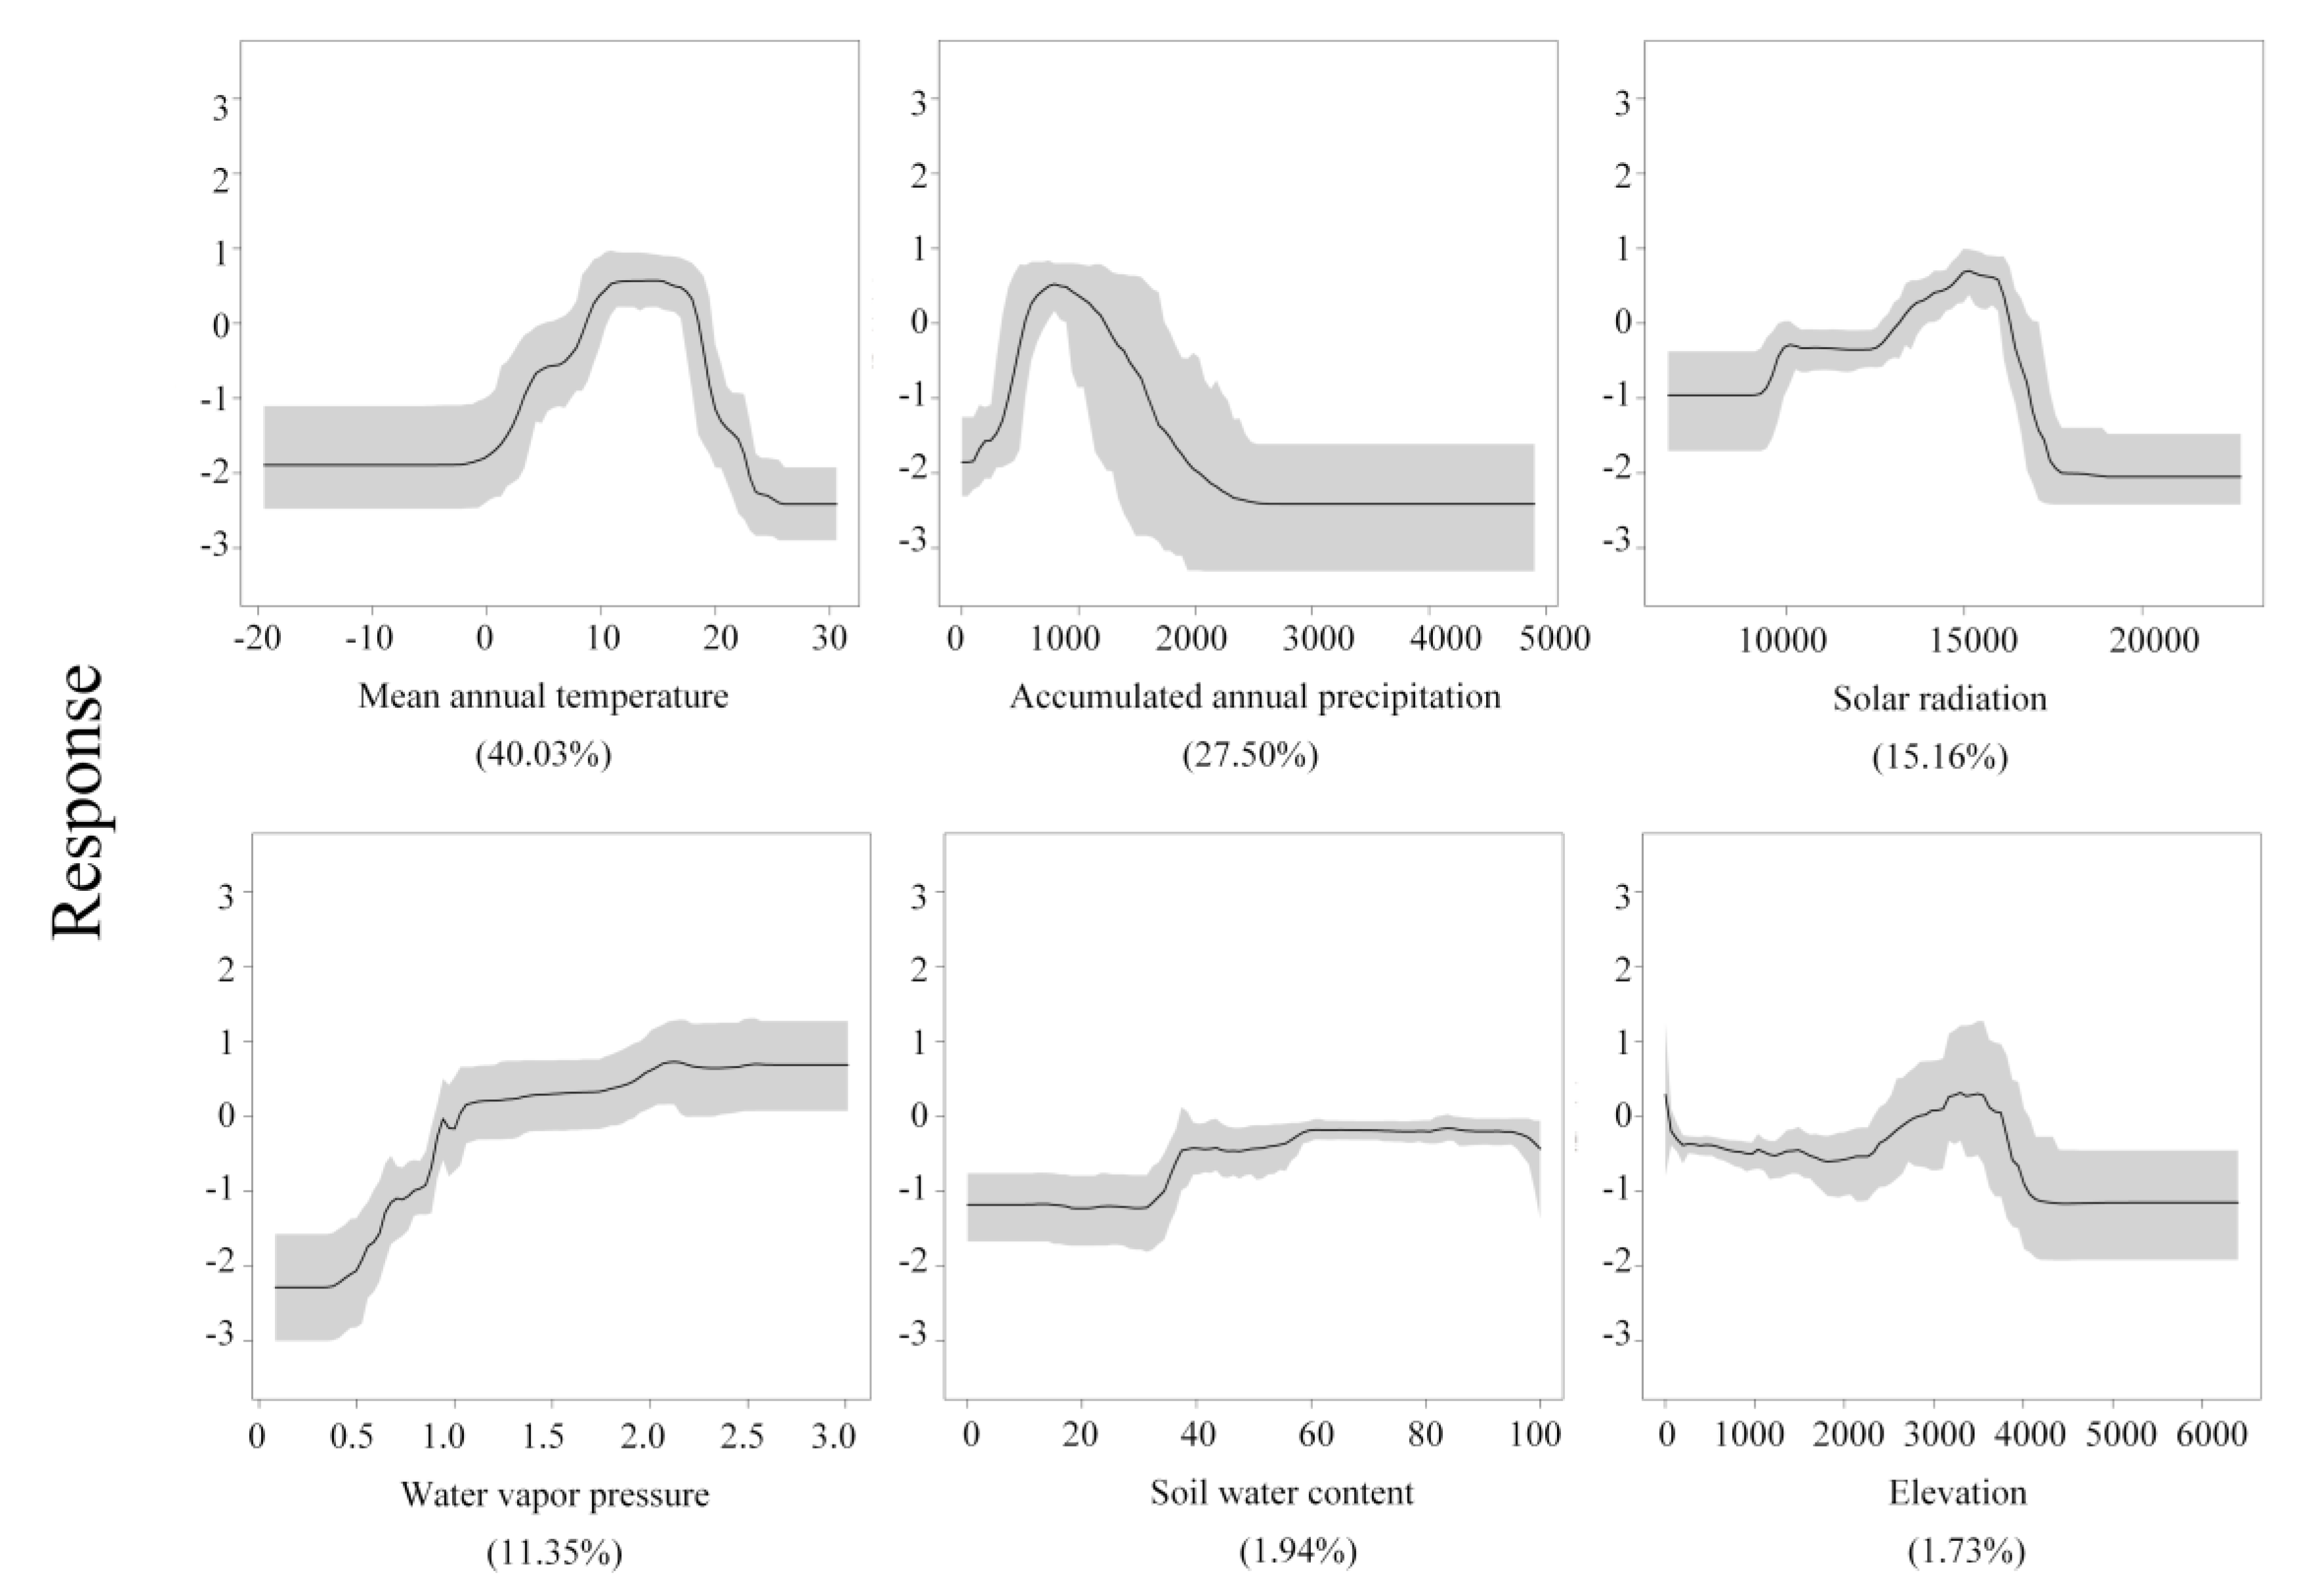
Figure 1. Marginal effect plots of main spatial predictors over all 100 boosted regression tree (BRT) ensembles fitted to the full data set. The black lines depict the mean effect curves, and the shaded areas represent the 95% confidence interval.
Sustainability 12 01309 g001
Figure 2. The distribution of the occurrence records for A. annua plotted on the predicted potential environmental suitability map.
Sustainability 12 01309 g002
Figure 3. Visualization of pixel-wise uncertainty in spatial prediction based on standard deviation values calculated for each pixel across the model ensemble.
Sustainability 12 01309 g003
Table 1. The spatial predictor covariates adopted in this study.
CategoryPredictor VariablesData Source
MeteorologyAnnual cumulative precipitation (mm)WorldClim database, version 2.0
Mean annual temperature (°C)
Mean annual water vapor pressure (kPa)
Solar radiationMean solar radiation (kJ m−2 day−1)WorldClim database, version 2.0
SoilSoil water content (%)World Soil Information
Soil class
Soil depth (mm)
TopographyElevation (m)CGIAR Consortium for Spatial Information
Slope (°)
Table 2. The relative contribution of the related spatial predictor variables.
Mean Relative Importance (%)Standard Deviation (%)
Meteorological factors †78.88
 Mean annual temperature40.033.98
 Accumulated annual precipitation27.504.86
 Mean annual water vapor pressure11.354.55
Solar radiation factor †15.16
 Mean solar radiation15.161.80
Soil factors †3.04
 Soil water content1.940.96
 Soil class0.720.59
 Soil depth0.380.20
Topographical factors †2.92
 Elevation1.730.37
 Slope1.190.30
† Sum of the relative contribution for each category.
Table 3. Potential land resources suitable for A. annua within the top ten countries and major global regions.
Region/CountryEstimated Potential Area (million hectares)
Asia 516.50
 China391.49
 Turkey36.36
North America354.56
 United States349.60
Europe378.82
 France60.25
 Spain39.10
 Germany36.49
 Italy28.71
South America172.01
 Argentina61.10
 Brazil52.65
Oceania 49.17
 Australia34.92
Africa25.50
World1496.56