1. Introduction
Freight transport within cities, due to its importance in the economic functioning of the city as well as through its positive and negative impacts on the inhabitant life quality, is a major challenge. When regulatory levers (limited traffic within certain time intervals and itineraries, weight, gauge and speed limitations, limitations of the negative effects attributed to traffic, local and global pollution), used by communities for a long time became more and more severe, the urges for reflections regarding actions for a higher quality urban distribution (environmental, economic and social) are becoming more frequent and comprehensive [
1,
2,
3,
4,
5].
The decisions in urban distribution should not affect the commercial dynamism and attractiveness of cities for housing and other activities [
4,
5,
6,
7]. The flow of goods related to urban logistics, by size, frequency and structure are considered as being part of the large distribution [
8,
9,
10,
11], characterized by a flexible movement logic specific to the consumer goods (agri-food products, confections, household equipment, etc.) of large or medium series, but very differentiated (high number of references in a range). This type of distribution requires sophisticated logistics: fast transport, reliable, and flexible [
12,
13]. Market interactions, the use of information systems, and the modern means of communication, as well as the high frequency of shipments, complete the attributes of the large distribution for which, from the transportation viewpoint, outsourced road transport is required, with just-in-time deliveries [
14,
15].
The results of this paper come from the study of the possibility of grouping/consolidating the goods-flow specific to large distribution at the boundary of urban areas, under the conditions of mutualization between logistic platforms of one or more distributors.
The research initiation presented in this paper was motivated by the accelerated development of new markets (with networks of shopping centers for gardens, DIY, sports, etc.) as well as of new expectations in product distribution. The latter would stimulate the growth of new logistic platforms that are large users of land in the proximity of the urban agglomeration [
16]. The horizontal collaboration between logistic platforms would be able to delay the development of new logistic platforms and new road access routes, which also affect the space destined to agriculture. By means of such studies, the public decision makers should act for materializing mutualization projects in order to rationalize the number of logistic platforms for the large distribution. By doing that, they fulfill their responsibilities related to the rational use of the territory.
This research aims to provide solutions for the supply of four existing urban distribution centers (UDCs) under the restrictions given by the road infrastructures. Each supplier (or group of suppliers) is assigned to one UDC function of its accessibility on the road network and traffic congestion. Then, a collaborative logistics scheme is proposed for the four UDCs. By this scheme, each UDC receives all product categories and can form consolidated consignments for urban distribution. The negative external effects of UDC supply are reduced. Furthermore, the negative consequences of the goods distribution in the urban area are diminished. The issue consists in finding solutions for horizontal collaboration between UDCs, that lead to minimum energy consumption and pollution.
The paper is organized as follows: it begins with a presentation of the research framework; the next section describes the scenarios and premises considered in the flow consolidation scheme, together with the method applied in order to choose the solution; afterwards, the results obtained for the defined scenarios are discussed. The paper ends with conclusions regarding the solutions for horizontal cooperation as well as suggestions for future research.
2. Literature Review
Several logistic models have followed one another in the last two decades. After designing the vertical logistics chains (especially in the case of the distribution of agri-food products), the logistics providers (3PL and 4PL) initiated experiments of horizontal mutualization of the logistic structures [
17,
18]. There was a reconfiguration of the logistics chains. Synthetically, the evolution of the logistic models highlights three types of logistic models [
14,
15,
19]:
Type 1 model (1970s), direct delivery from manufacturers to merchant stores;
Type 2 model (1980s), delivery from the manufacturer to the distributor warehouses and creation of distributor storage platforms;
Type 3 model (after 2005), delivery from the producers to the warehouses of several producers and from here to the warehouses of the distributors.
In the last years, another type of logistics model (type 4 model) has been experimented with. It aims at the mutualization between industrial platforms and/or between platforms of distributors, that is a horizontal mutualization between different logistics providers in order to group the flow for a certain destination so as to obtain benefits at the level of [
20,
21,
22,
23,
24,
25]:
Freight transport (better loading and organization of the traffic of the transport vehicles involved);
Services (better reactivity by increasing delivery frequencies);
Quality of life (better matching the demands of sustainable development).
These objectives motivated doing numerous studies in order to assess the nature and the scale of the logistics effects. It was proved that reducing the environmental problems involved in freight transport requires far more complex measures than using vehicles with lower energy consumption and less emissions. Therefore, perspectives of wider supply management, based on the companies’ cooperation, have been developed to minimize the logistics impact [
20,
26,
27].
Urban freight transport initiatives to achieve sustainability goals include logistic schemes with consolidation centers. Several studies emphasize the main advantages and disadvantages of these schemes [
7,
16,
25,
28]. In order to identify the appropriate logistic scheme, more research is needed on how to quantify the operational and environmental impact of different logistic scenarios [
20,
28].
This study is performed in relation to the goals of environmental sustainability and the main characteristics of the urban area in question. The study proposes a methodology to select solutions for horizontal collaboration in order to consolidate flow at the boundary of urban congested areas. The horizontal collaboration purpose is to reduce the resources consumption (energy, idle time in logistic centers) together with the negative effects on the environment (polluting emissions, congestion, etc.).
3. Methods
3.1. Scenarios for Flow Consolidation
The research aims to develop a logistic system with collaborative centers located on the boundaries of a congested urban area. It is the case of Bucharest, characterized by a high population density (around 8250 inhabitants/km2) and major changes of the urban commerce structure (caused mainly by the emergence of super and hypermarkets in urban and metropolitan area, new concentration of residential areas, spatial and structural changes of interest places—for work, education, leisure, etc.). To respond to the increasing logistical demand, measures to develop UDCs have been applied.
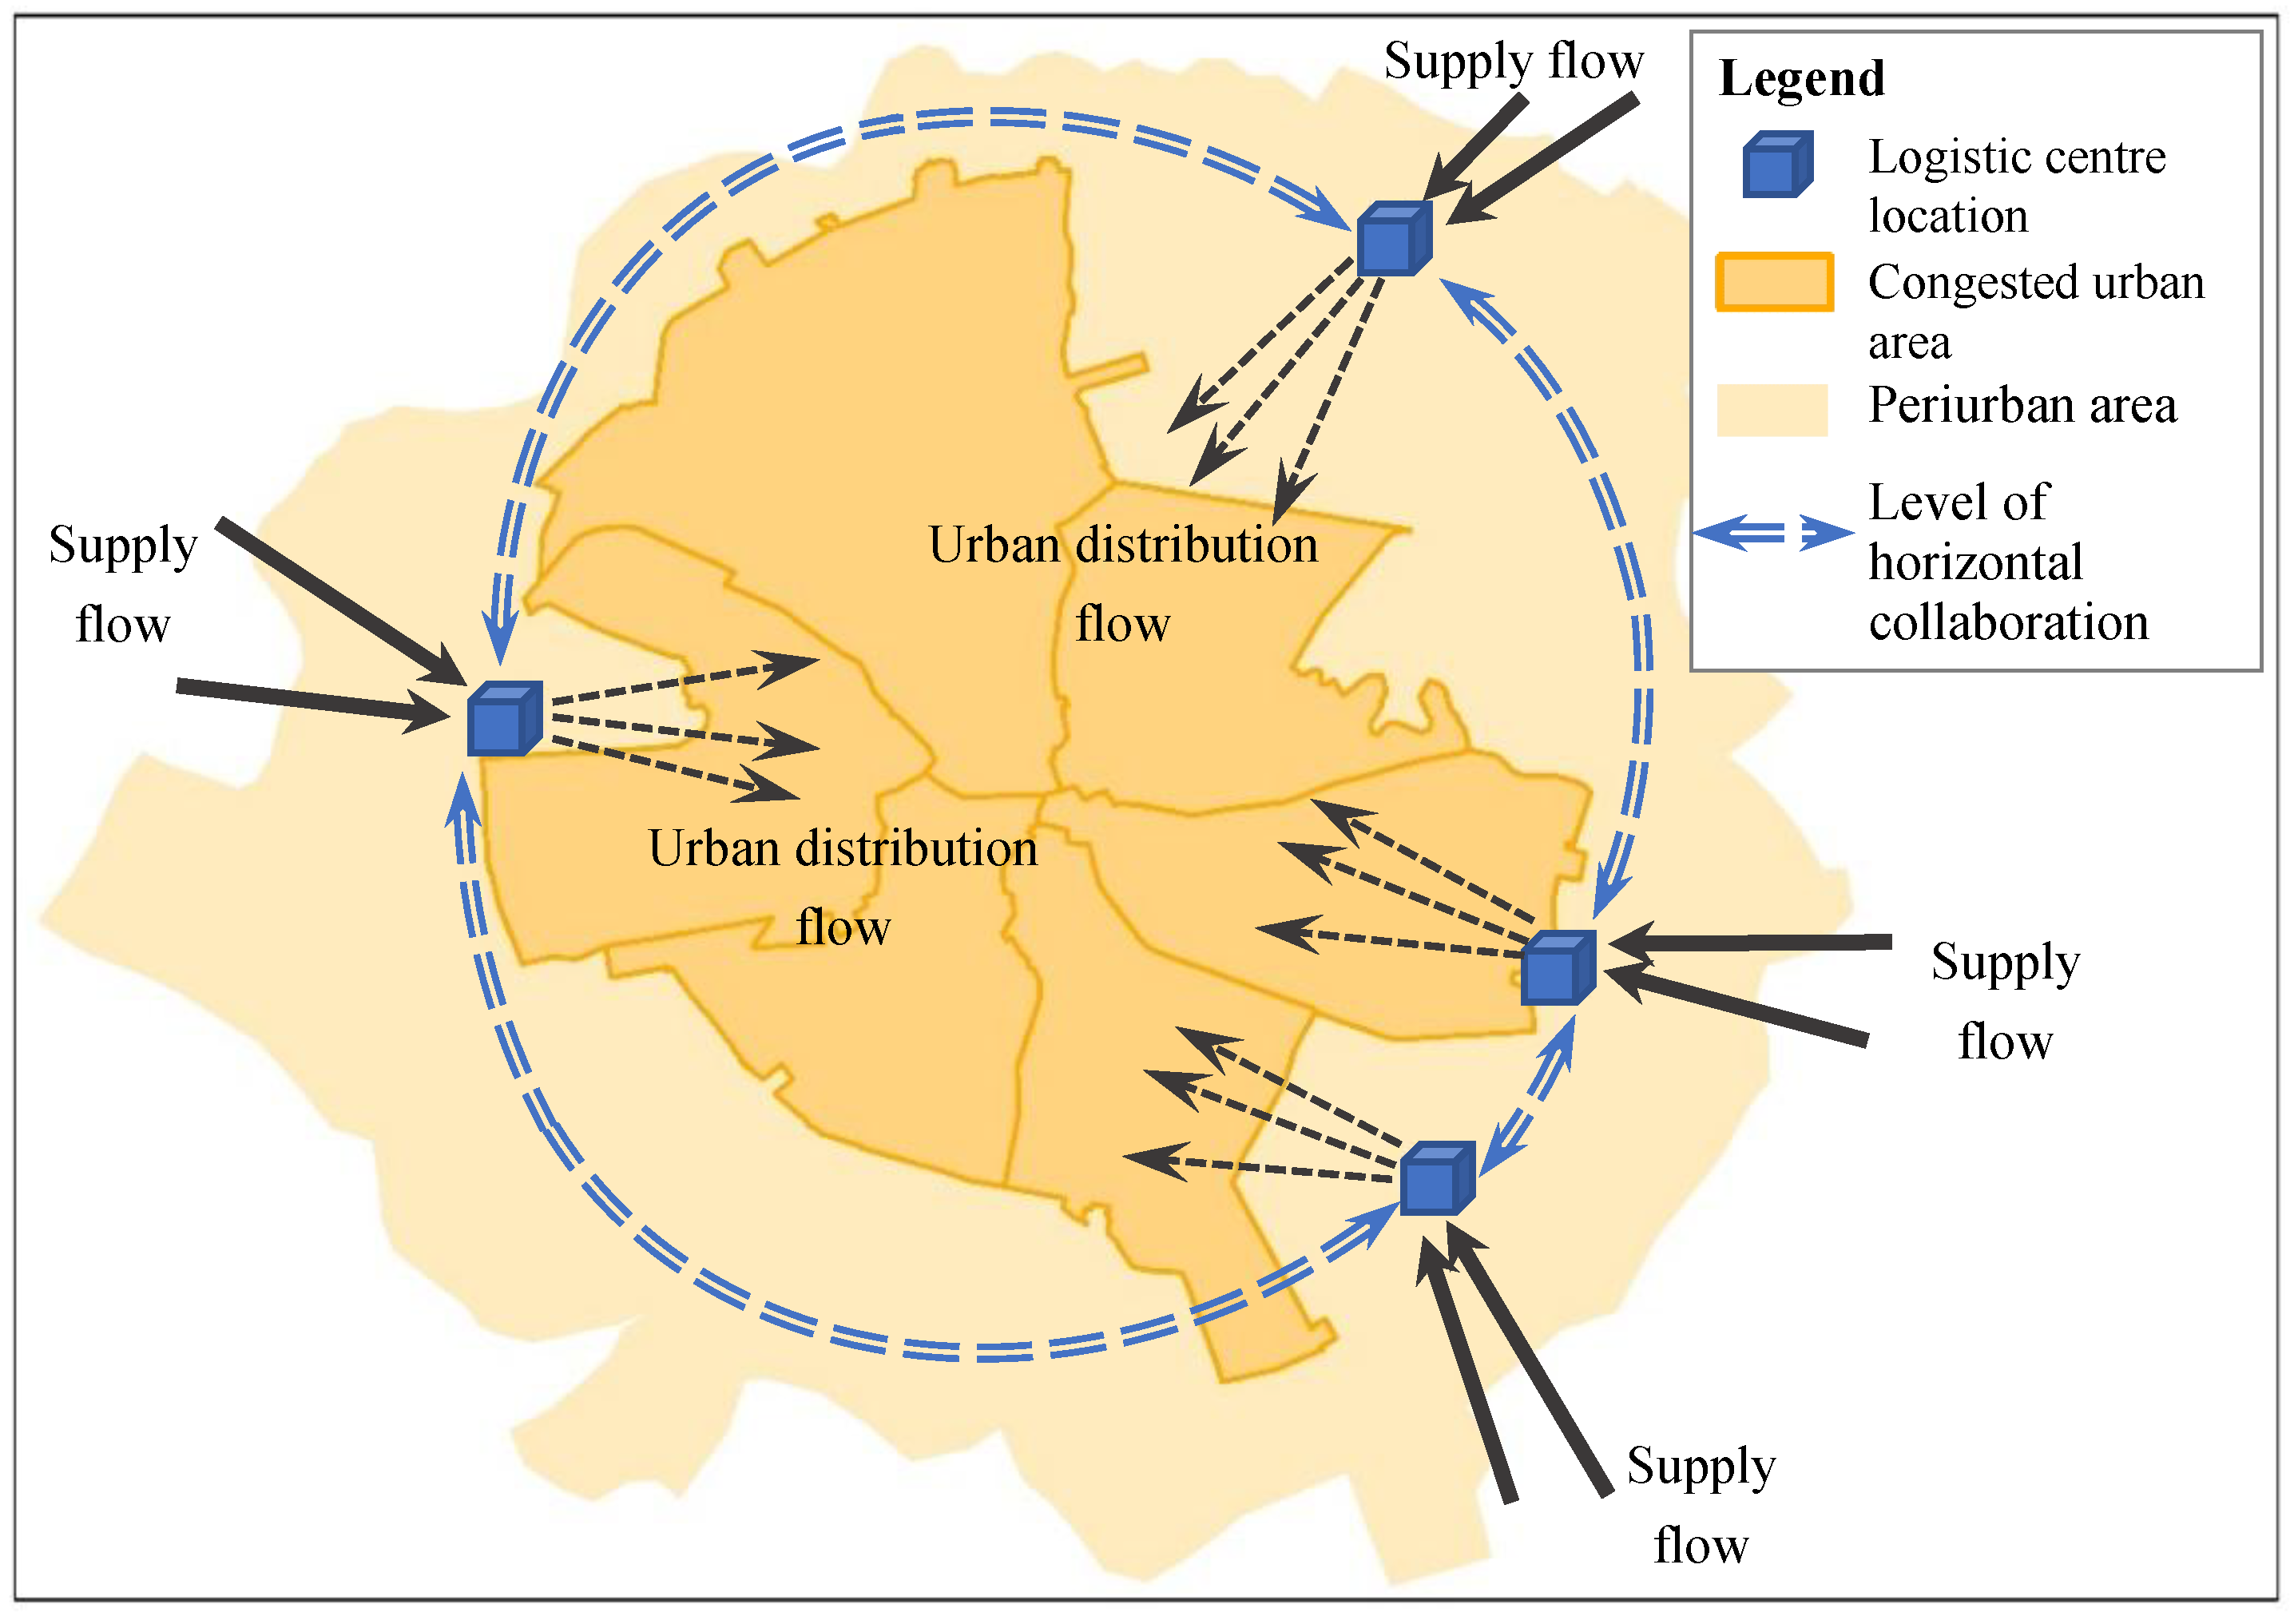
In order to obtain a sustainable logistic solution, a collaborative logistic scheme with four collaborative centers is analyzed (
Figure 1). Each provider or group of providers that uses the same urban road access is assigned to supply a single center, least affected by general traffic congestion conditions. All centers are located in such a way so as to allow easy transfer between them. The distances between two adjacent centers are from 10 to 25 km, with the average distance between centers L = 18 km. Each center has to distribute all freight categories required in the urban distribution, so collaboration between the centers is necessary.
A previous study demonstrated that horizontal collaboration at the boundary of the congested urban area brings benefits in terms of transport costs in the entire distribution system [
29]. This research aims to find the most efficient alternative for freight transfers among centers, thus reducing the idle time for forming compound shipments. After validating the methodology shown in this paper, future research will follow multicriteria assessment of the distribution system with collaborative centers.
The premises of the study were the following:
The producers do not have the capacity to associate in order to make the consolidation platform;
The commercial stores of the retail distribution are connected to a single urban distribution center (UDC), located at the edge of the urban space, which has the whole assortment of commercialized products;
The number and location of the urban distribution centers and the rounding up of the shops at them constitute the initial data that are kept in all scenarios;
To ensure in each UDC the entire assortment of products requested by traders, the UDC s are interconnected and carry out reciprocal product exchanges;
The deliveries of the manufacturers, structured in load units (pallets), arrived in one of the UDC s are to be sent, according to the orders received by the manufacturer, to all the other UDC s to which they are addressed (except for the number of pallets that have to be delivered to a certain recipient, the other order details are not accessible to the UDC that received the loads);
The accessibility for the suppliers of the UDC s is differentiated, so that the supplier (or the group of suppliers, in the case of consolidating the loading capacity for the means of transport) has the freedom to choose the delivery destination.
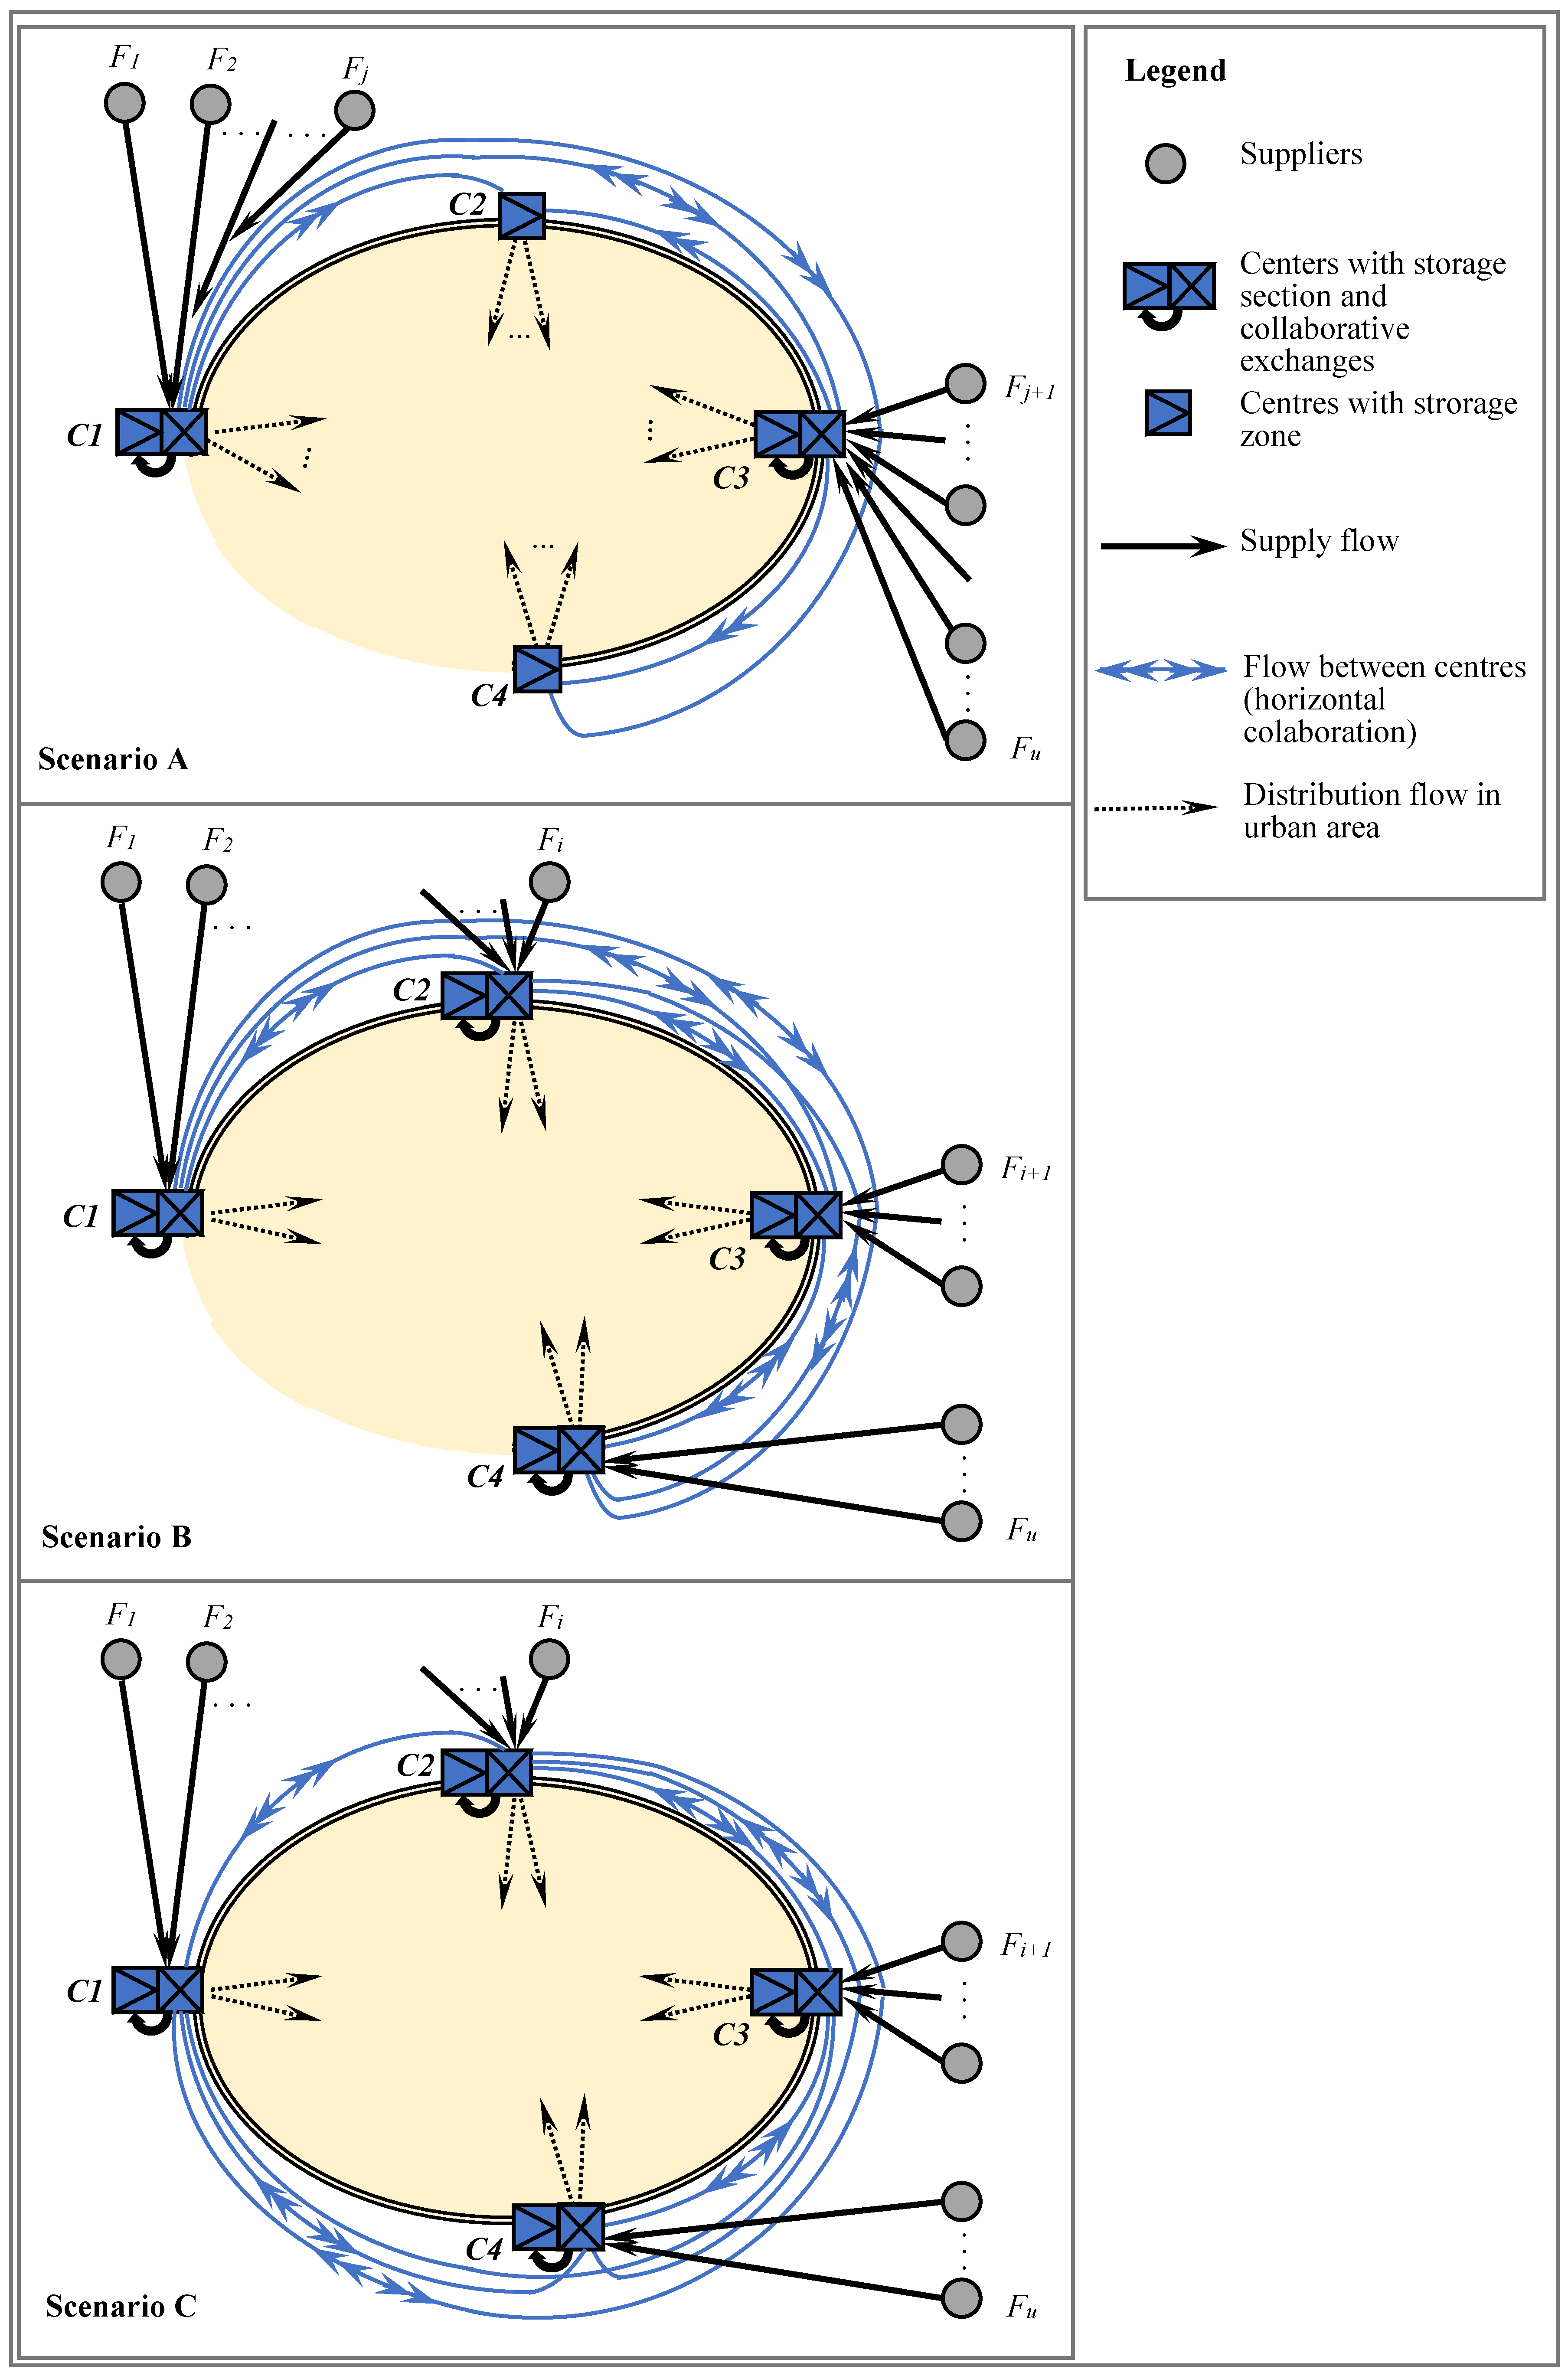
In relation to the latter premise, of the UDCs accessibility, we studied three scenarios (
Figure 2).
The scenarios correspond to the performance evolution of the road infrastructures between the suppliers and UDCs:
Scenario A—only two of the four UDCs considered have accessibility according to the suppliers’ requirements;
Scenario B—all four UDCs have adequate accessibility and the choice of delivery destination remains with the suppliers;
Scenario C—similar to scenario B, with the exception that the ring (belt line) on which the UDCs are located was closed with consequences in reducing the paths between some UDCs.
In all three scenarios, we assumed that the flow patterns dedicated to each UDC are identical.
Each of the four UDCs could contain two distinct compartments: (i) a warehouse (with stock) intended for serving the assigned delivery points and (ii) a logistics platform for receiving, consolidating and dispatching the freight to the other three UDCs.
3.2. Choosing the Consolidation Scheme
The combination (consolidation) of pallet flow with different destinations aims to minimize the sum, Ω, of (i) the idle time for accumulating the number of pallets necessary to completely load the transport means, Ωac, and (ii) the idle time for separating the flow with different destinations, Ωpr.
In each scenario, the algorithm (Algorithm 1) applied for choosing the consolidation scheme follows the steps below:
| Algorithm 1 Steps |
| 1: | Read the input data specific to each scenario; |
| Input 1 | - -
Types of compartments available in each center (logistic platforms for collaborative exchanges, storage section);
|
| Input 2 | - -
Characteristics for centers accessibility on the supply level (from producers);
|
| Input 3 | - -
Characteristics for centers accessibility on the horizontal collaboration level;
|
| 2: | Forcenter p (p = 1, …, 4);
Assign the supply flow, function of Input 1 and 2;
And for |
| 3: | Compute Nv, the number of flow combinations among centers (on the horizontal collaboration level); |
| 4: | Forvariant v (v = 1, …, Nv); |
| 4.1: | Define the flow set among centers, on the horizontal collaboration, the function ofInput 1 and 3; |
| 4.2: | Compute the parameters specific to the flow accumulation; |
| 4.3: | Forcenter p (p = 1, …, 4);
Compute the idle time for accumulation, Ωac, p;
Compute the supplementary idle time for shipments separation and re-composition, Ωpr, p;
Compute the sum Ωp = Ωac, p + Ωpr, p;
And for |
| 4.4: | Compute the total Ωv = sum(Ωp; p = 1, …, 4); |
| And for |
| 5: | Select as solution the variant for which Ωv is minimum. |
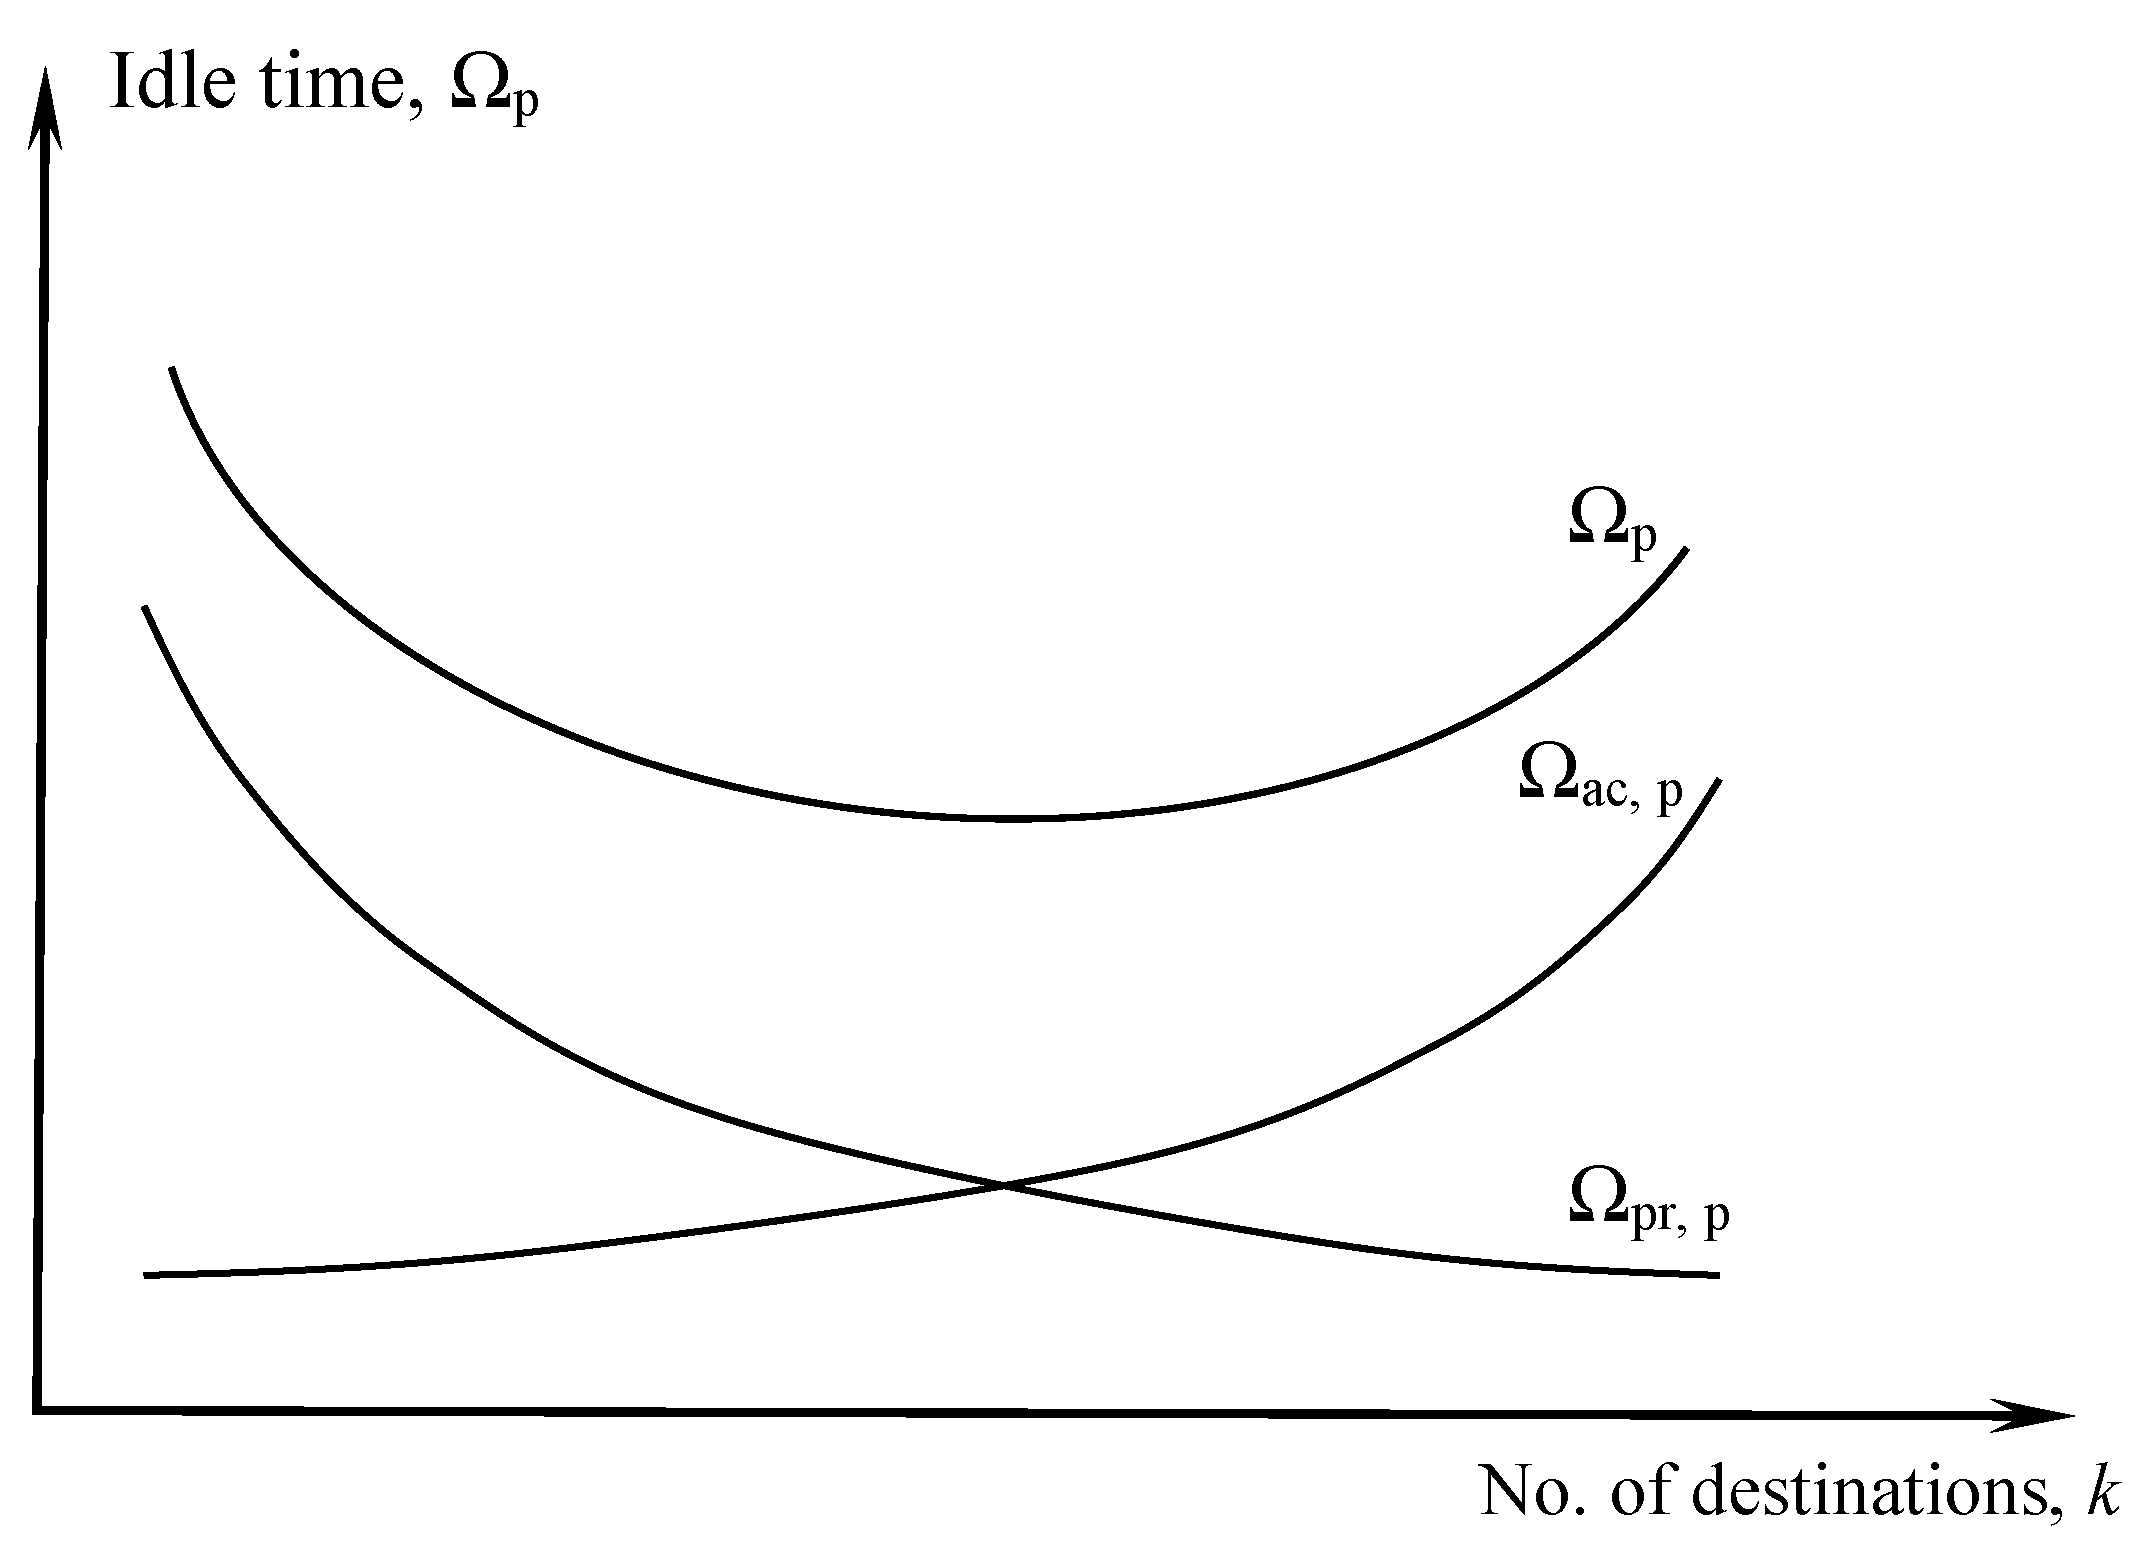
3.3. Idle Time in Consolidation Schemes
In each center, both categories of the idle time mentioned above, Ω
ac, p and Ω
pr, p, depend on the number of destinations
k (
Figure 3) defined in the consolidation scheme.
To compute the total amount of idle time for each consolidation scheme, the following notations are used:
| Cp | - -
set of UDCs, p = 1, …, 4;
|
| T | - -
analysis period;
|
| m | - -
capacity of a transport mean;
|
| - -
number of arrivals during T period;
|
| - -
number of shipments during T period;
|
| g | - -
average number of the groups forming a shipment;
|
| α | - -
coefficient of arrivals irregularity, causing interruption in the accumulation process (α > 1);
|
| - -
parameter specific to the process of load accumulation for shipment formation, characteristic of the period T;
|
| k | - -
number of destinations for which shipments are formed;
|
| - -
time required to accumulate the pallets for dispatch i, with complete loading of a transport mean of m capacity;
|
| - -
interval when no unit load remains in waiting after the dispatch i (the accumulation process is interrupted);
|
| - -
the average of intervals when the accumulation process is interrupted;
|
| - -
average accumulation idle time for a pallet in the period T in Cp;
|
| - -
average supplementary idle time for a pallet in the period T, for flow separation in the center p;
|
| - -
additional idle time of loads in Cp ();
|
| - -
flow between centers Ci and Cj (i, j = 1, …, 4; i ≠ j);
|
| - -
sum of the idle time for accumulating the number of pallets necessary for completely loading a transport mean, for destinations k, in center p;
|
| - -
sum of the supplementary idle time for flow separation in center p;
|
| - -
number of flow combinations in the horizontal consolidation scheme.
|
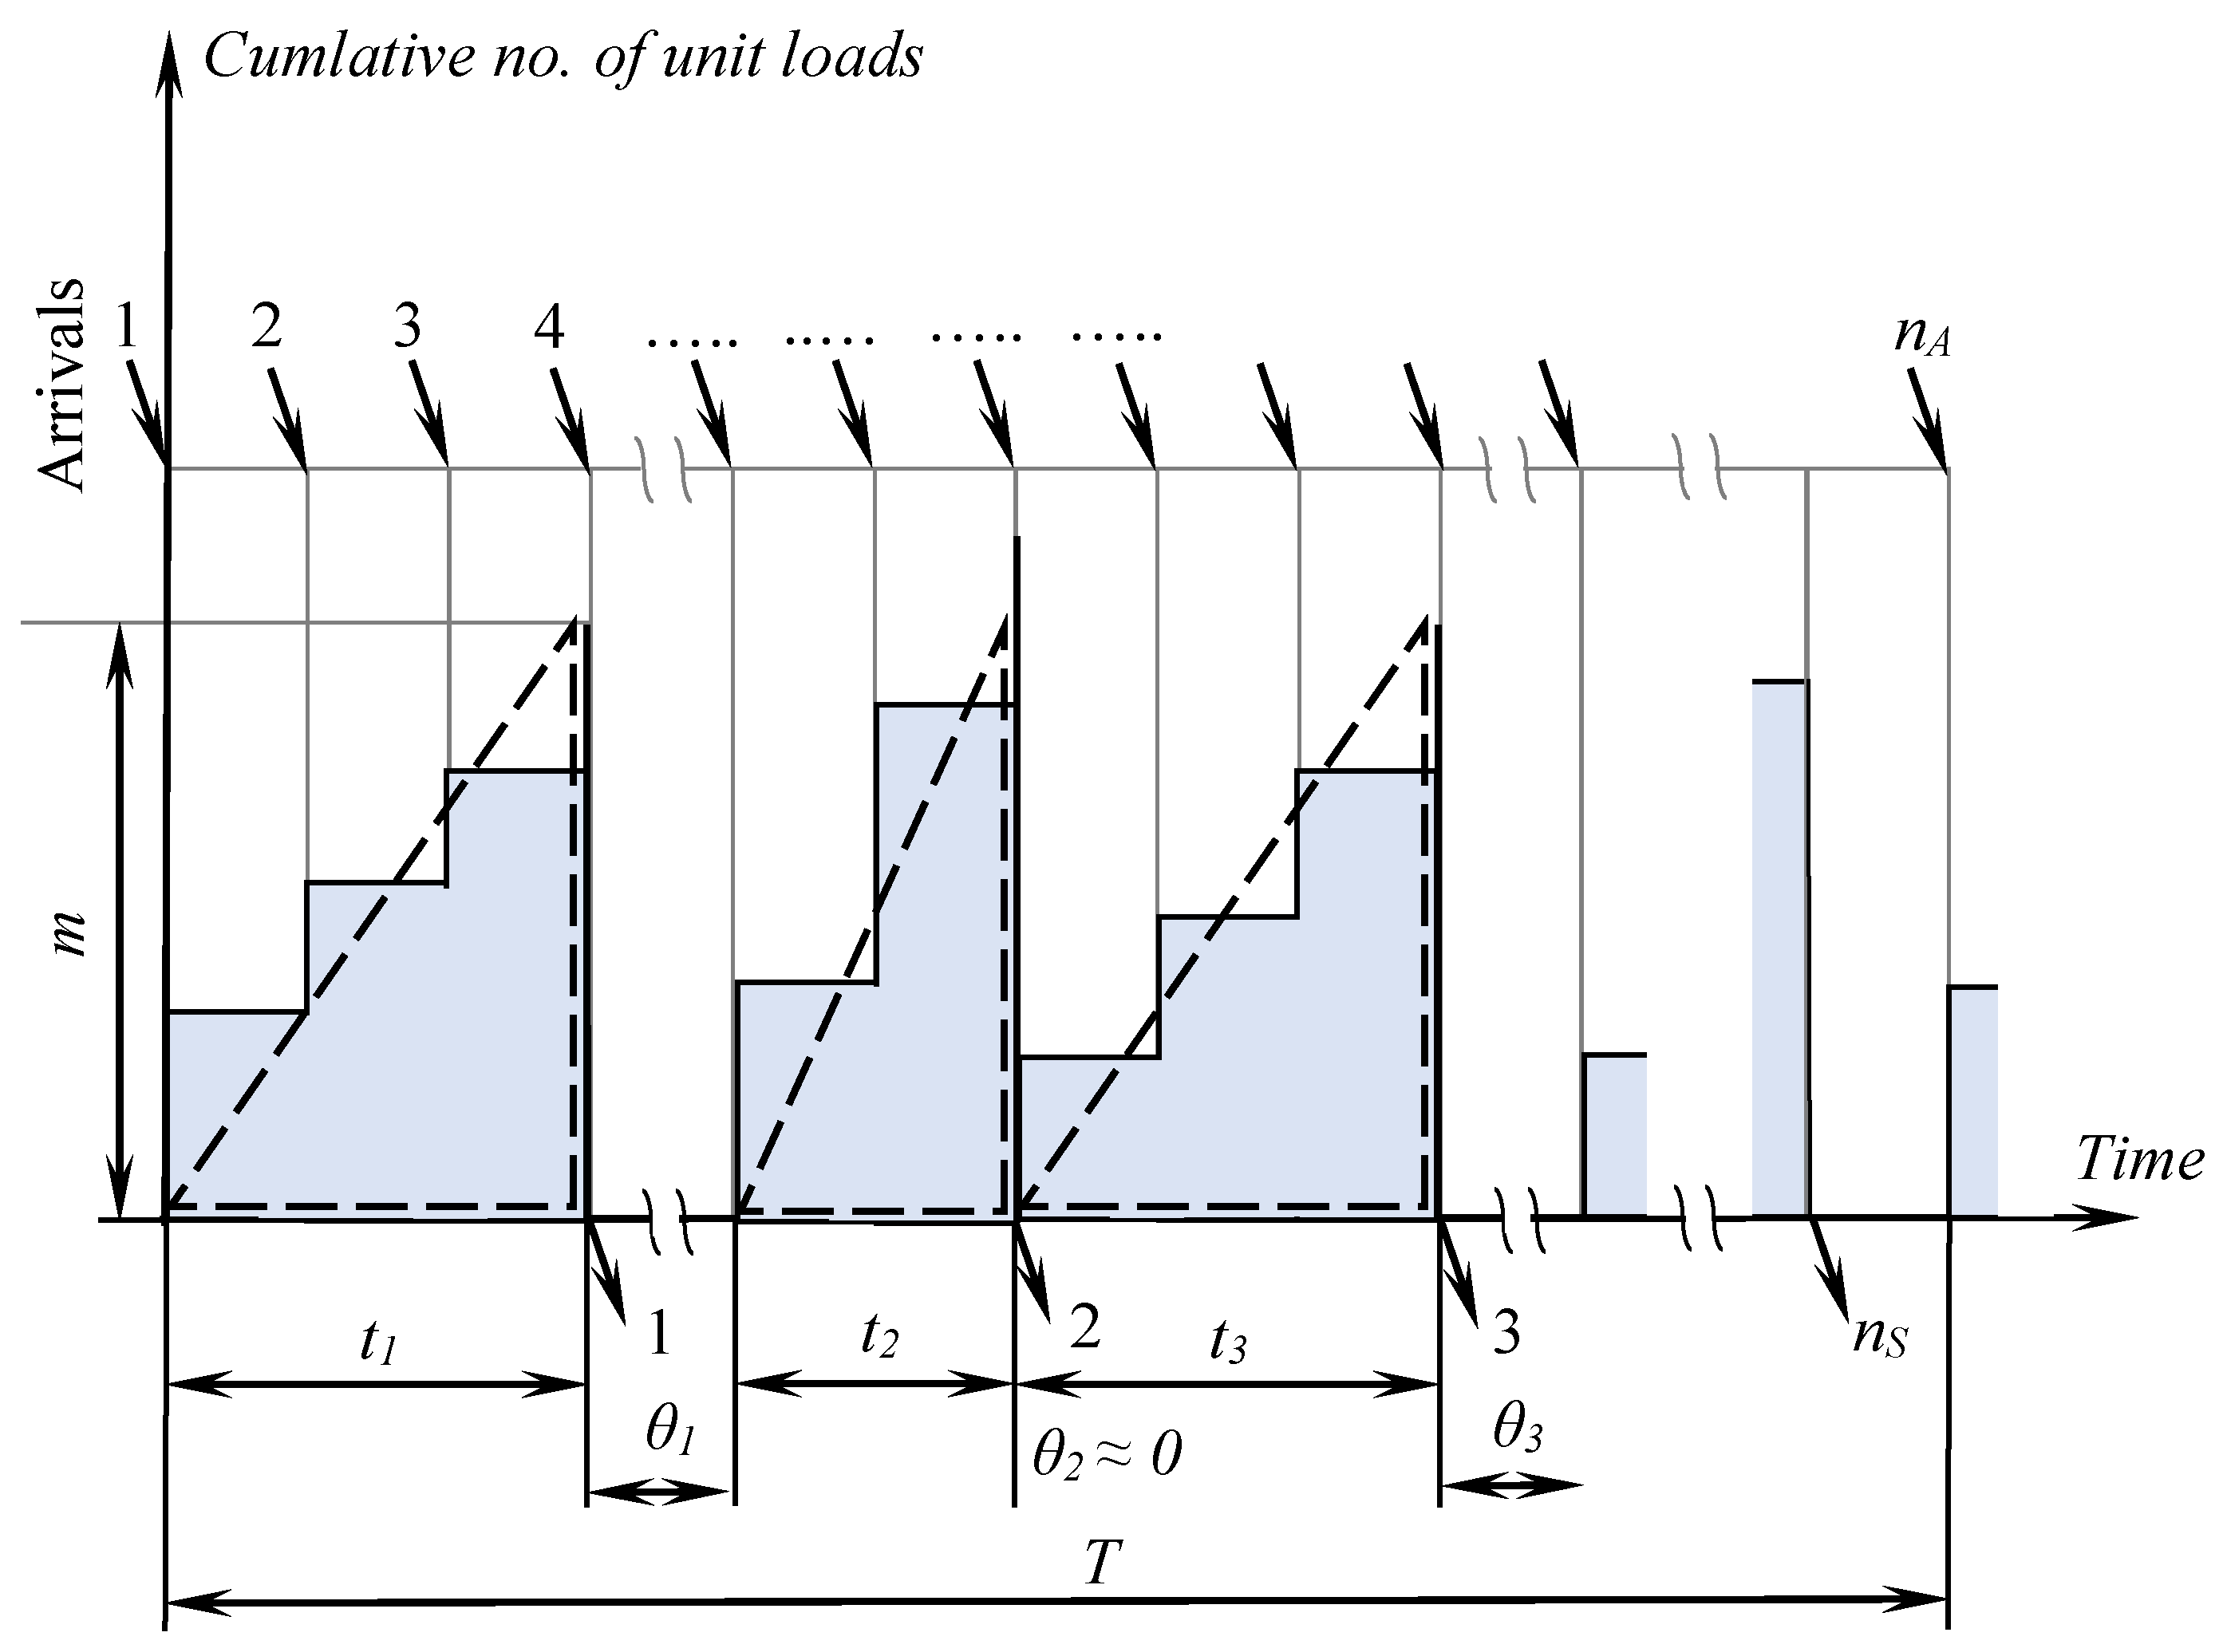
For any of the
p logistic platforms of the UDCs from which a shipment that consists in loading units (pallets) for a certain destination (logistic platform of another UDC) is to be made, the idle time in a period
T (
Figure 4) is the sum of the hatched areas (approximated by the areas of the triangles represented by dashed lines), that is:
Admitting an average value
, and taking into account the average number of
g groups that form a shipment,
, then:
and the total idle time for pallets for a shipment with a certain destination is:
therefore:
where
is similar to a parameter linked to accumulation.
We can show that for the case where the logistics platform
p specializes shipments for destinations
k, the idle times, expressed in pallets-hours is:
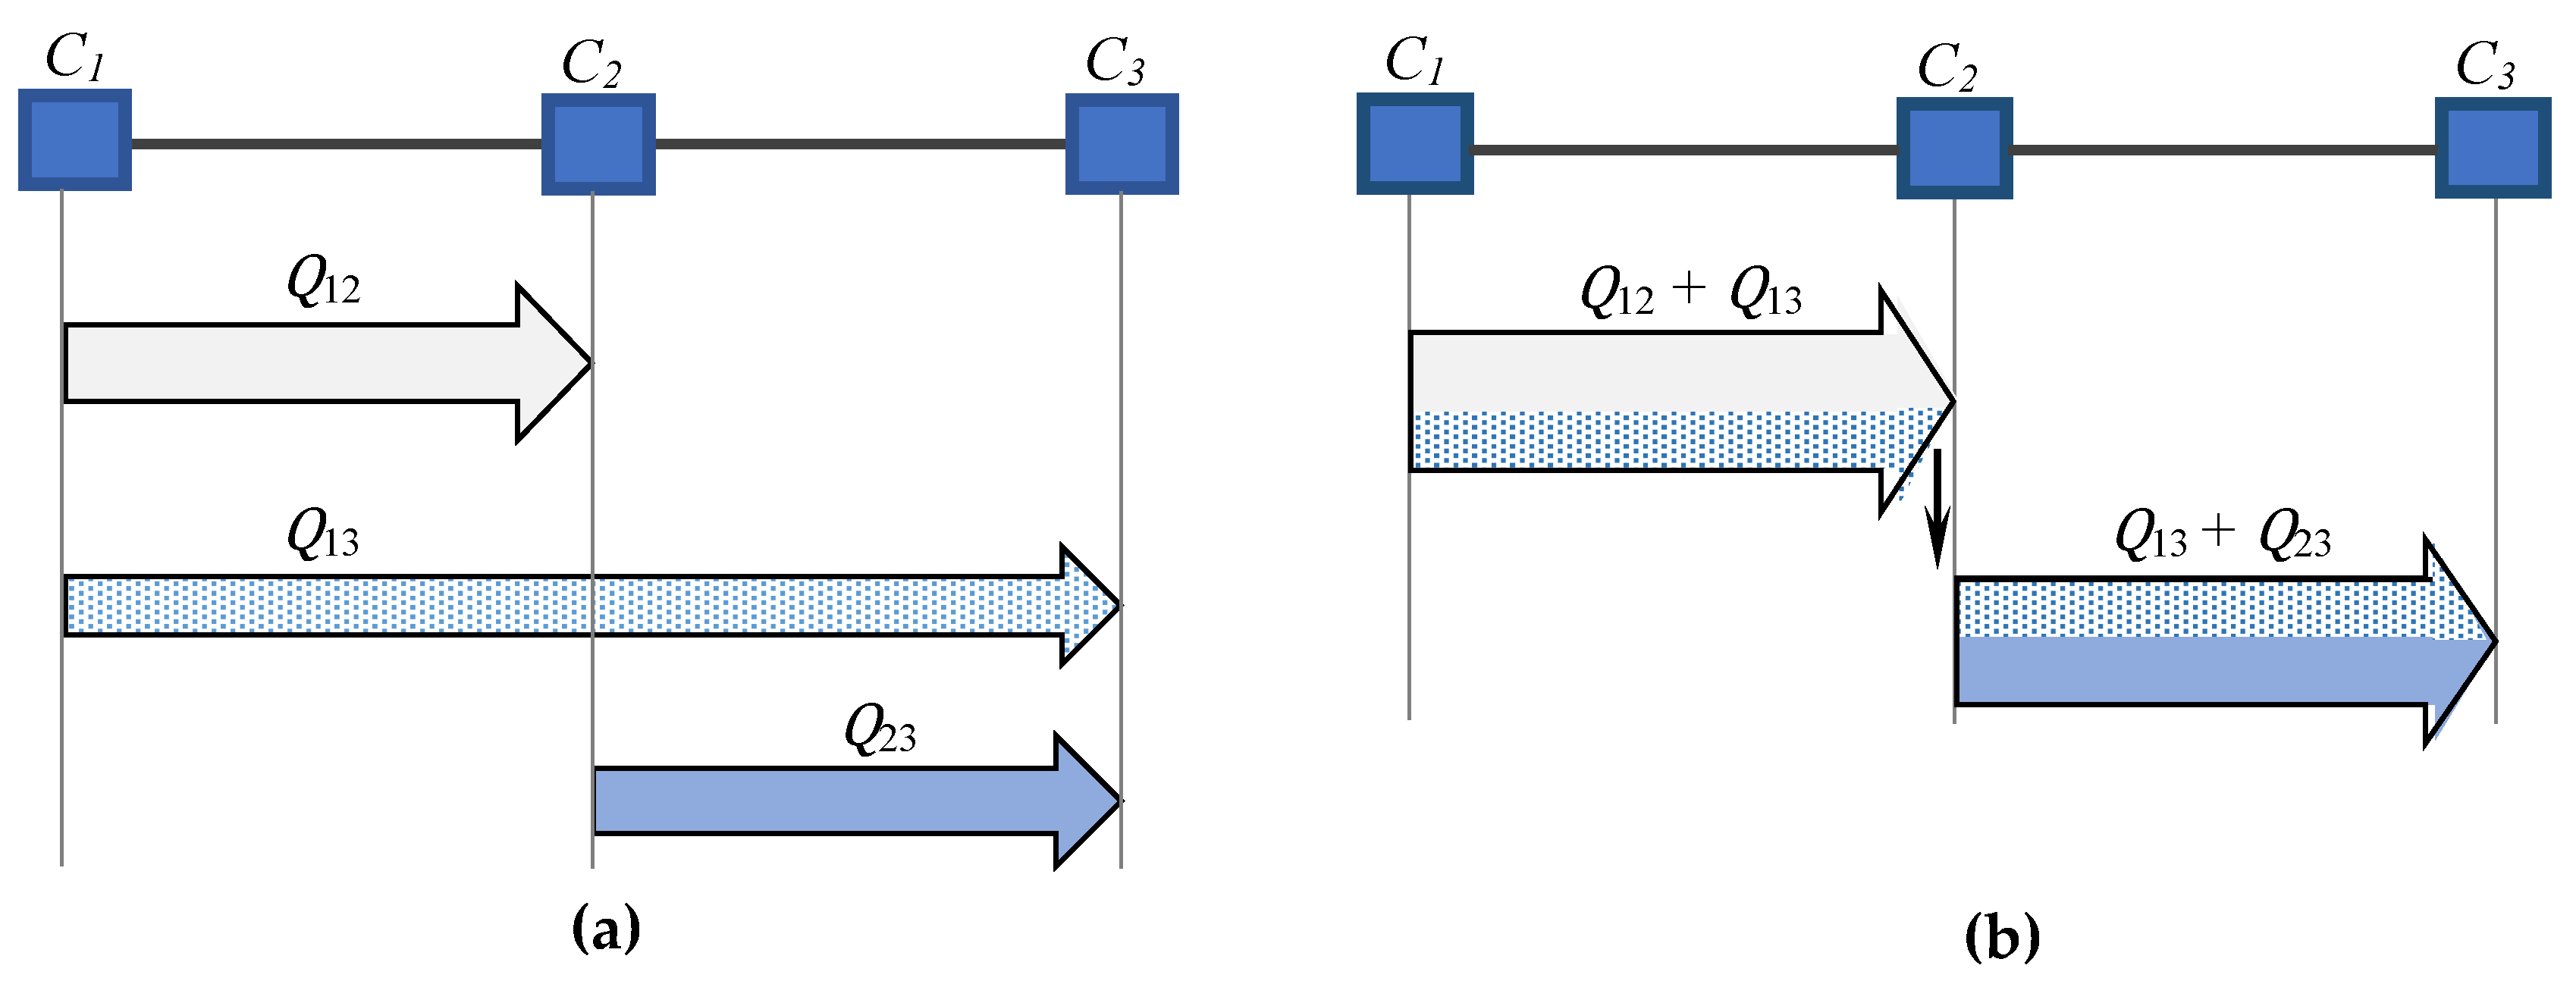
In addition to the pallets’ storage with load for accumulation in the UDC logistic platforms, the additional idle time that appears in the case of shipments with the same transport mean of the loads destined for two or more UDCs has to be taken into consideration.
For example, if for the case of three centers C1, C2 and C3, instead of each flow being subject to separate shipments (
Figure 5a), the Q
12 and Q
13 flow (
Figure 5b) are combined in C1, in a heterogeneous shipment, then in C2, where Q
12 flow has to be separated, for each flow entity Q
13 an additional idle time,
, appears.
But the consolidation of expeditions in C1, which determines
,the idle time in C2, also has consequences that have to be evaluated on the idle time in C2. Thus, if in the case of homogeneous shipments, the average idle time for a pallet is:
then in
Figure 5b hypothesis, the idle time is:
which means that for the
flow it is an economy of the idle time so as to accumulate the loading units is recorded at the station:
Hence, for the situation shown, the heterogeneous shipment
from C1 is recorded as an additional idle time of loads in C2, equal to:
In conclusion, the objective of minimizing freight idle time aims to both the accumulation time at the points of dispatch, Ωac, and those provided by the idle time at the separation points, Ωpr.
The variations character for Ω
ac and Ω
pr depending on the number of destinations
k (
Figure 3), for which accumulations and implicit processing are planned in centers on the route (when
k < kmax), draws attention to the need of examining Ω = Ω
ac + Ω
pr for all the values of
k ϵ [
kmin,
kmax]. This is so, in order to find the variant of shipments from all the centers for which the sum of the idle time is minimal.
We should note that for a same value of k from the variety of possible combinations between homogeneous and heterogeneous shipments from different centers, different values may result for Ω. Therefore, the representations for Ωac and Ωpr have to be interpreted as the minimum values retained for the given k.
In other words, a combinatorial problem is given, with a number of variants much greater than the possible values of k within the mentioned interval (kmin - all flow is heterogeneous; kmax - all flow is homogeneous).
The number of flow combinations for
n shipping centers is:
with the observation that only combinations between the flow with neighboring destinations are considered, which means 8 variants for n = 4, 64 variants for n = 5 etc. Should all the possible combinations be taken into account, then there are 9, respectively 103 distinct variants.
4. Results
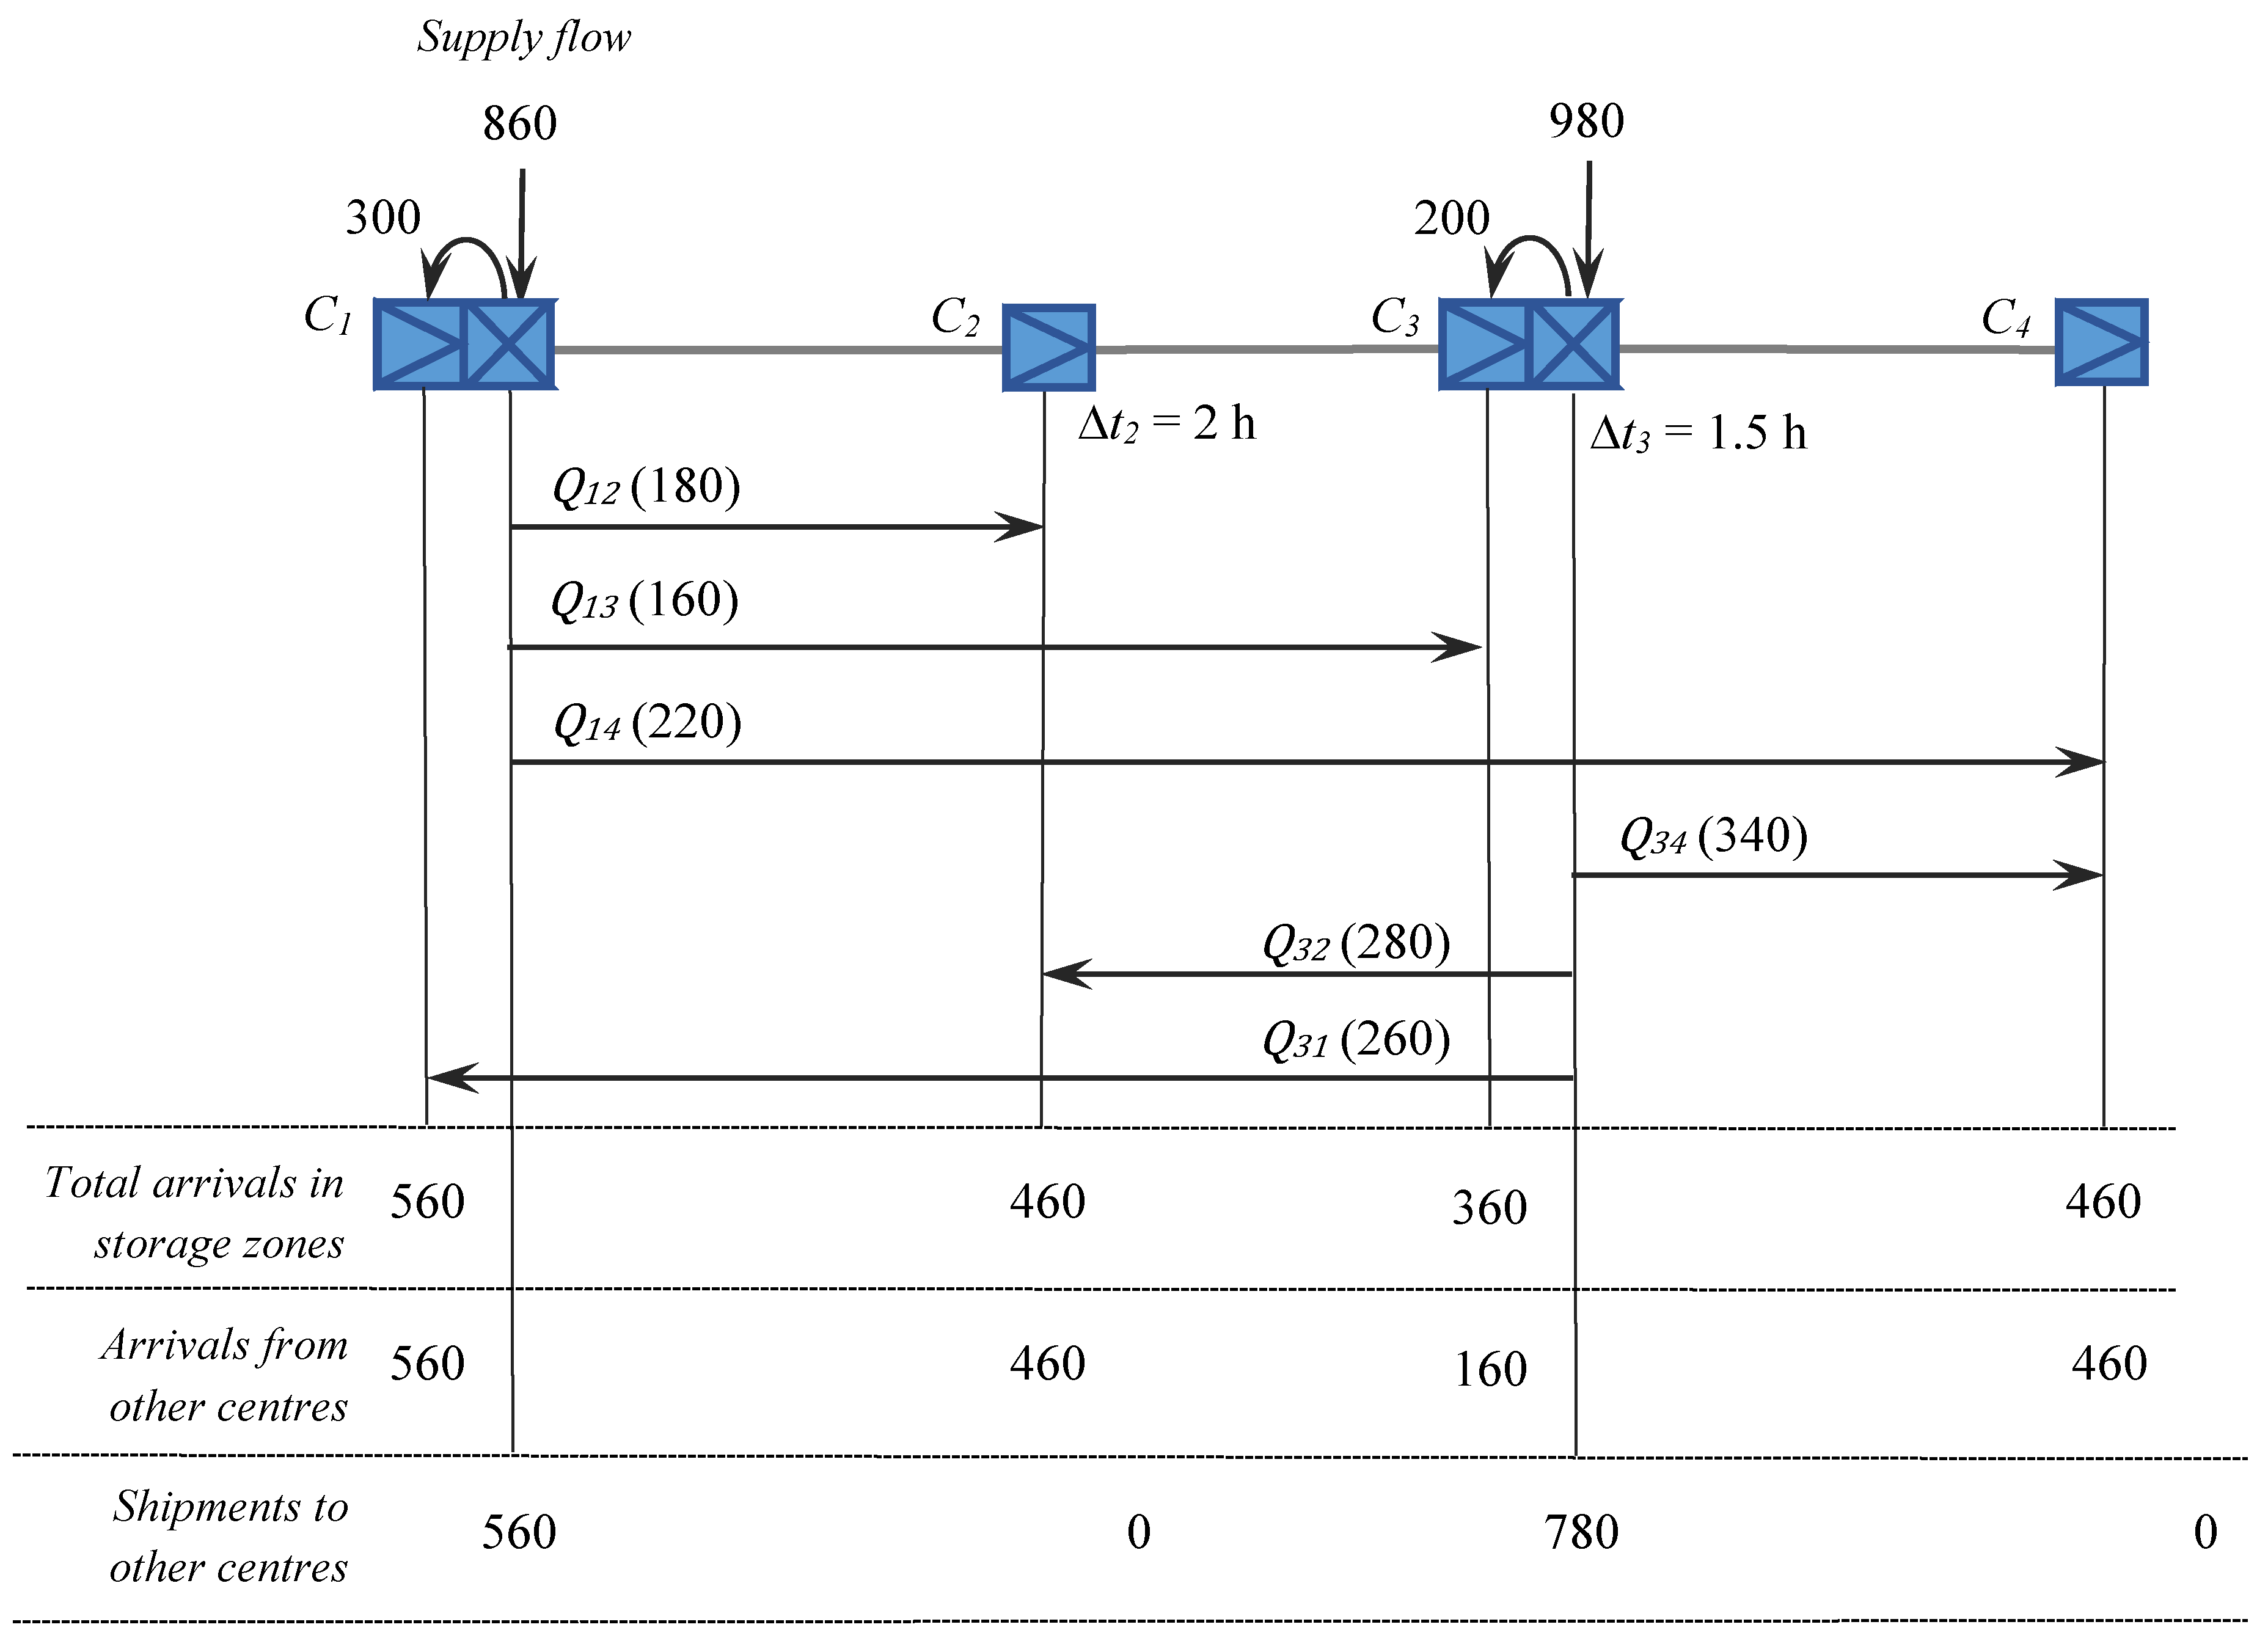
4.1. Scenario A
If only UDC1 and UDC3, which have logistic platforms, receive the goods intended for sale in the stores within the territory urban agglomeration, then the flow attributes are those presented in
Figure 6.
Assuming that only one type of vehicle is used (with a capacity m = 20 pallets) and that the accumulation parameter is = 10 h (for T = 24 h, g = 5 and γ = 1.2), not even the only possible combination of flow and is indicated (as = 220 × 1,5 > Ωac,3 = = 10 × 20).
This means that the variant of shipments that minimize the idle time Ω is the one in
Figure 6, for which:
as Ω
pr = 0.
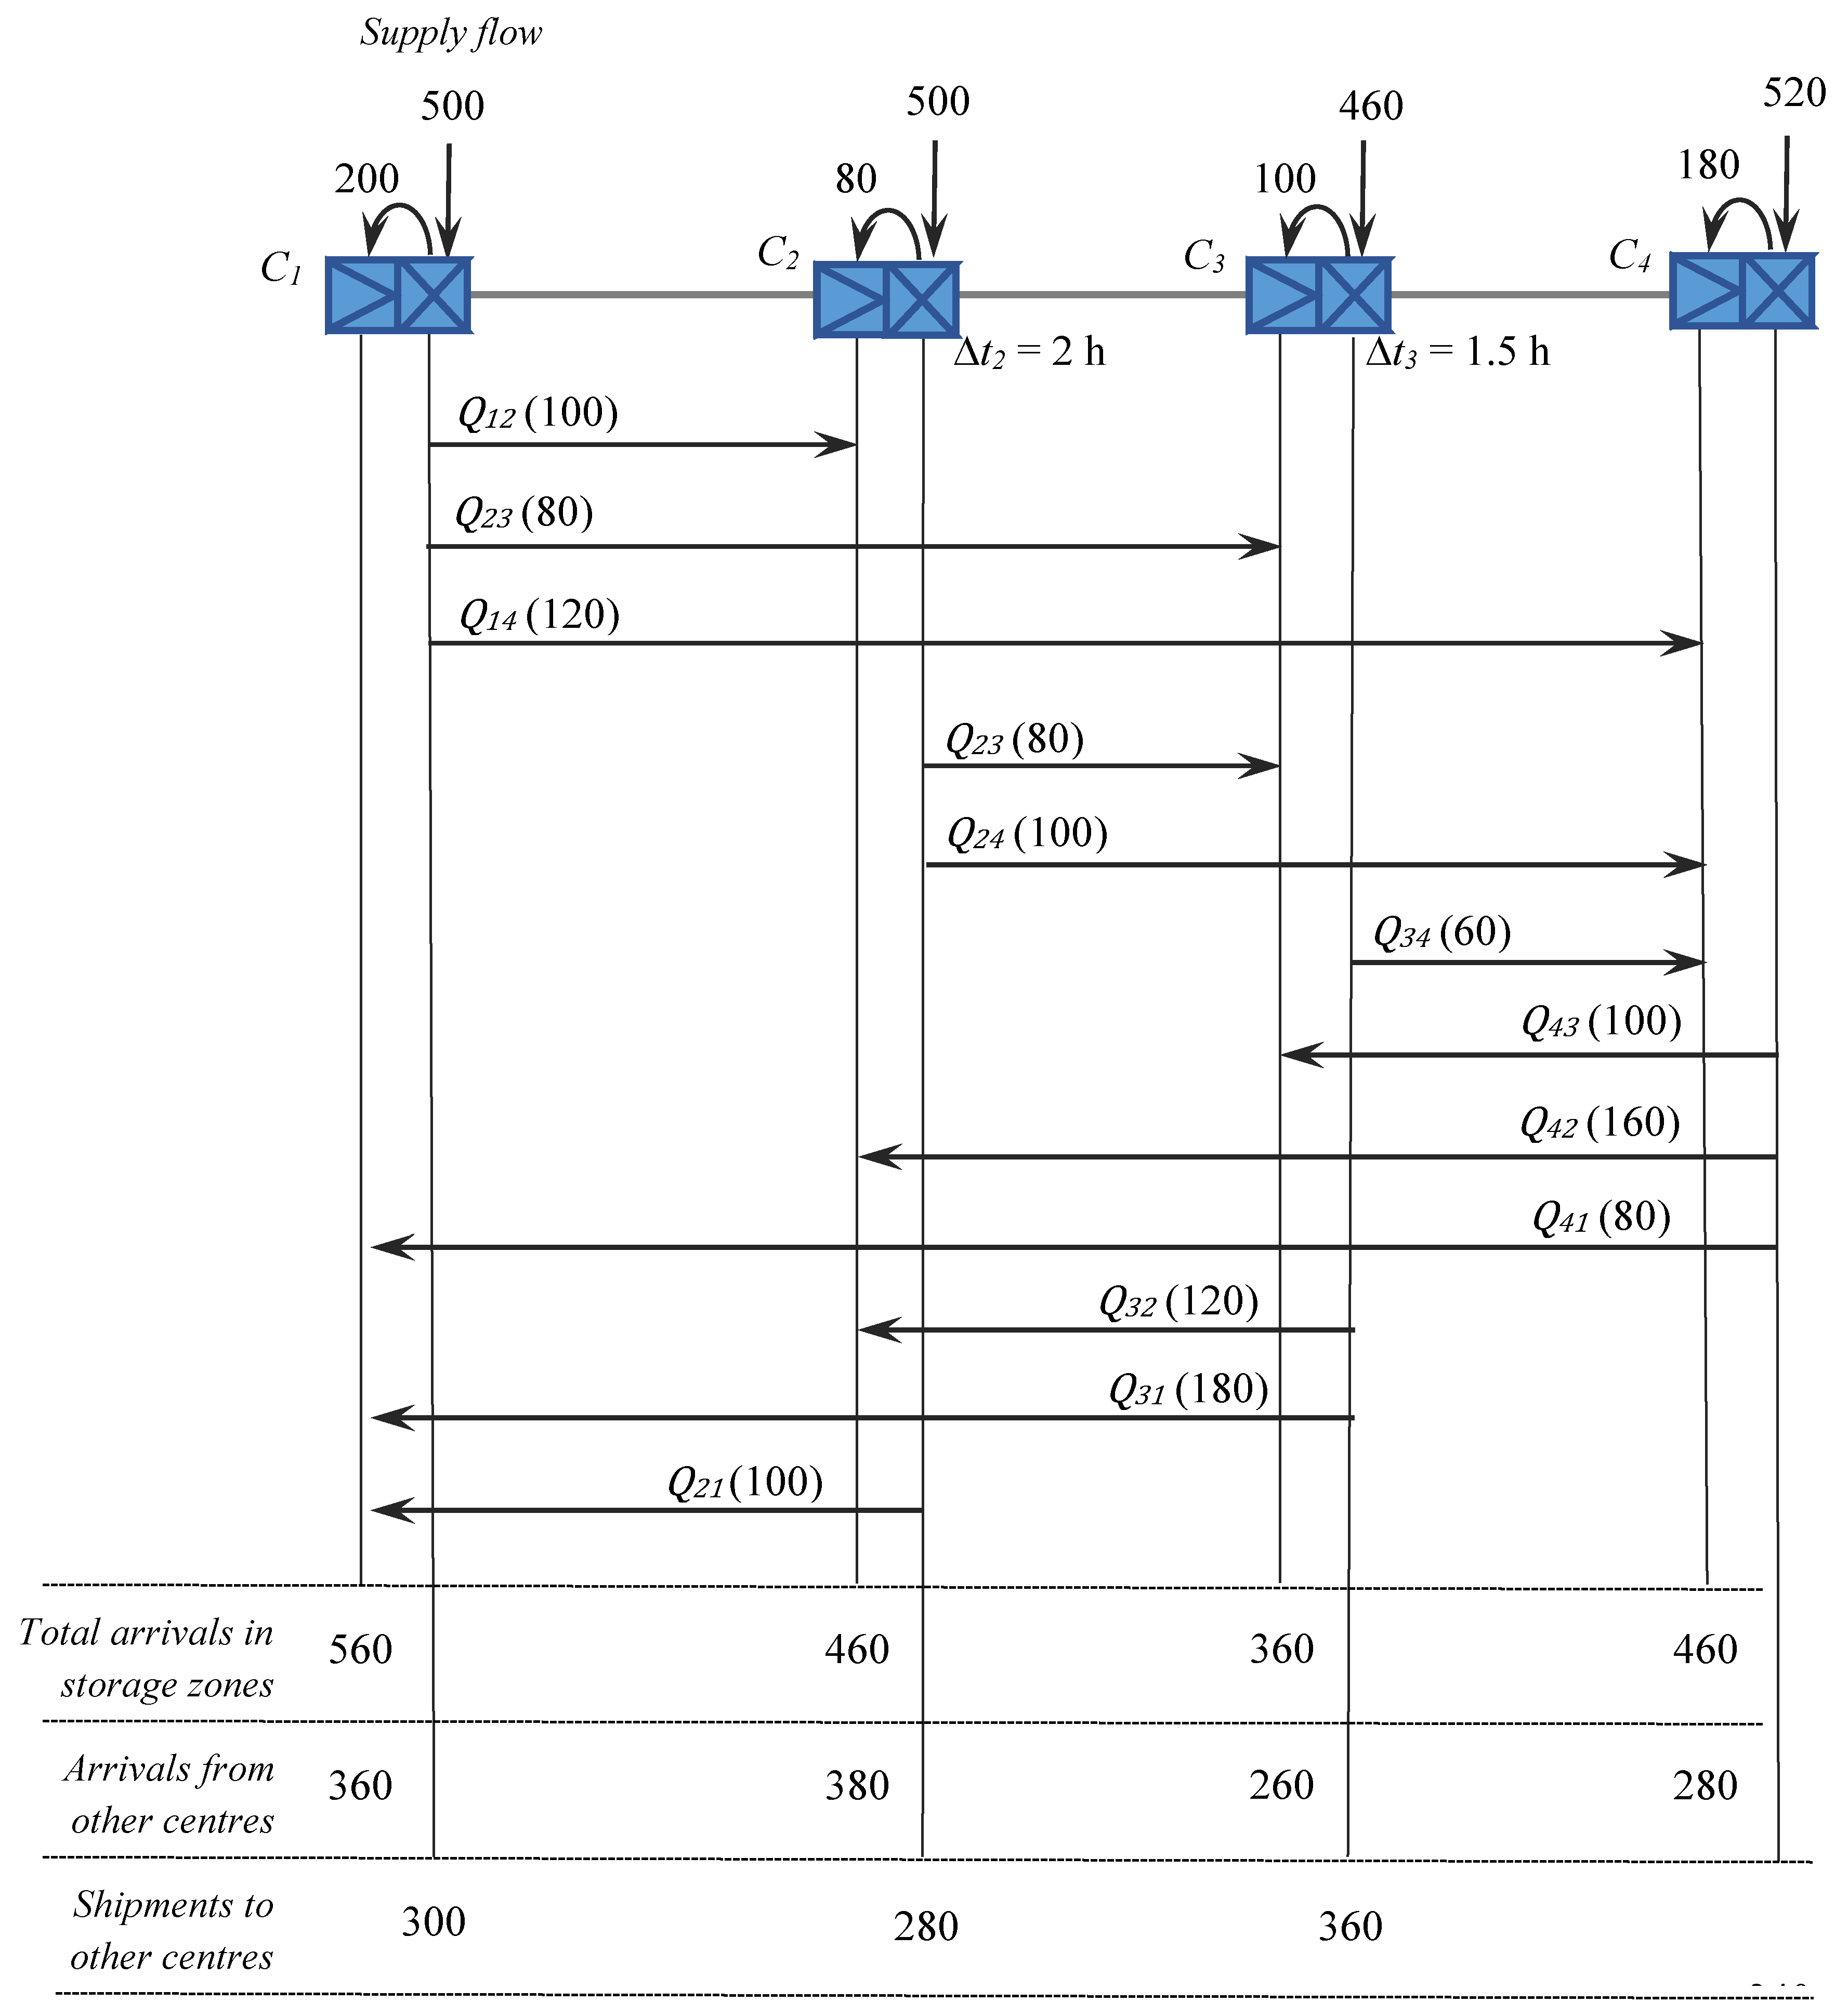
4.2. Scenario B
All UDCs are accessible to suppliers who, in relation to the choices made, lead to the flow in
Figure 7 (this scenario is defined for the same quantities of goods in the warehouses of each UDC as in scenario A).
The existence of flow for which the consolidation is likely to lead to the decrease of the total idle time, Ω, is noticed (as Q Δ t < Ωac).
Hence, the nine possible variants for n = 4 have to be compared in order to identify the variant for which Ω is minimal (
Table 1, for the relation C1 to C4).
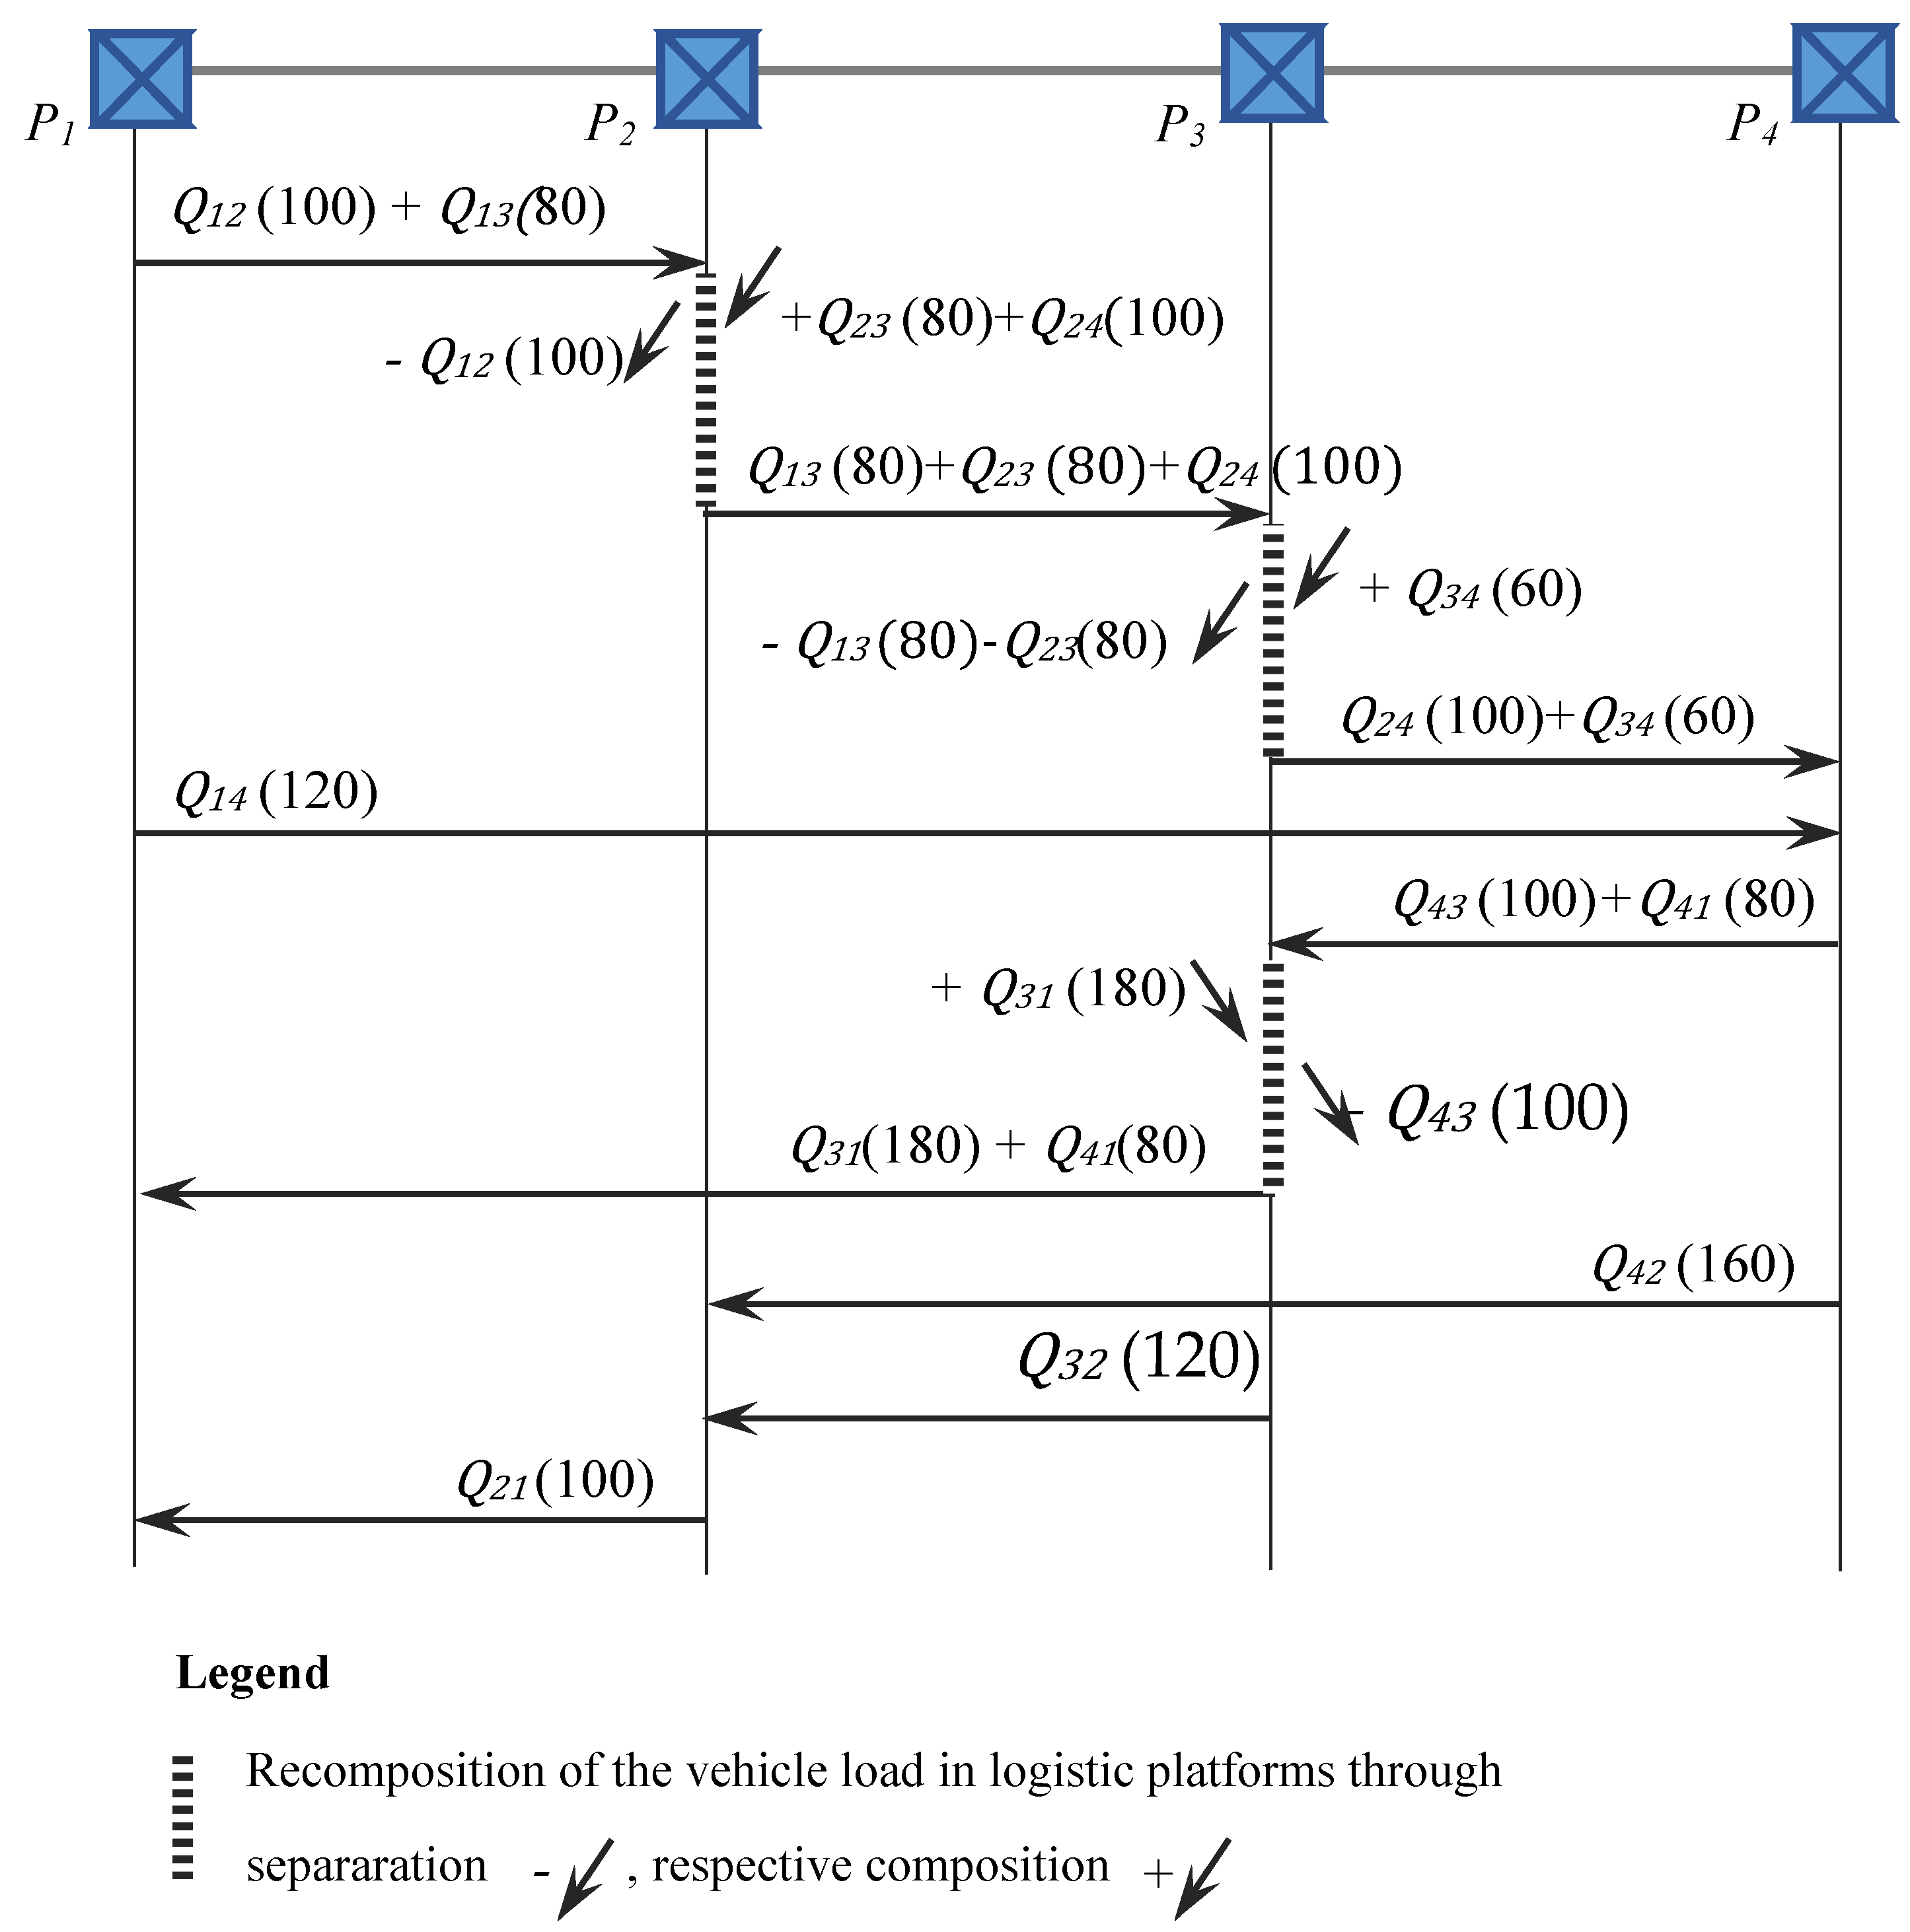
From
Table 1, variant 6 with Ω’ = 510 is recommended.
For the relation UDC4 to UDC1, the solution corresponds to variant 9 with minimum Ω’ (
Table 1). In this way, the indexes for the flow have to be replaced: 1 with 4, 2 with 3, 3 with 2 and 4 with 1. It results Q
43 + Q
41, Q
43, Q
31, meaning Ω″ = Ω
4 + Ω
3 + Q
41 Δ
t3 = 520.
The solutions recommended (6, respectively 9) for the flow transfer between the four logistics platforms are shown in
Figure 8.
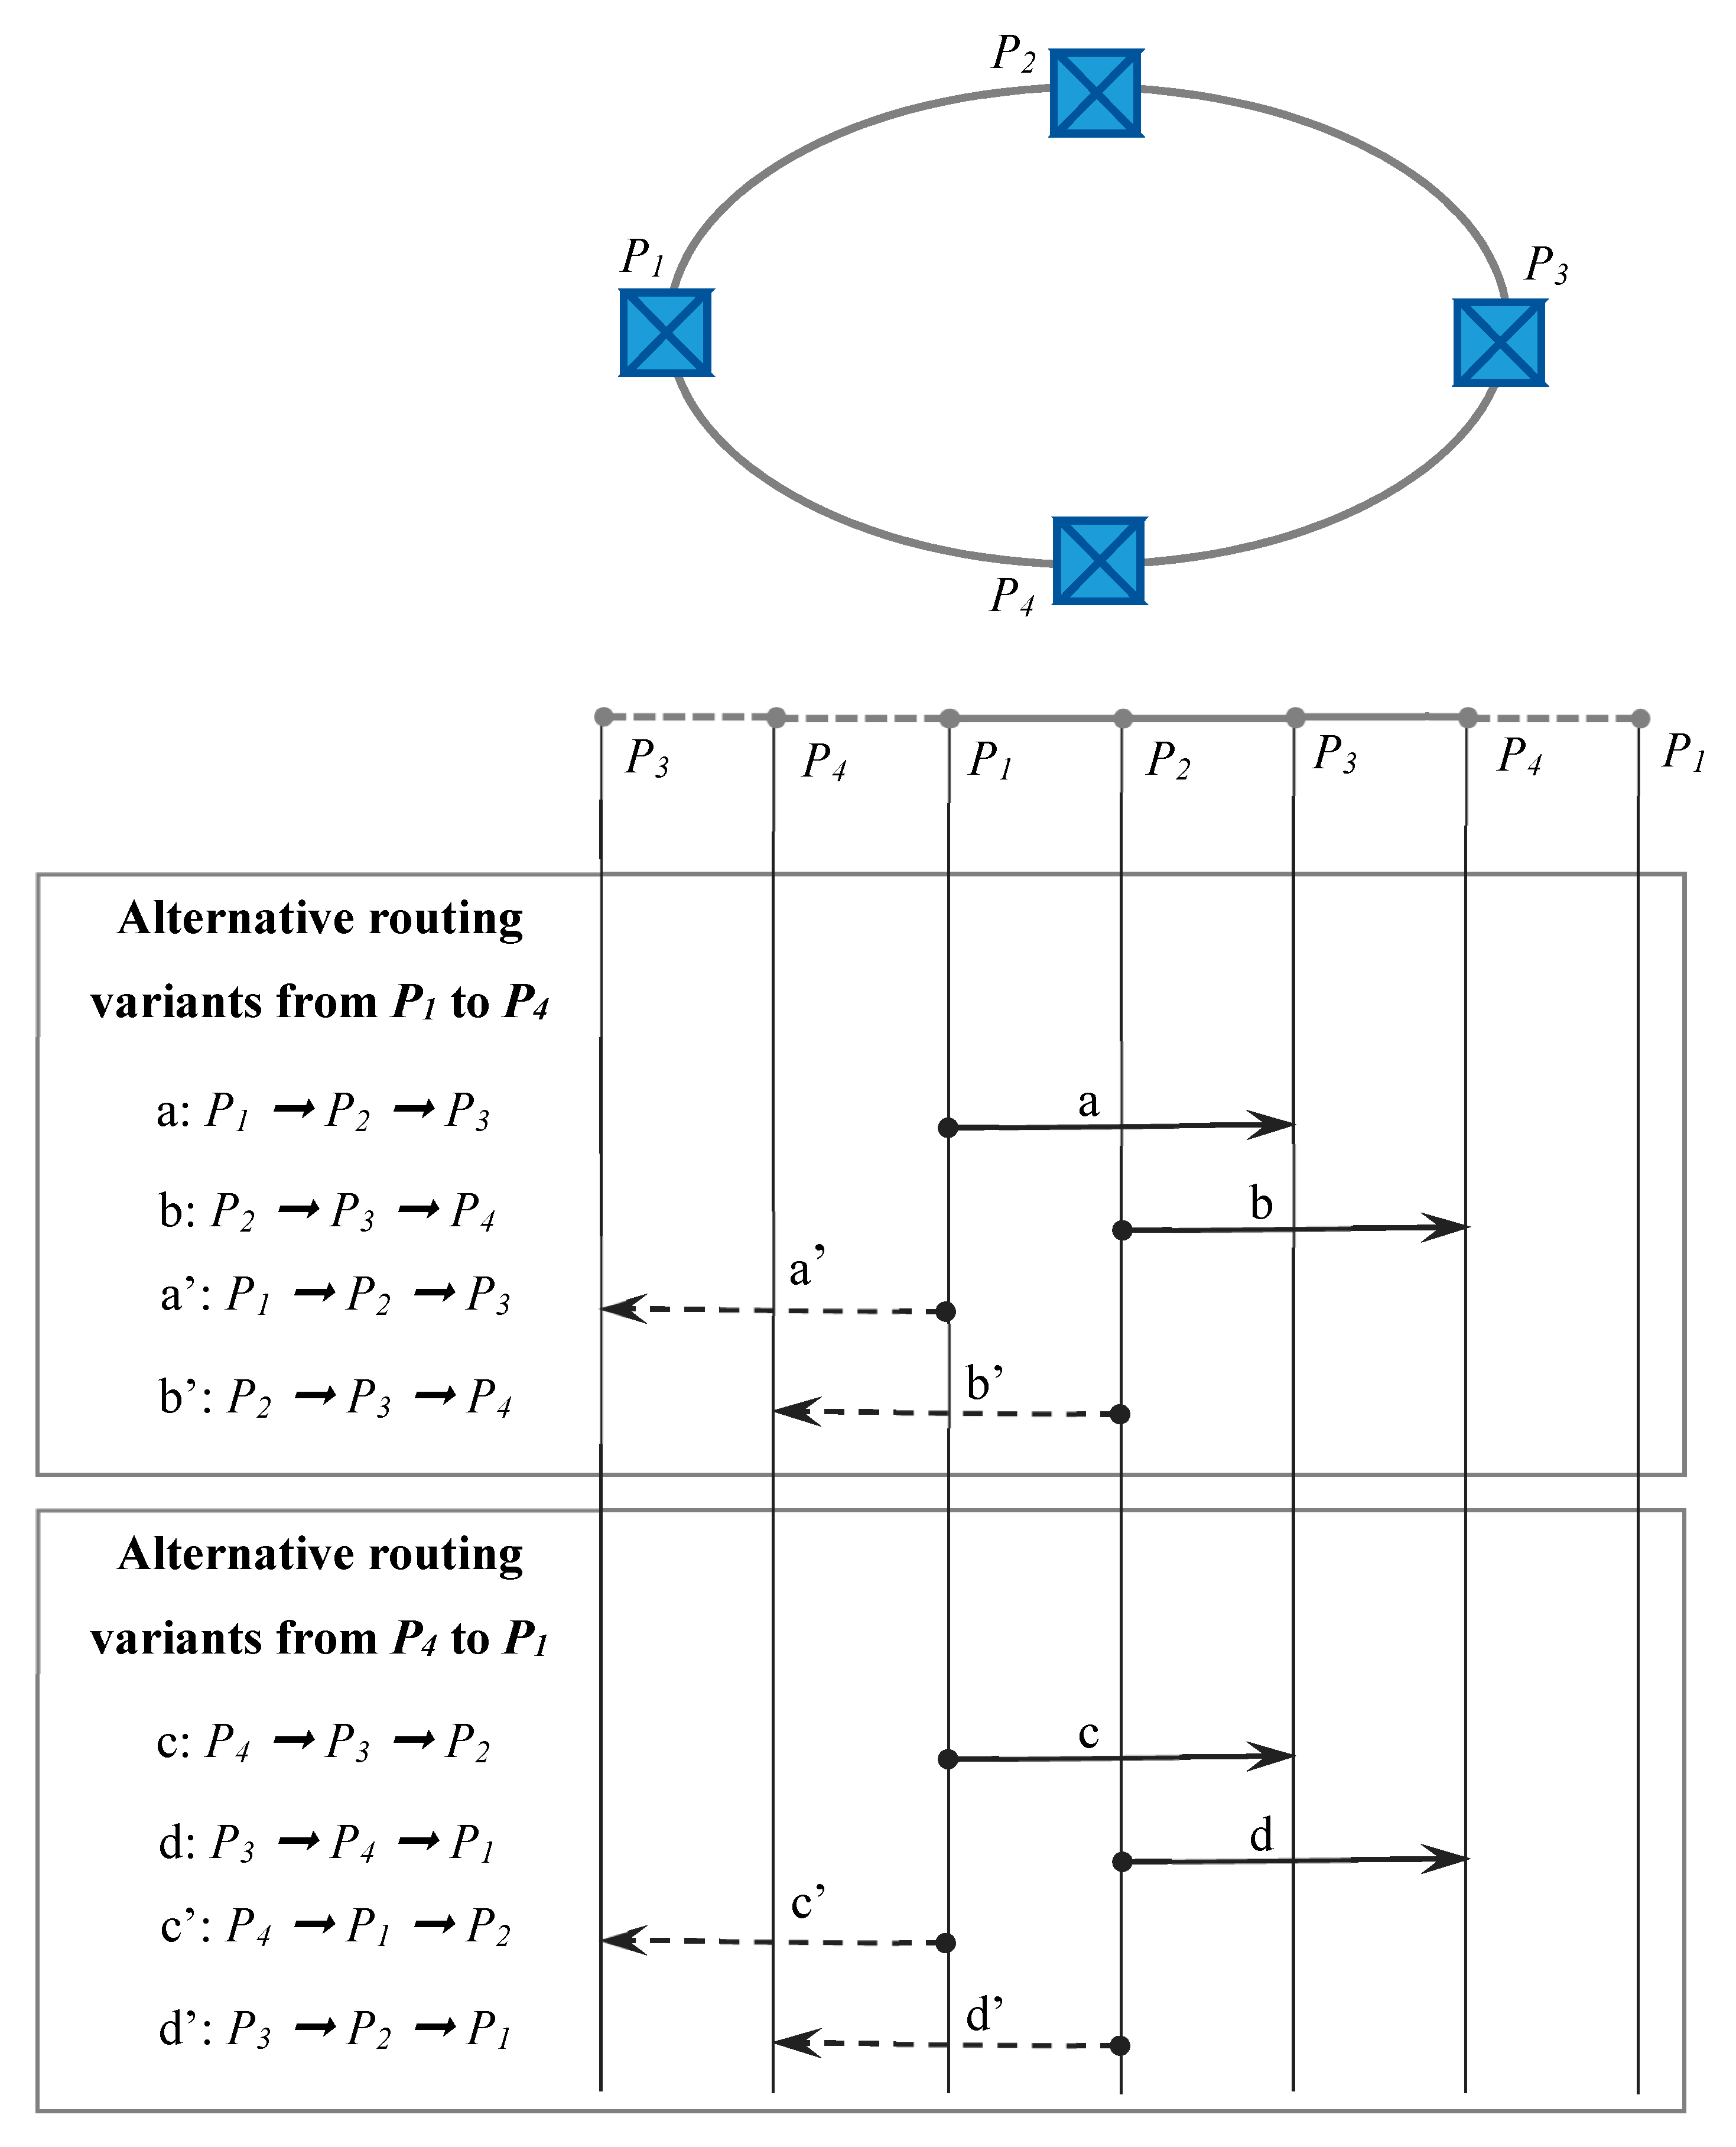
4.3. Scenario C
As mentioned, the road infrastructure development in the area where the UDCs are located will probably facilitate the exchange relations between the centers’ logistic platforms. By placing the logistic platforms on the road ring, a new problem appears in the analysis. Namely, alternative routes can be used between the non-neighboring logistics platforms, as illustrated in
Figure 9.
For each of the four possible combinations for the alternative variants in each direction (ab, a’b, ab’, a’b’, for the relation from P1 to P4, and cd, c’d, cd’, c’d’, for the relation from P4 to P1) Ω’ and respectively, Ω″, were calculated, as in the previous scenarios.
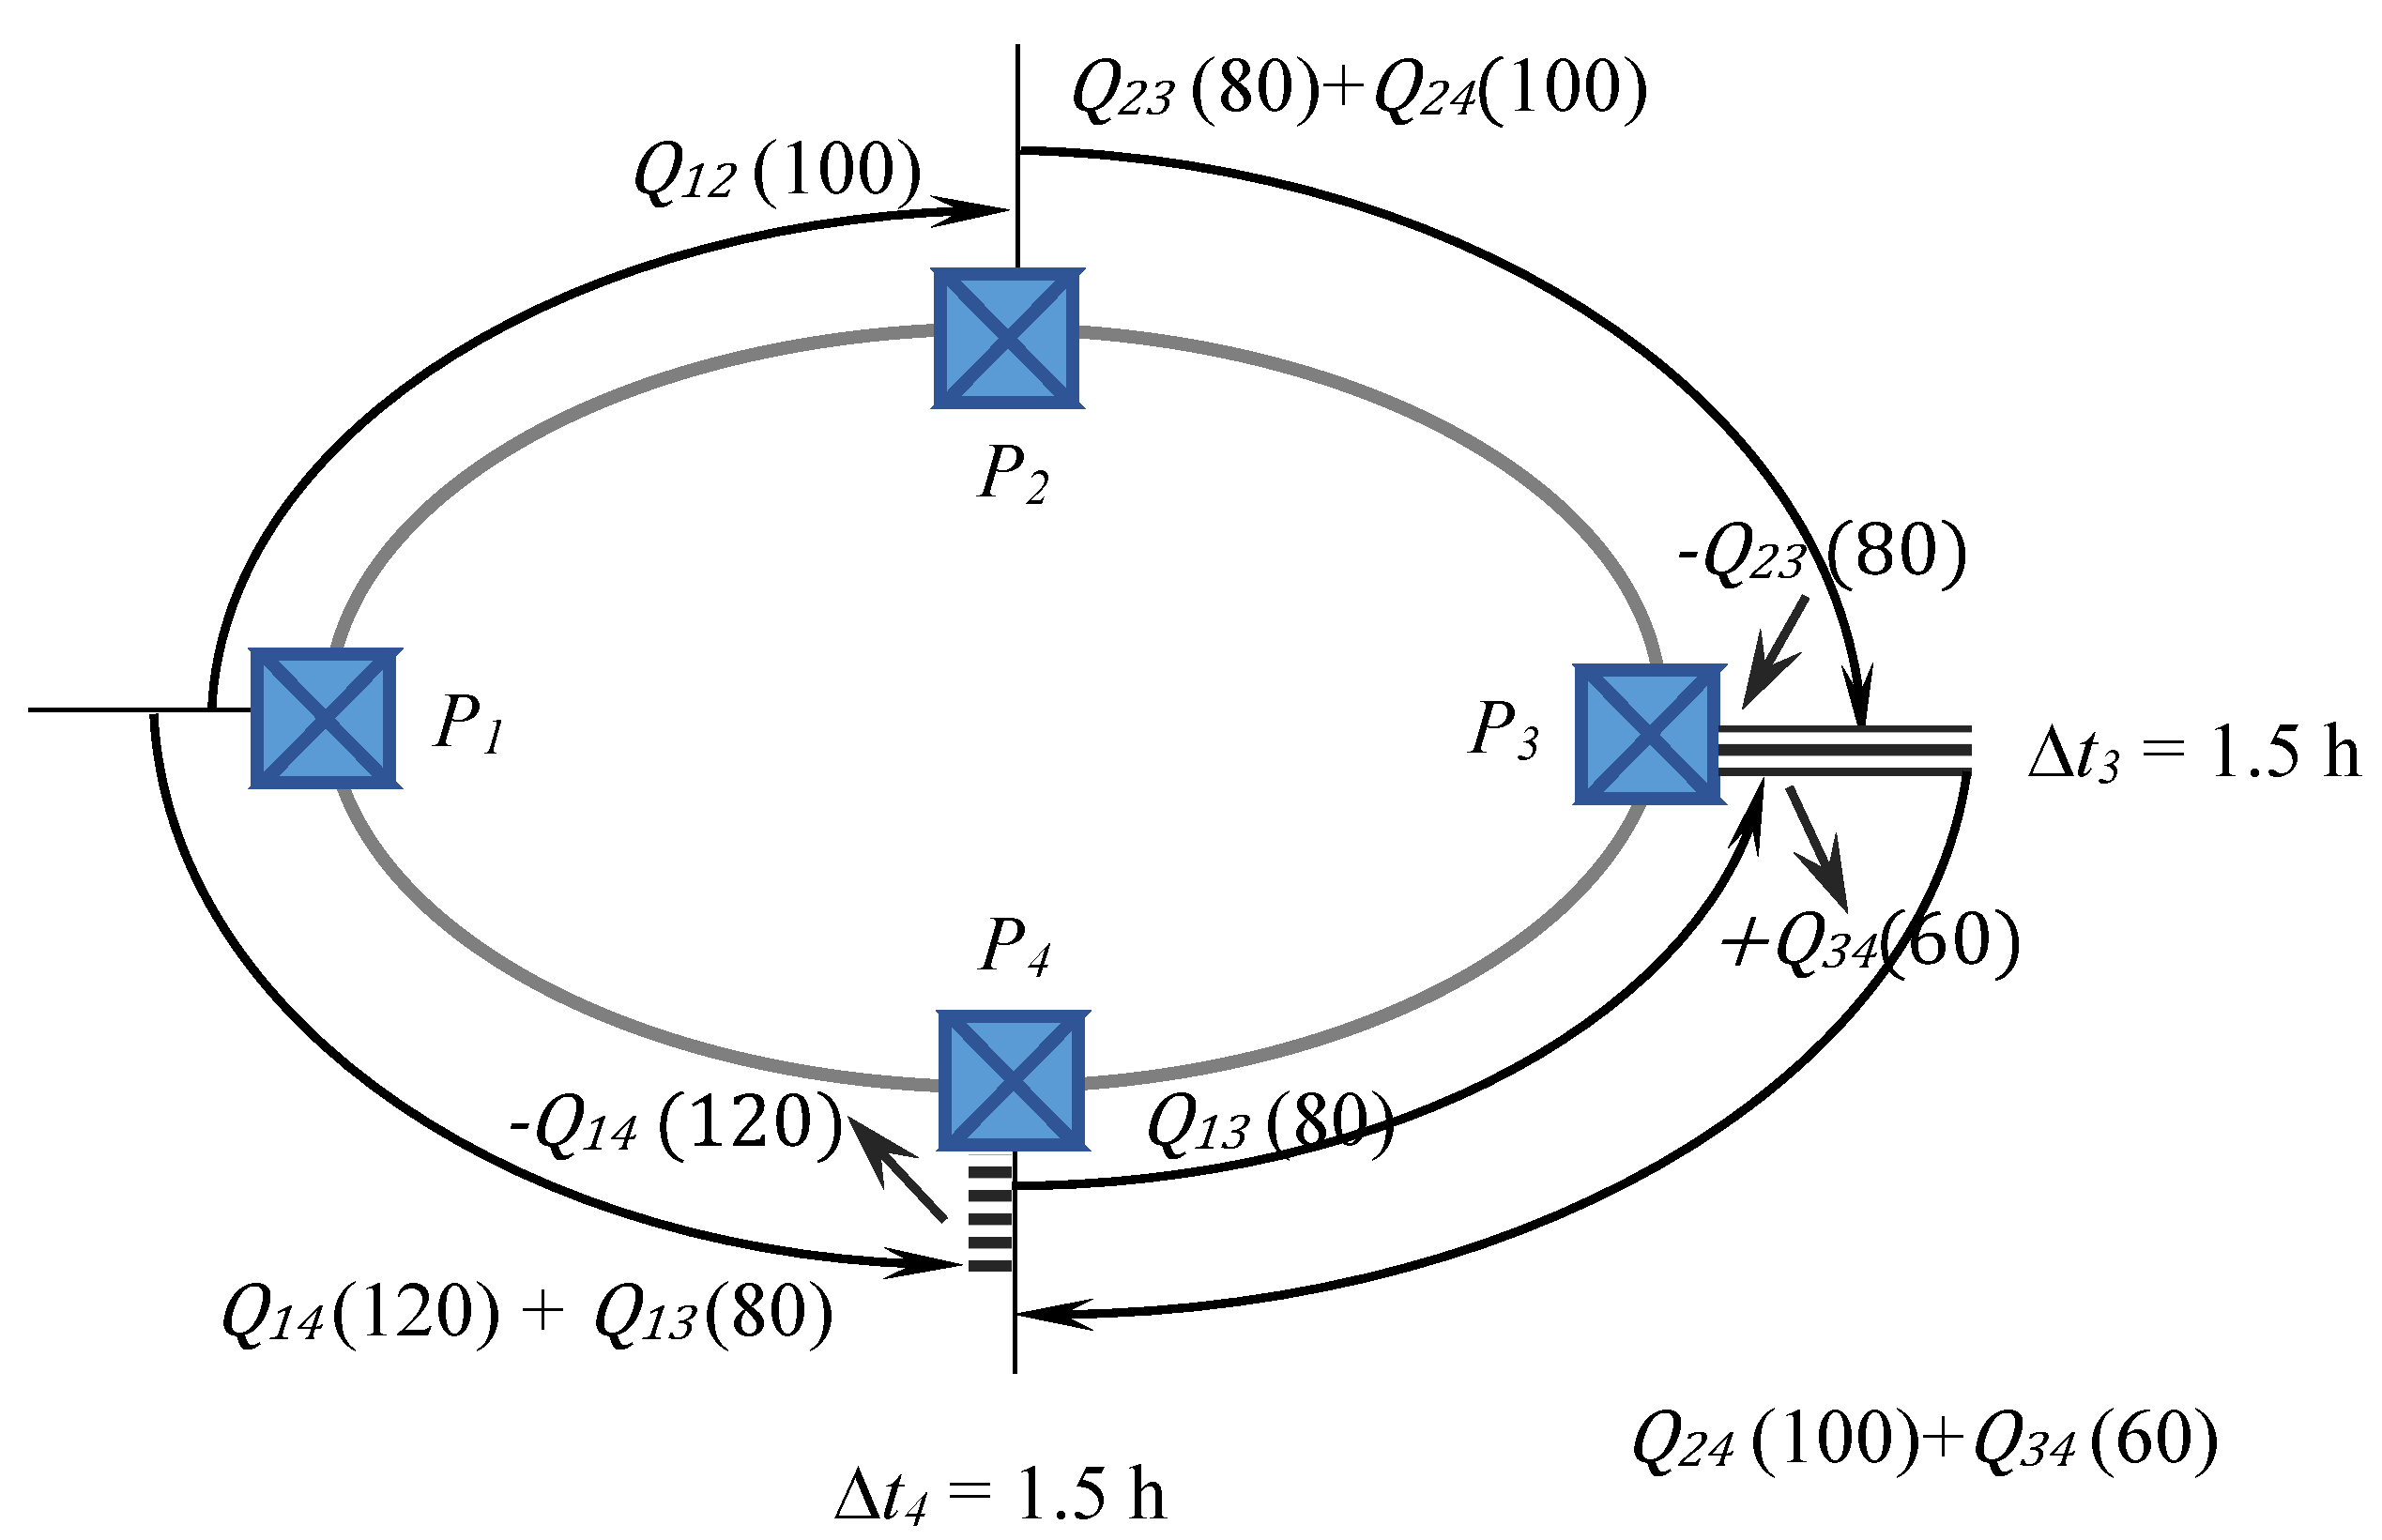
It turned out that for the relation P1 to P4 the a’b combination in the variant of flow consolidation presented in
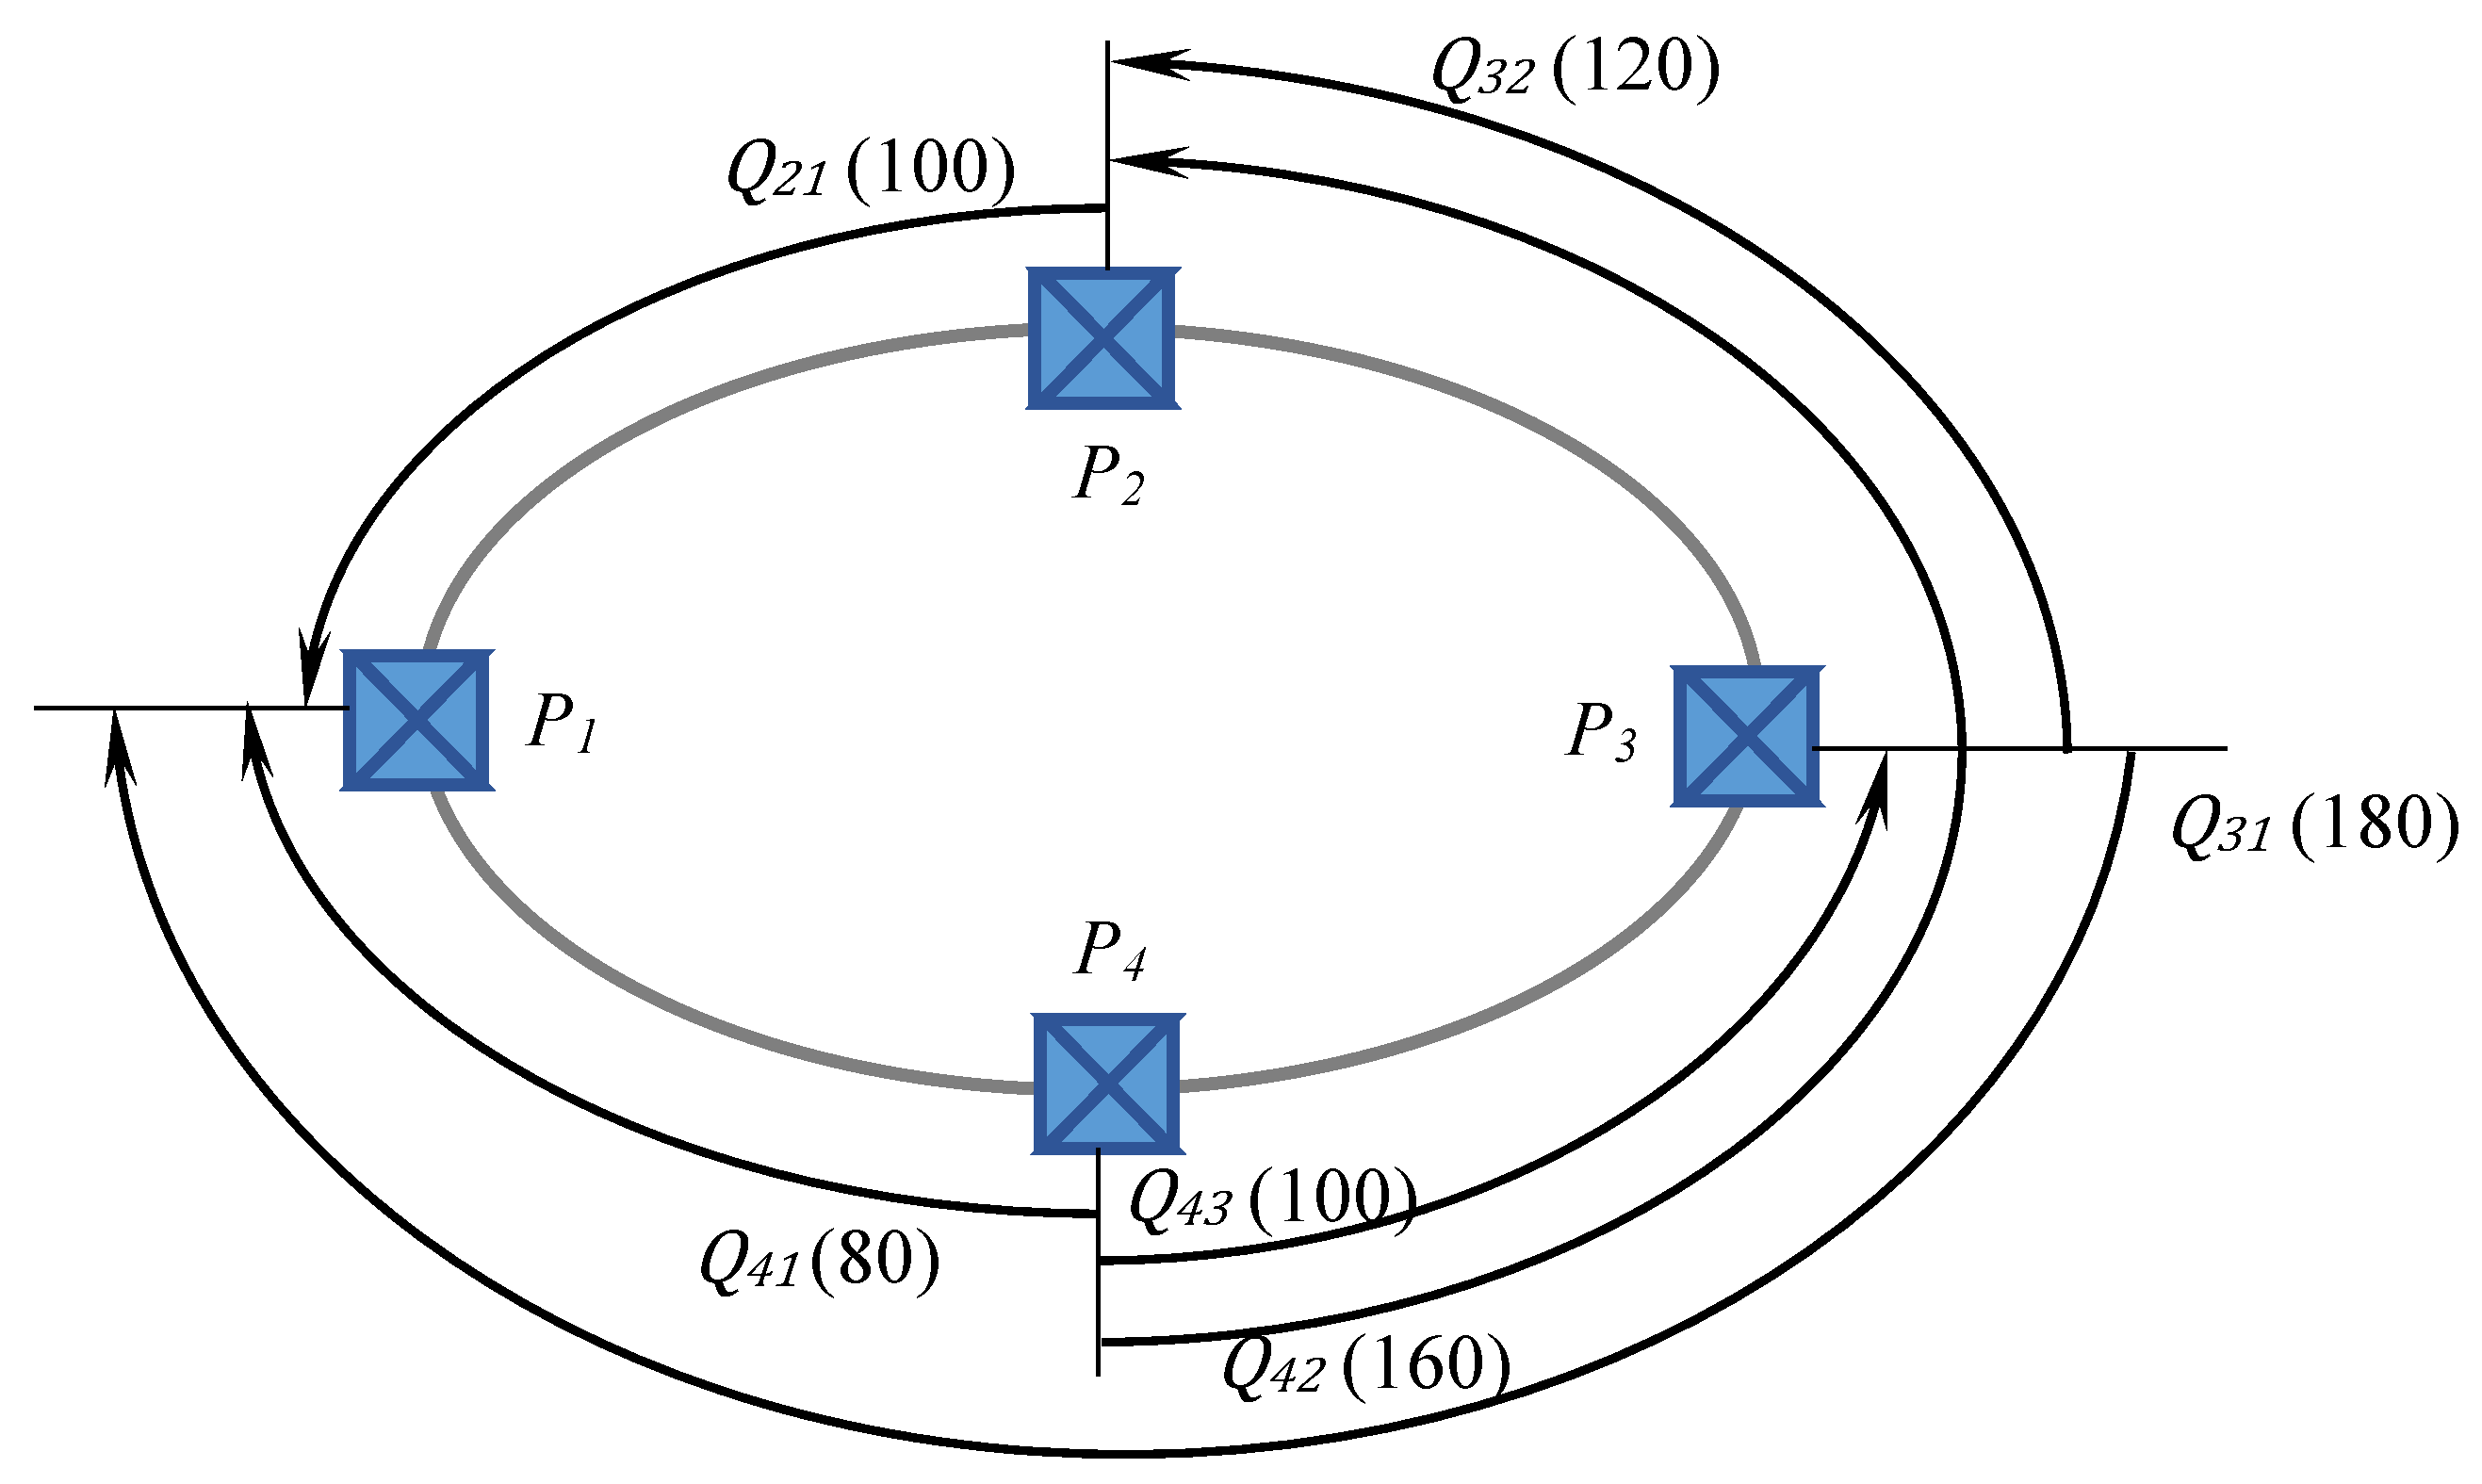
Figure 10, ensures the minimum of Ω’. And for the relation P4 to P1, all four combinations recommend the same variant of flow guidance (without a combination between them) with the same minimum Ω″ (in
Figure 11 it is shown the variant recommended in the cd combination). In comparing the variants for both directions, Δ
t1 = Δ
t4 = 1.5 h/pallet were used.
5. Discussion
In all three scenarios presented, the number of relations in which the flow of products destined for commercialization are established is lower than in the case of horizontal collaboration between centers.
If the number of producers is u and the number of consolidation centers at the edge of urban areas that are open to direct deliveries from producers is s, then u·s relations (origins - distinct destinations) are necessary in order to assure the variety of all products in each. Or, if we consider possible “on-going” consolidations during transport from producers, then the number of relations becomes u·s/u1, where u1 represents the average number of consolidations during transport from producers to centers.
If all UDCs receive supply flow from producers (scenario A is an exception), the number of relations is u·s/u2 + s(s-1), where u2 represents the average number of “on-going” consolidations (u2 > u1, or if u2 = u1. Then, shipments to UDCs use higher capacity transport means, the scale effect being noticed).
Then, for each u > s·u1, the number of relations in case of collaboration between UDCs is lower than in case of direct deliveries from producers to UDCs (u·s/u1 > u/u2 + s(s-1) and for u2 = u1 meaning that u(s-1)/u1 > u/u2 + s(s-1), for u > s·u1).
In all the three scenarios analyzed for the horizontal collaboration between the UDCs from the boundary of the urban agglomeration, the number of relations in which flow is generated is smaller than in the case of lack of collaboration (since it is obvious that u ≫ s). However, the supply flow from each producer or group of producers (u2) to only one of the UDCs, which has exchanges with all the others, is much more significant (the consolidation is due to the reduction in the destinations number).
For the specific situation, corresponding to the three scenarios, the elements that guide the choice are pointed out in
Table 2;
Table 3. In order to simplify the calculations, average travel speeds are considered equal over all relations. In the variants of heterogeneous shipments, the visit of an intermediary center increased the length of the trip by L/4 and by 1.2 h the waiting time of the loaded vehicle during transport. The number of loaded and empty trips listed in
Table 2, which significantly differentiates the three scenarios, is the consequence of the fact that in the activity cycles proposed for vehicles, the return of the vehicle was considered in the starting point of the cycle. In the case of outsourced transportation, in conjunction with other tasks from the market, the share of empty trips will be probably to be reduced.
We have to underline that the results presented are specific. Each mutualization case is different and should be treated as such. Each mutualization solution is unique in the way of organization, flow (size and structure), geographical locations, characteristics, transport means and configurations of the links on the existing infrastructures between the logistics platforms.
In other words, each solution proposed for the resources horizontal mutualization involved in the large distribution logistics bears the imprint of the links between transport and the spatial planning. Further research will be required for developing software tools and simulation models [
28,
32] so as to identify appropriate solutions for each peculiar case (with different variants of collaboration and mutualization, heterogeneous vehicles, etc.).
6. Conclusions
Urban logistics by the large number of origins and destinations of goods flow, by the extremely large variety of the flow structure, by the delivery requirements (transports at the right times, reliability criteria and temporal flexibility), as well as by the number of actors involved is a sophisticated logistic. The attributes of this logic, specifically regarding consumer goods commercialized in urban areas, under the increased demands of sustainable development, has encouraged us to find effective and efficient solutions. In the evolution dynamics of the practices in urban logistics, it is worth noticing the dynamics of the last years towards resources sharing for the actors involved. The results in vertical mutualization are more consolidated and more present in the best practices promoted. However, in the horizontal mutualization, the results are fewer and more often controversial, in particular due to the wholesalers who want to keep their marketing channel confidentiality.
The study undertaken proposes a methodology to select solutions for horizontal cooperation in order to consolidate flow at the edge of the urban agglomeration. The scenarios analyzed will probably draw attention to the possibilities for consolidating the flow of producers (by limiting to a single destination the shipments from each producer, or from a few in case of consolidation on the route, regardless of the urban distribution centers through which they reach the stores that launched the supply orders). All manufacturer deliveries are intended for the urban logistic platforms that collaborate with each other to ensure the supply, in accordance with the requests addressed to the manufacturers, of all urban distribution centers (UDCs). The UDC warehouses have their own management, do not cooperate with each other and are distinct entities from the logistic platforms that are similar to consolidation centers. In this way, the privacy of marketing channels is not jeopardized.
The differentiated accessibility of the suppliers for commercialization within the urban space is the one that determines the choice of the logistical platform in which the delivery is made, regardless of the UDC warehouses which, subsequently, they must reach.
The scenarios analyzed highlight the differences in attractiveness in relation to the road infrastructure network evolution in the area of interest, as well as the influence of improving the infrastructure that ensures the connection between the logistics platforms.
The results of the study undertaken, although particular, will most probably stimulate the search for solutions, appropriate to other situations, so as to be able to take advantage of the flow consolidation at the boundary of urban areas through horizontal collaboration. As flow exchanges between the logistic platforms and the warehouses of other UDCs involve a relatively large number of vehicles, it results that an operative activity of monitoring and directing the routes is necessary to limit consumption and the extremely negative effects of traffic.
The involvement of 3PL and 4PL providers is crucial for the implementation of this horizontal mutualization at the boundary of the urban area, whose effects are likely to spread in the evolutions of hubs and distribution networks.


