Abstract
Historical, downscaled and projected data for six cities in South Korea were collected and analyzed using non-parametric Standardized Precipitation Index (SPI) across the Representative Concentration Pathways (RCPs) RCP4.5 and RCP8.5. SPI results were utilized in further analyses: intensity, decadal frequency, and temporal shifts. Non-parametric SPI was used as it produces more reliable results in terms of their statistical, spatial and temporal characteristics. RCP4.5 was taken to represent concentrations under the current emissions trajectory, while RCP8.5 represents the high-end scenario. Findings suggest that extreme precipitation events are more likely to increase in number than extreme drought across all timescales and RCPs. Variability was observed to increase when comparing SPI obtained from actual, measured and gridded precipitation. More extreme droughts are expected under RCP8.5 forcing as are the occurrence of multiyear droughts and extreme wet events relative to RCP4.5. A seasonal shift in extreme precipitation of up to 3 months earlier was observed. Generally, the period between 2080 and 2100 holds the highest probability to host extremely rare and persistent events.
1. Introduction
Globally, there has been an increase in flood and drought occurrence and severity as a result of climate change [1,2,3]. The ensuing trend means that precipitation is increasing in already wet places and dry places are getting dryer [4]. The variability of these changes is increasing the difficulty of planning cities and increasing the risk to livelihoods all over the world [5,6,7].
Temperature and precipitation are expected to largely increase across the Korean Peninsula by the end of the century [8]. Precipitation above 20 mm day−1 increased in frequency in the North, while precipitation between 5 mm day−1 and 40 mm day−1 decreased slightly in the South [8]. Observed annual precipitation in South Korea has increased by an average of 283 mm year−1 in a 35-year timeline from 1973 to 2007 [9]. Data collected from 61 weather stations and used to extract a total of 31 extreme climate indices from 1973 to 2007 found an overall increase in precipitation by 85.5 mm per decade. Between 1988 and 2002, the intensity of rainfall above 40 mm day−1 increased by 29% when compared to the period between 1973 and 1987 in South Korea [10]. This study also reported an increase in total precipitation occurring within late summer or early fall months. The months of August and July had the highest increment, recording an increase of 36 mm and 30 mm, respectively [10]. A general increase in precipitation exceeding 200 mm in the next two decades and in excess of 300 mm from 2040 onwards is expected in South Korea along with a rise in temperatures [11,12].
The United Nations regards South Korea as a water-deficient nation with increasing water scarcity and drought issues [13]. Along with other OECD (Organisation for Economic Co-operation and Development) countries, South Korea has imported some of the largest amounts of virtual water. Between 1995 and 1999, the country imported approximately 112.6 billion cubic meters of virtual water [14,15]. South Korea currently has a massive drought burden affecting the entire nation [16,17]. Drought incidence has been particularly prevalent in recent years, especially between 2012 and 2017 [18]. Annual precipitation values dropped in 2017 to about 74.2% of normal nationally, and in the Southern part of the country, this fell to between 56% and 65% of normal precipitation [18]. Considering that South Korea has faced two “mega-droughts” in the past from 1778 to 1800 and from 1875 to 1909 [19,20,21], categorizing possible extreme weather using future projections becomes expedient. Needless to say, these challenges have an increased tendency to be exacerbated by climate change-induced drought in the coming decades.
Extreme events are sometimes defined on a regional or circumstantial basis. The reason is for practicality and relatability purposes, as what constitutes an extreme event changes from region to region [22]. Extreme weather events can also refer to “phenomena that occupy the extreme poles of the historical distribution and are rare for a specific place and/or time, especially severe or unseasonal weather” [23]. Extreme weather in the South Korean context can be defined using “actual rainfall amounts”, which classify heavy rainfall as an event where the daily precipitation value is above 50.8 mm day−1 and “very heavy rainfall” as an event where precipitation is measured to be above 101.6 mm day−1 [24].
Extreme events can be described using any of these attributes [25]:
- Rate—describes the probability of an event occurring per unit time of its occurrence.
- Magnitude—describes the intensity of an event, usually in comparison with a standard or previously known magnitude.
- Temporal—duration and timing.
- Spatial scale (footprint)—the geographic scope of the event in areas that affect human activity.
- Multivariate dependencies.
The importance of determining and categorizing extreme weather cannot be overstated. It is imperative for planning, policy-making and developing early warning systems [26,27,28]. Among all the above methods, none used non-parametric Standardized Precipitation Index (SPI). Yet, non-parametric SPI has been found to produce more temporally and spatially consistent results over parametric SPI [29]. Parametric SPI has also been found to underestimate dryness or wetness when precipitation was either too low or too high, respectively, in a study that compared parametric SPI that had been fitted to a gamma distribution with actual rainfall means [29]. SPI analyses considering several timescales were also found to be advantageous [30].
Thus, this work applies non-parametric SPI to categorize hydrological extremes using actual (SPIactual), downscaled (SPIdownscaled) and gridded (SPIgridded) data from HadGEM-2-AO Global Circulation Model (GCM) 3 and weather stations obtained from the Korea Meteorological Administration (KMA) [31]. Changes in frequency per decade, mean intensity and temporal shifts (timing and occurrence of seasonal extremes) under different Representative Concentration Pathways (RCPs), timescales and in different cities are identified and discussed.
2. Materials and Methods
2.1. Study Area
This study is designed to look at future precipitation trends using SPI in six South Korean cities. The study area captures the major cities in the country. Categorizing extremes for these cities acknowledges the fact that gridded precipitation data cover more than one city. However, these cities are representative of the population and urban infrastructure at risk due to the extremes discussed in this study. These cities, their locations and other relevant information are shown in Table 1 and Figure 1 (below). Figure 1 also shows yearly normal precipitation, while Figure 2 shows seasonal climate characteristics, respectively, for South Korea.

Table 1.
Study areas and relevant information.
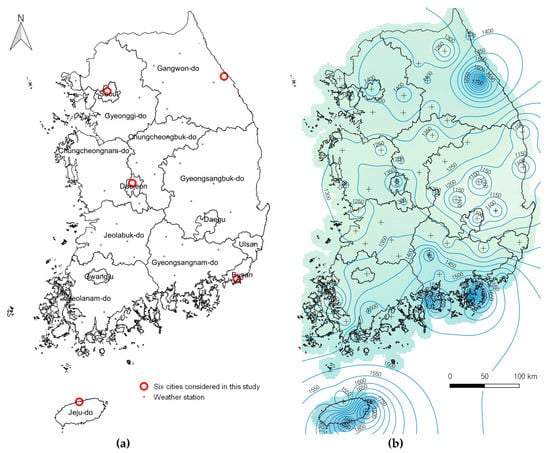
Figure 1.
Map of South Korea, showing the six study areas circled in red and weather stations used to collect actual historical precipitation data (a) and yearly normal precipitation in millimeters for South Korea between 1981–2010 (b).
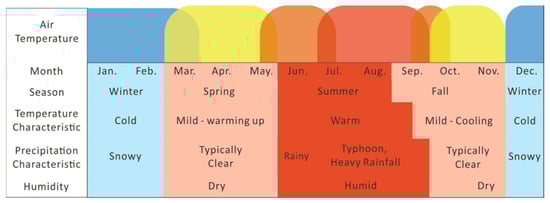
Figure 2.
Seasonal climate characteristics outlined monthly.
2.2. Standardized Precipitation Index (SPI)
SPI has been adequately used for drought monitoring and flood categorization [33,34]. First developed by researchers in 1993 [35], SPI has advantages in its simplicity and reliance on a singular input for analysis. SPI is also standardized and as such easy to compare and plot against other variables. It is also expedient in describing drought in relation to duration and time [27,34]. The index’s development was also influenced by the need to develop a framework that represented abnormal wetness and dryness better [28].
2.3. Data Set
Data for this research include monthly historical, projected and downscaled precipitation values obtained from KMA. The historical data cover the period from 1970 to 2018.
Scenarios developed from GCMs have low resolutions in both temporal and spatial scales, which make it difficult to apply the results to hydrologic assessment of a watershed scale directly. Therefore, hydrologic assessment of climate change impact on a catchment scale involves downscaling. KMA adopted a dynamic downscaling utilizing HadGEM3-RA with a grid size of 12.5 km from the results of HadGEM2-AO [36]. Then, Modified Korean PRISM (Parameter-elevation Relationships on Independent Slopes Model) [37] was applied to produce high-resolution scenarios with a grid size of 1 km in the Korean Peninsula [36]. KMA relied on Quantile Delta Mapping (QDM) algorithms [38] for this process. QDM enables both preserving long-term trends for all quantiles including extremes and bias-correction. KMA gathered 60 ASOS (Automated Synoptic Observing Systems) data, which have more than 30 years of observed data from 1976 to 2005. Then, SDQDM (Spatial Disaggregation Quantile Delta Mapping) based on QDM was used for bias correction and spatial disaggregation from 13 selected GCMs. NCAR Command Language (NCL) and Fortran were used as programming languages [39,40]. Downscaled data cover the years 2000 to 2100.
Two RCPs are considered for this study: RCP4.5 to represent the current emissions trajectory and RCP8.5 to represent the high-end emissions scenario. RCPs are delineated as four forcing scenarios and potential climate conditions depending on the modeled amount of greenhouse gas emissions [41]. RCP4.5 is chosen as the current trajectory of anthropogenic emissions because of the enormity of carbon emission reduction and changes in energy use necessary to achieve RCP2.6 [42]—most of which are not being currently achieved—and the similarities between RCP2.6 and RCP4.5. Emissions leading to RCP4.5 forcing are expected to peak in 2040 [43]. Figure 3 below illustrates the four RCPs with RCP4.5 (in purple) and RCP8.5 (in red).
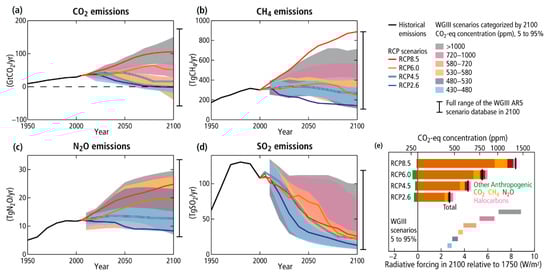
Figure 3.
Representative Concentration Pathways (RCPs) and their respective radiative forcing levels for different greenhouse gas emissions [44].
2.4. Extracting Data and Estimating the Period of Extreme Occurrence
A simple MatLab® script was utilized to extract monthly precipitation data from 1860 to 2100 in individual cities according to their corresponding coordinates. Data for extremes beyond ±2.0 were obtained from the SPI results, using the “Brush/Select Data” tool of MatLab. These results were then further analyzed. To calculate the estimated year of occurrence for extremes, the following formula was used:
or
where is 1859, the year before the rainfall data begin, is the month value at the time of extreme occurrence from the SPI graph, and is the estimated year in which an extreme is projected to take place. For periods ending in whole numbers, Equation (1) is used, while Equation (2) is for periods ending in decimals. To calculate the estimated month of occurrence, the decimal part of is divided by 0.083, transforming the values from base 10 decimals to duodecimal whole numbers within the range 0 to 11. The zero value depicts December (i.e., one complete cycle of 12 months), while 1 to 11 signify January to November, respectively.
2.5. Classification of Extremes
A wet or dry period may be defined for any timescale using SPI as the time interval, within which the SPI is uninterruptedly positive or negative until it attains a value of ±1 [45]. For the purpose of this research, extreme events are classified as those for which the computed SPI value is beyond ±2.0. A rare event is one in which the SPI value is at maximum positive or negative. For this work, that value is from ±2.8 and beyond for gridded precipitation values and ±2.5 for downscaled precipitation, which are 1000-year extremes on the SPI scale with a probability value between 0.0064 and 0.0014 (Table 2). This approach effectively classifies extremes in the study area because regions and seasons of low average rainfall exist in South Korea, thus SPI values between 1, 1.5 and just below 2 are likely to lead to optimal circumstances of water availability for urban use and agricultural consumption and not necessarily constitute extremes.
Table 2.
Standard Precipitation Index (SPI) values showing cumulative probability and intensity from extremely wet to extremely dry [35,46].
An extreme is referred to as persistent when a chain of extreme events occurs in an unbroken chain of 4 months or more than 6 months with a 2-month or less interruption.
2.6. Decadal Frequency and Mean Intensity of Extremes
A simple t-test, comparison of means with Microsoft Excel’s data analysis toolbox, was used to determine if any significant change in the Mean Intensity (MI) of extremes from 1970 to 2018 (actual precipitation) and from 2020 to 2100 (downscaled precipitation) occurred, i.e., if the mean SPI for the former period differs significantly (p < 0.05) from mean SPI in the latter period and the direction of difference. SPI values and their intensity can be seen in Table 2. Decadal Frequency (DF) is defined as the number of extreme events occurring in a decade. It is calculated by segmenting the period being studied into decades (e.g., from 1976 to 1985 represents the first decade of actual precipitation from KMA and so on), then finding the ratio of events per decade.
3. Results
Analyses based on actual precipitation suggest less temporal variability than those from gridded and downscaled data. There is also a marked difference in the timing of extreme occurrence when compared to results in the same timescales for observed, gridded and downscaled data.
For analysis done using gridded data, across all six cities and all three timescales, extreme precipitation events are expected to outnumber extreme dry events regardless of the RCP scenario. However, the number of dry events increases under RCP8.5 forcing across both typically wet and dry periods, and this can be attributed to expected warmer temperatures preventing cloud condensation [47]. Dryer periods show higher likelihoods of hosting more extreme dry events (RCP4.5), and extreme precipitation is more likely to occur on the whole regardless of the season.
Analysis of decadal frequency suggests little to no change in a majority of the cases except in the SPI12 analysis for the RCP4.5 scenario.
3.1. Six-Month Standardized Precipitation Index (SPI6)
Results for SPI6 using actual historical precipitation data from KMA show a steady trend in SPI averaging ±2.25 (Figure 4). This depicts less variability than what is observed in SPIdownscaled and SPIprojected analyses. The timing of extremes is also similar in most cities studied except in Busan and Daejeon.
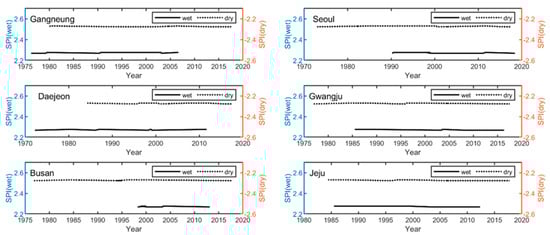
Figure 4.
Six-month Standardized Precipitation Index (SPI6) results from actual precipitation values from the Korea Meteorological Administration (KMA), showing only extreme wetness and dryness for individual cities in the study area. This result covers the period from 1970 to 2018.
For SPIgridded developed based on RCP4.5 forcing, a rare precipitation event is likely to occur in all cities tested sometime in the late 2090s except for Jeju, which sees its last rare event before 2100 in late 2070s (Figure 5a). Seoul will likely experience more rare wet events with a six-month recurring timescale than other cities.
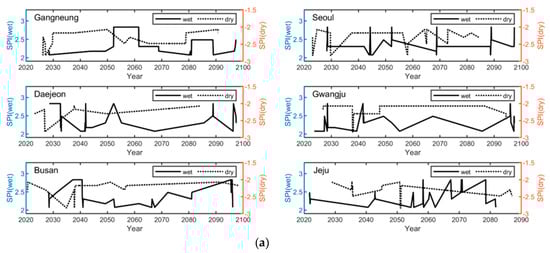
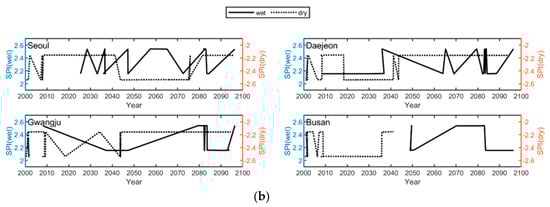
Figure 5.
SPI6 results from (a) gridded Global Circulation Model (GCM) projections and (b) downscaled precipitation (RCP4.5), showing only extreme wetness and dryness for individual cities in the study area. This result covers the period from 2020 to 2100.
The six-month SPIdownscaled (Figure 5b) suggests that Seoul, Daejeon, Gwangju and Busan are likely to experience a rare precipitation event within the decade from 2080 to 2090 and between 2040 and 2050. Variability is similar to gridded precipitation. In this analysis, Seoul is also projected to host a larger number of rare extreme precipitation events. However, the timing of extremes differs significantly.
Variability in the occurrence of extremes is observed to be more pronounced in analyses based on RCP8.5 forcing, and there is a marked increase in the quantity and magnitude of extreme dry events when comparing Figure 5a,b with Figure 6a,b.
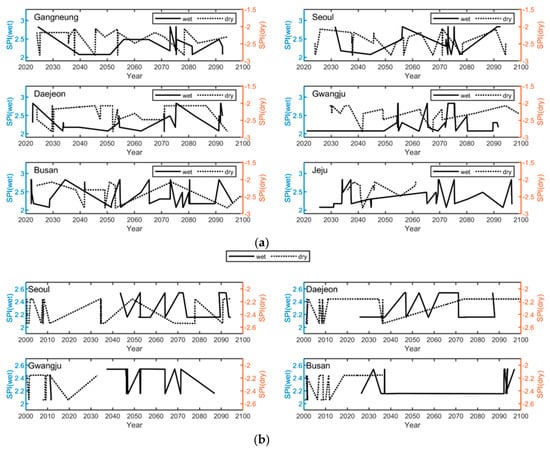
Figure 6.
(a) SPI6 results from gridded GCM projections; (b) downscaled precipitation (RCP8.6), showing only extreme wetness and dryness for individual cities in the study area. This result covers the period from 2020 to 2100.
For downscaled precipitation (Figure 6b), the quantity of extreme dry events decreases with time in Gwangju and Busan.
3.2. Twelve-Month Standardized Precipitation Index (SPI12)
Usually depicting longer timelines, SPI12 relates to direr consequences of precipitation or the lack thereof. SPI12 based on measured precipitation data as in SPI6 yields a near-linear plot devoid of the variability seen in downscaled and gridded data. SPI12 calculations depict much more temporal difference between extreme wet events and droughts than that observed in SPI6 (see Figure 7).
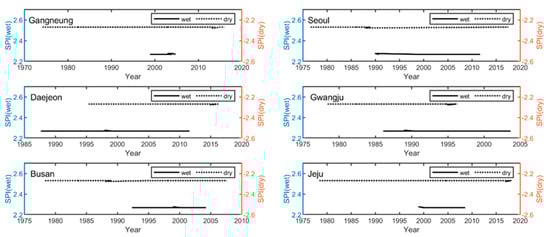
Figure 7.
SPI6 results from actual precipitation values from KMA, showing only extreme wetness and dryness for individual cities in the study area.
For SPI obtained from gridded data, variability is as expected much larger, and the period from the late 2080s until 2100 is likely to host clusters of extreme wet events.
The twelve-month SPIdownscaled (Figure 8b) results project a higher likelihood of extreme droughts occurring before 2050, except in Seoul where it stretches until the mid 2070s and in Busan with zero. The probability of extreme precipitation occurring in the decade from 2080 to 2090 is evident, off by almost a decade from the GCM projection (Figure 8a).
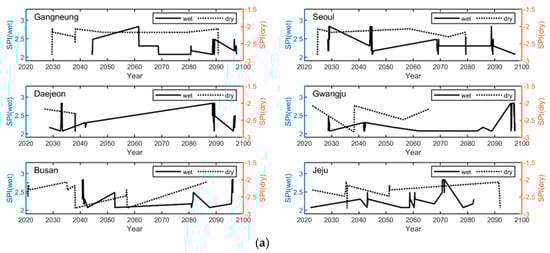
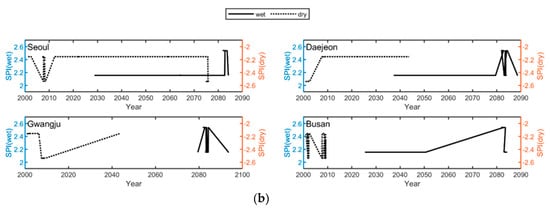
Figure 8.
Twelve-month Standardized Precipitation Index (SPI12) results from (a) gridded GCM projections and (b) downscaled precipitation (RCP4.5), showing only extreme wetness and dryness for individual cities in the study area. This result covers the period from 2020 to 2100.
The RCP8.5 pathway is likely to lead to twelve-month precipitation anomalies (Figure 9a) that lean more towards extreme aridity when compared to RCP4.5 using gridded precipitation data. For Gangneung, Seoul, Daejeon and Jeju, the period between 2090 and 2100 holds the most potential to host a rare precipitation event. Meanwhile, between the early 2030s and the late 2040s, rare droughts will occur in all cities, twice for Gwangju.
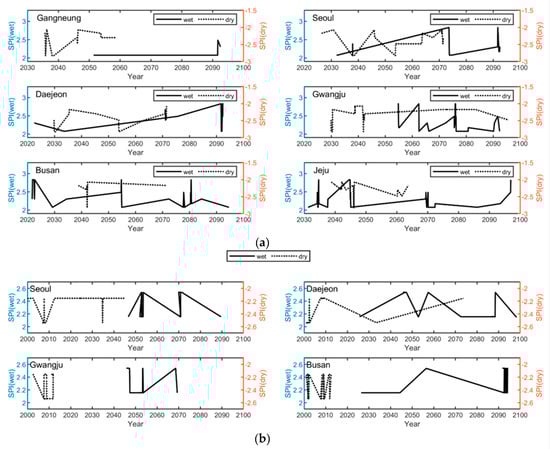
Figure 9.
SPI12 results from (a) gridded GCM projections and (b) downscaled precipitation (RCP8.5) showing only extreme wetness and dryness for individual cities in the study area. This result covers the period from 2020 to 2100.
Figure 9b depicts the results of SPI12 using downscaled precipitation. Variability in intensity is similar to GCM projections. The likelihood of extreme precipitation increases from the late 2020s onwards for Daejeon and Busan and from 2050 for Seoul and Gwangju. The likelihood of dry events occurring decreases when compared to RCP4.5 above.
3.3. Twenty Four-Month Standardized Precipitation Index (SPI24)
SPIactual for a twenty four-month timescale again shows less variability in intensity with much less occurrence of extreme precipitation and an increase in extreme droughts (Figure 10). There is a noticeable increase in the occurrence of extreme drought over extreme precipitation.
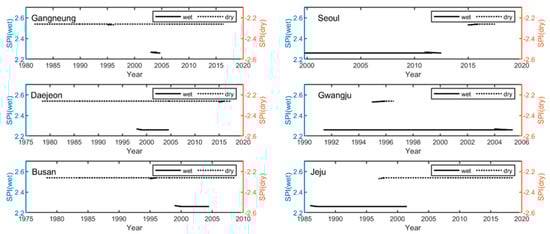
Figure 10.
SPI6 results from actual precipitation values from KMA, showing only extreme wetness and dryness for individual cities in the study area. This result covers the period from 1970 to 2018.
The twenty four-month SPIgridded shows that variability is still pronounced and the likelihood of extreme precipitation surpasses that of extreme drought, deviating from the historical observation for precipitation at this timescale. Daejeon is expected to experience a chain of persistent rare and extreme precipitation events in the late 2090s. Busan and Jeju will experience a rare dry event in the mid-2030s. A rare drought is likely to occur in Seoul in the mid-2020s, while Daejeon and Gwangju will not experience any rare drought (Figure 11a).
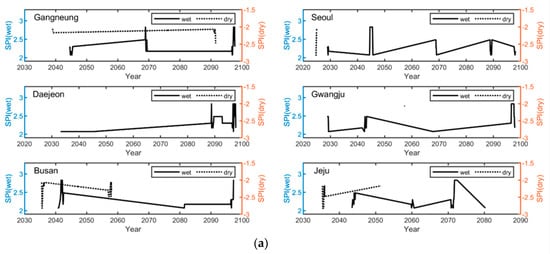
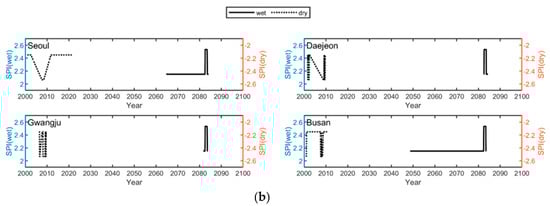
Figure 11.
Twenty four-month Standardized Precipitation Index (SPI24) results from (a) gridded GCM projections and (b) downscaled precipitation (RCP4.5); showing only extreme wetness and dryness for individual cities in the study area. This result covers the period from 2020 to 2100.
Analyses relying on downscaled data show some variability. They also project zero extreme droughts after the early 2020s, partially tallying with the analysis done using gridded data (see Figure 11b).
The twenty four-month SPI based on gridded precipitation and RCP8.5 forcing (Figure 12a) projects a reduction in extreme droughts in comparison to extreme wetness, except in Gangneung where no extreme precipitation is projected.

Figure 12.
SPI24 results from (a) gridded GCM projections and (b) downscaled precipitation (RCP8.5); showing only extreme wetness and dryness for individual cities in the study area. This result covers the period from 2020 to 2100.
For downscaled precipitation, less extreme precipitation is expected and extreme dryness is also minimally projected (see Figure 12b).
3.4. Decadal Frequency and Mean Intensity
After segmenting the entire period of study into decades and obtaining the ratio of extremes per decade, the results do not show a clear trend of increase or decrease with time. The decade from 1996 to 2005 had the highest frequency of extremes except for SPI12 (see Figure 13 below).
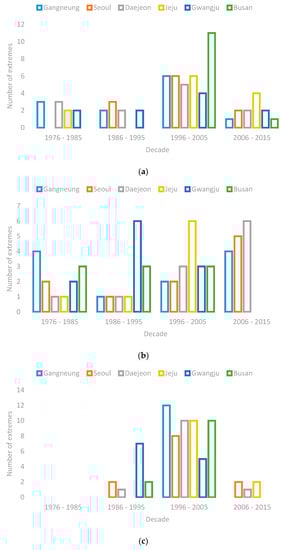
Figure 13.
The number of extremes observed per decade from actual precipitation from 1970 to 2018. Figure shows (a) extreme precipitation SPI6 (b) extreme drought SPI6; (c) extreme precipitation SPI12; (d) extreme drought SPI12; (e) extreme precipitation SPI24; and (f) extreme drought SPI24.
Figure 14 below shows the decadal frequency for extremes using downscaled data from 2020 to 2100. The results show variability in the occurrence of extremes with no clear upward or downward trend. Extreme precipitation is more frequent from 2080 to 2089 across all timescales. Extreme dryness occurs with even more variability, projected to be absent in some cities but occurring in Seoul, Daejeon, Gwangju and Busan between 2040 and 2049 for SPI6 analysis.
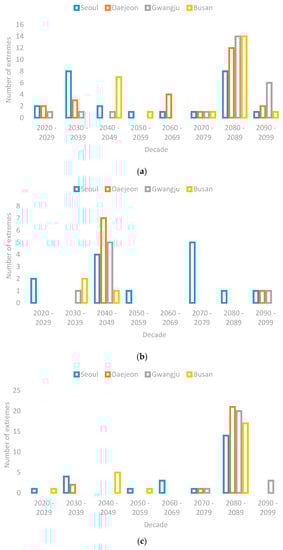
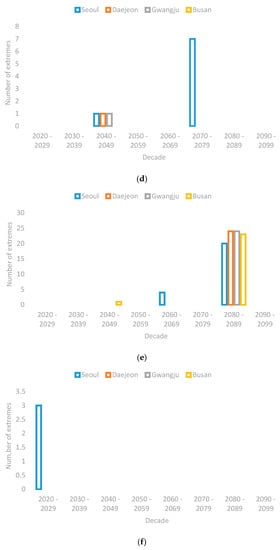
Figure 14.
The number of extremes observed per decade using downscaled precipitation from 2020 to 2100 (RCP4.5). Figure shows (a) extreme precipitation SPI6 (b) extreme drought SPI6; (c) extreme precipitation SPI12; (d) extreme drought SPI12; (e) extreme precipitation SPI24; and (f) extreme drought SPI24.
The decadal frequency for downscaled precipitation based on RCP8.5 forcing (Figure 15) shows a decreasing trend from 2020 to 2100 for both extreme precipitation and drought. Extreme precipitation occurs more frequently in the decades from 2040 to 2049 and from 2050 to 2059 for all cities across all timescales, occurring less times as 2100 approaches, except for extreme precipitation in Busan.
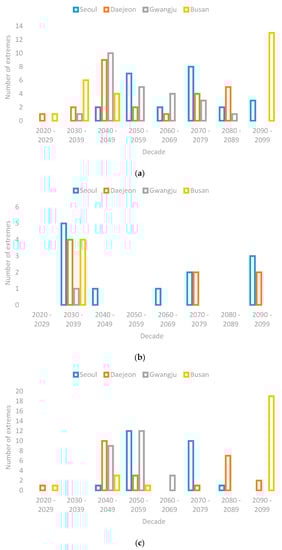
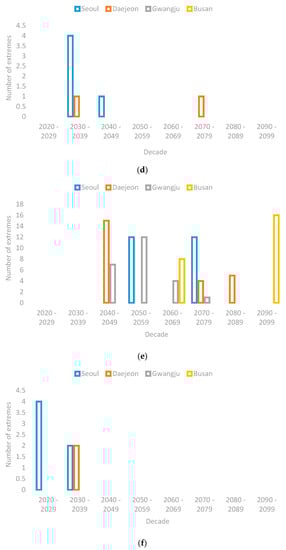
Figure 15.
The number of extremes observed per decade using downscaled precipitation from 2020 to 2100 (RCP8.5). Figure shows (a) extreme precipitation SPI6 (b) extreme drought SPI6 (c), extreme precipitation SPI12 (d), extreme drought SPI12 (e), extreme precipitation SPI24, and (f) extreme drought SPI24.
Mean Intensity (MI), obtained by performing a t-test comparing SPIactual and SPIdownscaled, suggests that for most cities, across different RCPs, the intensity remains unchanged except for extreme drought for a twelve-month timescale under the RCP4.5 scenario, decreasing in all cities except Seoul, where it increases.
3.5. Monthly Categorization of Extremes
To understand if any changes will occur in the distribution of extremes, we compared monthly extreme distribution from gridded data to already categorized climatological normals for South Korea (Figure 2). According to the KMA, for a period of approximately 30 days beginning from late June, heavy rains and flash floods become more prevalent [48]. This work shows several extreme precipitation events in all months of the year. March, April and May outnumber June in the number of expected extreme precipitation events, suggesting a possible shift in the timing of expected flashfloods for South Korea. (See Figure 16a)
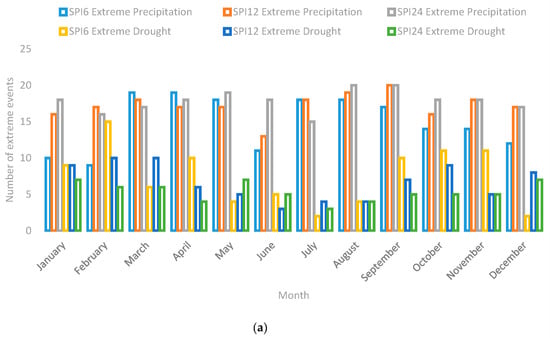
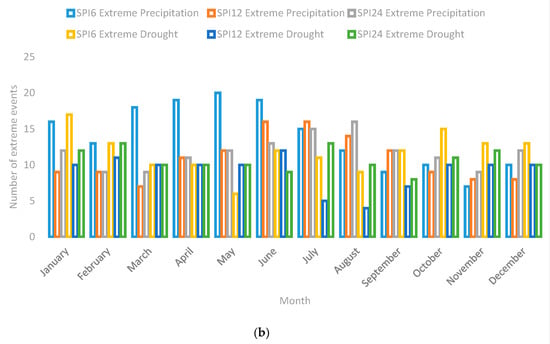
Figure 16.
The number of extremes occurring per month based on (a) RCP4.5 and (b) RCP8.5.
Under the RCP8.5 scenario (Figure 16b), extreme precipitation has a greater likelihood of occurring between January to July for SPI6, while June to August holds more probability to host extreme precipitation events on SPI12 and SPI24 timescales. Drought events are more likely to occur from October through February and in June.
3.6. Persistent Extremes
Extreme events do not portend equal impact. Floods and droughts affect different aspects of human endeavors differently. Thus, there is a need to emphasize persistent events, which occur in chains. Under RCP4.5 concentrations (Figure 17a), the likelihood of extreme precipitation events occurring is more prevalent than extreme drought, slightly more evident from SPI12 analyses. The most persistent precipitation event in this forcing scenario occurs in Daejeon in the late 2090s, while the most persistent drought event occurs in Jeju in the mid-2030s (see Figure 18b). The RCP8.5 pathway (Figure 17b) leans towards increased prevalence in persistent droughts, especially at higher timescales. The most persistent events for both precipitation and drought occur in Busan between the early to mid-2020s and early to mid-2040s, respectively (see Figure 18d,e). When compared to downscaled precipitation, extremes tend to last a maximum of 5 months at a stretch before tapering to values below the ±2 value designated to represent extremes in this study.
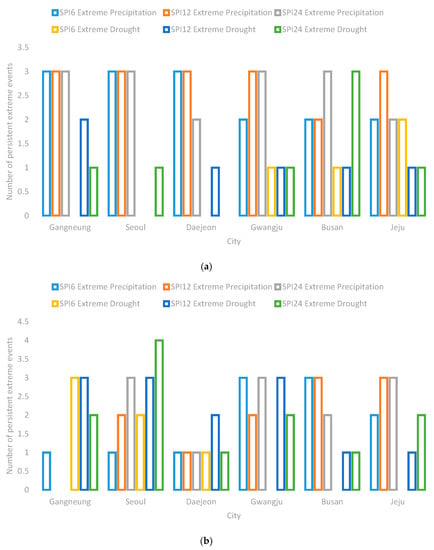
Figure 17.
Number of persistent extremes per month based on (a) RCP4.5 and (b) RCP8.5.
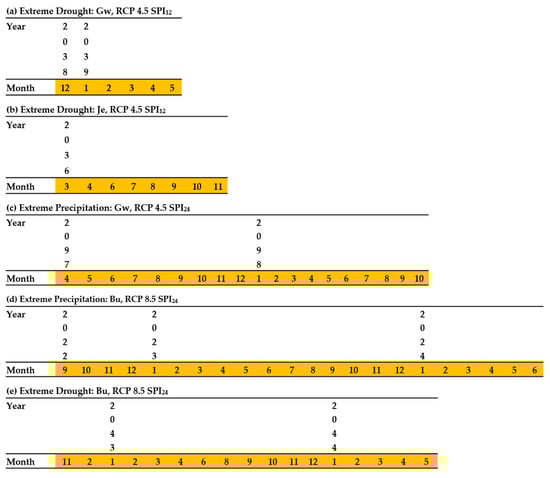
Figure 18.
Persistent extremes showing the most important extremes across the study areas, RCPs and timescales. Key: Gw = Gwangju, Je = Jeju, Bu = Busan. Months: 1 to 12 = January to December.
4. Discussion
The SPI6 results for the cities above indicate short-term responses of the environment to water, beginning with a reduction in humidity and air moisture, soil moisture and the key micro-water cycle, aspects that are vital for agriculture. Meanwhile, longer time scales (SPI12 and SPI24) are good indicators of both meteorological and agricultural drought, signifying drops in groundwater, river discharge and other large water reservoirs [49,50].
Despite extreme precipitation outnumbering extreme drought, flood risk is not necessarily of more importance than drought. Flood risk might increase following closer analysis and early warning systems yet because some regions in South Korea normally experience low rainfall and have adequate drainage systems, extreme rainfall might not immediately translate to flood. Nevertheless, these classifications are equally important as extended periods or unusual amounts of rainfall during typically drier periods can lead to a myriad of issues for agricultural production: delaying harvests [51], causing leaching, preventing access to farms [52], increasing the operable range of pests and weeds [53,54,55], delayed planting, and much more. Drought risk covered by the range of this study portends high risks for agriculture, domestic water use and industries that rely on heavy water usage [56].
The last persistent and extreme drought in South Korea saw water rationing regimes across power plants, homes and freshwater ecosystems [57]. A similar occurrence in the future during typically wet months could trigger the same response. Wetter months of December through February have been observed throughout the study and can be attributed to an expected warmer Northern Hemisphere preventing snow from condensing [47] as well as the Intergovernmental Panel on Climate Change’s finding that Northern mid-latitudes are likely to experience increased rainfall in winter [58]. Notably, an increase in wet events during the typically dry period of March to May depicts a shifting seasonal occurrence of precipitation from the observed normal, represented by Figure 2 above.
The mean intensity of extremes categorized is not expected to increase in the coming years except for a few occasions, suggesting that climate change will not generally exacerbate the intensity of extreme hydrological events in South Korea, agreeing with previous research [8]. However, the number of events will increase over considerably shorter return times. Globally for all RCPs, monsoon rainfall is expected to cover a larger region and occur more frequently [45].
Gridded SPI6 analysis for Seoul predicts extremely rare precipitation between November and December 2018, above 2.8 on the SPI scale. This projection is confirmed by a news report of the heaviest snowfall ever on record according to the KMA [59]. A larger increase in extreme precipitation within six-month timescales means that changes in variability over shorter time scales are to be expected. A recent study found that extreme rainfall can lead to similar losses in crop production compared with drought. In fact, because current models are unable to quantify damage to crops due to extreme rainfall, they tend to overestimate yield [60]. Meanwhile, extremes might be underestimated due to the penchant of GCMs underestimating extreme precipitation [61,62,63].
The two most important droughts are the ones occurring in Jeju and Gwangju in the 2030s. This importance is attributed to location (Gwangju, a key farming region, and Jeju, a vital tourist destination that also produces premium agricultural products), timing (occurring when precipitation would typically be normal), persistence (occurring in a chain of successive months), intensity (reaching -2.8 on the SPI scale) and probability (more likely to occur as it is a possibility under the more likely RCP4.5 scenario and not the less likely high emissions scenario). It is noteworthy that RCP4.5 is likely to lead to global average temperatures over 1.5 °C between 2081 and 2100 and a mean of 1.4 °C between 2046 and 2065 [45]. These droughts are projected to span 8 and 6 months, respectively, disrupting typically wet periods and reaching the status of a rare event, i.e., −2.8 on the SPI scale. Such drought events have a likelihood of compounding economic hardships. Considering that flooding is a multifractal event, it is less likely to categorically establish one single event as the most important one; however, the 19-month extreme precipitation (SPI24) event likely to take place in Gwangju in the late 2090s stands out.
RCP8.5 based on projected precipitation will likely lead to marked persistent events, ironically both taking place in Busan: a 22-month long chain of precipitation events (SPI24) in the early to mid-2020s and a 17-month long drought in the early 2040s (SPI24).
5. Conclusions
Non-parametric SPI was used to categorize hydrological extremes for six South Korean cities based on RCPs 4.5 and 8.5, yielding the following conclusions:
- (1)
- RCP4.5 most likely leads to more extreme precipitation than RCP8.5, which leads to more extreme drought than RCP4.5.
- (2)
- There is a marked difference in variability observed in SPIactual, which tends to produce linear SPI plots, compared with SPIgridded and SPIdownscaled. The latter two show much more variability in intensity.
- (3)
- There is a wide range of variation in the frequency of extremes per decade, showing no clear trend except in RCP8.5, where it decreases in all cases except Busan. Meanwhile, Mean Intensity remains unchanged for almost all cities except in a few cases. MI increases and decreases more over timescales (SPI12 and SPI24) larger than SPI6 for SPIgridded.
- (4)
- Dryer periods are likely to experience a higher number of extremely dry events. Extreme wetness is expected to occur during typically wet periods and during typically dry periods, especially in the months of April and May, indicating a possible shift in the seasonal timing of flash floods and other disasters caused by extreme precipitation.
- (5)
- The period between 2080 and 2100 holds the highest probability of extreme precipitation occurring, regardless of the forcing scenario.
- (6)
- The persistence of events, especially drought, generally increases with the timescale tested, i.e., SPI6 < SPI12 < SPI24 in both SPIgridded and SPIdownscaled.
- (7)
- RCP8.5 will likely lead to an increase in drought intensity, exemplified by the chain of persistent events when analyzed with SPI24 analysis. It will also initiate several multiyear events as long as 17-month long droughts and a 22-month long chain of precipitation extremes for projected precipitation.
The interaction between hydrological cycles and climate change has a tendency to exacerbate several aspects of human life and sustainability. Climate change impacts urban planning, cities, agricultural productivity as well as human and animal health. This buttresses the need for such research to be undertaken at local scales and the improvement of such projections to inform early warning systems and design other adaptive measures. For nations like South Korea and many more for whom water stress is imminent, it is absolutely critical that such studies move from academic exercises to the creation of deployable systems where there are none and the improvement of already existing ones.
Author Contributions
H.M.B. undertook the experimental design, manuscript writing and editing, Matlab scripting, analyses and data interpretation; Y.S. supervised the research, organized and formatted the data, reviewed the manuscript and provided technical input in writing Matlab scripts, data visualization and experimental design. J.S.H. supervised, edited and contributed to data analyses. All authors have read and agreed to the published version of the manuscript.
Funding
This research was funded by the 2019 Yeungnam University Research Grant.
Acknowledgments
The authors express their thanks to the Gyeongsangbukdo District Government and Park Chung Hee School of Policy and Saemaul for their scholarship grant, which enabled this research to be undertaken.
Conflicts of Interest
The authors declare no conflict of interest.
References
- Dore, M.H. Climate change and changes in global precipitation patterns: What do we know? Environ. Int. 2005, 31, 1167–1181. [Google Scholar] [CrossRef]
- IPCC. Managing the Risks of Extreme Events and Disasters to Advance Climate Change Adaptation: Summary for Policy Makers; Cambridge University Press: Cambridge, UK, 2012. [Google Scholar]
- Dai, A.; Trenberth, K.E.; Qian, T. A Global Dataset of Palmer Drought Severity Index for 1870–2002: Relationship with Soil Moisture and Effects of Surface Warming. J. Hydrometeorol. 2004, 5, 1117–1130. [Google Scholar] [CrossRef]
- Trenberth, K. Changes in precipitation with climate change. Clim. Res. 2011, 47, 123–138. [Google Scholar] [CrossRef]
- Allen, M. Liability for climate change. Nature 2003, 421, 891–892. [Google Scholar] [CrossRef]
- Milly, P.C.D.; Wetherald, R.T.; Dunne, K.A.; Delworth, T.L. Increasing risk of great floods in a changing climate. Nat. 2002, 415, 514–517. [Google Scholar] [CrossRef] [PubMed]
- McMichael, A.J.; Powles, J.W.; Butler, C.D.; Uauy, R. Food, livestock production, energy, climate change, and health. Lancet 2007, 370, 1253–1263. [Google Scholar] [CrossRef]
- Boo, K.-O.; Kwon, W.-T.; Baek, H.-J. Change of extreme events of temperature and precipitation over Korea using regional projection of future climate change. Geophys. Res. Lett. 2006, 33, 33. [Google Scholar] [CrossRef]
- Kim, C.-G.; Lee, S.-M.; Jeong, H.-K.; Jang, J.-K.; Kim, Y.-H.; Lee, C.-K. Impacts of climate change on korean agriculture and its counterstrategies. Korea Rural Econ. Inst. 2010, 1–306. [Google Scholar]
- Choi, G.; Kwon, W.-T.; Boo, K.-O.; Cha, Y.-M. Recent spatial and temporal changes in means and extreme events of temperature and precipitation across the republic of korea. J. Korean Phys. Soc. 2008, 43, 681–700. [Google Scholar]
- Korea Meteorological Administration. Climatological normals of korea (1981–2010); Publication No. 11-1360000-000077-14; Korea Meteorological Administration: Seoul, Korea, 2011; p. 665.
- Korea Meteorological Administration. Learning from Recent Events in 20 Years: Top 10 Severe Rainfall; Korea Meteorological Administration: Seoul, Korea, 2012.
- Kim, C.J.; Park, M.J.; Lee, J.H. Analysis of climate change impacts on the spatial and frequency patterns of drought using a potential drought hazard mapping approach. Int. J. Climatol. 2014, 34, 61–80. [Google Scholar] [CrossRef]
- Wichelns, D. An economic analysis of the virtual water concept in relation to the agri-food sector. In Sustainable Management of Water Resources in Agriculture; OECD iLibrary: Paris, France, 2010. [Google Scholar]
- Hoekstra, A.Y.; Hung, P.Q. Virtual water trade. A Quantification of Virtual Water Flows between Nations in Relation to International Crop Trade; Value of Water Research Report Series; IHE Delft: Delft, The Netherlands, 2002; p. 166. [Google Scholar]
- Min, S.-K.; Kwon, W.-T.; Park, E.-H.; Choi, Y. Spatial and temporal comparisons of droughts over Korea with East Asia. Int. J. Clim. 2003, 23, 223–233. [Google Scholar] [CrossRef]
- Kim, D.-W.; Byun, H.-R.; Choi, K.-S.; Oh, S.-B. A Spatiotemporal Analysis of Historical Droughts in Korea. J. Appl. Meteorol. Clim. 2011, 50, 1895–1912. [Google Scholar] [CrossRef]
- Korea Meteorological Administration. Annual Report 2017; Korea Meteorological Administration: Seoul, Korea; p. 2017.
- Byun, H.R.; Lee, S.J.; Morid, S.; Choi, K.S.; Lee, S.M.; Kim, D.W. Study on the periodicities of droughts in korea. Asia-Pac. J. Atmos. Sci. 2008, 44, 417–441. [Google Scholar]
- Wang, B.; Ding, Q.; Jhun, J.-G. Trends in Seoul (1778–2004) summer precipitation. Geophys. Res. Lett. 2006, 33, 33. [Google Scholar] [CrossRef]
- Chun, Y.; Jeon, S.-W. Chugugi, supyo, and punggi: Meteorological instruments of the 15th century in korea. History Meteorol. 2005, 2, 25–36. [Google Scholar]
- Kundzewicz, Z.W.; Rosbjerg, D.; Simonovic, S.; Takeuchi, K. Extreme hydrological events: Precipitation, floods and droughts; IAHS: Wallingford, UK, 1993. [Google Scholar]
- Mack, A.; Choffnes, E.R.; Hamburg, M.A.; Relman, D.A. Global Climate Change and Extreme Weather Events: Understanding the Contributions to Infectious Disease Emergence: Workshop Summary; National Academies Press: Washinton DC, USA, 2008. [Google Scholar]
- Seo, Y.; Hwang, J.; Kim, B. Extreme precipitation frequency analysis using a minimum density power divergence estimator. Water 2017, 9, 81. [Google Scholar] [CrossRef]
- Stephenson, D.B.; Diaz, H.; Murnane, R. Definition, diagnosis, and origin of extreme weather and climate events. Clim. Extremes Soc. 2008, 340, 11–23. [Google Scholar]
- Borga, M.; Anagnostou, E.; Bloschl, G.; Creutin, J.-D. Flash flood forecasting, warning and risk management: The HYDRATE project. Environ. Sci. Policy 2011, 14, 834–844. [Google Scholar] [CrossRef]
- Karavitis, C.A.; Alexandris, S.; Tsesmelis, D.E.; Athanasopoulos, G. Application of the standardized precipitation index (spi) in greece. Water 2011, 3, 787–805. [Google Scholar] [CrossRef]
- Guttman, N.B. Accepting the standardized precipitation index: A calculation algorithm 1. J. Am. Water Resour. Assoc. 1999, 35, 311–322. [Google Scholar] [CrossRef]
- Kumar, M.N.; Murthy, C.S.; Sai, M.V.R.S.; Roy, P.S. On the use of Standardized Precipitation Index (SPI) for drought intensity assessment. Meteorol. Appl. 2009, 16, 381–389. [Google Scholar] [CrossRef]
- Du, J.; Fang, J.; Xu, W.; Shi, P. Analysis of dry/wet conditions using the standardized precipitation index and its potential usefulness for drought/flood monitoring in hunan province, china. Stoch. Environ. Res. Risk Assess. 2013, 27, 377–387. [Google Scholar] [CrossRef]
- Korea Meteorological Administration. Ic400_rcp85_world_hadgem2ao_prcp_monthly_1860_2100, 2014 ed.; Korea Meteorological Administration: Seoul, Korea, 2014.
- City Population. South korea: Cities (census population). 2015. Available online: https://www.citypopulation.de/KoreaSouth-MunRegPop.html (accessed on 28 January 2020).
- Guerreiro, M.J.; Lajinha, T.; Abreu, I. Flood analysis with the standardized precipitation index (spi). 2008. Available online: https://pdfs.semanticscholar.org/d196/af690380780f488f3fed350b66dc41500d3c.pdf?_ga=2.198202088.635609999.1580186023-116758830.1554116243 (accessed on 28 January 2020).
- Svoboda, M.; Hayes, M.; Wood, D. Standardized precipitation index user guide; World Meteorological Organization: Geneva, Switzerland, 2012. [Google Scholar]
- McKee, T.B.; Doesken, N.J.; Kleist, J. The relationship of drought frequency and duration to time scales. Available online: https://scinapse.io/papers/2153179024 (accessed on 21 January 2020).
- Korea Meteorological Administration. Climate Change Outlook of Korea Peninsula; Korea Meteorological Administration: Seoul, Korea, 2018.
- Kim, M.-K.; Han, M.-S.; Jang, D.-H.; Baek, S.-G.; Lee, W.-S.; Kim, Y.-H.; Kim, S. Production technique of observation grid data of 1km resolution. J.Clim.Res. 2012, 7, 55–68. [Google Scholar]
- Cannon, A.J.; Sobie, S.R.; Murdock, T.Q. Bias correction of gcm precipitation by quantile mapping how well do methods preserve changes in quantiles and extremes? J. Clim. 2015, 28, 6938–6959. [Google Scholar] [CrossRef]
- Eum, H.I.; Cannon, A.J.; Murdock, T.Q. Intercomparison of multiple statistical downscaling methods: Multi-criteria model selection for south korea. Stoch. Env. Res. Risk A. 2017, 31, 683–703. [Google Scholar] [CrossRef]
- Eum, H.I.; Cannon, A.J. Intercomparison of projected changes in climate extremes for south korea: Application of trend preserving statistical downscaling methods to the cmip5 ensemble. Int. J. Climatol. 2017, 37, 3381–3397. [Google Scholar] [CrossRef]
- Van Vuuren, D.P.; Edmonds, J.; Kainuma, M.; Riahi, K.; Thomson, A.; Hibbard, K.; Hurtt, G.C.; Kram, T.; Krey, V.; Lamarque, J.-F.; et al. The representative concentration pathways: An overview. Clim. Chang. 2011, 109, 5–31. [Google Scholar] [CrossRef]
- Van Vuuren, D.P.; Stehfest, E.; Elzen, M.G.J.D.; Kram, T.; Van Vliet, J.; Deetman, S.; Isaac, M.; Goldewijk, K.K.; Hof, A.; Beltran, A.M.; et al. RCP2.6: Exploring the possibility to keep global mean temperature increase below 2 °C. Clim. Chang. 2011, 109, 95–116. [Google Scholar] [CrossRef]
- Thomson, A.M.; Calvin, K.V.; Smith, S.J.; Kyle, G.P.; Volke, A.; Patel, P.; Delgado-Arias, S.; Bond-Lamberty, B.; Wise, M.A.; Clarke, L.E.; et al. RCP4.5: A pathway for stabilization of radiative forcing by 2100. Clim. Chang. 2011, 109, 77–94. [Google Scholar] [CrossRef]
- IPCC. Climate Change 2014: Synthesis Report. Contribution of Working Groups I, II and III to the Fifth Assessment Report of the Intergovernmental Panel on Climate Change; IPCC: Geneva, Switzerland, 2014; p. 151. [Google Scholar]
- Seiler, R.; Hayes, M.; Bressan, L. Using the standardized precipitation index for flood risk monitoring. Int. J. Climatol. J. Royal Meteorol. Soc. 2002, 22, 1365–1376. [Google Scholar] [CrossRef]
- NASA. Standardized precipitation index (spi). Available online: https://gmao.gsfc.nasa.gov/research/subseasonal/atlas/SPI-html/SPI-description.html (accessed on 22 October 2019).
- Krasting, J.P.; Broccoli, A.J.; Dixon, K.W.; Lanzante, J.R. Future Changes in Northern Hemisphere Snowfall. J. Clim. 2013, 26, 7813–7828. [Google Scholar] [CrossRef]
- Korea Meteorological Administration. Climate of korea. Available online: https://web.kma.go.kr/eng/biz/climate_01.jsp (accessed on 5 July 2019).
- Hayes, M.J.; Svoboda, M.D.; Wilhite, D.A.; Vanyarkho, O.V. Monitoring the 1996 Drought Using the Standardized Precipitation Index. Bull. Am. Meteorol. Soc. 1999, 80, 429–438. [Google Scholar] [CrossRef]
- Keyantash, J.; National Center for Atmospheric Research Staff. The climate data guide: Standardized precipitation index (spi). 2018. Available online: https://climatedataguide.ucar.edu/climate-data/standardized-precipitation-index-spi (accessed on 21 January 2020).
- Shein, E. Heavy rains to cause significant harvest delays in corn belt. Available online: https://www.dtnpf.com/agriculture/web/ag/news/article/2018/10/05/heavy-rains-cause-significant-delays (accessed on 28 August 2019).
- Mauldin, M. Excessive rain creates many problems for growers. Available online: https://nwdistrict.ifas.ufl.edu/phag/2013/07/12/excessive-rain-creates-many-problems-for-growers/ (accessed on 4 September 2019).
- Peters, K.; Breitsameter, L.; Gerowitt, B. Impact of climate change on weeds in agriculture: A review. Agron. Sustain. Dev. 2014, 34, 707–721. [Google Scholar] [CrossRef]
- Deutsch, C.A.; Tewksbury, J.J.; Tigchelaar, M.; Battisti, D.S.; Merrill, S.C.; Huey, R.B.; Naylor, R.L. Increase in crop losses to insect pests in a warming climate. Science 2018, 361, 916–919. [Google Scholar] [CrossRef]
- Robinson, T.M.P.; Gross, K.L. The impact of altered precipitation variability on annual weed species. Am. J. Bot. 2010, 97, 1625–1629. [Google Scholar] [CrossRef]
- Ding, Y.; Hayes, M.J.; Widhalm, M. Measuring economic impacts of drought: A review and discussion. Disaster Prev. Manag. Int. J. 2011, 20, 434–446. [Google Scholar] [CrossRef]
- Yi, S.; Ryu, M.; Suh, J.; Kim, S.; Seo, S.; Kim, S. Case study of seosan smart water management; K-Water: Daejeon, Korea, 2018; p. 87.
- IPCC. Managing the Risks of Extreme Events and Disasters to Advance Climate Change Adaptation. In A Special Report of Working Groups I and II of the Intergovernmental Panel on Climate Change; Cambridge University Press: Cambridge, UK; New York, NY, USA, 2012; pp. 7–13. [Google Scholar]
- Yonhap News Agency. Heavy first snow arrives in seoul. 2018. Available online: https://en.yna.co.kr/view/AEN20181124000700320 (accessed on 21 January 2020).
- Li, Y.; Guan, K.; Schnitkey, G.D.; DeLucia, E.; Peng, B. Excessive rainfall leads to maize yield loss of a comparable magnitude to extreme drought in the United States. Glob. Chang. Boil. 2019, 25, 2325–2337. [Google Scholar] [CrossRef]
- Song, F.; Zhou, T. Interannual Variability of East Asian Summer Monsoon Simulated by CMIP3 and CMIP5 AGCMs: Skill Dependence on Indian Ocean–Western Pacific Anticyclone Teleconnection. J. Clim. 2014, 27, 1679–1697. [Google Scholar] [CrossRef]
- Ault, T.R.; Cole, J.E.; Overpeck, J.T.; Pederson, G.T.; Meko, D.M. Assessing the Risk of Persistent Drought Using Climate Model Simulations and Paleoclimate Data. J. Clim. 2014, 27, 7529–7549. [Google Scholar] [CrossRef]
- Nasrollahi, N.; AghaKouchak, A.; Cheng, L.; Damberg, L.; Phillips, T.J.; Miao, C.; Hsu, K.; Sorooshian, S. How well do CMIP5 climate simulations replicate historical trends and patterns of meteorological droughts? Water Resour. Res. 2015, 51, 2847–2864. [Google Scholar] [CrossRef]
© 2020 by the authors. Licensee MDPI, Basel, Switzerland. This article is an open access article distributed under the terms and conditions of the Creative Commons Attribution (CC BY) license (http://creativecommons.org/licenses/by/4.0/).