Ecological Corridors Analysis Based on MSPA and MCR Model—A Case Study of the Tomur World Natural Heritage Region
Abstract
1. Introduction
2. Materials and Methods
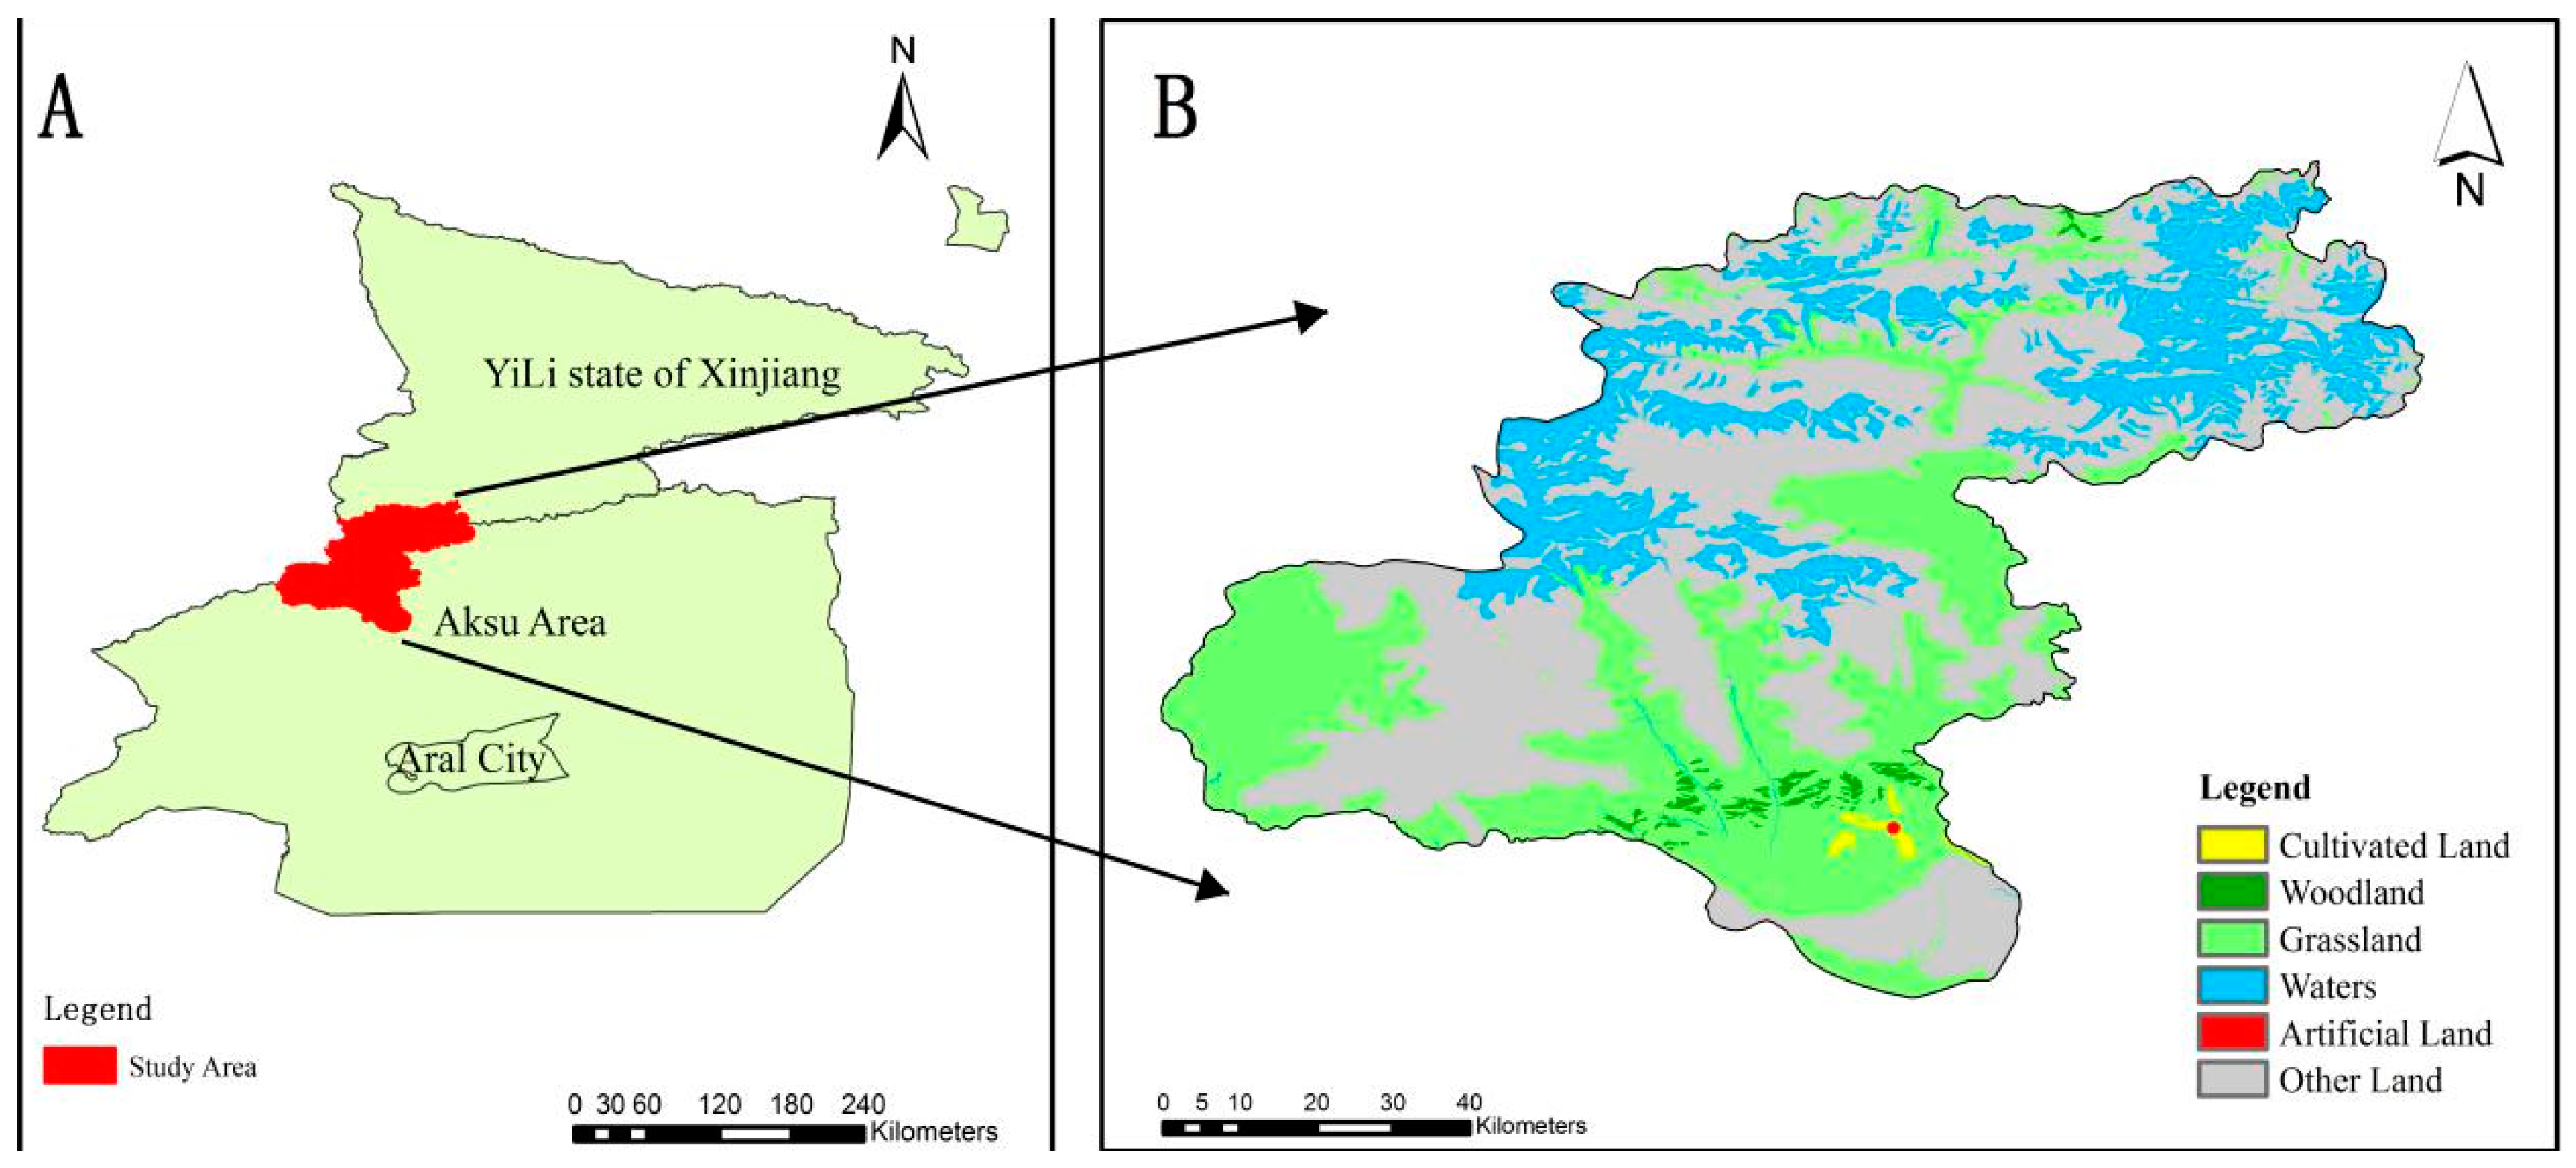
2.1. Study Area
2.2. Data Resource
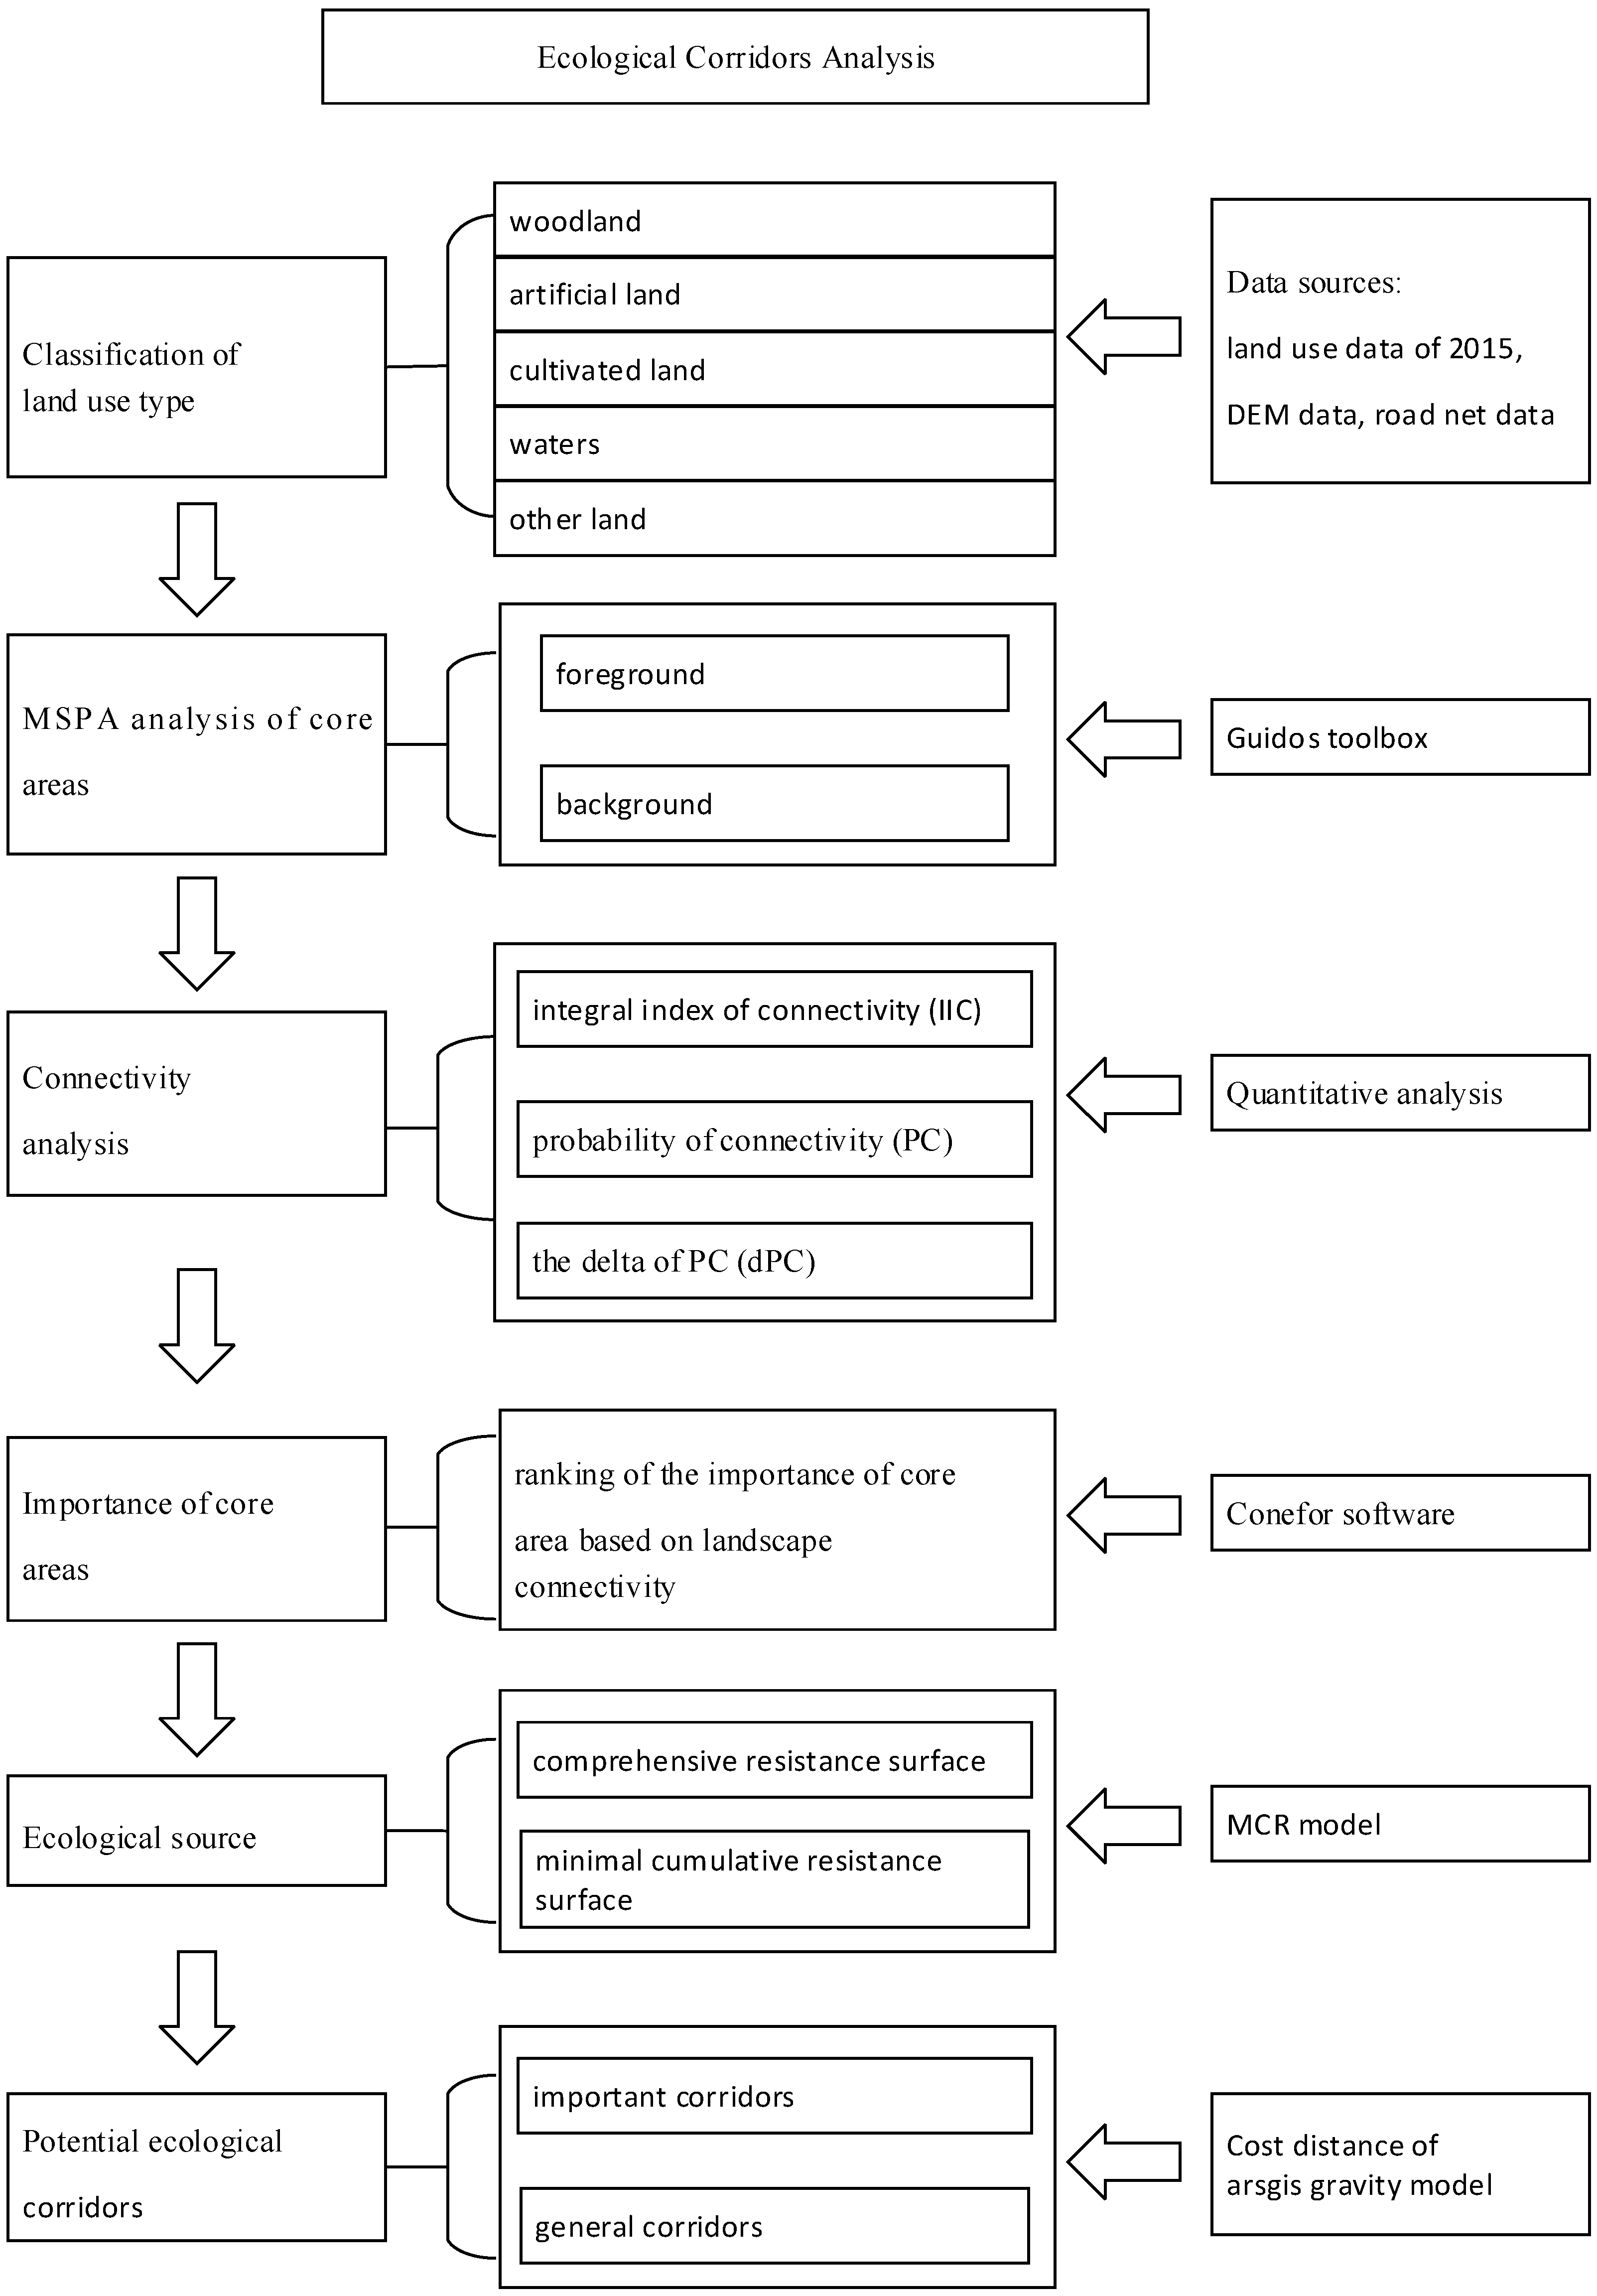
2.3. Methods
2.3.1. Landscape Pattern Analysis Based on the MSPA Method
2.3.2. Evaluation of Landscape Connectivity in the Study Area
2.3.3. Ecological Corridor Construction Based on the MCR Model
3. Results
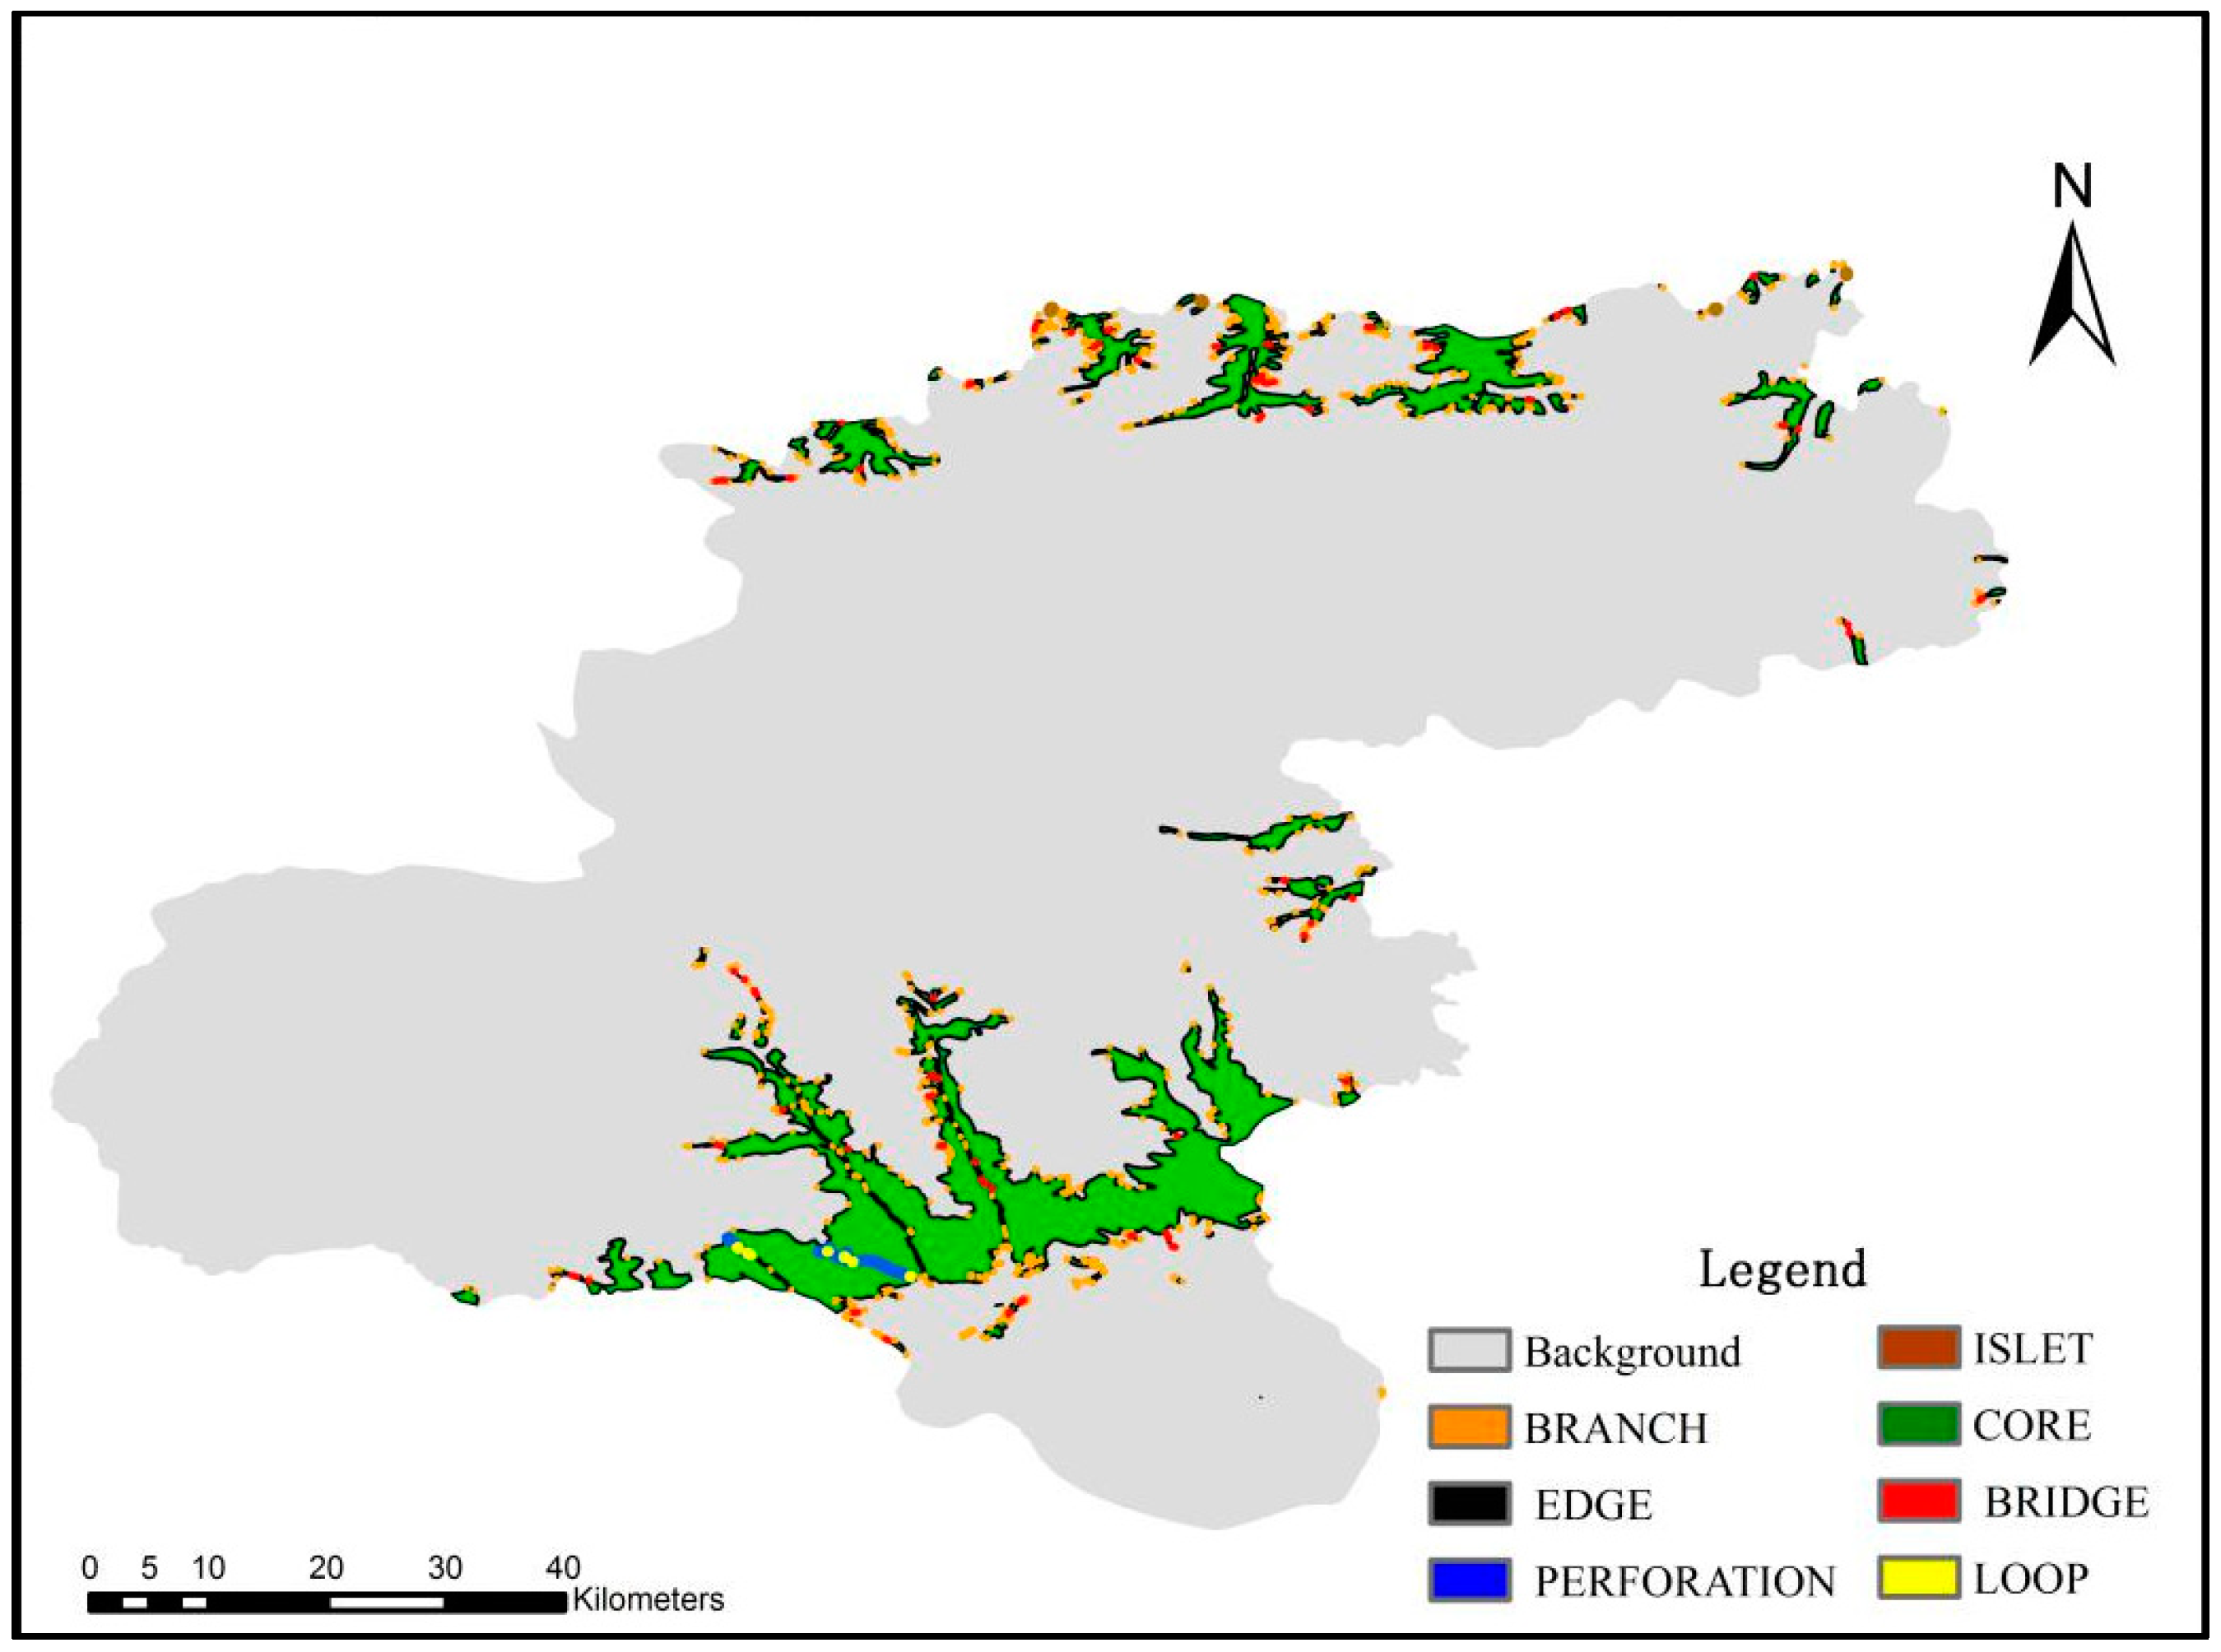
3.1. Landscape Pattern Analysis of the Tomur Region Based on MSPA
3.2. Evaluation of Landscape Connectivity
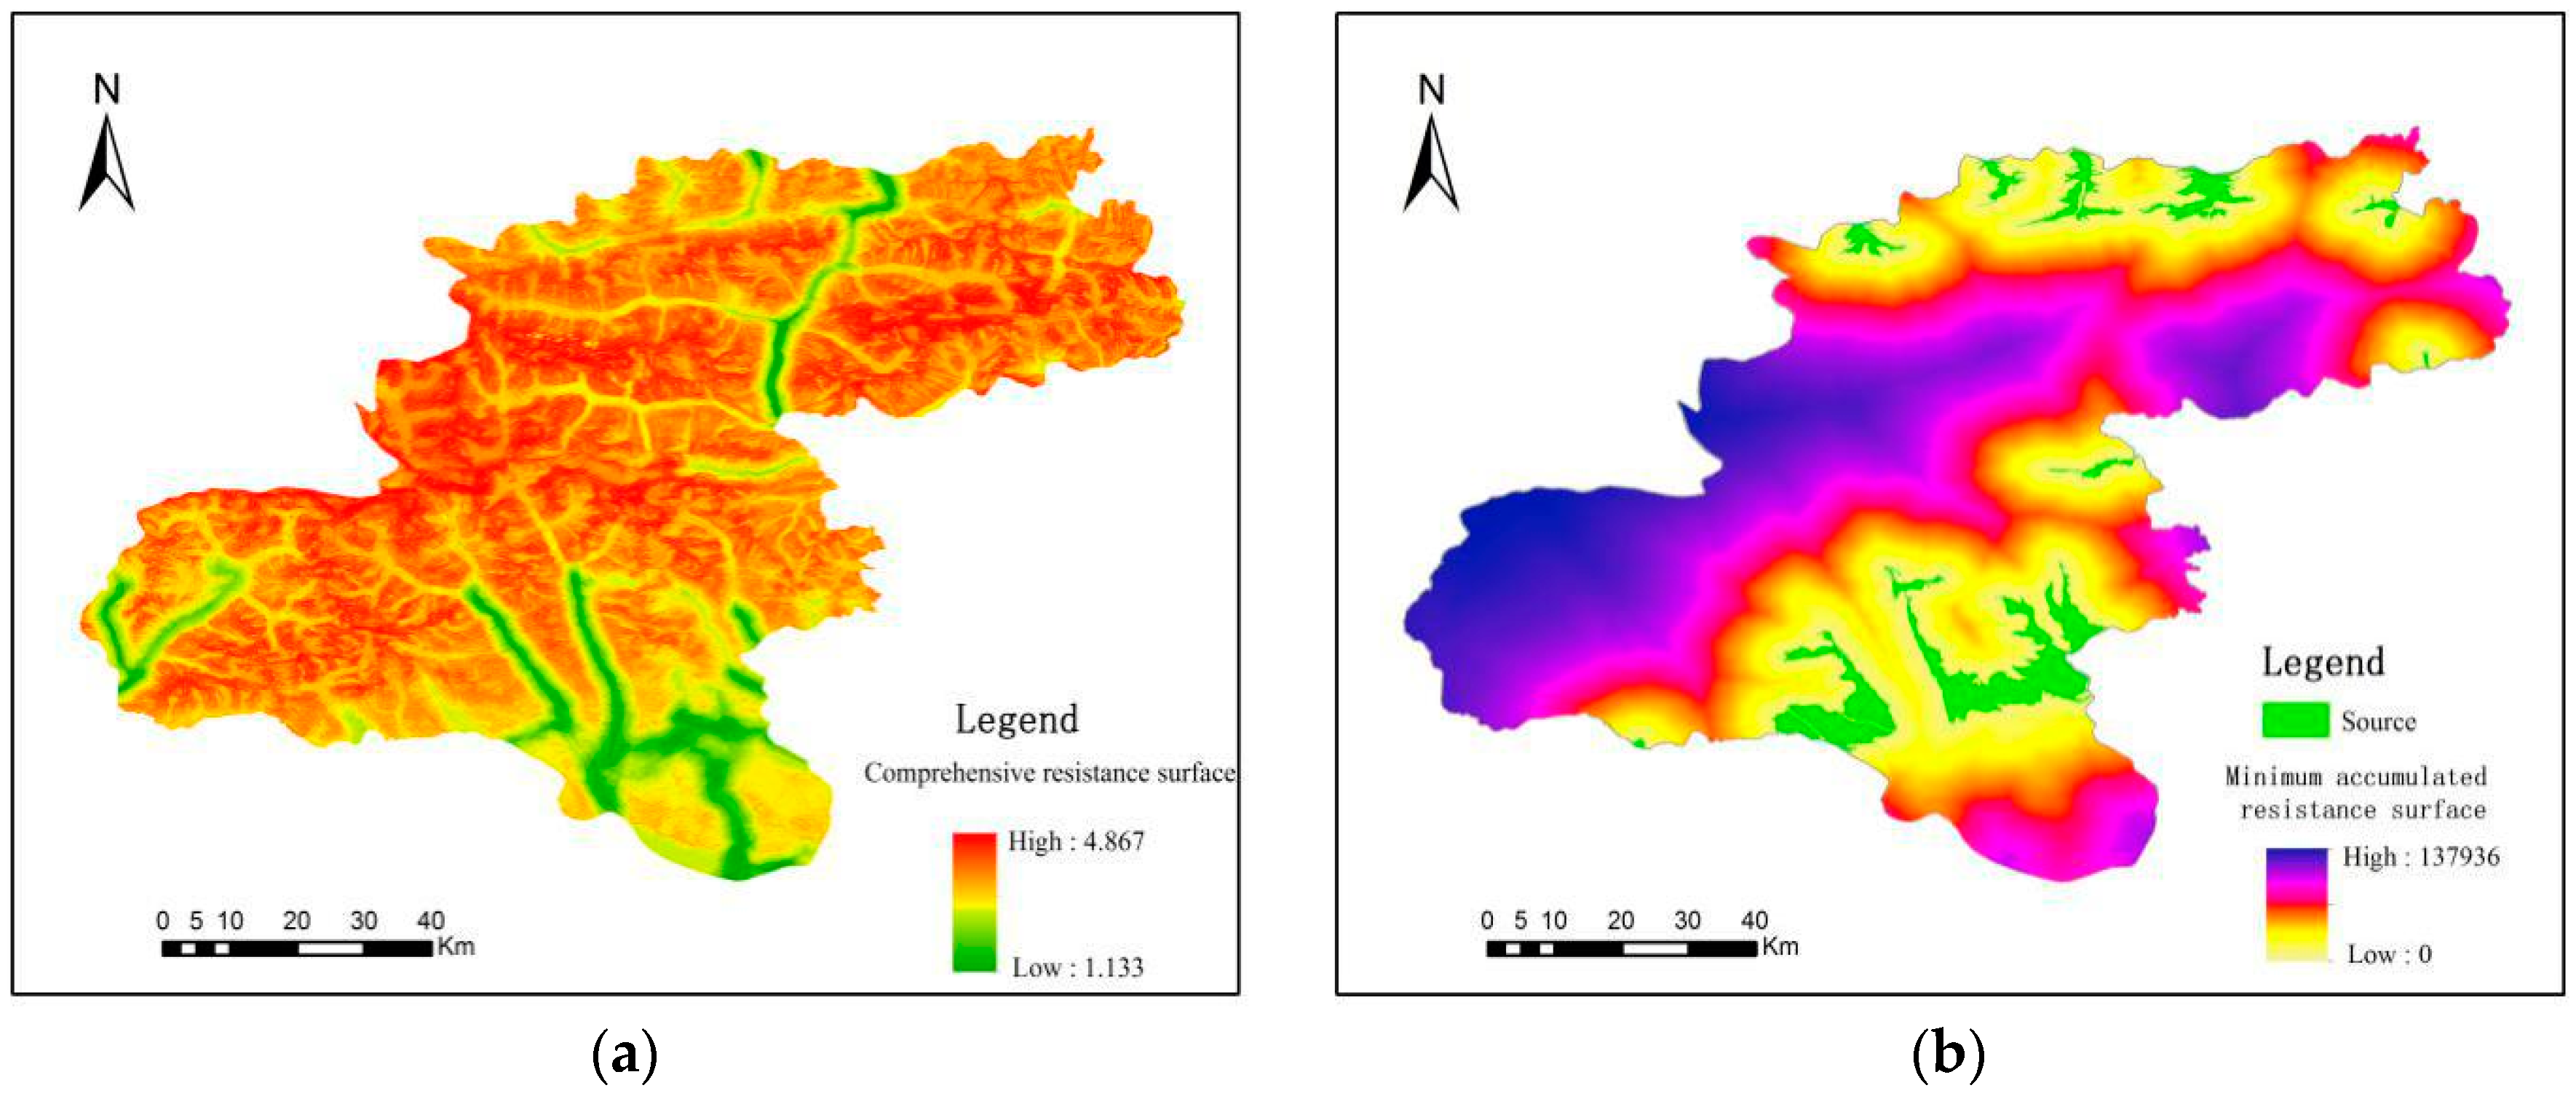
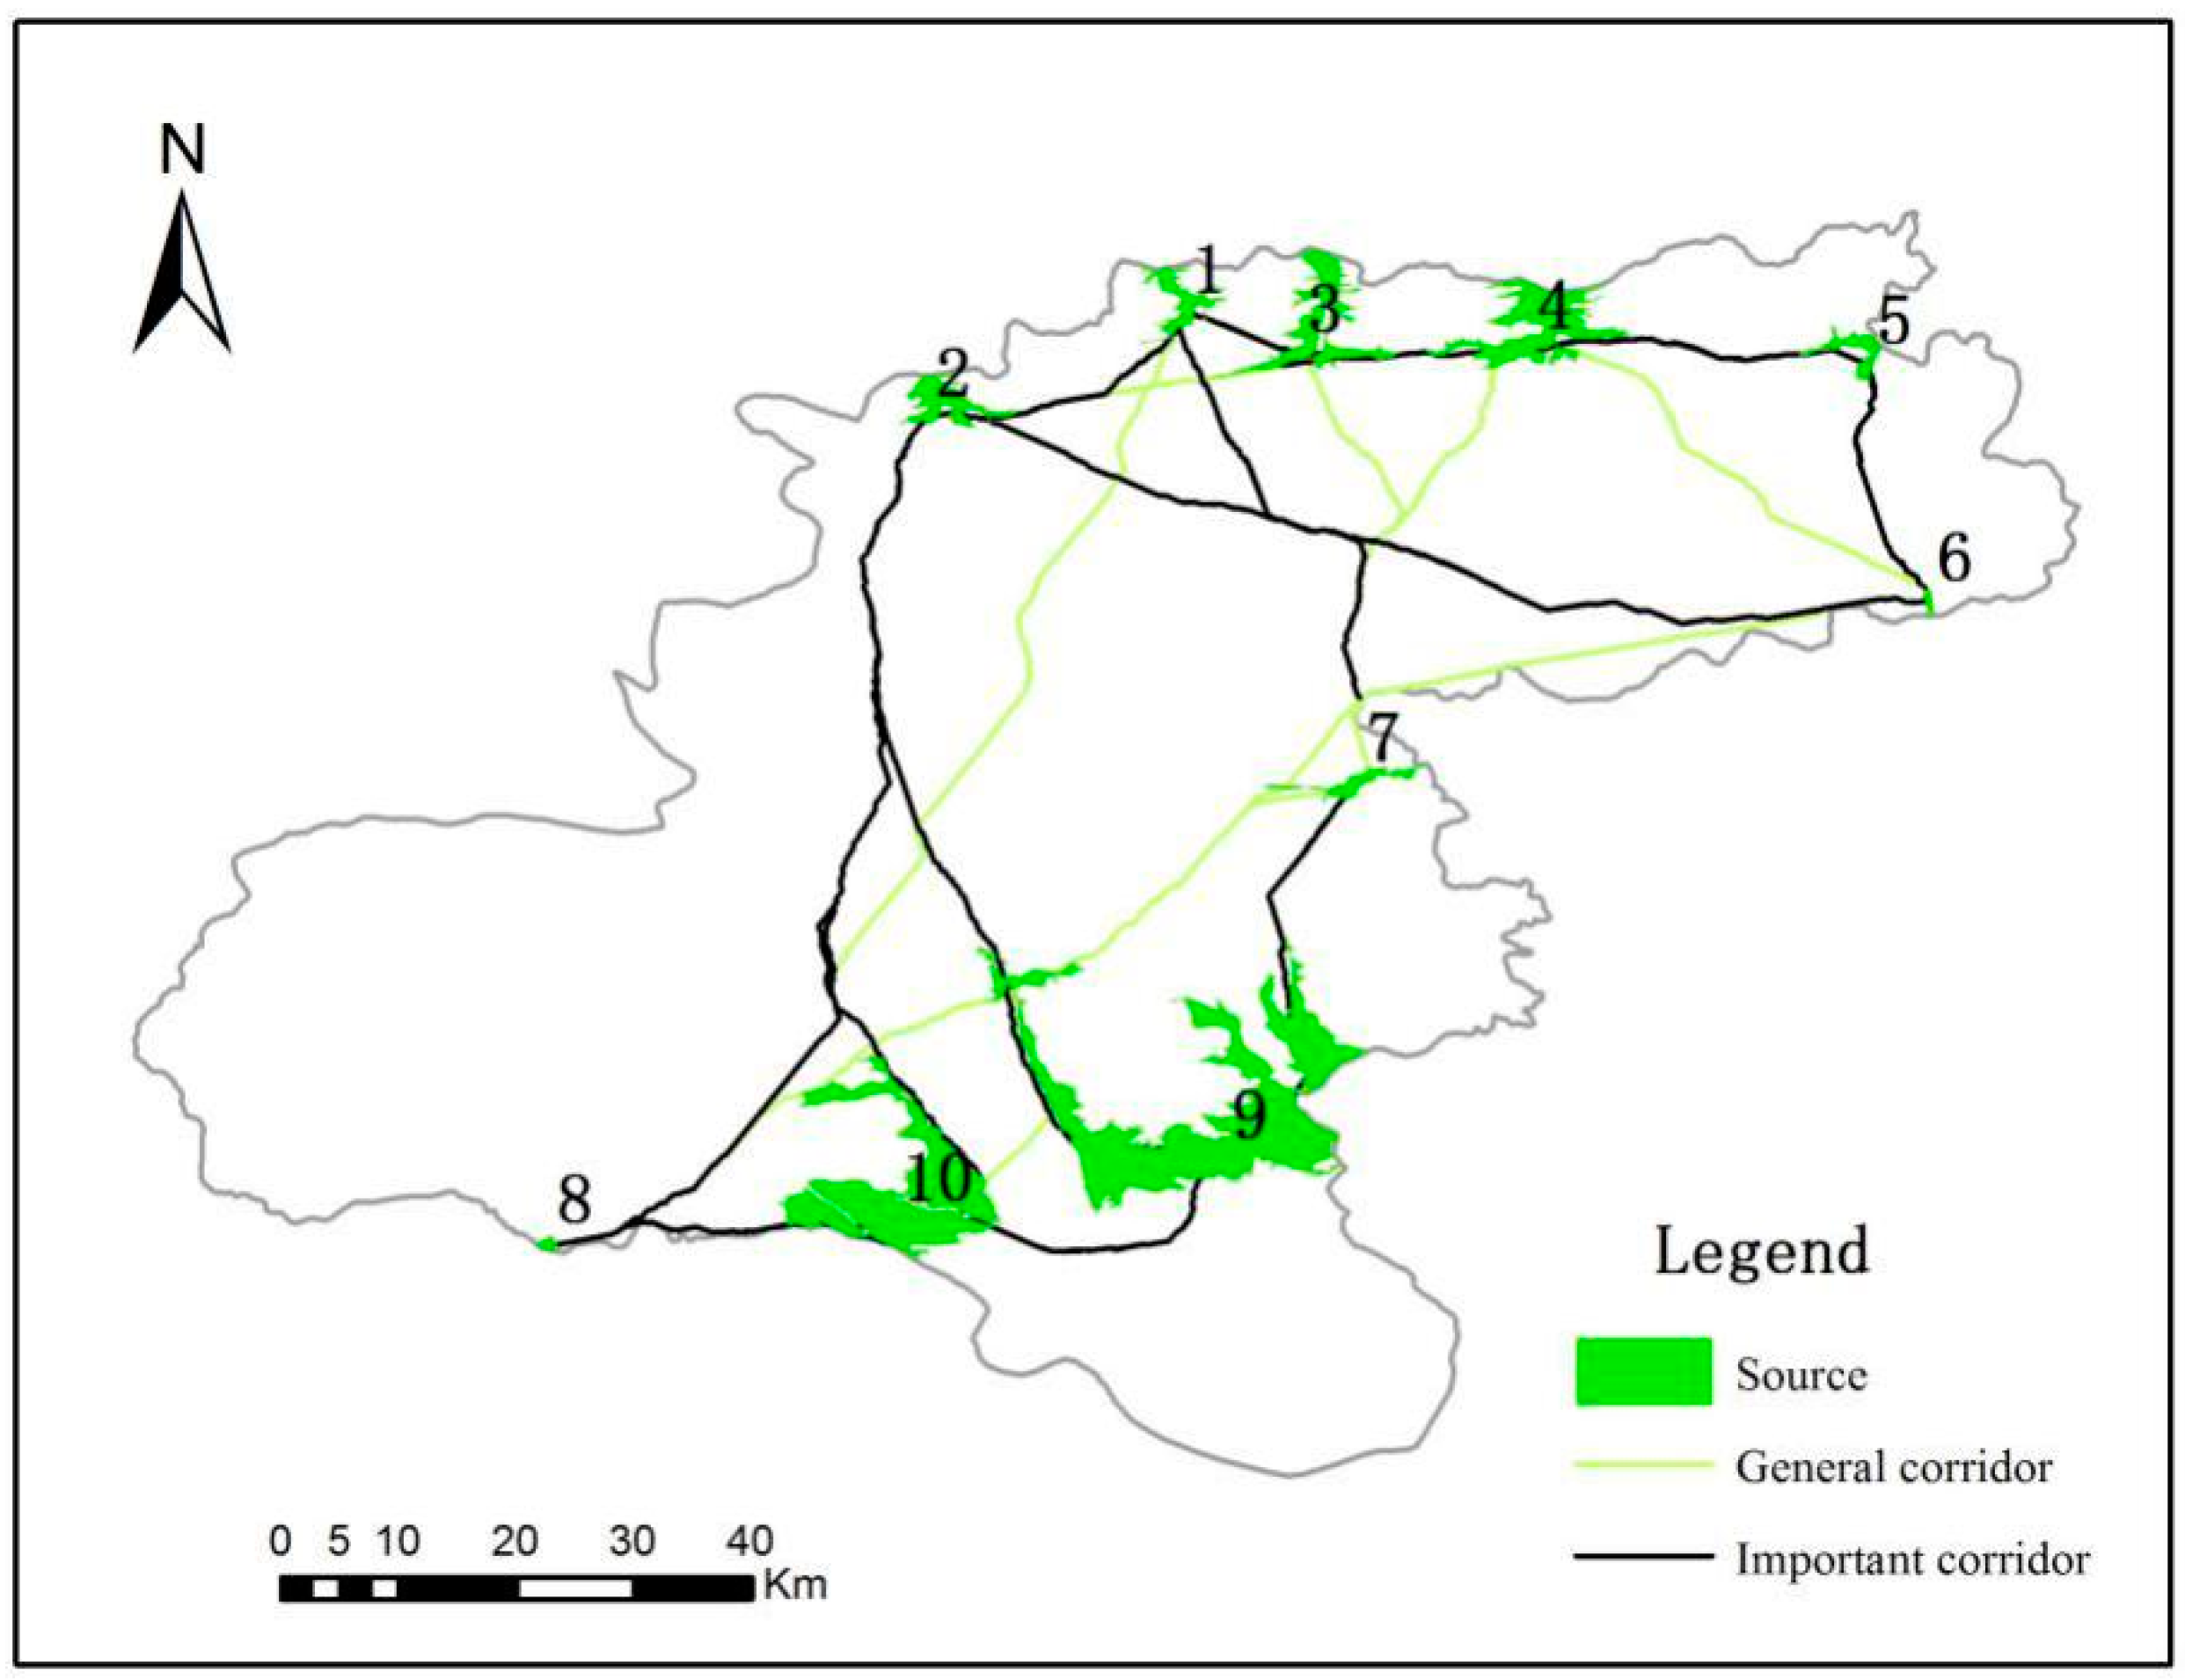
3.3. Ecological Corridor Construction Based on the MCR Model
4. Discussion
4.1. Analysis of Landscape Pattern Based on MSPA Method
4.2. Analysis of Landscape Connectivity
4.3. Analysis of Ecological Corridors Construction
5. Conclusions
Author Contributions
Funding
Acknowledgments
Conflicts of Interest
References
- Guo, S.; Saito, K.; Yin, W.; Su, C. Landscape connectivity as a tool in green space evaluation and optimization of the haidan district, Beijing. Sustainability 2018, 10, 1979. [Google Scholar] [CrossRef]
- Jiang, P.; Cheng, L.; Li, M.; Zhao, R.; Huang, Q. Analysis of landscape fragmentation processes and driving forces in wetlands in arid areas: A case study of the middle reaches of the Heihe River, China. Ecol. Indic. 2014, 46, 240–252. [Google Scholar] [CrossRef]
- Saura, S.; Estreguil, C.; Mouton, C.; Rodríguez-Freire, M. Network analysis to assess landscape connectivity trends: application to European forests (1990–2000). Ecol. Indic. 2011, 11, 407–416. [Google Scholar] [CrossRef]
- Richter, B.; Behnisch, M. Integrated evaluation framework for environmental planning in the context of compact green cities. Ecol. Indic. 2019, 96, 38–53. [Google Scholar] [CrossRef]
- Li, S.; Yang, B. Introducing a new method for assessing spatially explicit processes of landscape fragmentation. Ecol. Indic. 2015, 56, 116–124. [Google Scholar] [CrossRef]
- Hong, W.; Guo, R.; Su, M.; Tang, H.; Chen, L.; Hu, W. Sensitivity evaluation and land-use control of urban ecological corridors: A case study of Shenzhen, China. Land Use Policy 2017, 62, 316–325. [Google Scholar] [CrossRef]
- Liang, J.; He, X.; Zeng, G.; Zhong, M.; Gao, X.; Li, X.; Li, X.; Wu, H.; Feng, C.; Xing, W. Integrating priority areas and ecological corridors into national network for conservation planning in China. ScTEn 2018, 626, 22–29. [Google Scholar] [CrossRef]
- LaPoint, S.; Gallery, P.; Wikelski, M.; Kays, R. Animal behavior, cost-based corridor models, and real corridors. Landsc. Ecol. 2013, 28, 1615–1630. [Google Scholar] [CrossRef]
- Kong, F.; Yin, H.; Nakagoshi, N.; Zong, Y. Urban green space network development for biodiversity conservation: Identification based on graph theory and gravity modeling. Landsc. Urban Plan. 2010, 95, 16–27. [Google Scholar] [CrossRef]
- Clergeau, P.; Burel, F. The role of spatio-temporal patch connectivity at the landscape level: an example in a bird distribution. Landsc. Urban Plan. 1997, 38, 37–43. [Google Scholar] [CrossRef]
- Lookingbill, T.R.; Elmore, A.J.; Engelhardt, K.A.; Churchill, J.B.; Gates, J.E.; Johnson, J.B. Influence of wetland networks on bat activity in mixed-use landscapes. Biol. Conserv. 2010, 143, 974–983. [Google Scholar] [CrossRef]
- Bunce, R.G.H.; Barr, C.J.; Clarke, R.T.; Howard, D.C.; Lane, A.M. Land classification for strategic ecological survey. J. Environ. Manag. 1996, 47, 37–60. [Google Scholar] [CrossRef]
- Adriaensen, F.; Chardon, J.; De Blust, G.; Swinnen, E.; Villalba, S.; Gulinck, H.; Matthysen, E. The application of ‘least-cost’modelling as a functional landscape model. Landsc. Urban Plan. 2003, 64, 233–247. [Google Scholar] [CrossRef]
- Saura, S.; Vogt, P.; Velázquez, J.; Hernando, A.; Tejera, R. Key structural forest connectors can be identified by combining landscape spatial pattern and network analyses. For. Ecol. Manag. 2011, 262, 150–160. [Google Scholar] [CrossRef]
- Blaschke, T. Object based image analysis for remote sensing. ISPRS J. Photogramm. Remote Sens. 2010, 65, 2–16. [Google Scholar] [CrossRef]
- Mann, D.; Agrawal, G.; Joshi, P. Spatio-temporal forest cover dynamics along road networks in the Central Himalaya. Ecol. Eng. 2019, 127, 383–393. [Google Scholar] [CrossRef]
- Van Langevelde, F. Modelling the negative effects of landscape fragmentation on habitat selection. Ecol. Inform. 2015, 30, 271–276. [Google Scholar] [CrossRef]
- Pascual-Hortal, L.; Saura, S. Comparison and development of new graph-based landscape connectivity indices: towards the priorization of habitat patches and corridors for conservation. Landsc. Ecol. 2006, 21, 959–967. [Google Scholar] [CrossRef]
- Zang, S.-Y.; Yuan, H.; Ning, J. The landscape ecological assessment and planning in the control watershed by reservoir of erlong mountain. Chin. Geogr. Sci. 2002, 12, 176–181. [Google Scholar] [CrossRef]
- Ramiadantsoa, T.; Ovaskainen, O.; Rybicki, J.; Hanski, I. Large-scale habitat corridors for biodiversity conservation: A forest corridor in Madagascar. PLoS ONE 2015, 10, e0132126. [Google Scholar] [CrossRef]
- Dennis, R.L.; Dapporto, L.; Dover, J.W.; Shreeve, T.G. Corridors and barriers in biodiversity conservation: a novel resource-based habitat perspective for butterflies. Biodivers. Conserv. 2013, 22, 2709–2734. [Google Scholar] [CrossRef]
- Hüse, B.; Szabó, S.; Deák, B.; Tóthmérész, B. Mapping an ecological network of green habitat patches and their role in maintaining urban biodiversity in and around Debrecen city (Eastern Hungary). Land Use Policy 2016, 57, 574–581. [Google Scholar] [CrossRef]
- Govindan, K.; Loisi, R.V.; Roma, R. Greenways for rural sustainable development: An integration between geographic information systems and group analytic hierarchy process. Land use policy 2016, 50, 429–440. [Google Scholar]
- Bryant, M.M. Urban landscape conservation and the role of ecological greenways at local and metropolitan scales. Landsc. Urban Plan. 2006, 76, 23–44. [Google Scholar] [CrossRef]
- Gulickx, M.; Verburg, P.; Stoorvogel, J.; Kok, K.; Veldkamp, A. Mapping landscape services: a case study in a multifunctional rural landscape in The Netherlands. Ecol. Indic. 2013, 24, 273–283. [Google Scholar] [CrossRef]
- Leitao, A.B.; Ahern, J. Applying landscape ecological concepts and metrics in sustainable landscape planning. Landsc. Urban Plan. 2002, 59, 65–93. [Google Scholar] [CrossRef]
- Pino, J.; Marull, J. Ecological networks: are they enough for connectivity conservation? A case study in the Barcelona Metropolitan Region (NE Spain). Land Use Policy 2012, 29, 684–690. [Google Scholar] [CrossRef]
- Bodin, Ö.; Saura, S. Ranking individual habitat patches as connectivity providers: integrating network analysis and patch removal experiments. Ecol. Model. 2010, 221, 2393–2405. [Google Scholar] [CrossRef]
- Visconti, P.; Elkin, C. Using connectivity metrics in conservation planning–When does habitat quality matter? Divers. Distrib. 2009, 15, 602–612. [Google Scholar] [CrossRef]
- Moilanen, A.; Hanski, I. On the use of connectivity measures in spatial ecology. Oikos 2001, 95, 147–151. [Google Scholar] [CrossRef]
- Du, X.; Wang, Z. Optimizing monitoring locations using a combination of GIS and fuzzy multi criteria decision analysis, a case study from the Tomur World Natural Heritage site. J. Nat. Conserv. 2018, 43, 67–74. [Google Scholar] [CrossRef]
- Hui, S.; Zhaoping, Y.; Fang, H. Assessment and analysis of eco-environment vulnerability in Tomur region of natural heritage site. Arid Land Geogr. 2013, 36, 318–328. [Google Scholar]
- Vanbelle, S.; Albert, A. A note on the linearly weighted kappa coefficient for ordinal scales. Stat. Methodol. 2009, 6, 157–163. [Google Scholar] [CrossRef]
- Vogt, P.; Riitters, K.H.; Estreguil, C.; Kozak, J.; Wade, T.G.; Wickham, J.D. Mapping spatial patterns with morphological image processing. Landsc. Ecol. 2007, 22, 171–177. [Google Scholar] [CrossRef]
- Saura, S.; Pascual-Hortal, L. A new habitat availability index to integrate connectivity in landscape conservation planning: comparison with existing indices and application to a case study. Landsc. Urban Plan. 2007, 83, 91–103. [Google Scholar] [CrossRef]
- Tannier, C.; Bourgeois, M.; Houot, H.; Foltête, J.-C. Impact of urban developments on the functional connectivity of forested habitats: a joint contribution of advanced urban models and landscape graphs. Land Use Policy 2016, 52, 76–91. [Google Scholar] [CrossRef]
- Zetterberg, A.; Mörtberg, U.M.; Balfors, B. Making graph theory operational for landscape ecological assessments, planning, and design. Landsc. Urban Plan. 2010, 95, 181–191. [Google Scholar] [CrossRef]
- Vogt, P.; European Commission. User Guide of GuidosToolbox. 2018. Available online: https://ies-ows.jrc.ec.europa.eu/gtb/GTB/GuidosToolbox_Manual.pdf (accessed on 23 October 2019).
- Sun, J.; Southworth, J. Indicating structural connectivity in Amazonian rainforests from 1986 to 2010 using morphological image processing analysis. IJRS 2013, 34, 5187–5200. [Google Scholar] [CrossRef]
- Cook, E.A. Landscape structure indices for assessing urban ecological networks. Landsc. Urban Plan. 2002, 58, 269–280. [Google Scholar] [CrossRef]
- Carlier, J.; Moran, J. Landscape typology and ecological connectivity assessment to inform Greenway design. ScTEn 2019, 651, 3241–3252. [Google Scholar] [CrossRef]
- De Groot, R.S.; Alkemade, R.; Braat, L.; Hein, L.; Willemen, L. Challenges in integrating the concept of ecosystem services and values in landscape planning, management and decision making. Ecol. Complex. 2010, 7, 260–272. [Google Scholar] [CrossRef]
- Hernando, A.; Velázquez, J.; Valbuena, R.; Legrand, M.; García-Abril, A. Influence of the resolution of forest cover maps in evaluating fragmentation and connectivity to assess habitat conservation status. Ecol. Indic. 2017, 79, 295–302. [Google Scholar] [CrossRef]
- Zhang, L.; Wang, H. Planning an ecological network of Xiamen Island (China) using landscape metrics and network analysis. Landsc. Urban Plan. 2006, 78, 449–456. [Google Scholar] [CrossRef]
| MSPA Categories | Ecological Implication |
|---|---|
| Core | It can be used as the “source” of a variety of ecological processes, most of which are forest parks with large patch areas and large forest farms, etc., which are of great significance for species reproduction and biodiversity protection. |
| Bridge | The narrow and long areas connecting the patches of different core areas, and which have the characteristics of ecological corridors, which are mostly green belts, which are conducive to the migration of species and the connection of landscape within the territory. |
| Edge | The transition zone between the marginal zone of the core area and the peripheral nongreen landscape area, which can reduce the impact brought by the external environment and human disturbance, usually the peripheral forest zone of forest parks and large forest farms. |
| Branch | Only one end is connected to the main patch, mainly an extension of the green space, which is the channel for species diffusion and energy exchange with the peripheral landscape. |
| Loop | The internal channel of material and energy exchange in the same core area is the shortcut of material and energy exchange in the core area. |
| Islet | Small patches, which are independent of each other and have low connectivity, are less likely to communicate with other patches in terms of material and energy, and are mostly small green Spaces in urban or rural areas. |
| Perforation | As a transition region, the edge effect also exists between the core patch and its inner non-green space. |
| Landscape Type | Area(ha) | Accounting for a Total Area of Woodland Landscape (%) | Accounting for a Total Area of (%) |
|---|---|---|---|
| Core Area | 40,721.70 | 84.27 | 6.98 |
| Bridge | 62.81 | 0.13 | 0.01 |
| Edge | 6968.16 | 14.42 | 1.19 |
| Branch | 420.40 | 0.87 | 0.07 |
| Loop | 0 | 0 | 0 |
| Islet | 4.83 | 0.01 | 0 |
| Perforation | 144.96 | 0.30 | 0.02 |
| Order | No. | dPC |
|---|---|---|
| 1 | 21 | 4.068 |
| 2 | 22 | 4.065 |
| 3 | 10 | 4.048 |
| 4 | 23 | 4.041 |
| 5 | 7 | 4.028 |
| 6 | 20 | 4.027 |
| 7 | 8 | 4.023 |
| 8 | 24 | 4.018 |
| 9 | 6 | 3.984 |
| 10 | 5 | 3.980 |
| Resistance Factor | Classification Index | Evaluation | Weight |
|---|---|---|---|
| Elevation | >2500 | 1 | 0.179 |
| 2500–3500 | 2 | ||
| 3500–4500 | 3 | ||
| 4500–5500 | 4 | ||
| >5500 | 5 | ||
| Gradient | 0–10 | 1 | 0.275 |
| 10–30 | 2 | ||
| 30–50 | 3 | ||
| 50–70 | 4 | ||
| >70 | 5 | ||
| Land Use | woodland | 1 | 0.133 |
| Cultivated land, grassland | 2 | ||
| other land | 3 | ||
| waters | 4 | ||
| artificial area | 5 | ||
| Distance from drainage | 0–500 | 1 | 0.159 |
| 500–1000 | 2 | ||
| 1000–1500 | 3 | ||
| 1500–2000 | 4 | ||
| >2000 | 5 | ||
| Distance from roads | 0–500 | 1 | 0.254 |
| 500–1000 | 2 | ||
| 1000–1500 | 3 | ||
| 1500–2000 | 4 | ||
| >2000 | 5 |
| 1 | 2 | 3 | 4 | 5 | 6 | 7 | 8 | 9 | 10 | |
|---|---|---|---|---|---|---|---|---|---|---|
| 1 | - | 5.31 | 31.03 | 5.67 | 0.94 | 0.41 | 1.6 | 0.1 | 0.35 | 0.23 |
| 2 | - | 4.37 | 1.99 | 0.51 | 0.28 | 1.2 | 413.13 | 33.12 | 0.28 | |
| 3 | - | 18.84 | 1.69 | 0.64 | 2.59 | 0.13 | 0.48 | 0.31 | ||
| 4 | - | 4.37 | 1.19 | 3.93 | 0.15 | 0.61 | 0.38 | |||
| 5 | - | 2.21 | 0.83 | 0.07 | 0.23 | 0.15 | ||||
| 6 | - | 0.7 | 0.06 | 0.19 | 0.13 | |||||
| 7 | - | 2.76 | 211.83 | 0.84 | ||||||
| 8 | - | 0.70 | 1.85 | |||||||
| 9 | - | 5.42 | ||||||||
| 10 | - |
© 2020 by the authors. Licensee MDPI, Basel, Switzerland. This article is an open access article distributed under the terms and conditions of the Creative Commons Attribution (CC BY) license (http://creativecommons.org/licenses/by/4.0/).
Share and Cite
Ye, H.; Yang, Z.; Xu, X. Ecological Corridors Analysis Based on MSPA and MCR Model—A Case Study of the Tomur World Natural Heritage Region. Sustainability 2020, 12, 959. https://doi.org/10.3390/su12030959
Ye H, Yang Z, Xu X. Ecological Corridors Analysis Based on MSPA and MCR Model—A Case Study of the Tomur World Natural Heritage Region. Sustainability. 2020; 12(3):959. https://doi.org/10.3390/su12030959
Chicago/Turabian StyleYe, Hui, Zhaoping Yang, and Xiaoliang Xu. 2020. "Ecological Corridors Analysis Based on MSPA and MCR Model—A Case Study of the Tomur World Natural Heritage Region" Sustainability 12, no. 3: 959. https://doi.org/10.3390/su12030959
APA StyleYe, H., Yang, Z., & Xu, X. (2020). Ecological Corridors Analysis Based on MSPA and MCR Model—A Case Study of the Tomur World Natural Heritage Region. Sustainability, 12(3), 959. https://doi.org/10.3390/su12030959


