Article

Exploring University Performance through Multiple Factor Analysis: A Case Study

by
Delimiro Visbal-Cadavid
1,
Mónica Martínez-Gómez
2,* and
Rolando Escorcia-Caballero
3
1
Facultad de Ingeniería, Universidad del Magdalena, Santa Marta 470004, Colombia
2
Centre for Quality and Change Management, Universitat Politècnica de València, 46022 València, Spain
3
Facultad de Ciencias de la Educación, Universidad del Magdalena, Santa Marta 470004, Colombia
*
Author to whom correspondence should be addressed.
Sustainability 2020, 12(3), 924; https://doi.org/10.3390/su12030924
Submission received: 24 December 2019 / Revised: 21 January 2020 / Accepted: 24 January 2020 / Published: 27 January 2020
(This article belongs to the Special Issue Promoting Sustainability in Higher Education)

Abstract

:
Higher Education in Colombia is experiencing a period of shortfalls in funding which has obliged Universities to seek resources from non-governmental sources, in addition to this, the Ministry of National Education (MEN) has implemented a scheme where funds are assigned year on year but this is not considered part of the budgetary base. This study seeks to create a characterisation of the model and proposes the creation of a synthetic performance index based on Multiple Factorial Analysis (MFA). This index enabled us to rank the Higher Education Institutions (HEI) according to their performance and analyse the trajectory of Colombian Universities at a given moment, which meant their evolution over time could be reviewed, moreover within the complexity of the model of indices of results in Colombian higher education, the majority of HEI have a similar, yet, to some degree, distinct structure and display scores which show that within a certain degree of homogeneity, each institution has its strengths in some of the variables considered and its weaknesses in others.

1. Introduction

The Belgrade Charter (United Nations Educational, Scientific and Cultural Organization-United Nations Environment Programme) [1], is one of the first documents in which the term Environmental Education (ED) began to take concrete form. Later, the Tbilisi Declaration [2], built on the Belgrade Charter, suggests that:
“The basic aim of environmental education is to help individuals and communities understand the complex nature of the natural and the built environments resulting from the interaction of their biological, physical, social, economic, and cultural aspects, and acquire the knowledge, values, attitudes, and practical skills to participate in a responsible and effective way in anticipating and solving environmental problems, and in the management of the quality of the Environment” (p. 92).
In 2002, the United Nations (UN) declared the period of 2005–2014 as the decade for Education for Sustainable Development (SD) [3]. In addition, the World Commission on Environment and Development (WCED), who aims to address the nations of the world towards the goal of sustainable development, published in 2014 the Brundtland Report. The concept of sustainability, developed in this report became an important concept in the vocabulary of politicians, practitioners, and planners [1,4] and highlights the intersections of the three critical aspects, economic, social and environmental of corporate actions. Nowadays, the principles of Sustainable Development (SD) are becoming increasingly important since the development of Agenda 2030 for Sustainable Development, which includes 17 Sustainable Development Goals (SDGs), which organizations must progressively incorporate. In this study, we will highlight the importance of Sustainable Development Goal 4 (SDG 4), which is the educational goal and aims to "ensure inclusive and equitable quality education and promote lifelong learning opportunities for all", and governments must face the challenge of establishing the strategies and actions plans to develop a high-quality Environmental Education for Sustainability (EEfS). The UN declared education for sustainability (EFS) the key in solving many educational, environmental and social issues affecting all nations [1]. Education for sustainability can help ensure the conservation of nature and the future existence of humanity [5,6,7,8].
Universities are aware of the relevance of the concept of sustainable development and given the growing global interest on the university’s role towards promoting sustainability, an increasing number of universities are committing themselves to sustainability and are acting as agents in promoting these principles within society.
In recent years, several definitions of sustainable higher education institutions have emerged [9]. In addition, different studies have been aimed at assessing students’, professors’ and rectors’ perceptions of the factors that contribute to sustainable development in higher education [10,11]. Furthermore, several studies related to the implementation of sustainability in the higher education context, as Shriberg and Balas-Ferrer [12,13] stated that the main factors influencing the implementation of sustainability practices at universities are the following: public or private institutions, size, university leadership on sustainability and political orientation.
Universities could play their role effectively if they could identify the main characteristics or indicators to improve. In this context, the establishment of strategies and plans for the improvement of any system should address as a first instance the knowledge of the current state of the same, which is achieved through the formulation, study and analysis of performance indicators of the dimensions considered important for the achievement of objectives. This is also totally true in the Colombian State University System (SUE). The public Colombian universities are very different in size and financial resources. Traditionally, the government has assigned different budget regarding the location of the University. In this context, improving the performance of Higher Education Institutions (HEIs) is one of the challenges facing the education system in Colombia.
This paper seeks to create a characterisation of the Colombian Universities by studying the outcome indicators established in the Progress Index of Higher Education (IPES) developed by the Ministry of National Education of Colombia (MEN) through Multiple Factor Analysis (MFA) as tool and proposes the creation of a Synthetic Performance index based on MFA.
In Colombia, Higher Education is expressly defined and regulated by the country’s constitution and law 30 from 1992 respectively. In both these documents, it is considered as a public service inherent to the social function of the state, as a means of access to knowledge, science, technology and all the benefits and values that culture brings. This definition reflects the need to guarantee the public access to higher education, however, this is not guaranteed either at an international nor a national level as the quotas available are insufficient for large numbers of students who graduate from secondary education to gain access to university, although in recent years there has been a significant increase in places.
The World Declaration on Higher Education agreed within the framework of the 1998 World Conference on Higher Education [14] in its preamble declared that:
“The second half of this century will go down in the history of higher education as the period of its most spectacular expansion: an over six-fold increase in student enrolments worldwide, from 13 million in 1960 to 82 million in 1995. However, it is also the period which has seen the gap between industrially developed, the developing countries and in particular the least developed countries with regard to access and resources for higher learning and research, already enormous, becoming even wider. It has also been a period of increased socio-economic stratification and a greater difference in educational opportunity within countries, including in some of the most developed and wealthiest nations (P.1).”
In Colombia, according to information from the Colombian Institute for the Promotion of Higher Education (ICFES) and from the National System for Higher Education Information (SNIES), in 1993, enrollment in undergraduate programmes to the 32 state universities was at 159,218 students, while in 2003, the figure rose to 357,552 students enrolled, and in 2011 to 560,575, which supposed an increase of 56.78% between 2003 and 2011, and of more than 252.08% between 1993 and 2011. In 2017 the number of students enrolled in undergraduate programmes in the 32 Higher Education Institutes that are part of the state system (SUE) rose to 576,393. Nevertheless, despite the increase, the population served by the SUE reaches a coverage of just 13.35%, only taking into account the population increase amongst young people between 17 and 21.
For its part, the number of graduates from undergraduate courses rose from 37,846 in 2003 to 57,866 in 2011 with a percentage increase of 52.90%. Enrolment on postgraduate programmes went from 19,652 in 2003 to 46,974 in 2017, which meant an increase of 139.03%. Likewise, the number of graduates from postgraduate courses went from 5123 in 2003 to 13,355 in 2011 with a percentage increase of 160.69% in eight years.
Nevertheless, despite this progress in the numbers of places due to the efforts of the HEI and improvements in the education of higher education students, there has not been a significant increase in funding. Article 86 of Law 30 from 1992, states that “The national, regional and municipal University budgets will consist of contributions from the National budget for operation and investment, contributions from relevant territorial entities, and contributions from each institution’s own resources and revenue. State or official Universities will receive contributions annually from the national budget and from the relevant territorial entities, which will suppose an increase in funding in real terms, starting from a base set by the revenue and cost budgets in force as from 1993” [15].
In Article 87 of the abovementioned Law, it is established that the annual increase in the funding contributed by the state will be set in accordance with the growth of the economy (Gross Domestic Product, GDP) and in accordance with the objectives set out by the System for State Universities (SUE). However, according to SUE (2012), this system of funding has not been sufficient in order to support the development of the universities and comply with national objectives as regards the increase in coverage of and access to quality higher education [16].
Along similar lines, The Ibero-American Higher Education Report from 2011 carried out by the Inter-University Centre for Development (CINDA) [17], when making reference to the system of funding to Colombian state HEI, states that no significant changes have been made to funding, they are still funded based on the same regulations, and adjusted to inflation, which means in real terms they receive the same resources. However, as a proportion of GDP these resources have, in fact, been reduced, given that at the beginning of the period they supposed 0.50% and at its end 0.47% [17] (p. 309).
This characteristic leads us to conclude that state HEI funding is deficient, and imbalanced given that, in real terms, the HEI currently receive the same resources as they did in 1993, as the assigned budget to the state HEI is updated each year solely to conserve the value of money over time, without taking into account the costs incurred by the increase of coverage, supposed by the increase in the number of students enrolled, in the number of academic programmes, in administrative personnel, in teaching staff and increased salaries, which according to Decree 1279 from 2002 is essential to academic training and productivity [18].
The Ibero-American Higher Education Report, (2016), concludes that “The main source of funding for public institutions is tax subsidy, by way of a direct contribution, updated annually” [19]. It also highlights the spread of the use of criteria in the allocation of public funds dependent on competence, either based on a project competition, on internal efficiency indicators or related to improvements in quality, relevancy, and equality.
The allocation of resources model referred to in Article 87 of Law 30 from 1992 for the state HEI from 2003 and up to 2014 was based on internal efficiency indicators by way of a Stochastic Frontier model. Since the implementation of new regulations in force as of 2015, this allocation is established by way of the so-called Progress Index of Higher Education (IPES) [20], which takes three factors into account: Access, Achievement and Quality. However, the weighting assigned both to each of the factors which make up the said index and to the indicative variables of each factor is constant and equal to the inverse of the number of factors or to the number of indicators, respectively, from which, it is apparent, that the structure of the university system is not taken into account.
The current methodology used to allocate funds to state HEI is not equitable and the resources contributed end up being insufficient, some universities receiving much more money per student than others. This fact is especially evident when it comes to regionally-run institutions, posing one of the principal problems faced by the HEI, in that as the resources allocated by the national authorities are insufficient, they must seek other types of funding, amongst which are a rise in fees and the sale, for example, of other types of services, in order to balance the books.
Taking all this into consideration, this study firstly seeks to carry out a performance analysis of the Colombian state HEI by way of Multiple Factor Analysis (MFA), with the aim of creating a classification of these institutions and determining the variables on which improvement efforts must focus with the purpose of improving the performance of those HEI with low indicators in some of their substantive functions. In this way, a determination is sought of those critical variables amongst all the indicators currently used by the MEN in their allocation of funding methodology, in which the HEI show low-performance levels, and, thus, focus efforts on implementing improvement measures.
Additionally, this study seeks to propose a process for the creation of a synthetic performance index of Colombian state HEI. Starting from the criterion that it is possible to answer the question “Is it possible to synthesise a potential body of information into an index by way of a minimum number of new variables in such a way that they explain a significant part of the variance contained in the original variables?”. In order to answer this question, we must start by choosing a more adequate number of main components (factors in MFA). The quantity of MFA factors should be such that they explain a certain proportion of information in the original data matrix. In other words, the number of factors must be such that it contributes to explaining the highest possible amount of the total variance of the original data matrix.
Our starting point is the criterion that it is necessary to establish a more equitable model in the allocation of resources which quantitively analyses the information obtained by way of the different variables considered, both of the result indicators proposed by MEN and the resources utilised in order to carry out the mission of the state HEI.

2. Materials and Methods

This research seeks to analyse the management indicators of the Higher Education Institutions belonging to the State University System in Colombia, using Multiple Factor Analysis as a tool which allows for the creation of a characterisation of the HEI taking into account results indicators and resources with the aim of establishing an alternative index for the allocation of funds mentioned in Article 87 0f Law 30 from 1992 to Colombian public universities.

2.1. Multiple Factor Analysis (MFA)

Multiple Factor Analysis (MFA) is a multivariant technique in statistics which allows for the analysis of tables composed of several groups of variables of a different nature compiled within the same group of observations (individuals). By way of this technique, it is possible to characterise the group of individuals, in such a way that, we are able to answer the question: “Which are the individuals that overall, that is to say, from the point of view of the whole group of variables, are similar?” [21].
Frequently, a large amount of information (variables) is available, whose relationships are of interest for study, despite the fact that they measure heterogeneous aspects of the group of individuals under analysis. This information can be structured into different groups of variables and their analysis, by way of MFA, produces a wider vision of the phenomena under study.
MFA, established by professors Brigitte Escofier and Jérôme Pagès at the French School of Data Analysis [21], is a factoring technique for analysing tables in which the observations or set of individuals are described by various groups of variables. The required condition for their application is that the variables which make up each group are all of the same nature or of the same type: qualitative or quantitative [21,22,23].
The studies carried out using MFA reveal that it is a multiple table analysis technique which possesses a complete philosophy of comparative analysis, both by way of graphs and numerical indicators, of different data sets, whatever their nature or structure [24].
MFA is a technique which, from its very beginnings, has established itself with great versatility in the treatment of three-dimensional information, it is possible to highlight numerous studies carried out using the technique [24,25,26,27,28,29,30,31,32,33,34,35], demonstrating its power in the theoretical and empirical fields of diverse areas of study.
This technique is closely linked to Principal Component Analysis (PCA) and to Multiple Correspondence Analysis (MCA) for the analysis of data which contains information on individuals described by way of variables, both continuous and categorical. The main difference as regards these techniques lies in the way the variables are organised. In MFA, they are organised in groups of variables of the same nature, in such a way that they balance the influence of the groups of variables giving each variable a weight, which must be the same for all the variables of the same group, with the aim of maintaining the internal structure of each group, that being one of the fundamental characteristics, in the sense that it is the source of this method’s properties [21].
This differentiation between groups of variables is justified in a way which is external to the analysis and depends on the aims and characteristics pertaining to each variable. For example, in the case of the HEI, variables can be used which are related to available Resources, variables concerning Quality results, others related to Access and Continuation of studies, and, finally, variables related to Achievement results. In general terms, the objective is not merely to obtain a characterisation of the individual based on the analysed variables, but the search widens to possible associations between groups of individuals and relations between groups of variables and factors common to the groups.
The existence of groups of variables invites the application of factorial study, not only by way of the set of all the variables but also by way of each one of the separate groups. In order to do this, it is always possible to analyse the groups separately. However, the results obtained independently are not mutually comparable. For example, the structure of each group may be masked by the rotations of classical factor analysis. Thus, in order to compare variables of different natures, it is necessary to use a common reference point. In order to resolve this problem, MFA provides a factorial representation in which the rendition of the described individuals for each of the groups of variables appear separately [21].
The consideration of a group structure of a set of variables poses a technical problem, in reference to the weight allocated to each group and enriches the objectives of the study (comparison between groups, comparison between the typologies of the observations defined for each group). MFA solves the problem of balancing the influence of the different groups, weighting the variables of each group by way of the inverse of the first intrinsic value resulting from Principal Component Analysis (PCA), carried out on the variables which make up each group [21]. This way of weighting the variables of each group considers the distribution of inertia in such a way that it can be applied irrespective of the number of variables found in each group [36] and maintains the internal structure of each group of variables, while balancing the role of each group, in the sense that, none of them can singly determine the first principal component of the set (that which maximises the projected inertia of all of the variables) [21].
Hence, the MFA method, when all the variables analysed are quantitative, as is the case in this study, is based on PCA and consists of two stages:
In the first stage, a regulated PCA is carried out on each group of variables and the first intrinsic value of each analysis is taken. In the second stage, a PCA is carried out on the table resulting from the bringing together of all the categories of variables previously weighted by the inverse of the first intrinsic value obtained in the first stage.
The MFA also provides two coefficients which are of great importance in order to understand the relationships which exist between two groups of variables and between the variables of a single group.
The first of these is the RV coefficient, which is a multivariate generalisation of the Pearson correlation coefficient and is used to measure the association between two groups of variables of the same sample, taking into account the different matrices used to measure the distances between points [37].
The second index used to evaluate the relationship between the two groups is the Ng coefficient which is similar to Lg when applied to a single group. The Ng coefficient indicates, for each group separately, the dimensionality of the group. For example, for a group in which most of the inertia is explained only through the first dimension, the Ng coefficient is lower than for a group in which the information is well balanced across the first five dimensions. When measurements are made between pairs of groups, the Lg coefficient measures the richness of the common structure between the two groups: the higher the Lg coefficient, the greater the common structure [38]. That is to say, that it may be interpreted as a measurement of the dimensionality of a group of variables, with high values indicating a multidimensional group [39].
Hence, the Lg coefficient allows us to measure up to what point the tables are related two to two and will continue increasing its value contingent to the increase in the number of variables of a first table which are related with the variables of the second table.
In this way, MFA provides, in addition to the results of the PCA, general measurements of the relation between the groups, by way of the RV and Lg coefficients, at the same time as a representation in graph form, of great explanatory and interpretative potential, of the existing relations between the observations and of those existing between the variables and/or groups of variables.

2.2. Creation of A Synthetic Performance Index

The results of the MFA comparative analysis may be used for the creation of a synthetic index which values the performance of the Colombian state HEI. According to García, Gil, Pascual, and Rapún [40], an aspect of great importance in the creation of an index which synthesises the information offered by the variables considered relevant, due to their impact on the final result, is the selection of the aggregation process. The aggregation processes must eliminate any randomness when measuring the importance of each variable in the construction of the index. Therefore, if the variables and or indicators selected define different performance characteristics of the Colombian state HEI, and they are measured in different units, “is it possible to aggregate the set of information by way of the allocation of weighting to each variable?” [40].
The solution that we address in this work is provided by Multiple Factor Analysis (MFA), as it allows a reduction of the dimensions of the data matrices and provides artificial variables called dimensions with certain interesting properties, amongst which we should mention the following:
  • The resulting dimensions of the MFA are non-dimensional, given that the MFA is carried out on typified variables. This aspect is essential when heterogeneous variables are aggregated.
  • The factors are not correlated two to two, their covariance is null, which implies they do not share any information.
  • The first factor accumulates the higher percentage of variance or total information, followed by the second and then in this way successively until the last factors, which scarcely accumulate information, are reached. This is an attractive characteristic because it allows us to construct indices using the weighted factors according to the total information explained. Said weighting is not subjective, instead it depends on the explanatory power of each factor [40].
  • MFA balances the influence of the groups of variables, in such a way that one single data set cannot contribute on its own to the construction of the first factorial axis (first dimension) [23].
Due to the above, MFA, in addition, reduces the data matrix of original data to just a few factors, a technique which allows for the non-discretional allocation of weights to the variables which make up the index, eliminating the subjectivity of more classical methods [40].
In this work, an index will be constructed based on a number of components which explain a determinate proportion of the variance contained in the original data. This synthetic index (IAFM) will take into account all the factors with which important quantities of information are not lost, and is the result of a linear combination of the factors, giving a weight to each factor equal to its explanatory importance, that is to say, the weighting of each factor is equal to the percentage of total variance which explains said factor.
As the variables are typified, the values of the factor scores will take on positive and negative values depending on whether they are above or below the mean. According to García and Abascal [41], from an econometrics point of view, the factor score cannot be used as an indicator since it is expressed in terms of deviations from the mean, for this reason, the factor scores must be transformed in such a way that their minimum value is zero. Usually, the exponential transformation proposed by Calsamiglia [42] is used. The formula for the transformation is the following:
f ( F i ) = { 1 + k 1 2 e F i       si   F i < 0 , k k 1 2 e F i   in   another   way
where parameter k controls the degree of progressivity of the transformation and is the range value for the values of the transformed factor. Hence, if k = 100 indicates that the transformation will produce values with 100 as the higher quota.
Once the transformation is realised as regards the factor scores the weighting of these is carried out according to the variance explained for the said factor. In such a way that the proposed index is calculated by way of the following expression:
I A F M = i = 1 p f ( F i ) × V a r i a n c e   E x p l a i n e d   p e r   F i T o t a l   V a r i a n c e
The HEI are classified according to the value of the IMFA.
Many works have employed dimensions reduction techniques like Principal Component Analysis, Factor Analysis or Multiple Factor Analysis when evaluating performance, amongst which we should highlight those carried out by [40,41,43,44,45,46,47].

3. Results

Since 2003, the Ministry of National Education of Colombia, (MEN), in conjunction with the State University System (SUE), started to develop a system of indicators which allowed for the assessment of the performance of State Universities. With this in mind, they prepared a proposal presented to the Higher Education Council (CESU), whose aim was to stimulate the improvement of the whole State University System, by way of the monitoring of the management of components inherent to the university, with a focus on equity and heterogeneity [48]. The MEN based the model of the indicators on the assumption that a University is, “an organisation or unit of management which receives inputs, processes them and delivers products and results directed towards the achievement of its mission objectives which are teaching, research and extension of knowledge” [48]. However, from 2015 it implemented a new system of result indicators, which now make up the current IPES (Progress Index of Higher Education), consisting of thirteen variables, or indicators, distributed into three groups of variables called dimensions: Quality, Achievement, and Access and Continuation of Studies [20].
The dimensions of the IPES are formulated as groups of observations in terms of several categories, as we can find in many studies in different contexts. This structure can remain hidden when a global analysis of the information is made. In this sense, Factorial Analysis can work with variables of different natures and allows the information to be treated in terms of multiple tables, not limiting itself to the search for relationships between variables or to the individuals, but extending its scope to a comparative analysis, which takes into consideration the relationships between variables within each table and the relationship between tables of different natures.
It is also important to be aware of the relationships between the different HEI and those which exist between the HEI and the groups of variables, and finally, determine on which variables should action be taken in order to improve the performance of the HEI. In order to do this, the behaviour of the HEI regards its performance in each one of the groups of selected variables, the relationships existing between groups (categories) of variables and the relationships between HEI will be analysed. In this study, in addition to the dimensions which make up the IPES, variables which make reference to the resources that the HEI can count on to carry out their mission functions will also be considered, given their great importance as regards the study of the current situation of an HEI.
The analysis of these relationships may have an impact on the establishment of action plans on the part of those administering the Colombian higher education sector in view of improving the quality in the training of future graduates and in the research processes of the teaching staff, which at the same time will lead to the improvement of performance at an institutional level, and by extension, to the Colombian State University System.

3.1. Description and Treatment of the Data

The HEI considered in this study correspond to all universities (32) belonging to the Colombian State University System. The study of the indicators for the management of the Colombian State HEI by way of Multiple Factor Analysis is carried out with data published at the end of 2018 by the MEN, corresponding to the allocation of resources stipulated in Article 87 of Law 30 from 1992 and in force in 2018 [49].
In the study of performance indicators by way of MFA, the variables used are not exactly the same as those which make up the IPES, given that this index has some indicators which measured in variations from one year to the next. In this application of MFA, the absolute values of the result indicators are considered, as the final aim is to carry out a comparative analysis of the state of the universities belonging to the SUE during the year of 2018. In addition, a group of variables associated with resources has been included (Expenditure in Administration Personnel, Total investment and Full-Time Equivalent Teaching Staff (DTCE)) (Table 1).
The IC6 variable from the quality dimension of the Synthetic Index from the year 2018 in the MFA carried out, will be considered as a supplementary variable, that is to say, a variable which does not participate in the determination of the dimensions of the MFA, but which is projected over the factor plane after it has been carried out.
In order to carry out the analysis by way of MFA, the FactoMineR package [50] from the R statistical software was used. The MFA graphs were realised using the Factoextra package [51] from the R statistical software.

3.2. Weighting of the Groups of Variables

The following shows the results of the PCA for each group, with the aim of determining the weight of each variable in each group (Table 2).
The PCA of the Quality group shows us that the first intrinsic value is 3.104, therefore the weight of each variable of the group is determined with the inverse of this value, or, 1 3.104 = 0.3221 . The PCA of the group indicates that with two factors, 83.13% of the variability of the group of variables is explained. The first intrinsic value from the Access group is 1.751, therefore, the weight for each variable of this group is 0.5711, and with two factors, 92.52% of the variability contained in the group is explained. The first intrinsic value for the PCA of the Achievement group is 2.714, therefore the weight for each variable of the Achievement group is 0.3684 and with two factors, 91.96% of the variability is explained.
Finally, a first intrinsic value for the Resources group of 2.564 was obtained, therefore, the weighting of each of the Resources group is 0.390 and with two factors, 98.50% of the variability contained in the Resources group is explained.

3.3. Multiple Factor Analysis (MFA)

On carrying out the general analysis (MFA) for the variables and groups considered, we found that with 3 factors (dimensions) explains 80.68 % of the variability contained in the 14 analysed variables is achieved. Table 3 shows the intrinsic values and the variability explained by each one of the 3 principal components (factors).
In Table 4, the correlations between the groups of variables and the factors (F1, F2, F3) can be observed. The existence of common factors between the groups is justified by the correlation between the factor and the groups of variables. The high degree of correlation of factor 1 with the three groups of variables (Resources, Access, Quality and Achievement) is interpreted as a common axis to the four groups, that is to say, we can state that there exists a direction (factor 1) of dispersion which is almost analogue in the four groups of variables, whereas factor 2 reduces its correlation significantly for two of the groups, Access being the category with the greatest correlation with this second factor. Finally, factor 3 shows the greatest correlation with the Quality group.
When a common direction of dispersion exists to all or some of the groups, it is of interest to measure and compare their importance in the different groups. The importance of a factor in a group is measured by the accumulated inertia of the variables of the group over this factor, which is also referred to as the weight of the factor in the group [19].
In 
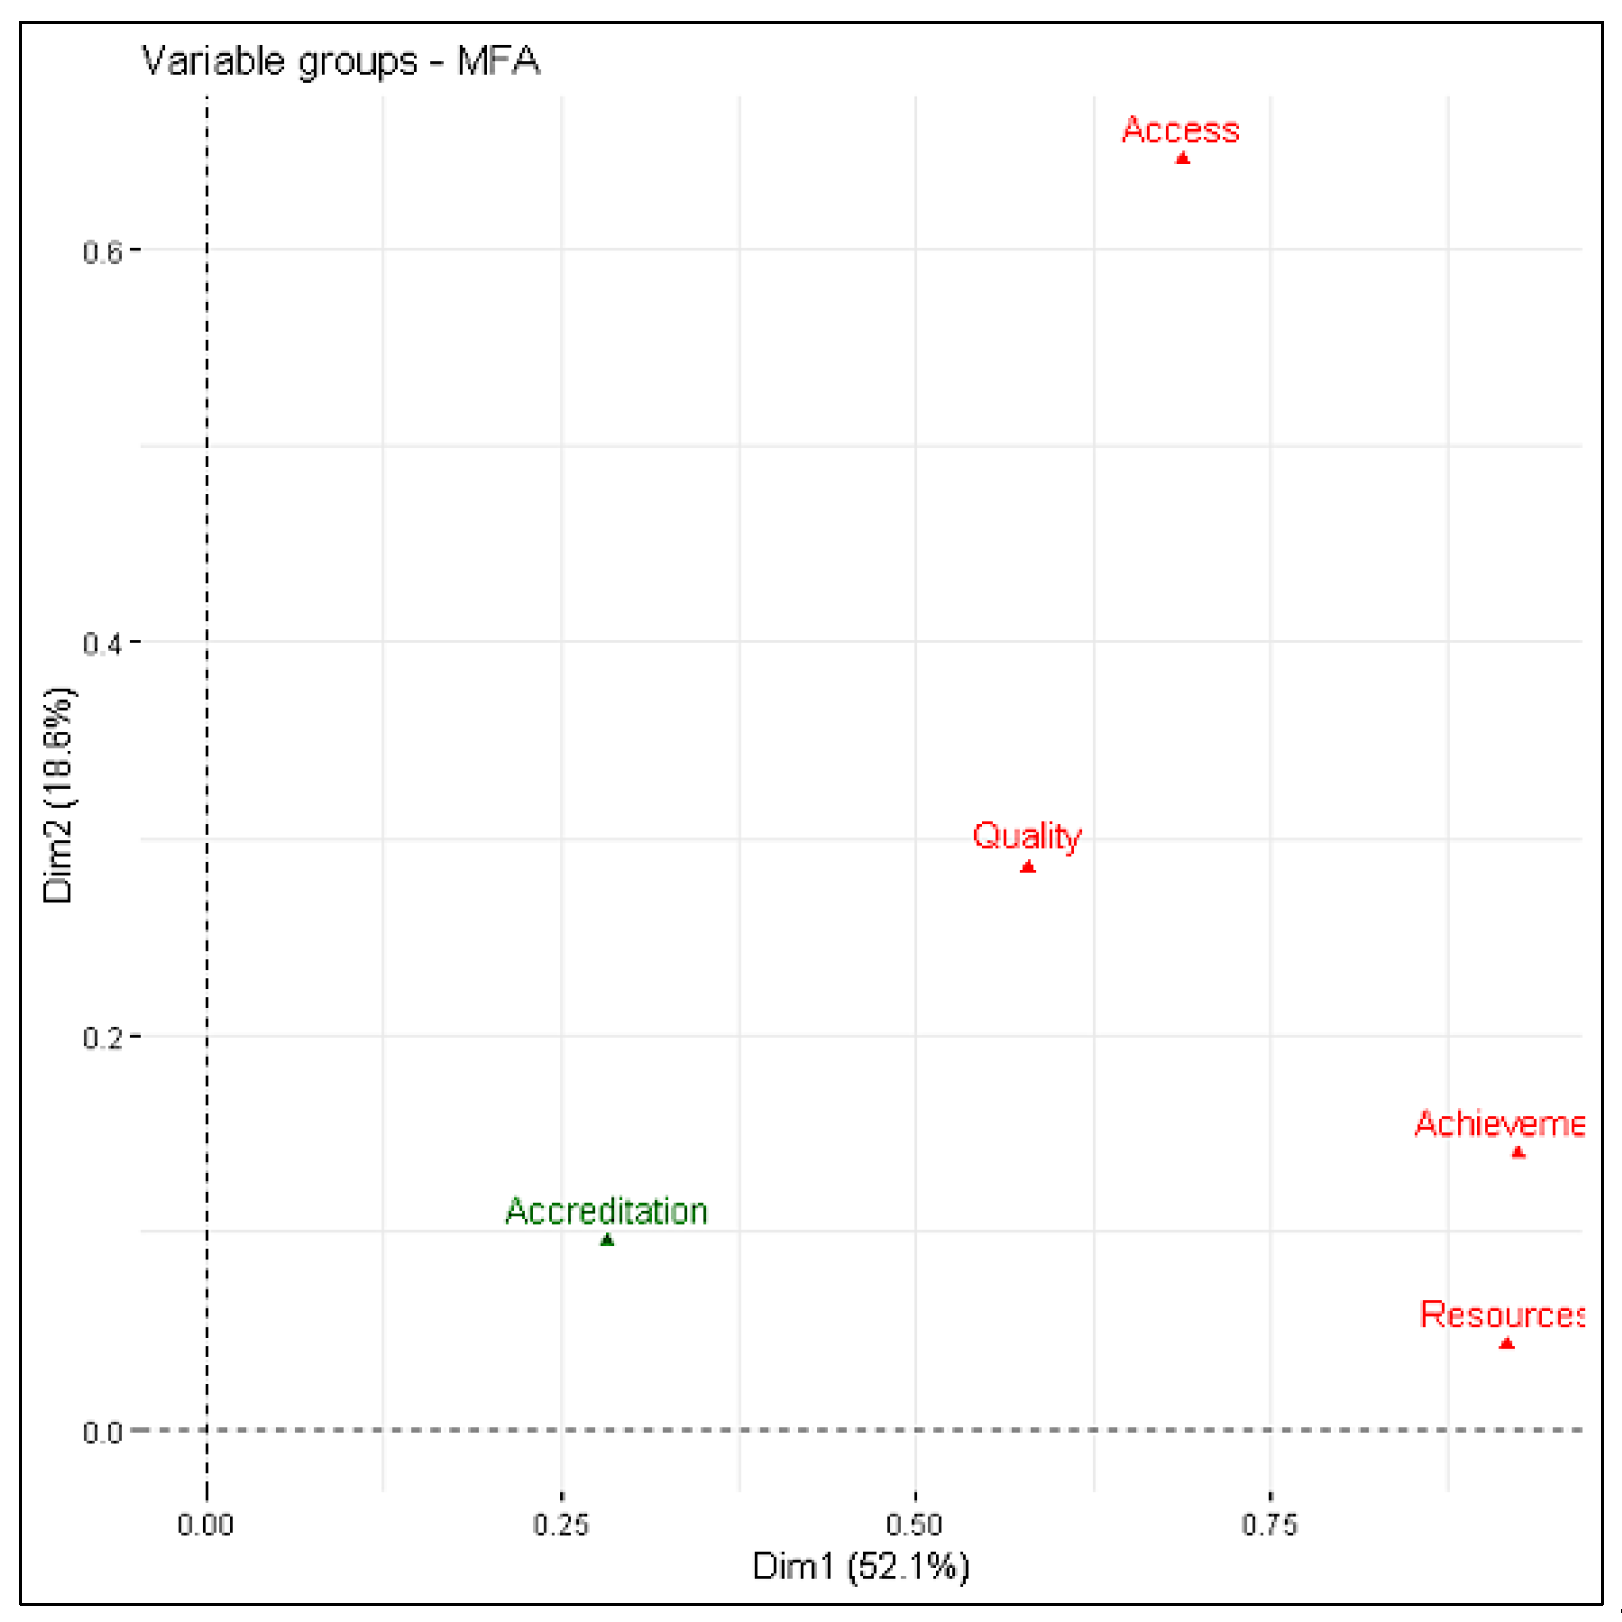
Table 5, the coordinates of the groups over the factor axes of the MFA are observed. These coordinates represent the decomposition of the accumulated inertia of the variables of the group over the corresponding axis of the MFA, that is to say, its importance. The high values for the four active groups in the first factor indicate that this principal component is closely related to each one of the groups, in the sense that it constitutes a significant direction of inertia for each group of variables. Specifically, this first factor is linked to a large number of variables of each one of the groups, and in particular to variables of the Achievement (0.924) and Resources (0.916) groups.
As for the variables of the Access (0.645) group, they are more important in the definition of the second factor, whereas the variables of the Quality (0.312) group are those which chiefly define the third factor.
In Table 5, the coordinates which indicate the correlation which exists between each group of variables and the factors resulting from the MFA are presented. It may be observed that Institutional Accreditation (0.282) is more related to the first factor than with the remaining factors, (0.095 for F2 and 0.134 for F3), therefore, we can state that they also relate more to the Achievement and Resources groups.
The representation in graph form of the data from Table 5 is presented in Figure 1; Figure 2, where the distribution of the groups of variables in the factor axes may be appreciated.
Table 6 shows the association of the variables with the factors. We can observe how factor 1 (F1) is more associated with the Achievement group of variables, followed by the Resources, Access and Quality group. That is to say, 29.732% of the inertia collected by the first factor is caused by the variables which make up the Achievement group, whereas 29.482%, 22.148% and 18.638% are generated by the variables of Resources, Access and Quality, respectively. Furthermore, this first factor explains 29.1% of the dispersion of the different HEI in accordance with its behaviour in the Quality group of variables, 82.10% of the existing dispersion in the Resources group, 75% of the variability in the Achievement group and 34.90% of the variance in the Access group.
The contribution of the Access group to the formation of the second factor amounts to 57.97%, whereas the contribution of the Quality group in the definition of the third factor amounts to 52.56%.
In MFA, it is possible to highlight the groups of quantitative variables using the cosine-squared values, those which indicate the quality of representation in the factor map, that is to say, it is a measure of how well the group of variables are reflected by the dimensions.
The cosines-squared shown in Table 6 indicate that the first factor presents a good reflection of the variability present in the four groups of variables, this not being the case for the second factor, where only the Access group stands out. As for the third factor, it contains very little reflection of the groups of variables.
Table 7 shows the Lg coefficients, in which we may observe that the Access group contains the most heterogeneous variables (the most multidimensional group) followed by Quality and Achievement, whereas the most homogeneous is Accreditation followed by Resources.
Table 8 shows the RV coefficients. These are defined as a measurement of the association between the groups. From the table, it may be discerned that a strong similarity exists in structure between the Resources group and the Access and Achievement groups due to the high correlation between them, whereas the Accreditation group is associated more with Quality (0.462). Obviously, the relationship is greater between each one of the groups and the general table (MFA Row).
When the estimated factors are not correlated, that is to say, they are orthogonal, the factor loadings are also the correlations between the factors and the variables. Hence, in Table 9, it may be observed that the variables most correlated with factor one (F1) are IL3—Weighted Number Research Groups (0.976), IL2—Weighted Number Researchers (0.966), IA2—Weighted Post-graduate Enrolment (0.953), IR1—Administration Personnel Costs (0.928) and those least related are IC3—Proportion of Teaching Staff with Master’s (0.084), IA3—Retention rate(0.138), IL1—Under-graduate Graduation rate (0.155), e IC5—Proportion of Accredited Programmes (0.359), in this way confirming the first factor’s association with variables of the Achievement group.
The most correlated variables with factor two (F2) are IA3—Retention rate (0.758), IA4—Weighted Undergraduate Enrolment (−0.733), IC5—Proportion of Accredited Programmes (0.586), IL1—Under-graduate Graduation rate (0.581), e IC3—Proportion of Teaching Staff with Master’s (0.454), and those least related are IL3—Weighted Number Research Groups (−0.017), IL2—Weighted Number Researchers (−0.018), IR1—Administration Personnel Costs (−0.031), and IR2—Investment (−0.083), in this way confirming the second factor’s association with variables of the Access group.
Finally, the most correlated variables with factor three (F3) are IC3—Proportion of Teaching Staff with Master’s (0.734), IA3—Retention (−0.510), IC5—Proportion of Accredited Programmes (0.455), IC2—Critical Reading (0.374), e IC1—Quantitative Reasoning (0.289), and those least related are IL4—Number of Articles Published /Full-Time Teaching Staff (DTC) (0.07), IR3—Number of Teaching Staff on Equivalent Full-Time (DTCE) (0.065), IC4—Proportion of Teaching staff with PhD (−0.021) and IA2—Weighted Postgraduate Enrolment (−0.016) in this way confirming the third factor’s association with variables of the Quality group.
Figure 3 shows a reflection of the variables as regards their correlation with the factor axes. The arrows indicate the directions of growth of said variables in the factor space, which allows us to identify, in graph form, which variables have the most weight in each component. The centre of the circle of correlations represents the mean of all variables.
The different variables correlate to a greater or lesser extent depending on how close their vectors are, that is to say, that the nearer the angle between these variables is to zero, the more correlated they are and vice-versa. As may be observed in Figure 3, the IR2 variable—Investment, forms an angle of 90° with IA3—Retention, as does the IA4 variable—Weighted Undergraduate Enrolment, with the IC2—Critical Reading and IC1—Quantitative Reasoning variables, which indicates that the first variable is not associated with the second. In general, it may be observed that there is a high degree of correlation amongst the variables of the Achievement, Resources and Quality groups, which is not the case for the variables of the Access group. In particular, a high degree of correlation may be observed between IL2—Weighted Number of Researchers, IL3—Weighted Number of Research Groups, and IL4—Number of Articles Published by Full-time Teaching Staff.
The MFA allows for the projection of the 32 HEI in a factorial plane and describes their behaviour in relation to their coordinates (Figure 4 and Figure 5), that is to say, the individual (HEI) seen for all groups of variables, which allows us to visualise the structure and similarity of the HEI studied. As may be observed, the majority of HEI have a similar structure, with the exception of UNAL, UDEA, UNAD, Valle and UIS.
In Figure 4, it may be observed that the HEI are more developed in Achievement indicators (and greater Resources) the more to the right of the plane they are, and the greater development in Access indicators, the more their position moves towards the top. Similar results may be discerned from Figure 5, the HEI which have the best performance in Quality are found more towards the top.
In this way, two HEI may exhibit the same behaviour as regards to one axis, such as Pedagógica and Militar with respect to the first and third factor (Achievement and Quality, respectively) and, nevertheless, show distinct behaviour as regards the second factor (Access). In this case, the performance of Pedagógica is better than that of Militar with respect to this second factor (Access).
The results for the HEI obtained from the analysis carried out with a single group of variables are termed partial individuals, that is to say, an individual considered from the point of view of a single group of variables.
Figure 4 and Figure 5, are shown for each HEI included in the study, the point corresponds to the individual (centre of gravity). That is to say, the individual seen by all the groups of variables. For a given individual, there are as many partial points as groups of variables.
Figure 6 and Figure 7 show the partial individuals’ graphs for 1 and 2, and 1 and 3 dimensions, respectively. The partial individual’s graph reflects each HEI seen by way of each group of variables and its centre of gravity.
It may be observed that UNAL has the best performance in Achievement, it is in the mean value as regards performance in Access and is a low performer in Quality, whereas UDEA has the second-best performance rating in Achievement, a mean value performance as regards Access and performance somewhat above the average in Quality. UNAD has a mean value performance as regards Achievement, the lowest performance in Access and the best performance in Quality. The Universidad Pedagógica Nacional has the best performance in Access, a mean value performance as regards Achievement and the second-best performance in Quality (jointly with the Universidad Militar).
For their part, the Pacífico, Chocó, UPFS–Ocaña, Guajira, Cesar, Pamplona and Cundinamarca universities display the lowest performances in the first factor (Achievement), however, we should remember that this factor is also associated with Resources, that is to say, these are HEI which also show low levels of resources.
The universities of Guajira, Pamplona, Cesar, Pacífico and Chocó show the lowest performance in Access. The universities of Chocó, Guajira, Pacífico, Ocaña and Cesar show the lowest performances in Quality.
In general terms, we can interpret Figure 4 and Figure 5 as reflecting that the HEI which are similar are found close to each other on the plane. (See Figure 6 and Figure 7)
Figure 8 is an amplification of Figure 7, showing the universities which exhibit the most weaknesses (third quadrant). As may be observed, the universities which show the greatest deficiencies are those of the Pacífico, Chocó, UFPS–Ocaña, Guajira, Cesar, Amazonía, Sucre, Llanos, Pamplona and Cundinamarca.
As can be seen in Figure 8, generally speaking, the HEI in the study need to make great improvements to the variables in the Quality, Achievement and Access groups. In particular, the universities of Chocó and Pacífico should improve indicators for the Quality group, the universities of Pamplona and Cesar are shown to have the greatest problems in the variables of the Access group and the universities of Cesar and Cundinamarca are shown to have the greatest problems in the variables of the Achievement group.
In general terms, these HEI need to make a great effort to improve, especially in the indicators from the area of management.
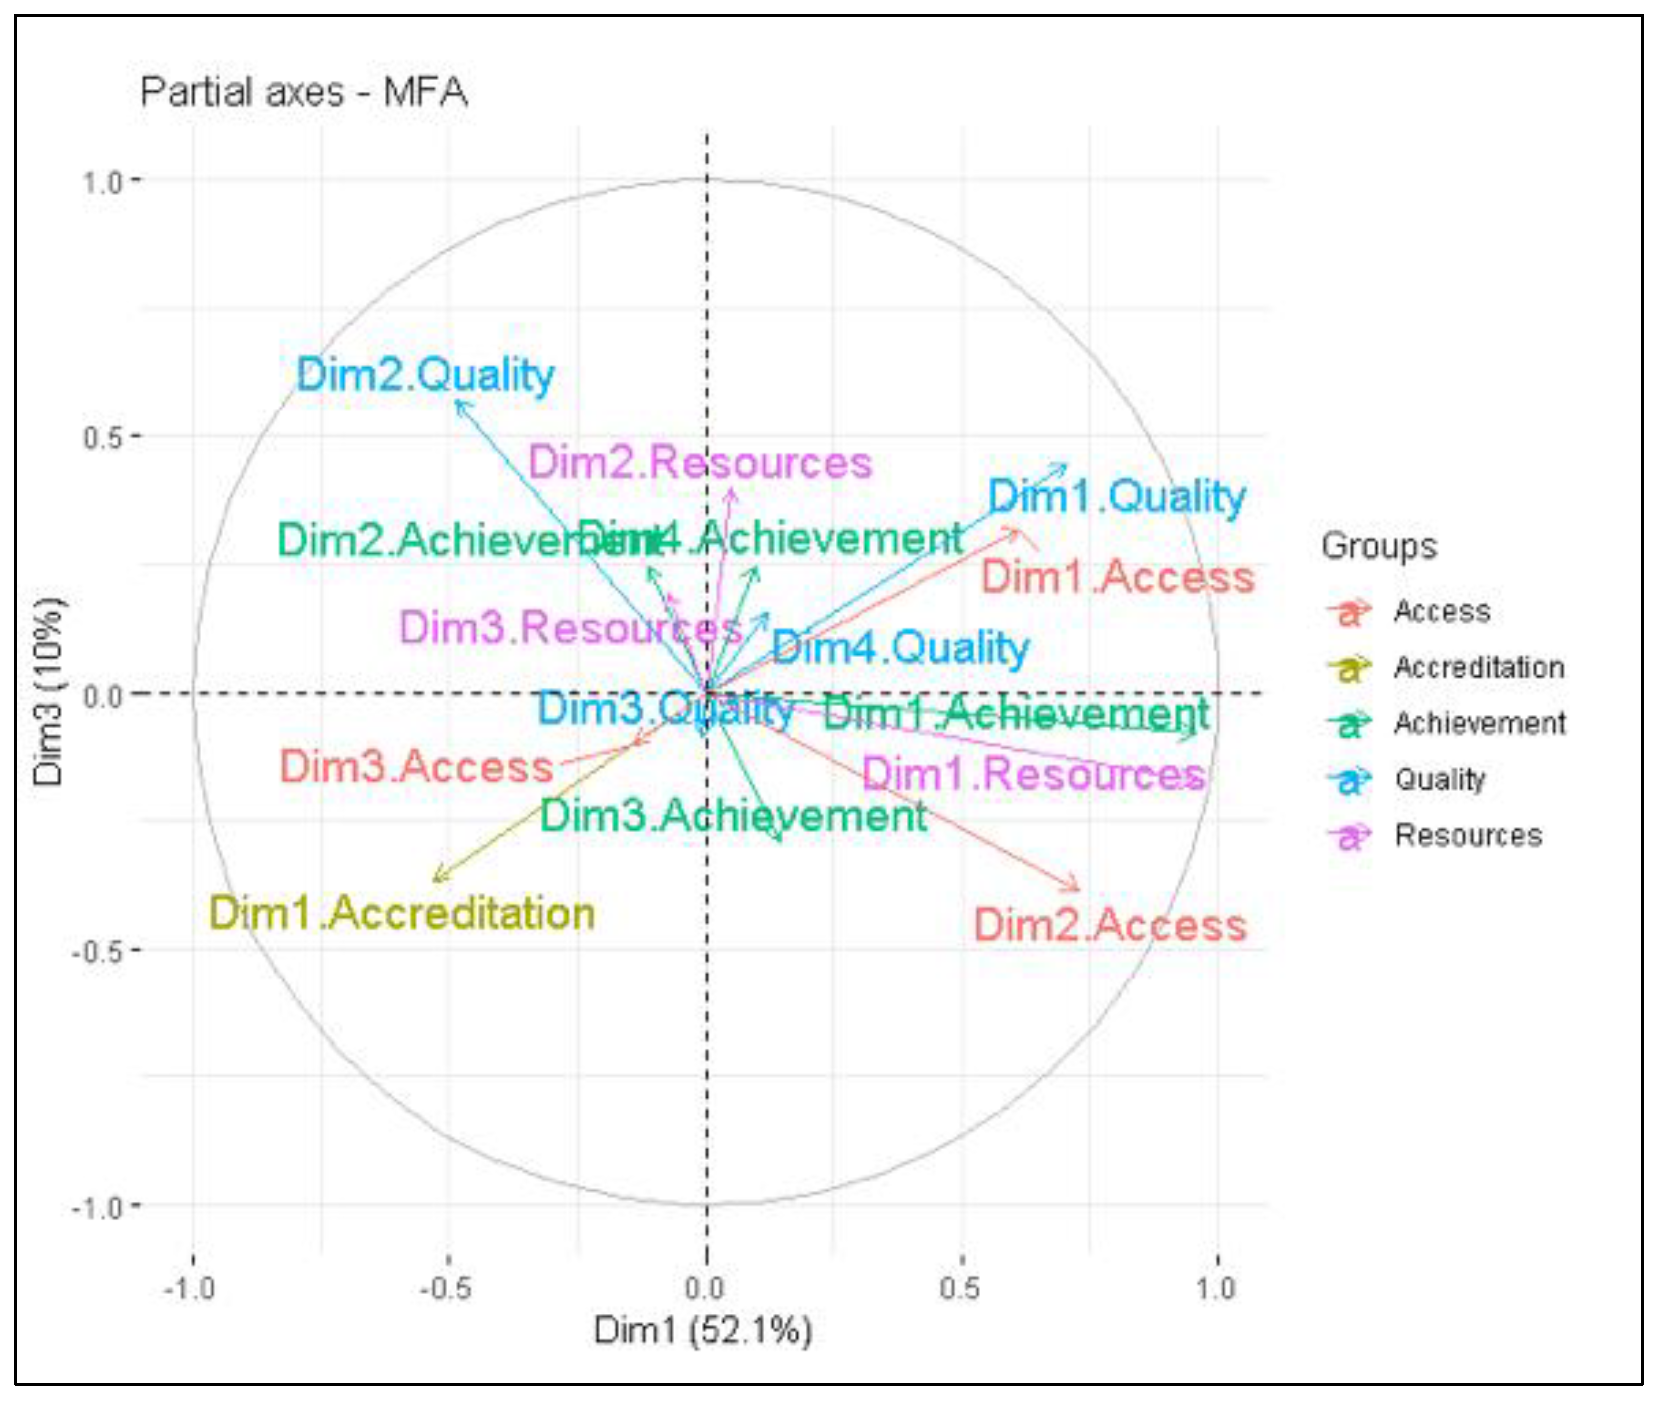
Figure 9 is the graph of the partial axes. It shows the principal surveyed components over the plane of the first two principal components of the MFA and reflects the relationship between the MFA factors and the principal components obtained from the PCA of each group separately.
In this graph, it may be observed that the first factor of the MFA is closely correlated both with the first principal component of the Achievement group and with the first principal component of the Resources group. The second factor of the MFA is primarily related to the second principal component of the Achievement and Resources groups. From this, we can again corroborate the close relation which exists between the variables of the Achievement group and those of the Resources group.

3.4. Synthetic Index of Performance (IAFM) of the Colombian State HEI

Following this, the synthetic index of performance (IAFM) of the Colombian state HEI is calculated in accordance with the proposed procedure, which allows for the organisation of the universities into a ranking order and the subsequent allocation of funds to each of the HEI, as established in Article 87 of Law 30 from 1992. The calculation of the IAFM is carried out using the factor scores of the first four dimensions of the MFA, given that with 4 dimensions, 85.76% of the variance contained in the original data can be explained. The percentage of variance explained by the first three factors is shown in Table 3, the fourth factor explains 5.082% of the variability present in the original data.
The exponential transformation applied to the factor scores from Table 10 is carried out by way of the algebraic expression (1) where k = 100 and which produces the values of f ( F i ) which are shown in columns 2–5, of Table 11.
The results of the last column of Table 11 were obtained by way of the weighted sum of the transformed scores f ( F i ) . Weighting is applied using the proportion of variance explained for each dimension of the MFA by way of the expression (2), in such a way that the transformed score of the first factor has been weighted by 0.52087, the transformed score of the second factor has been weighted by 0.1863, the transformed score of the third factor has been weighted by 0.09956 and finally, the transformed score of the fourth factor has been weighted by 0.05082. In such a way that the expression (2), applied to the data under consideration in this work will be as is shown below, in order to extract the index for each university, allowing us to position it in the ranking.
I A F M = 0.5209 * f ( F 1 ) + 0.1863 * f ( F 2 ) + 0.09956 * f ( F 3 ) + 0.05082 * f ( F 4 )
The ranking of the Colombian state HEI, shown in Table 12, was achieved in accordance with the IAFM of the previous table. The determination of the Percentage of the Resources, established in Article 87 of Law 30 from 1992, allocated to each HEI is obtained as the percentage of the IAFM of each HEI of the total sum of the IAFM of all the HEI (1277.0466). That is to say, the percentage of the total general sum of the IAFM is considered as a proxy for the resources to be allocated to each HEI.
The results obtained by way of the application of the IAFM place, according to the proposed index, the universities of Pacífico, Guajira, Chocó, Cesar, UFPS-Ocaña, Cundinamarca and Pamplona as the lowest in performance. In this sense, this is consistent with the abandonment on the part of the national government of the regions where the universities of Pacífico, Guajira and Chocó are located. We must bear in mind that the first dimension of the MFA, which accounts for 52.09% of the variability which exists in the data, is strongly related with Achievement and the Resources available to each of the HEI in order to carry out their functions.

4. Discussion

Implementing educational change towards fulfilling the Sustainable Development Goal 4 (SDG 4), is a complex process and it is essential to recognise and understand the factors and indicators required for success. Educational Changes is a complex process given the number of stakeholders involved.
This study contributes to understanding how the indicators established in the Index of Progress in Higher Education (IPES), on which the funding of Colombian Public Universities is based, can be modified and emphasizes the influence of each them.
MFA is considered to have great advantages in the handling of multiple groups of variables of a different nature, in the analysis of multiple tables of data. Currently, in the SUE model, the weighting value for each group of variables is the same (1/3 for each factor, and inside this, each variable is weighted equally). Nevertheless, the universities, despite carrying out the same functions display different results in their performance, in each one of the variables, and in some cases, this is a consequence of lack of resources. In the proposed model, the weighting is assigned in accordance with the variability of the data, with the objective of balancing the influence of the groups of variables. This characteristic allows us to conclude that this model has certain advantages, comparatively speaking, over the model used by the SUE where the weightings were assigned arbitrarily, without taking into account the structure of the data. In this model, the weightings are assigned considering the structure of the data and are based on the variability of the same.
The results allow for a comparative analysis of the performance of Colombian HEI and lead us towards the suggestion of improvement measures for each individual university. However, these results also suggest the need for a deeper, more general analysis and the possibility of a cluster analysis, which would seek to group together the universities which have the most similar characteristics, according to the data structure.

5. Conclusions

After performing this analysis, we can conclude that Multiple Factor Analysis (MFA) is a technique which contributes a greater degree of information to the classical analysis of Principal Components, enabling the grouping together of variables of a different nature. The analyses of these groups of variables determine the mean position of each individual on the factorial map, which enriches the analysis of the studied factors. Hence, characterisation (comparative study) of each HEI is made possible as regards the strengths/weaknesses displayed in each one of these groups. At the same time the existing relationship between the variables of a single group and those existing between different groups are demonstrated. In this way, there is much greater clarification of the issue under consideration, which can contribute to better decision-making in the administration of the Colombian State University System (SUE).
Secondly, MFA is a valuable tool for analysing, in greater detail, the behaviour of a single specific university. This method analyses the trajectory of Colombian universities at a determinate moment, allowing us to review their evolution over time.
The most interesting results from this sector reveal that, within the complexity of the model of results indicators for higher education in Colombia, the majority of HEI have a similar structure, with the exceptions of the higher scoring UNAL, UDEA, UNAD, Valle and UIS.
The best performance in the variables of the Achievement group belongs to UNAL, followed by UDEA. The best performance in Quality corresponds to UNAD, while the Universidad Pedagógica demonstrated the best performance in Access, and the second-best in Quality (shared with the Universidad Militar).
It is worth stating that UNAL is the best positioned in axis 1 (Achievement and Resources), however, in comparison with the rest of the HEI it may be observed that it is outperformed by many of the others in Quality and in Access.
Amongst the HEI with most weaknesses, we have Pacífico, Chocó, Guajira, Cesar, Pamplona, Cundinamarca and UFPS-Ocaña. These universities are shown to have difficulties in the three groups of results indicators. However, we should highlight that performance in the Achievement group is closely correlated with the Resources available to the HEI. These shortfalls need to be studied by both the corresponding ministry and by universities’ own administrators.
The application of MFA enables the identification of the key variables, for each of the HEI, on which the improvement measures must focus, with the aim of improving performance in accordance with the IPES results indicators, in order to carry out their intended functions. All of which makes a significant contribution to the concept of performance in Colombian higher education.
Finally, the application of an aggregation process for the creation of a performance index based on MFA (IAFM) enables the elimination of arbitrariness when determining the importance of each variable in the construction of the index, and therein lie the benefits of the proposed process as compared to traditional methods.
The Colombian state universities were organised into a ranking by way of the application of the proposed process for the creation of a resources allocation index and subsequently, a framework was provided for the allocation of the resources stipulated by Article 87 of Law 30 from 1992, which contributes to approach the question “how well positioned is each university to the change in general, and particularly for change of educating to the sustainability?”

Author Contributions

D.V.-C. and M.M.-G. conceived and designed the experiments; D.V.-C. performed the experiments and analyzed the data; M.M.-G. and R.E.-C. contributed analysis tools; D.V.-C. and R.E.-C. wrote the paper. M.M.-G. and R.E.-C. revised the paper. All authors have read and agreed to the published version of the manuscript.

Funding

This research was funded by UNIVERSIDAD DEL MAGDALENA, Santa Marta, Colombia.

Conflicts of Interest

The authors declare no conflict of interest.

References

  1. Barry, J. The Belgrade Charter: A global framework for environmental education. Connect. UNESCO-UNEP Environ. Educ. Newsl. 1976, 1, 1–9. [Google Scholar]
  2. UNESCO-UNEP. The Tbilisi Declaration: Final report intergovernmental conference on environmental education. In Proceedings of the Intergovernmental Conference on Environmental Education, Tbilisi, USSR, 14–26 October 1977. [Google Scholar]
  3. Venkataraman, B. Education for Sustainable Development. Environ. Sci. Policy Sustain. Dev. 2009, 51, 8–10. [Google Scholar] [CrossRef]
  4. Burton, I. Our common future: The world commission on environment and development. Environ. Sci. Pol. Sustain. Dev. 1987, 29, 25–29. [Google Scholar] [CrossRef]
  5. Didham, R.J.; Ofei-Manu, P. Advancing policy to achieve quality education for sustainable development. In Issues and trends in Education for Sustainable Development; Leicht, A., Heiss, J., Byun and, W.J., Eds.; United Nations Educational, Scientific and Cultural Organization: Paris, France, 2018. [Google Scholar]
  6. Jickling, B.; Wals, A.E.J. Globalization and environmental education: Looking beyond sustainable development. J. Curric. Stud. 2008, 40, 1–21. [Google Scholar] [CrossRef]
  7. Loughland, T.; Reid, A.; Walker, K.; Petocz, P. Factors Influencing Young People’s Conceptions of Environment. Environ. Educ. Res. 2003, 9, 3–19. [Google Scholar] [CrossRef]
  8. Stevenson, R.B. Tensions and transitions in policy discourse: Recontextualizing a decontextualized EE/ESD debate. Environ. Educ. Res. 2006, 12, 277–290. [Google Scholar] [CrossRef]
  9. Madeira, A.C.; Carravilla, M.A.; Oliveira, J.F.; Costa, C.A.V. A Methodology for Sustainability Evaluation and Reporting in Higher Education Institutions. High. Educ. Policy 2011, 24, 459–479. [Google Scholar] [CrossRef]
  10. Nejati, M.; Nejati, M. Assessment of sustainable university factors from the perspective of university students. J. Clean. Prod. 2013, 48, 101–107. [Google Scholar] [CrossRef]
  11. Yuan, X.; Zuo, J. A critical assessment of the Higher Education for Sustainable Development from students’ perspectives – a Chinese study. J. Clean. Prod. 2013, 48, 108–115. [Google Scholar] [CrossRef]
  12. Shriberg, M.P. Sustainability in US higher education: Organizational factors influencing campus environmental performance and leadership. Ph.D. Thesis, University of Michigan, Ann Arbor, MI, USA, 2002. [Google Scholar]
  13. Ferrer-Balas, D.; Lozano, R.; Huisingh, D.; Buckland, H.; Ysern, P.; Zilahy, G. Going beyond the rhetoric: System-wide changes in universities for sustainable societies. J. Clean. Prod. 2010, 18, 607–610. [Google Scholar] [CrossRef]
  14. Conferencia Mundial sobre la Educación Superior, Declaración mundial sobre la educación superior en el siglo XXI. 1998. Available online: http://www.unesco.org/education/educprog/wche/declaration_spa.htm (accessed on 15 October 2019). (In Spanish).
  15. MEN - Ministerio de Educación Nacional de Colombia. Ley 30 de 1992. 1992. Available online: https://www.mineducacion.gov.co/1621/article-86437.html (accessed on 15 October 2019). (In Spanish)
  16. Sistema Universitario Estatal (SUE). Desfinanciamiento de la educación superior en Colombia, la realidad de la crisis en el sistema de financiación de las Universidades Estatales. Diciembre de 2012. 2012. Available online: https://www.mineducacion.gov.co/1621/articles-341914_archivo_pdf.pdf (accessed on 15 October 2019). (In Spanish)
  17. Centro Interuniversitario de Desarrollo (CINDA). Educación Superior en Iberoamérica Informe 2011. 2011. Available online: https://cinda.cl/publicacion/educacion-superior-en-iberoamerica-informe-2011/ (accessed on 15 October 2019). (In Spanish).
  18. Presidencia de la República de Colombia. Decreto 1279 de 2002. Available online: https://www.mineducacion.gov.co/1621/articles-86434_Archivo_pdf.pdf (accessed on 15 October 2019). (In Spanish)
  19. Centro Interuniversitario de Desarrollo (CINDA). Educación Superior en Iberoamérica Informe 2016. 2016. Available online: https://cinda.cl/publicacion/educacion-superior-en-iberoamerica-informe-2016/ (accessed on 15 October 2019). (In Spanish).
  20. MEN - Ministerio de Educación Nacional de Colombia. Propuesta metodológica para la distribución de recursos artículo 87 de la ley 30 de 1992. Vigencia 2015. 2015. Available online: https://www.mineducacion.gov.co/sistemasdeinformacion/1735/articles-358363_recurso_1.pdf (accessed on 15 October 2019). (In Spanish)
  21. Escofier, B.; Pagès, J. Análisis Factoriales Simples y Múltiples Objetivos, Métodos e Interpretación; Servicio Editorial de la Universidad del País Vasco: Bilbao, España, 1992. (In Spanish) [Google Scholar]
  22. Tangarife, M.P.O.; Arias, N.R.; Grosso, G.S. Técnicas de análisis multivariado, modelamiento factorial múltiple y PLS-PATH para estudio y clasificación de tipos de mieles venezolanas de los estados de Lara y Yaracuy. Cienc. EN Desarro. 2017, 8, 129–143. (In Spanish) [Google Scholar] [CrossRef] [Green Version]
  23. Pagès, J. Multiple Factor Analysis: Main Features and Application to Sensory Data. Revista Colombiana de Estadística 2004, 27, 1–26. [Google Scholar]
  24. Fernández, K.; Landaluce, M.I.; Modroño, J. Nuevo procedimiento metodológico para el análisis exploratorio de una tabla estructurada en diversos conjuntos de individuos. Estadística Española 2013, 55, 305–322. (In Spanish) [Google Scholar]
  25. Scholz, M.B.D.S.; Kitzberger, C.S.G.; Prudencio, S.H.; Silva, R.S.D.S.F.D. The typicity of coffees from different terroirs determined by groups of physico-chemical and sensory variables and multiple factor analysis. Food Res. Int. 2018, 114, 72–80. [Google Scholar] [CrossRef]
  26. Næs, T.; Berget, I.; Liland, K.H.; Ares, G.; Varela, P. Estimating and interpreting more than two consensus components in projective mapping: INDSCAL vs. multiple factor analysis (MFA). Food Qual. Prefer. 2017, 58, 45–60. [Google Scholar] [CrossRef]
  27. Tomic, O.; Berget, I.; Næs, T. A comparison of generalised procrustes analysis and multiple factor analysis for projective mapping data. Food Qual. Prefer. 2015, 43, 34–46. [Google Scholar] [CrossRef]
  28. Vitelleschi, M.S.; Chavasa, V. Análisis factorial múltiple para la caracterización de variedades de trigo pan en diferentes ambientes. Revista FABICIB 2015, 19, 113–120. (In Spanish) [Google Scholar] [CrossRef]
  29. Carrasco, S.; Arredondo, J. Aportación del AFM al análisis de las políticas públicas. Una visión de américa latina y el caribe, 1990–2002. Estudios Económicos de Desarrollo Internacional 2006, 6, 2. (In Spanish) [Google Scholar]
  30. Altuzarra, A.; Esteban, M. Identificación de submercados de vivienda en España. Revista de Métodos Cuantitativos para la Economía y la Empresa 2010, 10, 19–42. (In Spanish) [Google Scholar]
  31. Bécue-Bertaut, M.; Pagès, J. Multiple factor analysis and clustering of a mixture of quantitative, categorical and frequency data. Comput. Stat. Data Anal. 2008, 52, 3255–3268. [Google Scholar] [CrossRef]
  32. Zárraga, A.; Goitisolo, B. Simultaneous analysis and multiple factor analysis for contingency tables: Two methods for the joint study of contingency tables. Comput. Stat. Data Anal. 2009, 53, 3171–3182. [Google Scholar] [CrossRef]
  33. Pagès, J. Collection and analysis of perceived product inter-distances using multiple factor analysis: Application to the study of 10 white wines from the Loire Valley. Food Qual. Prefer. 2005, 16, 642–649. [Google Scholar] [CrossRef]
  34. Stanimirova, I.; Walczak, B.; Massart, D. Multiple factor analysis in environmental chemistry. Anal. Chim. Acta 2005, 545, 1–12. [Google Scholar] [CrossRef]
  35. Escofier, B.; Pagès, J. Multiple factor analysis (AFMULT package). Comput. Stat. Data Anal. 1994, 18, 121–140. [Google Scholar] [CrossRef]
  36. Pagès, J. Multiple Factor Analysis by Example Using R; Chapman and Hall/CRC: Boca Raton, FL, USA, 2015. [Google Scholar]
  37. Robert, P.; Escoufier, Y. A unifying tool for linear multivariate statistical methods: The RV-coefficient. Appl. Stat. 1976, 25, 257–265. [Google Scholar] [CrossRef]
  38. Lê, S.; Worch, T. Analyzing Sensory Data with R; Chapman and Hall/CRC: Boca Raton, FL, USA, 2014. [Google Scholar]
  39. Josse, J.; Holmes, S. Measuring multivariate association and beyond. Stat. Surv. 2016, 10, 132–167. [Google Scholar] [CrossRef] [PubMed]
  40. García, I.; Gil, C.; Pascual, P.; Rapún, M. Una propuesta metodológica para la ordenación de las infraestructuras regionales. Rev. Estudios Regionales 1998, 51, 145–170. (In Spanish) [Google Scholar]
  41. García, I.; Abascal, E. A methodology for measuring latent variables based on multiple factor analysis. Comput. Stat. Data Anal. 2004, 45, 505–517. [Google Scholar] [CrossRef]
  42. Calsamiglia, X. La financiación de las Comunidades Autónomas y el principio de solidaridad. De Economía Pública 1990, 6, 3–43. (In Spanish) [Google Scholar]
  43. Al Asbahi, A.A.M.H.; Gang, F.Z.; Iqbal, W.; Abass, Q.; Mohsin, M.; Iram, R. Novel approach of Principal Component Analysis method to assess the national energy performance via Energy Trilemma Index. Energy Rep. 2019, 5, 704–713. [Google Scholar] [CrossRef]
  44. Onat, N.C.; Kucukvar, M.; Afshar, S. Eco-efficiency of electric vehicles in the United States: A life cycle assessment based principal component analysis. J. Clean. Prod. 2019, 212, 515–526. [Google Scholar] [CrossRef]
  45. Du, X.; Chen, S. The Application of Factor Analysis Method in Performance Evaluation of Listed Banking Business. In Proceedings of the 2015 International Conference on Education, Management, Information and Medicine, Shenyang, China, 24–26 April 2015; Atlantis Press: Shenyang, China, 2015. [Google Scholar]
  46. Hornungová, J. Factor Analysis: An Instrument for Selection of Social Performance Factors//Análisis factorial: Un instrumento de selección de factores sociales de rendimiento. Revista de Métodos Cuantitativos Para la Economía y la Empresa 2014, 17, 121–136. [Google Scholar]
  47. Tam, V.W.Y.; Tam, C.M.; Yiu, K.T.W.; Cheung, S.O. Critical factors for environmental performance assessment (EPA) in the Hong Kong construction industry. Constr. Manag. Econ. 2006, 24, 1113–1123. [Google Scholar] [CrossRef] [Green Version]
  48. MEN - Ministerio de Educación Nacional de Colombia. Propuesta metodológica para la distribución de recursos artículo 87 de la ley 30 de 1992. Vigencia 2013. 2013. Available online: https://www.mineducacion.gov.co/sistemasdeinformacion/1735/articles-212353_modelo1.pdf (accessed on 15 October 2019). (In Spanish)
  49. MEN - Ministerio de Educación Nacional de Colombia. Propuesta metodológica para la distribución de recursos artículo 87 de la ley 30 de 1992. Vigencia 2018. 2018. Available online: https://www.mineducacion.gov.co/sistemasdeinformacion/1735/articles-354032_recurso_8.pdf (accessed on 15 October 2019). (In Spanish)
  50. Husson, F.; Josse, J.; Le, S.; Mazet, J. FactoMineR: Multivariate exploratory data analysis and data mining with R. R Package Version 2013, 1, 29. [Google Scholar]
  51. Kassambara, A.; Mundt, F. Factoextra: Extract and Visualize the Results of Multivariate Data Analyses. R Package Version 2017, 1, 5. [Google Scholar]
Figure 1. Distribution of the groups of variables in the factor axes 1 and 2.
Sustainability 12 00924 g001
Figure 2. Distribution of the groups of variables in the factor axes 1 and 3.
Sustainability 12 00924 g002
Figure 3. Reflection of the variables.
Sustainability 12 00924 g003
Figure 4. Reflection of the Higher Education Institutions (HEI) in the factorial plane (1, 2).
Sustainability 12 00924 g004
Figure 5. Reflection of the HEI in the factorial plane (1, 3).
Sustainability 12 00924 g005
Figure 6. Partial individuals graph dimensions 1 and 2.
Sustainability 12 00924 g006
Figure 7. Partial individuals graph dimensions 1 and 3.
Sustainability 12 00924 g007
Figure 8. Reflection of the HEI with their categories (HEI which display low-performance rates).
Sustainability 12 00924 g008
Figure 9. Graph of the partial axes.
Sustainability 12 00924 g009
Table 1. Variables used in the Multiple Factorial Analysis (MFA), 2018.
DimensionIndicator
Resources
IR
IR1 – Expenditure in Administration Personnel
IR2 – Total Investment
IR3 – Full-Time Equivalent Teaching Staff
Quality
IC
IC1 – Mean results in the Quantitative Reasoning module in Saber Pro
IC2 – Mean results in the Critical Reading module in Saber Pro
IC3 – Proportion of teaching staff with Masters TCE
IC4 – Proportion of DTCE with PhD
IC5 – Number of accredited programmes over the total accreditable programmes offered by the University
Achievement
IL
IL1 – Undergraduate Graduation rate
IL2 – Weighted number of researchers
IL3 – Weighted number of research groups
IL4 –Number of articles published (weighted) over the number of full-time teaching staff
Access
IA
IA2 – Postgraduate enrollment (weighted)
IA3 – Retention rate
IA4 – Contribution to municipalities with low coverage (undergraduate enrollment weighted according to municipality)
AccreditationIC6 – Institutional Accreditation of High Quality (Dummy variable )
Table 2. Results of the Principal Components Analysis for each group of variables.
QualityAccess
FactorIntrinsic ValueVariability(%)% AccumulatedIntrinsic ValueVariability(%)% Accumulated
13.104462.0962.091.750858.3658.36
21.052221.0483.131.024834.1692.52
30.540410.8193.940.22447.48100.00
AchievementResources
FactorIntrinsic ValueVariability (%)% AccumulatedIntrinsic ValueVariability (%)% Accumulated
12.714467.8667.862.564285.4885.48
20.963824.1091.960.390613.0298.50
30.31487.8799.830.04511.50100.00
Table 3. Intrinsic Values and explained variability MFA.
FactorIntrinsic ValueVariability (%)% Accumulated
F13.10852.08852.088
F21.11218.63570.723
F30.5949.95680.679
Table 4. Correlations of groups of variables and factors.
F1F2F3
Quality0.7990.5590.642
Access0.9220.8410.486
Achievement0.9640.5900.306
Resources0.9580.2700.298
Table 5. Coordinates of the groups on the factors (accumulated inertia).
F1F2F3
Quality0.5790.2850.312
Access0.6880.6450.189
Achievement0.9240.1390.038
Resources0.9160.0430.055
Accreditation0.2820.0950.134
Table 6. Asociation of the groups of variables with the MFA factors.
GroupContributions (%)Cosines-Squared
F1F2F3F1F2F3
Quality18.63825.65752.5650.2910.0710.085
Access22.14857.97031.8630.3490.3060.026
Achievement29.73212.5366.3570.7500.0170.001
Resources29.4823.8379.2150.8210.0020.003
Table 7. Lg coefficients of the MFA.
QualityAccreditationAccessAchievementResources
Quality1.153
Accreditation0.4961.000
Access0.3120.1681.359
Achievement0.5520.2890.6061.140
Resources0.3620.1270.7270.8421.024
MFA0.7650.3470.9661.0100.951
Table 8. RV Coefficients of the MFA.
QualityAccreditationAccessAchievementResources
Quality1.000
Accreditation0.4621.000
Access0.2490.1441.000
Achievement0.4820.2700.4871.000
Resources0.3330.1260.6160.7801.000
MFA0.6540.3190.7610.8680.862
Table 9. Factor loadings of the variables with the MFA. (Factor Loadings/Correlation between the variables and the factors).
VariableF1F2F3
IC1-Quantitave Reasoning0.7290.3750.289
IC2-Critical Reading0.7330.4230.374
IC3- Prop.T.Staff w/ Master’s0.0840.4540.734
IC4- Prop.T.Staff w/Phd0.7710.126−0.021
IC5-Prop.Prog.Acred0.3590.5860.455
IA2-Enr.Postg.Weighted0.953−0.132−0.016
IA3-Retention0.1380.758−0.510
IA4-Enr.Und.Weighted.0.528−0.7330.266
IL1-Rate.Grad.Und.0.1550.5810.197
IL2-No.Weighted.Res.0.966−0.018−0.180
IL3-No.Weighted.Group.Res.0.976−0.017−0.162
IL4-No.Art.Pub./DTC0.7740.1990.070
IR1-Costs.Admin0.928−0.031−0.276
IR2-Investment0.887−0.083−0.244
IR3-DTCE0.838−0.3190.065
Table 10. Scores from the first four factors of the MFA.
HEIF1F2F3F4
UNAL7.9998−0.1983−1.44990.8322
Pedagógica−0.11641.65341.33170.8429
UPTC0.5740−0.06630.1585−0.2759
Cauca0.13690.3566−0.1632−0.7162
Pereira0.35460.32270.5125−0.5636
Caldas0.00970.73630.40280.2941
Córdoba−0.6700−0.43690.8127−0.0206
Surcolombiana−0.34560.98730.43830.4237
Amazonia−1.10880.5044−0.15350.0656
Militar−0.0990−0.68831.34760.9622
Chocó−1.7398−0.7948−1.42430.5779
Llanos−0.81281.00920.0470−0.3215
Cesar−1.0770−1.0183−0.74260.0673
Mayor de Cundinamarca−0.80871.41780.62301.1995
Pacifico−1.8912−0.8308−1.03220.1709
UDEA3.1606−0.41670.3508−0.4013
Atlántico0.31120.0244−0.0508−0.7995
Valle2.01080.01550.0452−0.6276
UIS1.20160.87310.2926−0.4679
Cartagena0.19090.56470.31670.3247
Nariño−0.14360.6486−0.0245−1.0987
Tolima−0.46680.1891−0.09080.1065
Quindío−0.71300.26000.12820.0619
UFPS-Cúcuta−0.83710.2459−0.4194−0.7008
UFPS-Ocaña1.4894−0.0489−0.93270.4225
Pamplona−0.5990−1.0694−0.49230.6168
Magdalena−0.5966−0.0641−0.01570.1218
Cundinamarca−1.0284−0.1807−0.62830.0048
Sucre−0.88520.9698−0.6084−0.1927
Guajira−1.3558−1.0163−1.2719−0.1852
Distrital0.61860.47060.9599−0.6353
UNAD0.2154−4.41991.7325−0.0887
Table 11. Transformed scores of the first 4 factors of the MFA and the Index of Performance (IAFM).
HEI f ( F 1 ) f ( F 2 ) f ( F 3 ) f ( F 4 ) Weighted Sum
( I A F M )  
UNAL99.98341.59812.61378.46465.074
Pedagógica45.06290.52686.93178.69152.995
UPTC72.11947.32657.75638.56354.094
Cauca56.83265.34643.04825.18747.345
Pereira65.27764.15370.35029.17454.443
Caldas50.97876.29666.91163.11350.640
Córdoba26.32932.98078.03949.49230.145
Surcolombiana36.03781.55768.06667.59844.181
Amazonia17.33270.10843.45853.64229.145
Militar45.83525.87087.13781.08841.492
Chocó9.69023.35712.91472.22714.356
Llanos22.95881.95752.77236.89134.360
Cesar17.86018.88024.55653.72117.996
Mayor de Cundinamarca23.05088.00973.45285.08340.044
Pacífico8.46922.56818.63358.27813.434
UDEA97.90133.63165.14734.13865.483
Atlántico63.73951.69548.05023.25448.799
Valle93.37351.26352.68727.42664.828
UIS85.11579.32763.05832.00367.021
Cartagena59.10171.85763.93764.22553.804
Nariño43.87774.12449.30017.49942.465
Tolima32.03759.03146.20255.49935.108
Quindío25.26361.83456.45853.47233.020
UFPS-Cúcuta22.43261.29233.54325.56227.745
UFPS-Ocaña88.83748.13720.47867.55960.716
Pamplona28.19317.98931.25773.28624.873
Magdalena28.25947.42649.73156.17531.364
Cundinamarca18.70142.31727.40950.73822.934
Sucre21.42681.23227.93841.82631.205
Guajira13.75818.91514.87542.13114.313
Distrital73.33569.08281.04627.22360.524
UNAD60.0941.59691.24646.30043.037
Table 12. Ranking of the HEI in accordance with the IAFM and the percentage of resources from Art. 87 Law 30 1992. corresponding to each HEI.
RankHEIIAFMPercentage of Resources Art. 87 Law 30 1992
1UIS67.0215.248%
2UDEA65.4835.128%
3UNAL65.0745.096%
4Valle64.8285.076%
5Distrital60.5244.739%
6Pereira54.4434.263%
7UPTC54.0944.236%
8Cartagena53.8044.213%
9Pedagógica52.9954.150%
10Caldas50.6403.965%
11Atlántico48.7993.821%
12Cauca47.3453.707%
13Surcolombiana44.1813.460%
14UNAD43.0373.370%
15Nariño42.4653.325%
16Militar41.4913.249%
17Mayor de Cundinamarca40.0443.136%
18Tolima35.1082.749%
19Llanos34.3592.691%
20Quindío33.0202.586%
21Magdalena31.3632.456%
22Sucre31.2042.444%
23Córdoba30.1452.361%
24Amazonía29.1452.282%
25UFPS- Cúcuta27.7442.173%
26Pamplona24.8731.948%
27Cundinamarca22.9341.796%
28UFPS- Ocaña20.7781.627%
29Cesar17.9961.409%
30Chocó14.3561.124%
31Guajira14.3131.121%
32Pacífico13.4331.052%
SUM1277.046100%

