Article

Quantifying the Relative Importance of Climate Change and Human Activities on Selected Wetland Ecosystems in China

1
Key Laboratory of Geographical Processes and Ecological Security in Changbai Mountains, Ministry of Education, School of Geographical Sciences, Northeast Normal University, Changchun 130024, China
2
School of Natural Resources, University of Missouri, Columbia, MO 65211, USA
3
School of Tourism and Geography Science, Jilin Normal University, Siping 136000, China
*
Author to whom correspondence should be addressed.
Sustainability 2020, 12(3), 912; https://doi.org/10.3390/su12030912
Submission received: 20 December 2019 / Revised: 11 January 2020 / Accepted: 21 January 2020 / Published: 26 January 2020

Abstract

:
Climate change and human activities are important factors driving changes in wetland ecosystems. It is therefore crucial to quantitatively characterize the relative importance of these stressors in wetlands. Previous such analyses have generally not distinguished between wetland types, or have focused on individual wetland types. In this study, three representative wetland areas of the upper, middle and lower reaches of the Heilongjiang River Basin (HRB) were selected as the study area. An object-based classification was used with Landsat TM data to extract the spatial distribution of wetland in 1990, 2000 and 2010. We then quantified the relative importance of climate change and human activities on the wetlands by using the R package “relaimpo” package. The results indicated that: (1) the effects of human activities on wetland changes were greater (contribution rate of 63.57%) than climate change in the HRB. Specifically, there were differences in the relative importance of climate change and human activities for wetlands in different regions. Wetlands of the upper reaches were more affected by climate change, while wetlands in the middle and lower reaches were more affected by human activities; (2) climate change had a greater impact (contribution rate of 65.72%) on low intensity wetland loss, while human activities had a greater impact on moderate and severe intensity wetland loss, with respective contribution rates of 57.22% and 70.35%; (3) climate change had a larger effect on the shrub and forested wetland changes, with respective contribution rates of 58.33% and 52.58%. However, human activities had a larger effect on herbaceous wetland changes, with a contribution rate of 72.28%. Our study provides a useful framework for wetland assessment and management, and could be a useful tool for developing wetland utilization and protection approaches, particularly in sensitive environments in mid- and high-latitude areas.

1. Introduction

The wetland ecosystems of the mid- and high-latitudes account for about 64% of the naturally occurring wetlands worldwide [1], and play an important role in flood protection, streamflow maintenance, biodiversity and human health [2,3]. However, approximately 87% of global wetlands have been lost since the 18th century [4] and wetland loss has been particularly severe in mid-high latitude regions and continues to be threatened [1]. It has been widely reported that the loss of wetland results in great adverse impacts on the ecosystem’s goods and services, and global wetlands will continue to disappear in the future [4]. Therefore, in order to protect wetlands, it is crucial to quantitatively characterize the relative importance of stressors in wetlands. Many factors have contributed to wetland loss and degradation, such as climate change [5], human activities [6], hydrological processes [7] and fire [8], with climate change and human activities being the largest contributors [1]. Climate change has affected wetlands’ hydrological processes by altering the ratio of precipitation and evapotranspiration [9], as well as indirectly affected wetlands through changes to wetland vegetation [10] and the biogeochemical cycle [11,12]. Human activities have led to the direct loss of wetlands through agriculture [13], urbanization [6,14,15] and grazing [16]. Wetland ecosystems of the mid-high latitudes are exceptionally vulnerable to such climatic and anthropogenic changes [1].
The relative role of climate change and human activities on alterations to wetland ecosystems varies regionally. A previous study indicated that wetland change was mainly controlled by precipitation and the underlying surface composition of the Amazon River Basin, and that climate change was the primary factor behind the processes [17]. In another study that used grey correlation analysis, the impact of climate change was greater than that of human activities on urban wetlands of the Beijing area [18]. However, the relative effects of climate change and human activities on wetlands in the middle reaches of HRB were similar, with climate change impacts being slightly higher than human activities in a study that used a random forest to analyze the relative importance of the factors [1]. In addition, by using the trajectory analysis method in the Sanjiang and Songnen Plain, other studies showed that that anthropogenic disturbances could be a more significant driver of wetland change [19,20].
The extent of wetland losses has varied under the effects of climate change and human activities [21,22]. Previous studies showed that almost all wetland areas in the Sanjiang Plain suffered from different degrees of loss from 2000 to 2015 [21]. Mild wetland losses were primarily distributed in the central portions of the plain, while severe losses were generally distributed in the northeast [21]. In Northeastern China, severe wetland losses were located mainly in Liaohe River Delta and the Sanjiang Plain, while mild losses were mainly distributed in the Greater Khingan Mountains [22]. Overall, wetlands across many provinces in China suffered from varying degrees of loss, with Heilongjiang Province exhibiting the greatest degree of loss during the period 1978–2008 [23]. However, there are few previous studies that have attributed wetland loss to either climate change or human activities, particularly in the sensitive ecosystems of mid- and high-latitude areas. Additionally, previous studies did not use approaches that distinguished wetland types, or only selected one type to analyze the relative impacts of climatic changes and human activities [19,21,24,25]. For example, one study that quantified the relative impacts of climate change and human activities on wetland landscape patterns in the middle reaches of the Heihe River Basin regarded marshes, lakes, bottomlands, rivers, reservoirs and ponds as individual wetland classes. Results from that study indicated that human activities were the driving factor of wetland ecosystem fragmentation in the study area [24]. Other studies have used approaches that focus solely on marsh wetland types to quantify the relative importance of the stressors, and study results have shown that anthropogenic factors played a greater role on changes in these areas [19,20,25]. However, the relative importance of climatic changes and human activities on different wetland types may vary. Therefore, it is important to develop approaches that better enable the impacts of climate change and human activities on various wetland types to be quantitatively assessed.
The Heilongjiang River Basin (HRB) is located in the mid-high latitudes, which comprises a large area of herbaceous, shrub and forest wetland [26]. This region was affected by climate change and human activities significantly. In the last 30 years, the degree of warming in this region was 1.2 to 2.3 times higher than global average [27]. Meanwhile, human activities have caused a great disturbance to wetland in the HRB, such as large-scale conversion to agricultural land use [21]. Therefore, the HRB was an ideal area to use to quantify the relative importance of climate change and human activities on wetland change. In conclusion, the purpose of this study is to quantify the relative importance of climate change and human activities: (1) on the wetland change in the HRB as a whole; (2) on wetland with different loss degrees (mild, moderate and severe wetland losses); (3) on the different wetland types (herbaceous, shrub, and forested wetlands). The results of this study would help us to further understand the relative importance of the driving factors of wetland change, and provide a basis for wetland scientific management.

2. Materials and Methods
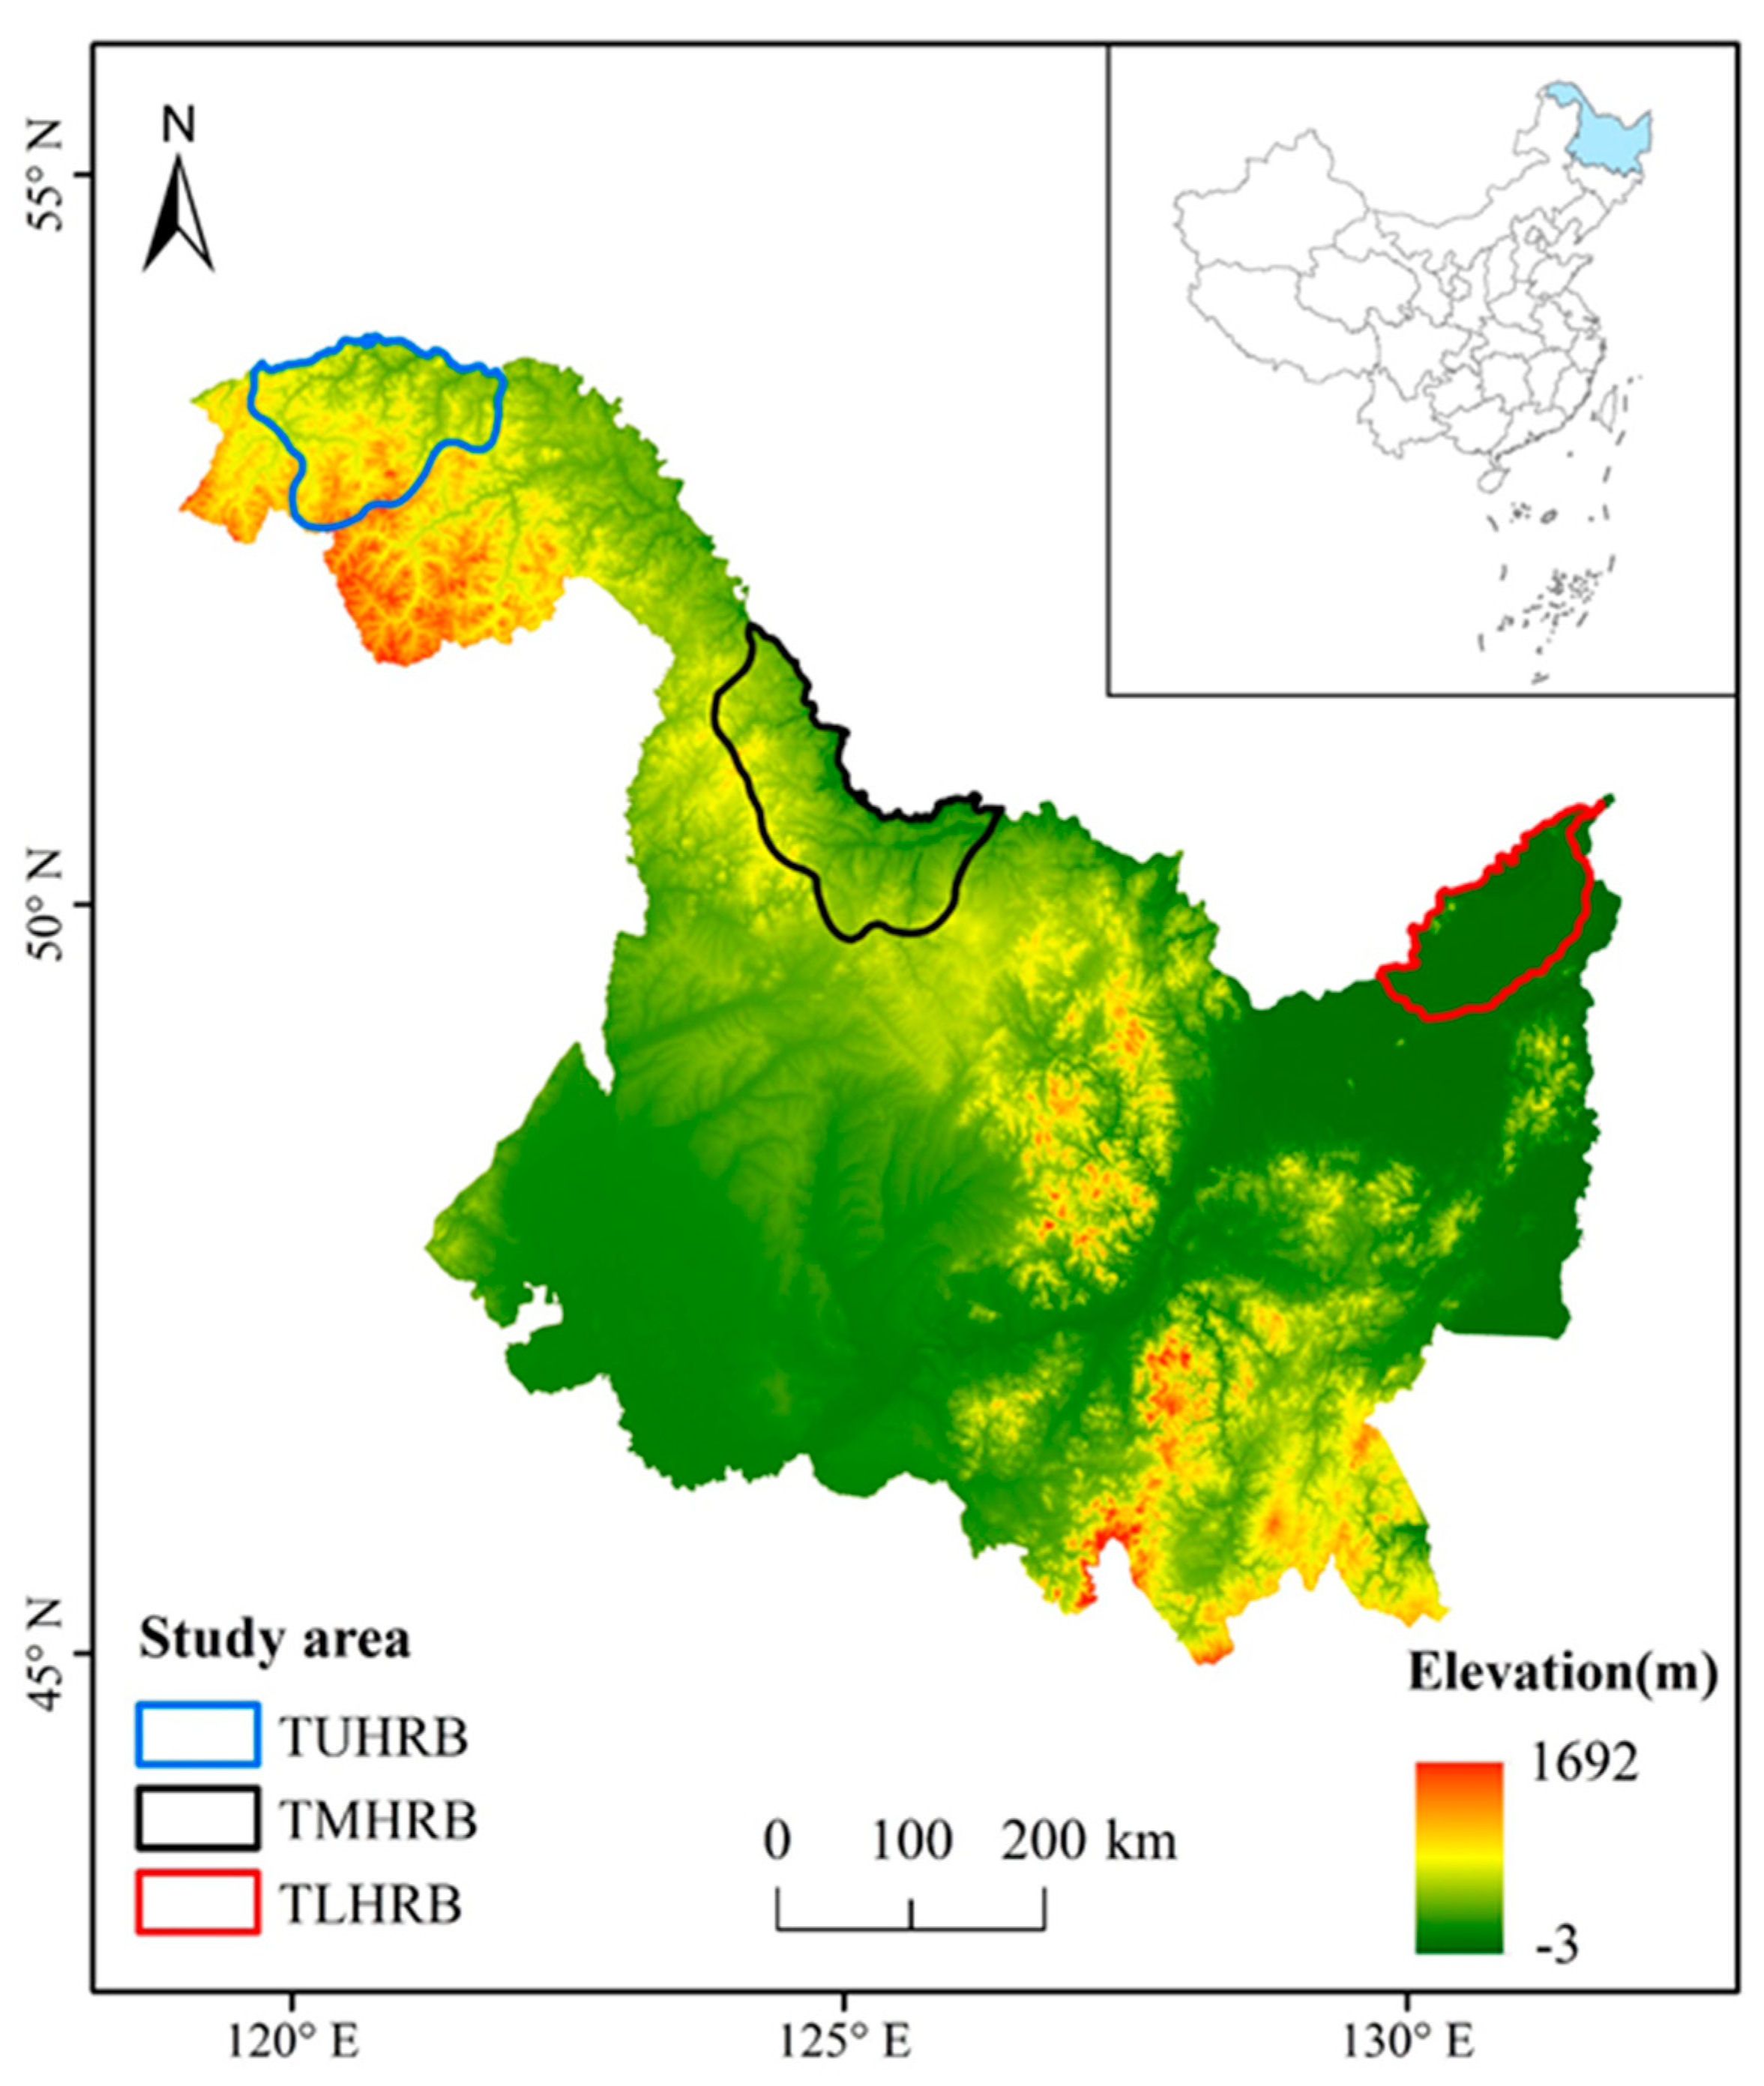
2.1. Study Areas

The study area was located in HRB of China (Figure 1); for this study we chose three representative areas in the upper, middle and lower reaches of the basin to be analyzed. The typical area in the Upper reaches of Heilongjiang River Basin (TUHRB) extends from 122°8′ to 124°51′ E and 52°18′ to 53°33′ N. It is located within the Greater Khingan Range, and has an area of 16,870 km2 and altitudes ranging from 250 to 1300 m. The typical area in the Middle reaches of the basin (TMHRB), between 126°18′–128°59′ E and 48°49′–51°29′ N, is located mainly in the Lesser Khingan Mountains, encompasses a total area of 20,091 km2, and contains altitudes ranging from 200–800 m. The typical area in the lower reaches of the basin (TLHRB) is located between 132°14′–134°52′ E and 47°29′–51°29′ N, in the Sanjiang Plain, with an area of 12,475 km2, a flat terrain and altitudes of 50–200 m. The climate of the overall study is characterized as humid and semi-humid continental monsoon, with average annual temperature and precipitation ranging between −3.6–4.3 °C and 480–650 mm, respectively. Among them, the TUHRB is relatively cold and dry (annual temperature −3.6–−1.5 °C and annual precipitation 480–540 mm), and the TLHRB is relatively warm and humid (average annual temperature about 2.1–4.3 °C and average annual precipitation 550–650 mm). The annual temperature (0.5–2.3 °C) and precipitation (500–580 mm) in the UMHRB is higher than in the TUHRB and lower than in the TLHRB.

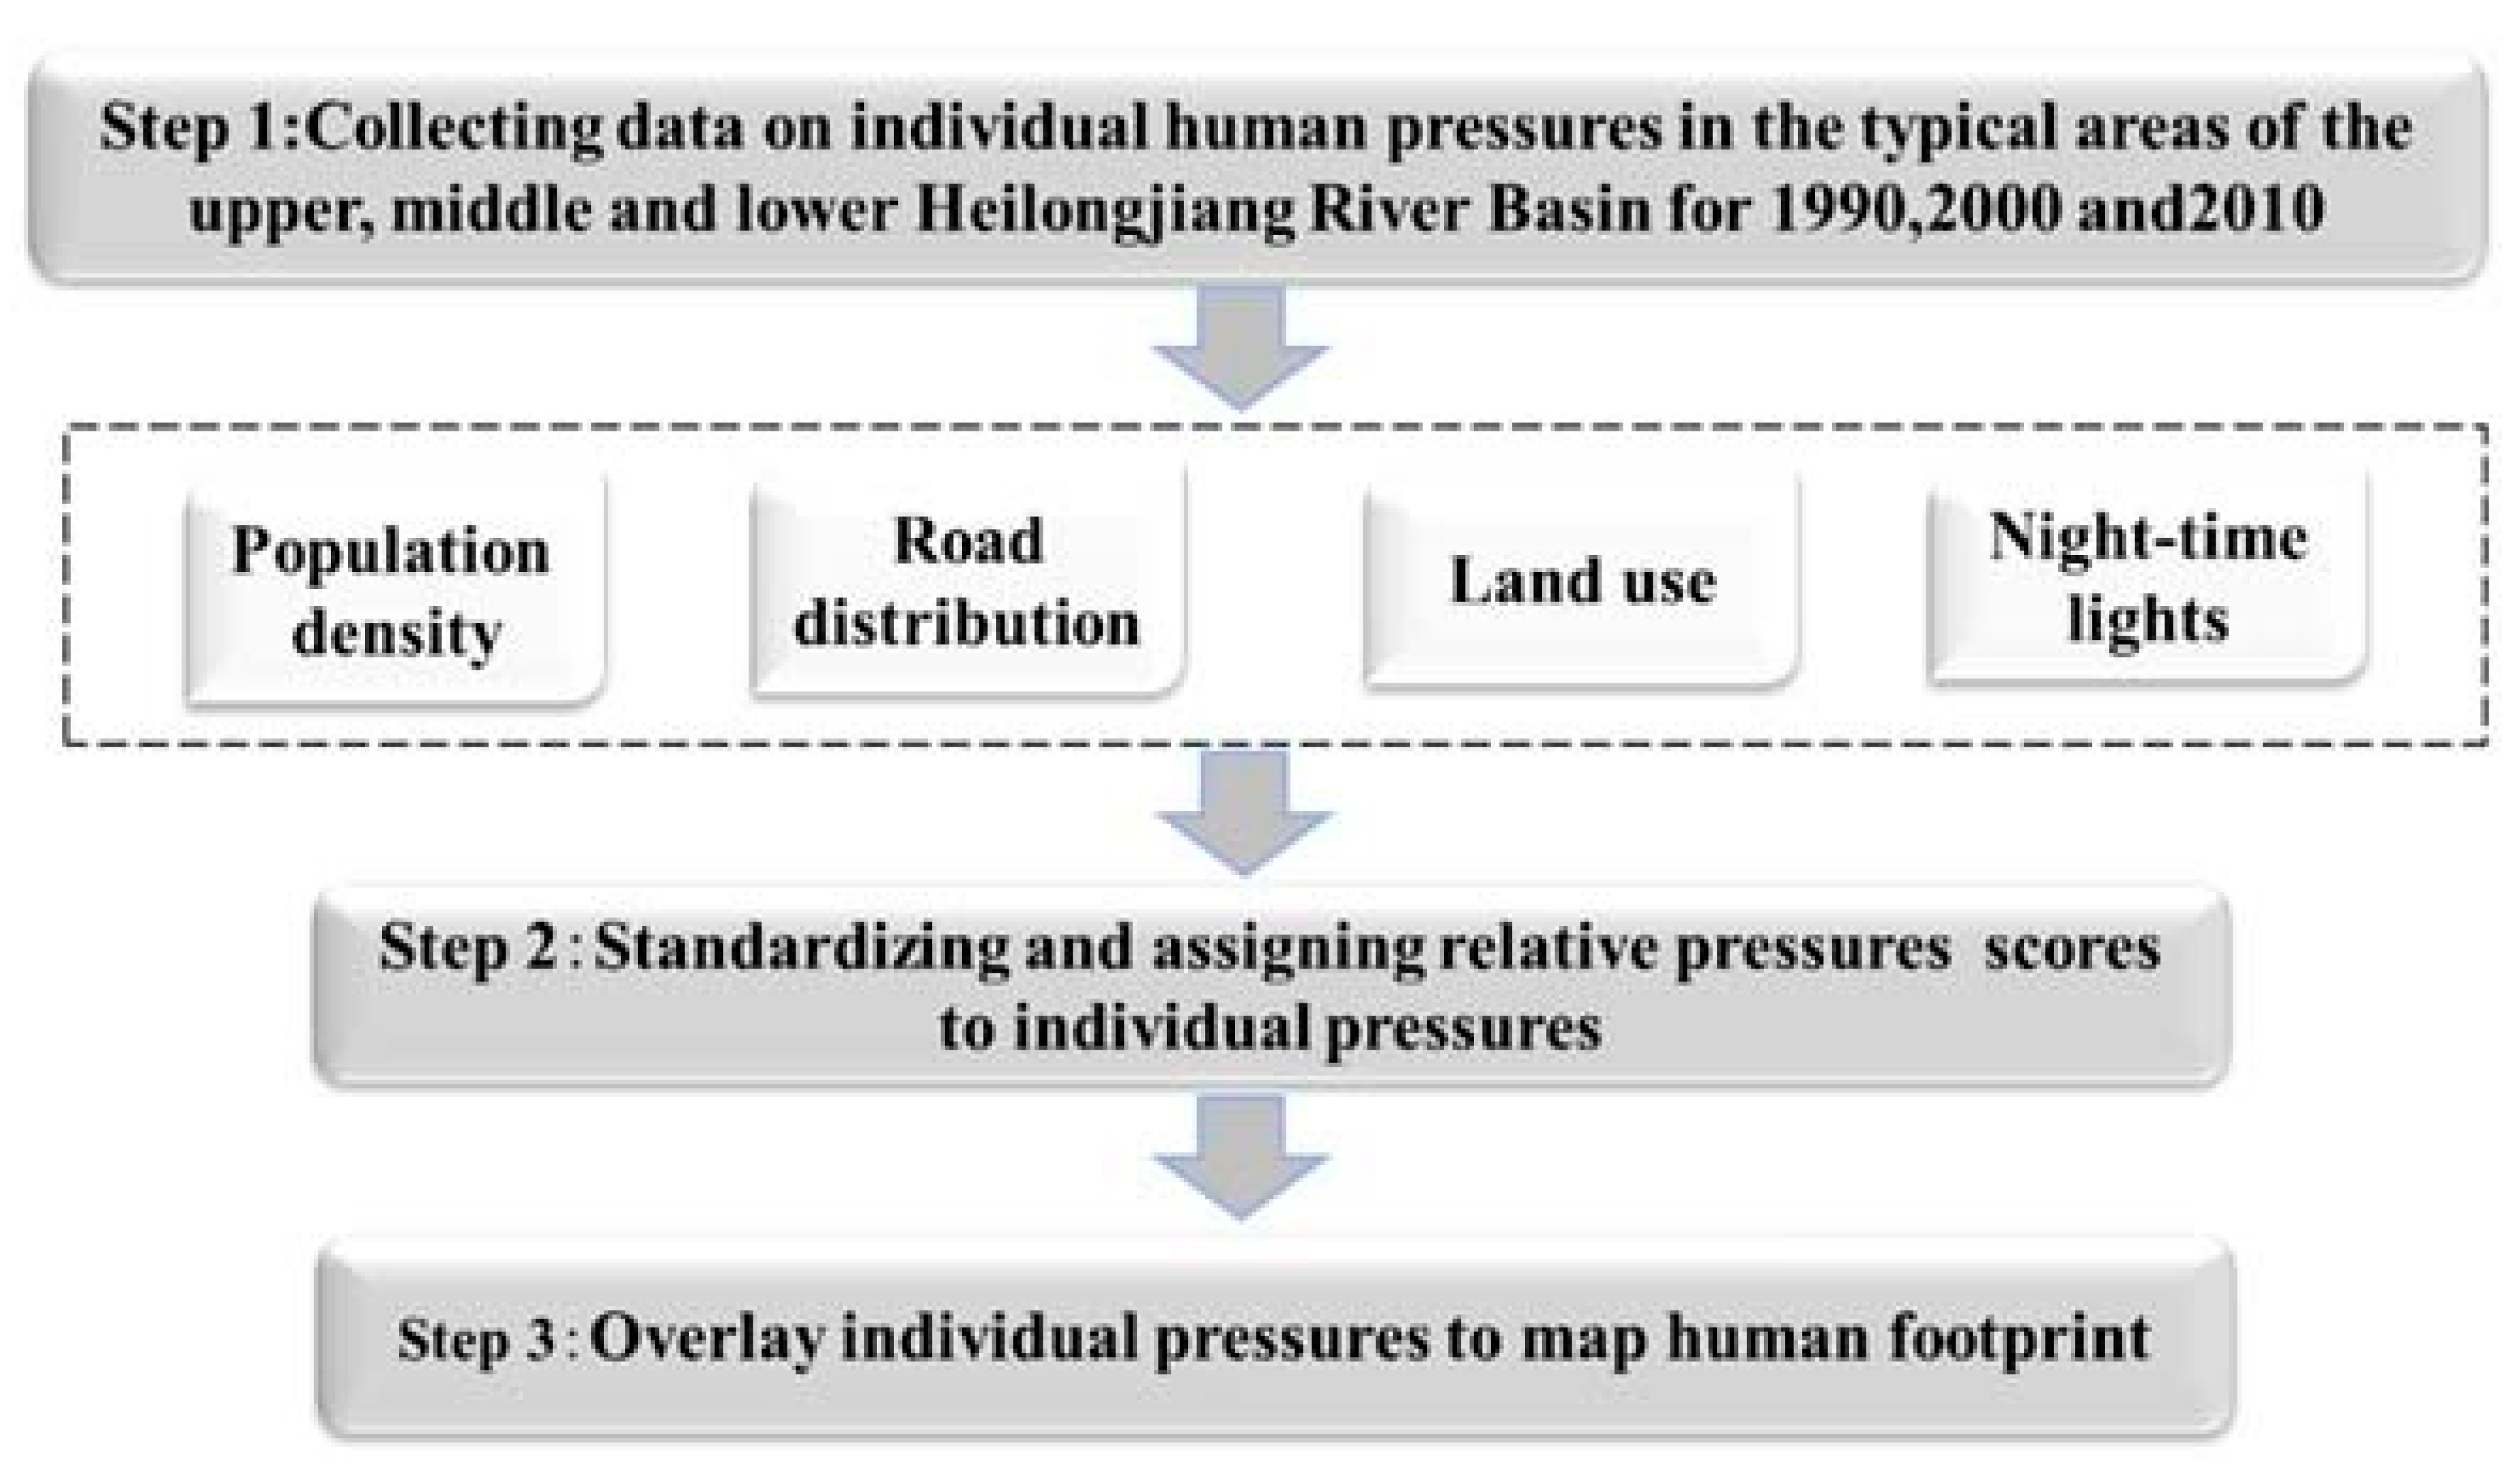
2.2. General Approach

We extracted the spatial distribution of wetlands in typical areas of the upper, middle and lower reaches in the HRB for 1990, 2000 and 2010 by collecting Landsat Thematic Mapper (TM) image data. Landsat TM was from USGS (https://glovis.usgs.gov/). At the same time, we collected four kinds of pressure data of human activities to map the human footprint [28,29] with a 1 km spatial resolution for 1990, 2000 and 2010. In addition, climate datasets were provided from the Resource and Environment Data Cloud Platform (http://www.resdc.cn/data.aspx?DATAID=229). These included the annual temperatures and precipitation of the period 1980–2010 at a spatial resolution of 1 km. In this study (Figure 2): (1) the human footprint was used to represent human activities’ intensity; (2) annual temperature and precipitation were used to represent the climatic variables; and (3) mapped wetland spatial distribution data was used as the wetland variable. The averaging over orderings proposed by the Lindeman, Merenda and Gold (LMG) method in the R package “relaimpo” [30] was then used to estimate the relative importance of climate change and human activities on wetland change in the representative areas of the upper the upper, middle and lower reaches of the HRB.

2.3. Wetland Extraction and Classification

We focused on three types of wetlands, including forested wetlands (mainly dominated by woody plants with distinct trunks (>6 m in height), such as Betula platyphylla, Salix pentandra, Pinus sylvestris var. mongolica), shrub wetlands (mainly dominated by woody plants, usually without distinct trunks (<6 m in height), such as Salix brachypoda, Betula fruticose, Spiraea salicifolia), and herbaceous wetlands (mainly dominated by aquatic herbaceous species, such as Carex lasiocarpa, Calamagrostis angustifolia, Carex appendiculata). Landsat TM was used, along with an object-oriented classification process that used multiple segmentation and classifications, to extract and classify wetlands for 1990, 2000 and 2010. It has been demonstrated that this approach can produce a higher classification accuracy compared with other commonly used methods [31]. In addition, we also generated the Normalized Difference Water Index (NDWI) and obtained a digital elevation model (DEM) to better characterize the distribution of wetlands in the study area [32,33,34]. In order to verify the accuracy of the wetland classification results, we collected high-resolution Google Earth image and field survey data, and compared them to the mapped wetlands. Based on the analysis, the overall accuracy of the wetland classification was 87.92%.

2.4. Loss Rate of Wetlands and Human Footprint Indices

We divided the study areas (TUHRB, TMHRB and TLHRB) into a 1 × 1 km grid to calculate the wetland loss rate in each grid by using the following formula
LR = A a A b A ,
where Aa and Ab represent the respective wetland area of each grid at the beginning and end of the study period, and A represents the area of each grid. The relative importance of climate change and human activities on wetlands with different degrees of loss was explored using the grid level wetland loss rate.
The human footprint, a metric widely used to express the intensity of human activities in an area was used in this study [28,29,35,36,37,38]. Considering the characteristics of the HRB and the availability of the required data, we tailored the input datasets for the study area [28,29], using four types of human pressure indicators (population density, land use, road, and night lights) to map the human footprint of 1990, 2000 and 2010 at a spatial resolution of 1 × 1 km (Figure 3).
The population density datasets (1 × 1 km resolution) for the study areas for the years 1990, 2000, and 2010 were obtained from the Resources and Environmental Data Cloud Platform (http://www.resdc.cn/data.aspx?DATAID=251). Errors for these spatial population density datasets ranged from 4.5–13.6% [39] and population density values ranged from 0–152 inhabitants/km2. The influence scores for population density were then obtained using the global datasets method (Formula 2) [29], and the influence scores were then assigned according to population density in each grid.
Pressure   Scores = 3.333 × log ( population   density + 1 ) ,
The distribution of roads for the study area was obtained from the Center for International Earth Science Information Network [40]. This comprehensive roads dataset contained a compilation of nationally mapped road data spanning the period 1980–2010 and had a spatial error of approximately 0.5 km [40]. The influence scores for roads were assigned by applying the global datasets method [29]. The land use dataset was obtained from the Resources and Environmental Data Cloud Platform (http://www.resdc.cn/data.aspx?DATAID=95), and covered the years of 1990, 2000, and 2010. This dataset contained detailed remotely sensed land use/land cover information for the study area, including seven land use classes and 26 subclasses of land use types. In order to assign human influence scores for each land use type (Table 1), the global datasets method [28] and information from relevant studies [28,41] were used.
The Defense Meteorological Satellite Program Operational Line Scan System [42] (DMSP-OLS) is capable of collecting radiation signals generated by lights from human structures during night. Such night-time light information is useful for monitoring and mapping human activities. These datasets, for the years 1993, 2000, and 2010, were provided by the National Centers for Environmental Information (https://ngdc.noaa.gov/eog/dmsp.html), and cover a spatial resolution of 1 × 1 km. The digital number (i.e., light intensity) from the DMSP-OLS data was taken to represent the intensity of human activities within a given cell. Light intensity values were divided from small to large into 10 equal sample bins (each bin contained the same number values, and all values > 0), and then scores from 1 to 10 were assigned for all binned values, and the values of zero remained unchanged.
The previously described human influence scores were summed in order to assign a range of potential scores to characterize human impacts (Equation (3)), where values ranged from 0 (minimum impact) to 10 (maximum impact).
HF ( i , t ) = Pop ( i , t ) + Land ( i , t ) + Road ( i , t ) + Night ( i , t ) ,
where HF (i, t) was the human footprint cumulative score at grid i in year t, and Pop (i, t), land (i, t), road (i, t) and night (i, t) were the scores for population density, land use, roads, and night light intensity, respectively.

2.5. Derivation of the Relative Importance of Human Activities and Climatic Changes

The R package “relaimpo” [30] was used to estimate the relative importance of human activities and climate change on wetland changes in the three study zones (TUHRB, TMHRB, TLHRB). The “relative importance” in a multiple regression model refers to the quantification of the contribution of a single regression variable to the overall multiple regression model. Normally, the evaluation of relative importance in linear models is not problematic, as long as all regression variables are uncorrelated; the contribution of each variable was the R2 from a single regression, and all single R2 values add up to the overall model R2 [30]. However, climate change may occur in areas where human activities intensity varied significantly, which may lead to a correlation [43]. Fortunately, the LMG method in the “relaimpo” R package enables the relative importance of correlated regression variables in multivariate linear models to be distinguished [30]. The calculation process of this method is relatively complex, but it better distinguishes the relative importance of correlated variables, and it has been widely used [30]. The specific process of this method was as follows
s e q R 2 ( ( M | S ) ) = R 2 ( M S ) R 2 ( S ) ,
s e q R 2 ( { x k } | S k ( r ) ) = R 2 ( { x k } S k ( r ) ) R 2 ( S k ( r ) ) ,
LMG ( x k ) = 1 P j = 0 p 1 ( s { x 1 , , x P } \ { x k } n ( S ) = j s e q R 2 ( { x k } | S ) ( p 1 i ) )
where s e q R 2 ( ( M | S ) ) was the additional R 2 when regressors in set M are added to a model with the regressors in set S, s e q R 2 ( { x k } | S k ( r ) ) was the portion of R 2 allocated to regressor x k in the order r, and LMG ( x k ) represented the contribution of regression variables in the multivariate linear regression model.
In our study, we calculated the loss rate of wetlands at a 1 × 1 km grid; these grids which show the loss rate of wetland can be regarded as “samples”. We extracted climate data (annual temperature and precipitation) and human footprint data from each “sample” by using spatial overlay analysis. These climate data and human footprint data of spatial distribution with 1 km resolution (extracted by “samples”) were regarded as climate variables and human activity variables, respectively. The wetland area data in the “samples” were regarded as the dependent variable. Then, we used the aforementioned LMG method to construct the multivariate linear regression model. This model was then used to quantify the relative importance of human activities and climate change on wetland change within the study area. Additionally, we used a spatial stratified sampling method to calculate the minimum distance between sample points in order to minimize the influences of spatial autocorrelation [44].

3. Results

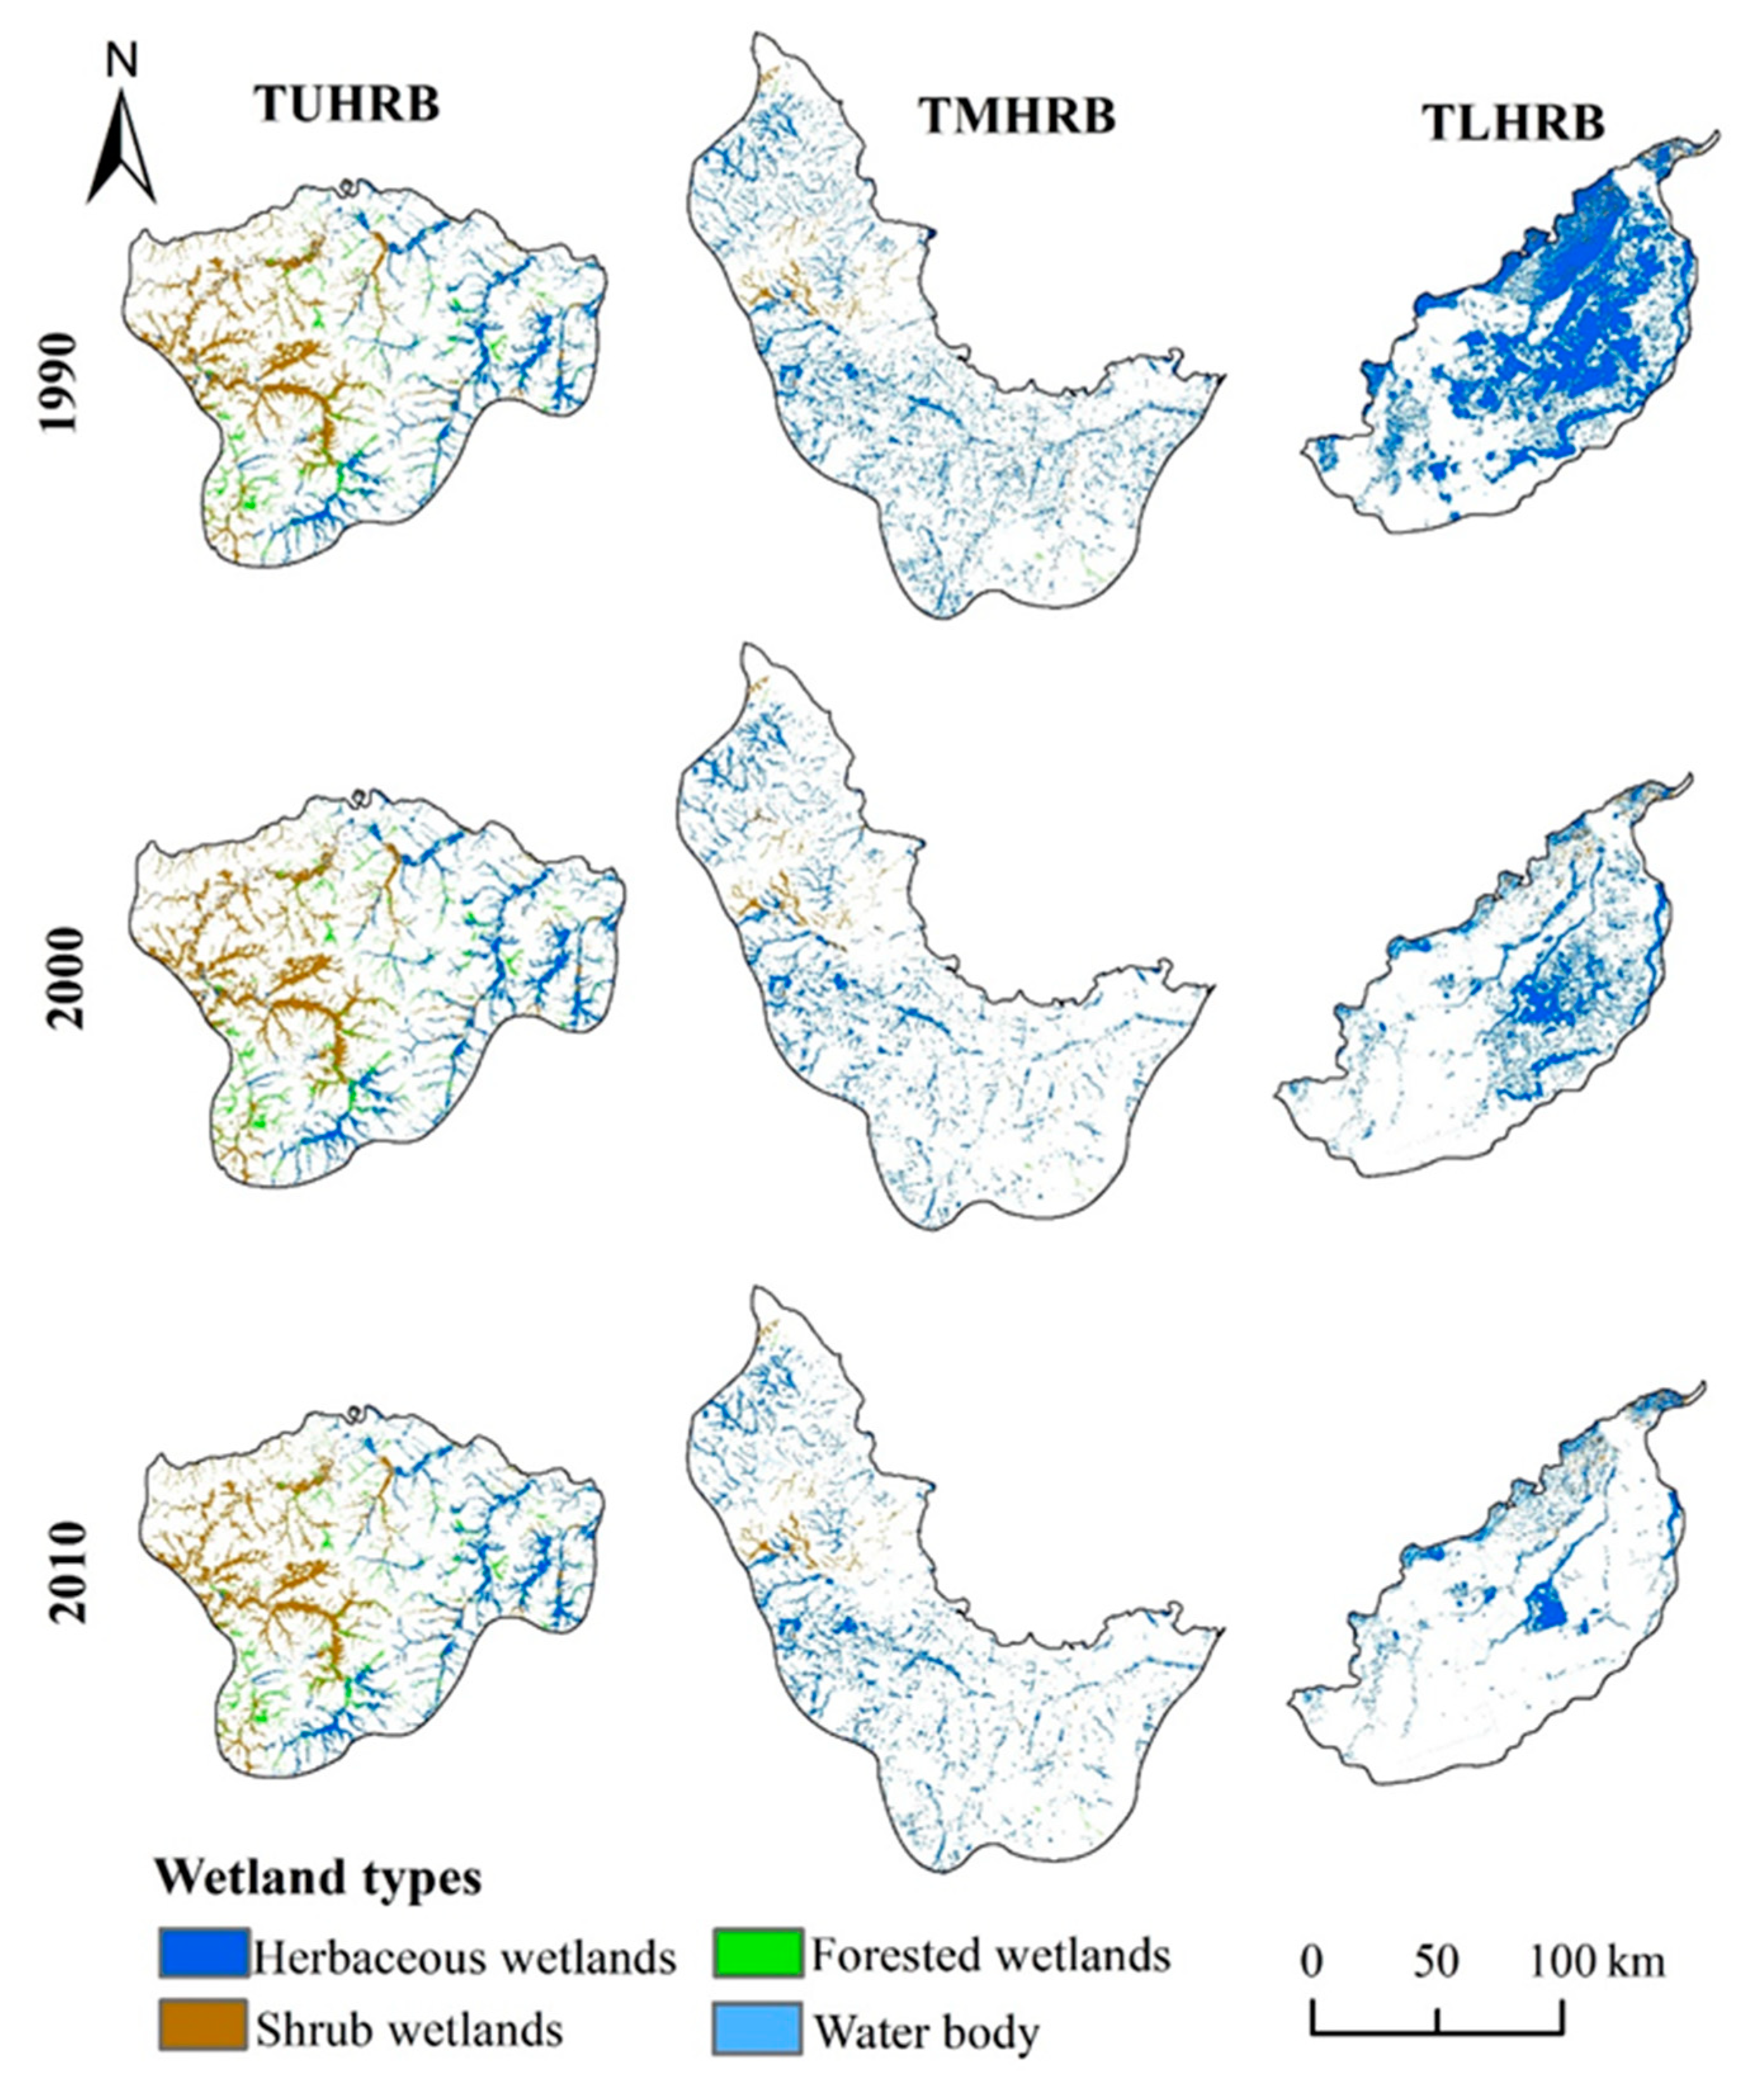
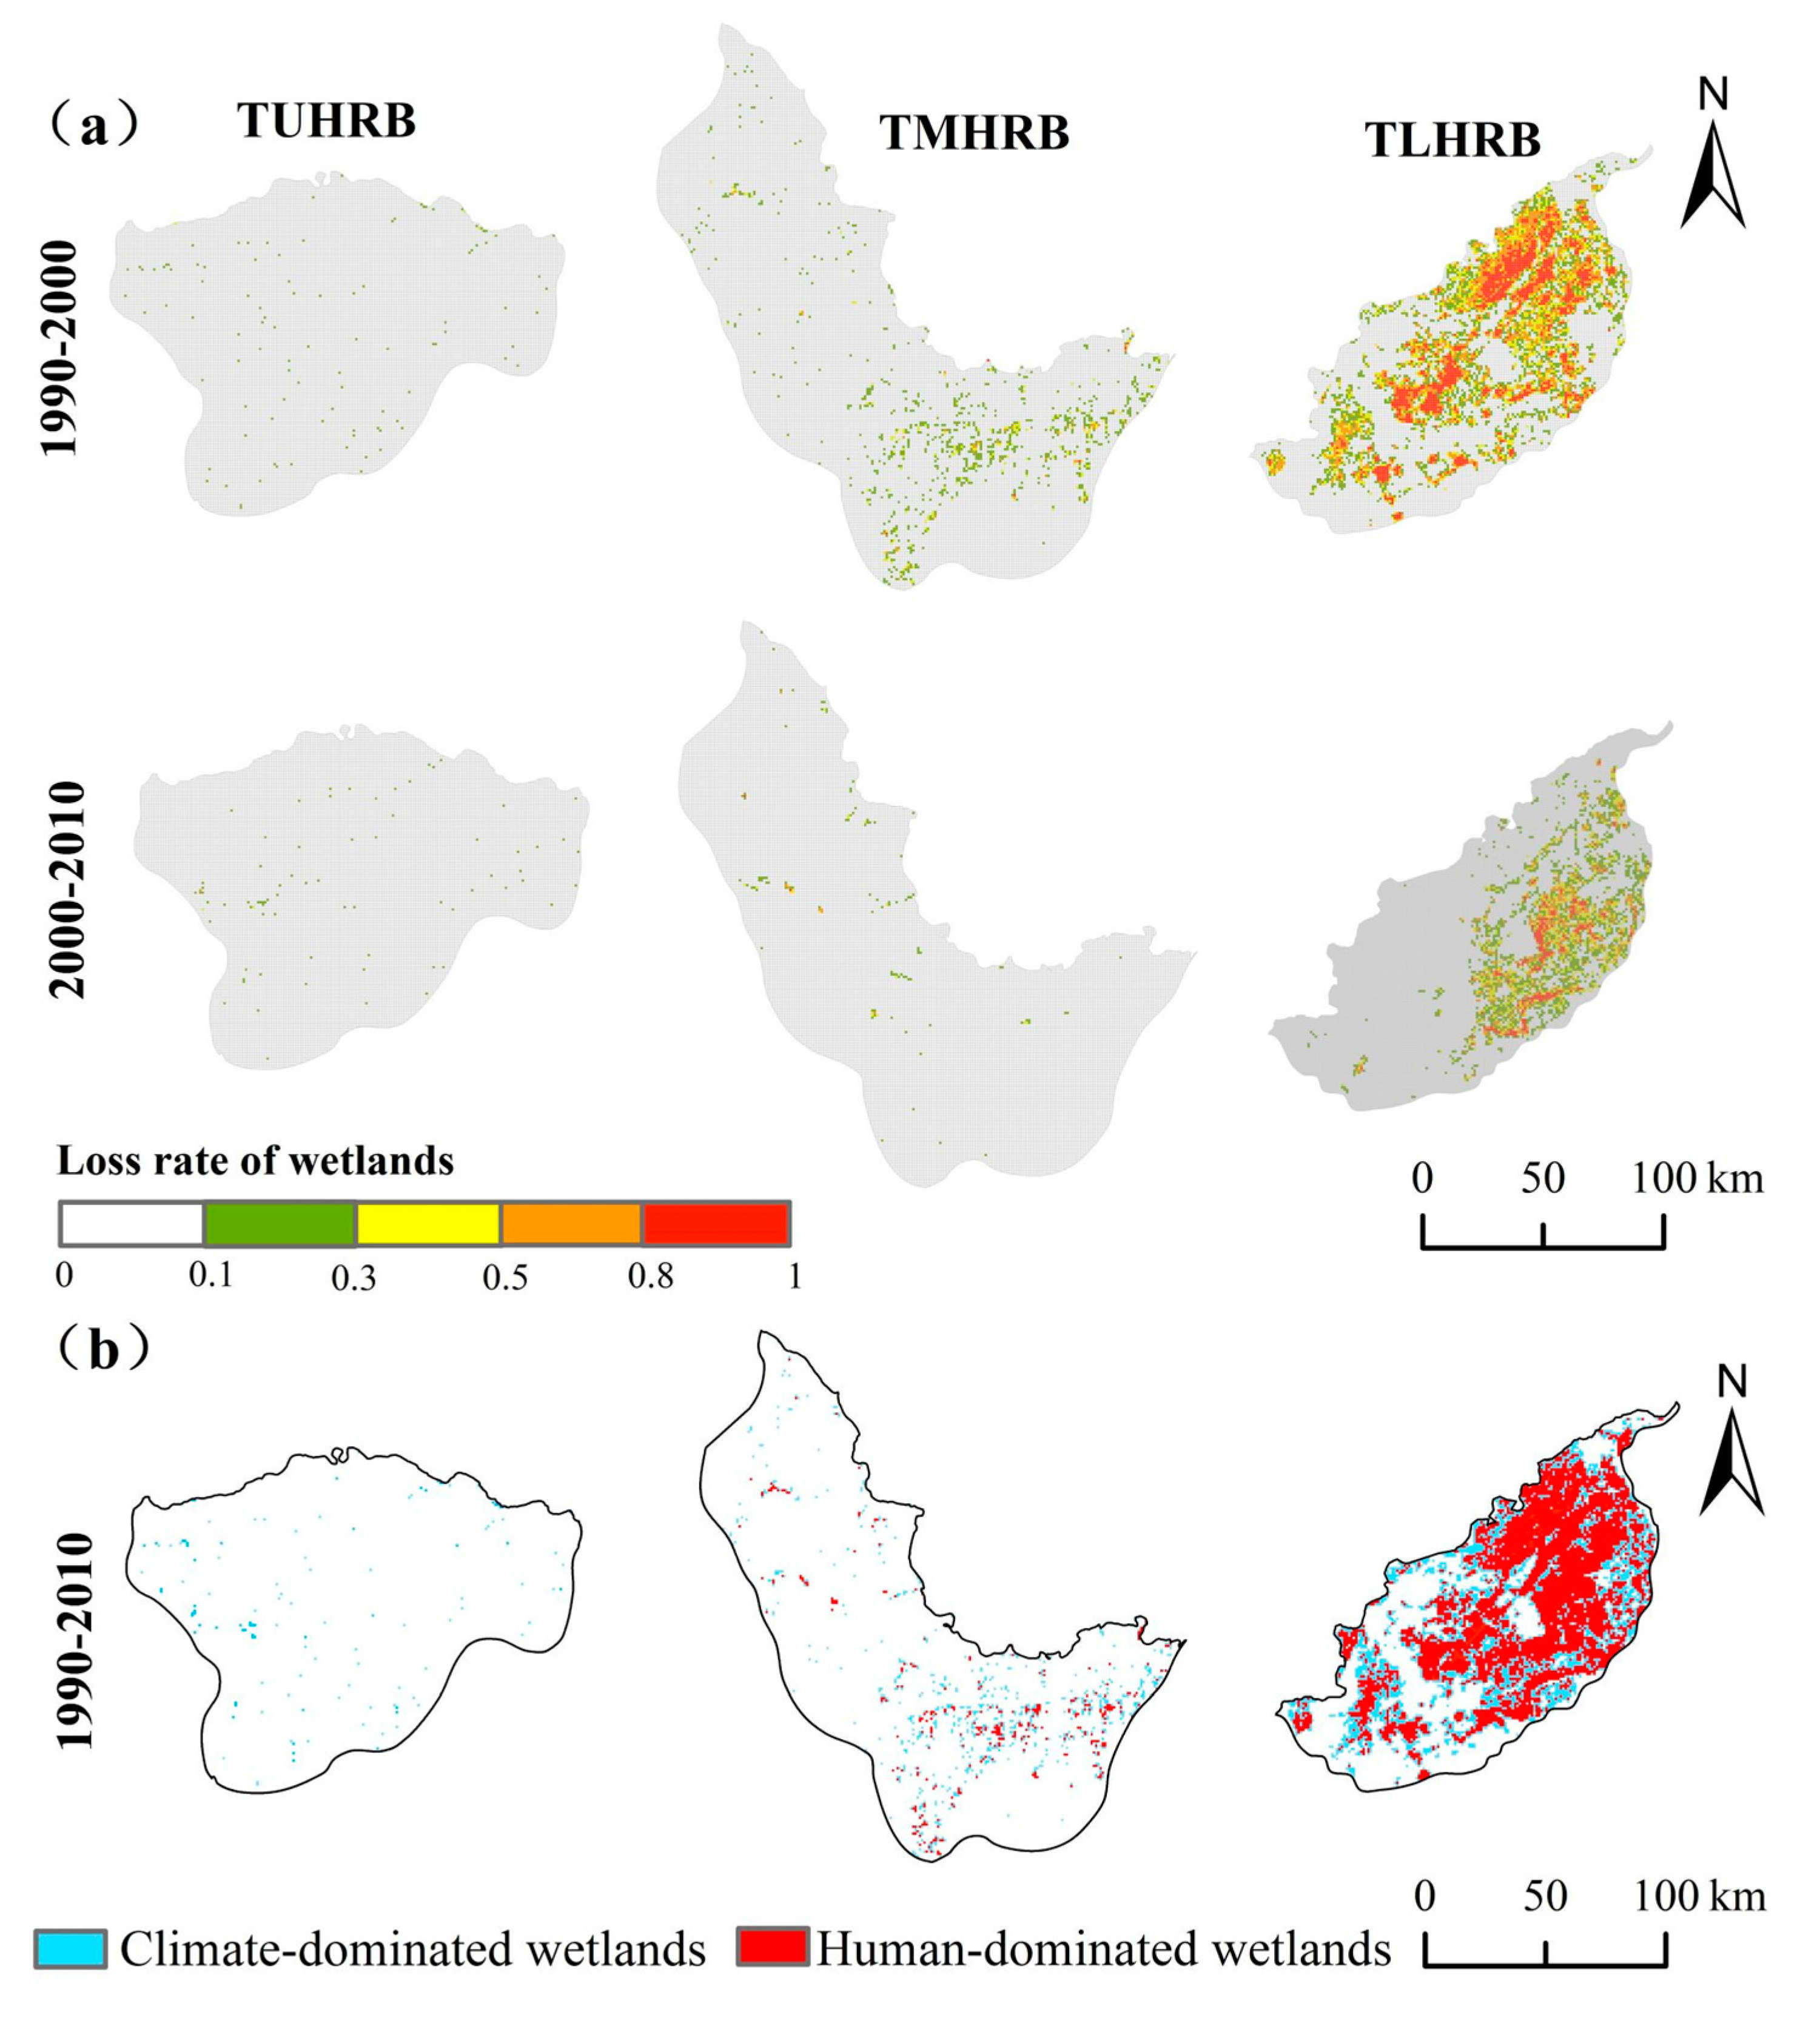
3.1. Spatial Distribution of Wetland Types

According to the wetland classification results (Figure 4 and Table 2), the main wetland types in the TUHRB were herbaceous, shrub and forested wetlands. Specifically, herbaceous, shrub and forested wetlands accounted for 38.59%, 45.22% and 16.19% of the total wetland areas in the TUHRB (Table 2), respectively. The TMHRB and TLHRB were comprised largely of herbaceous wetlands (covering about 91.97% and 96.77% of total wetland areas in the TMHRB and TLHRB, respectively), as well as a small number of shrub wetlands (covering about 7.71% and 2.22% of total wetland areas in the TMHRB and TLHRB, respectively) and forested wetlands (covering 0.32% and 1.01% of wetland total wetland areas in the TMHRB and TLHRB, respectively). In addition, the spatial distribution of wetlands in the TUHRB and TMHRB areas was relatively scattered, while the wetlands present in the TLHRB were relatively concentrated (Figure 4).

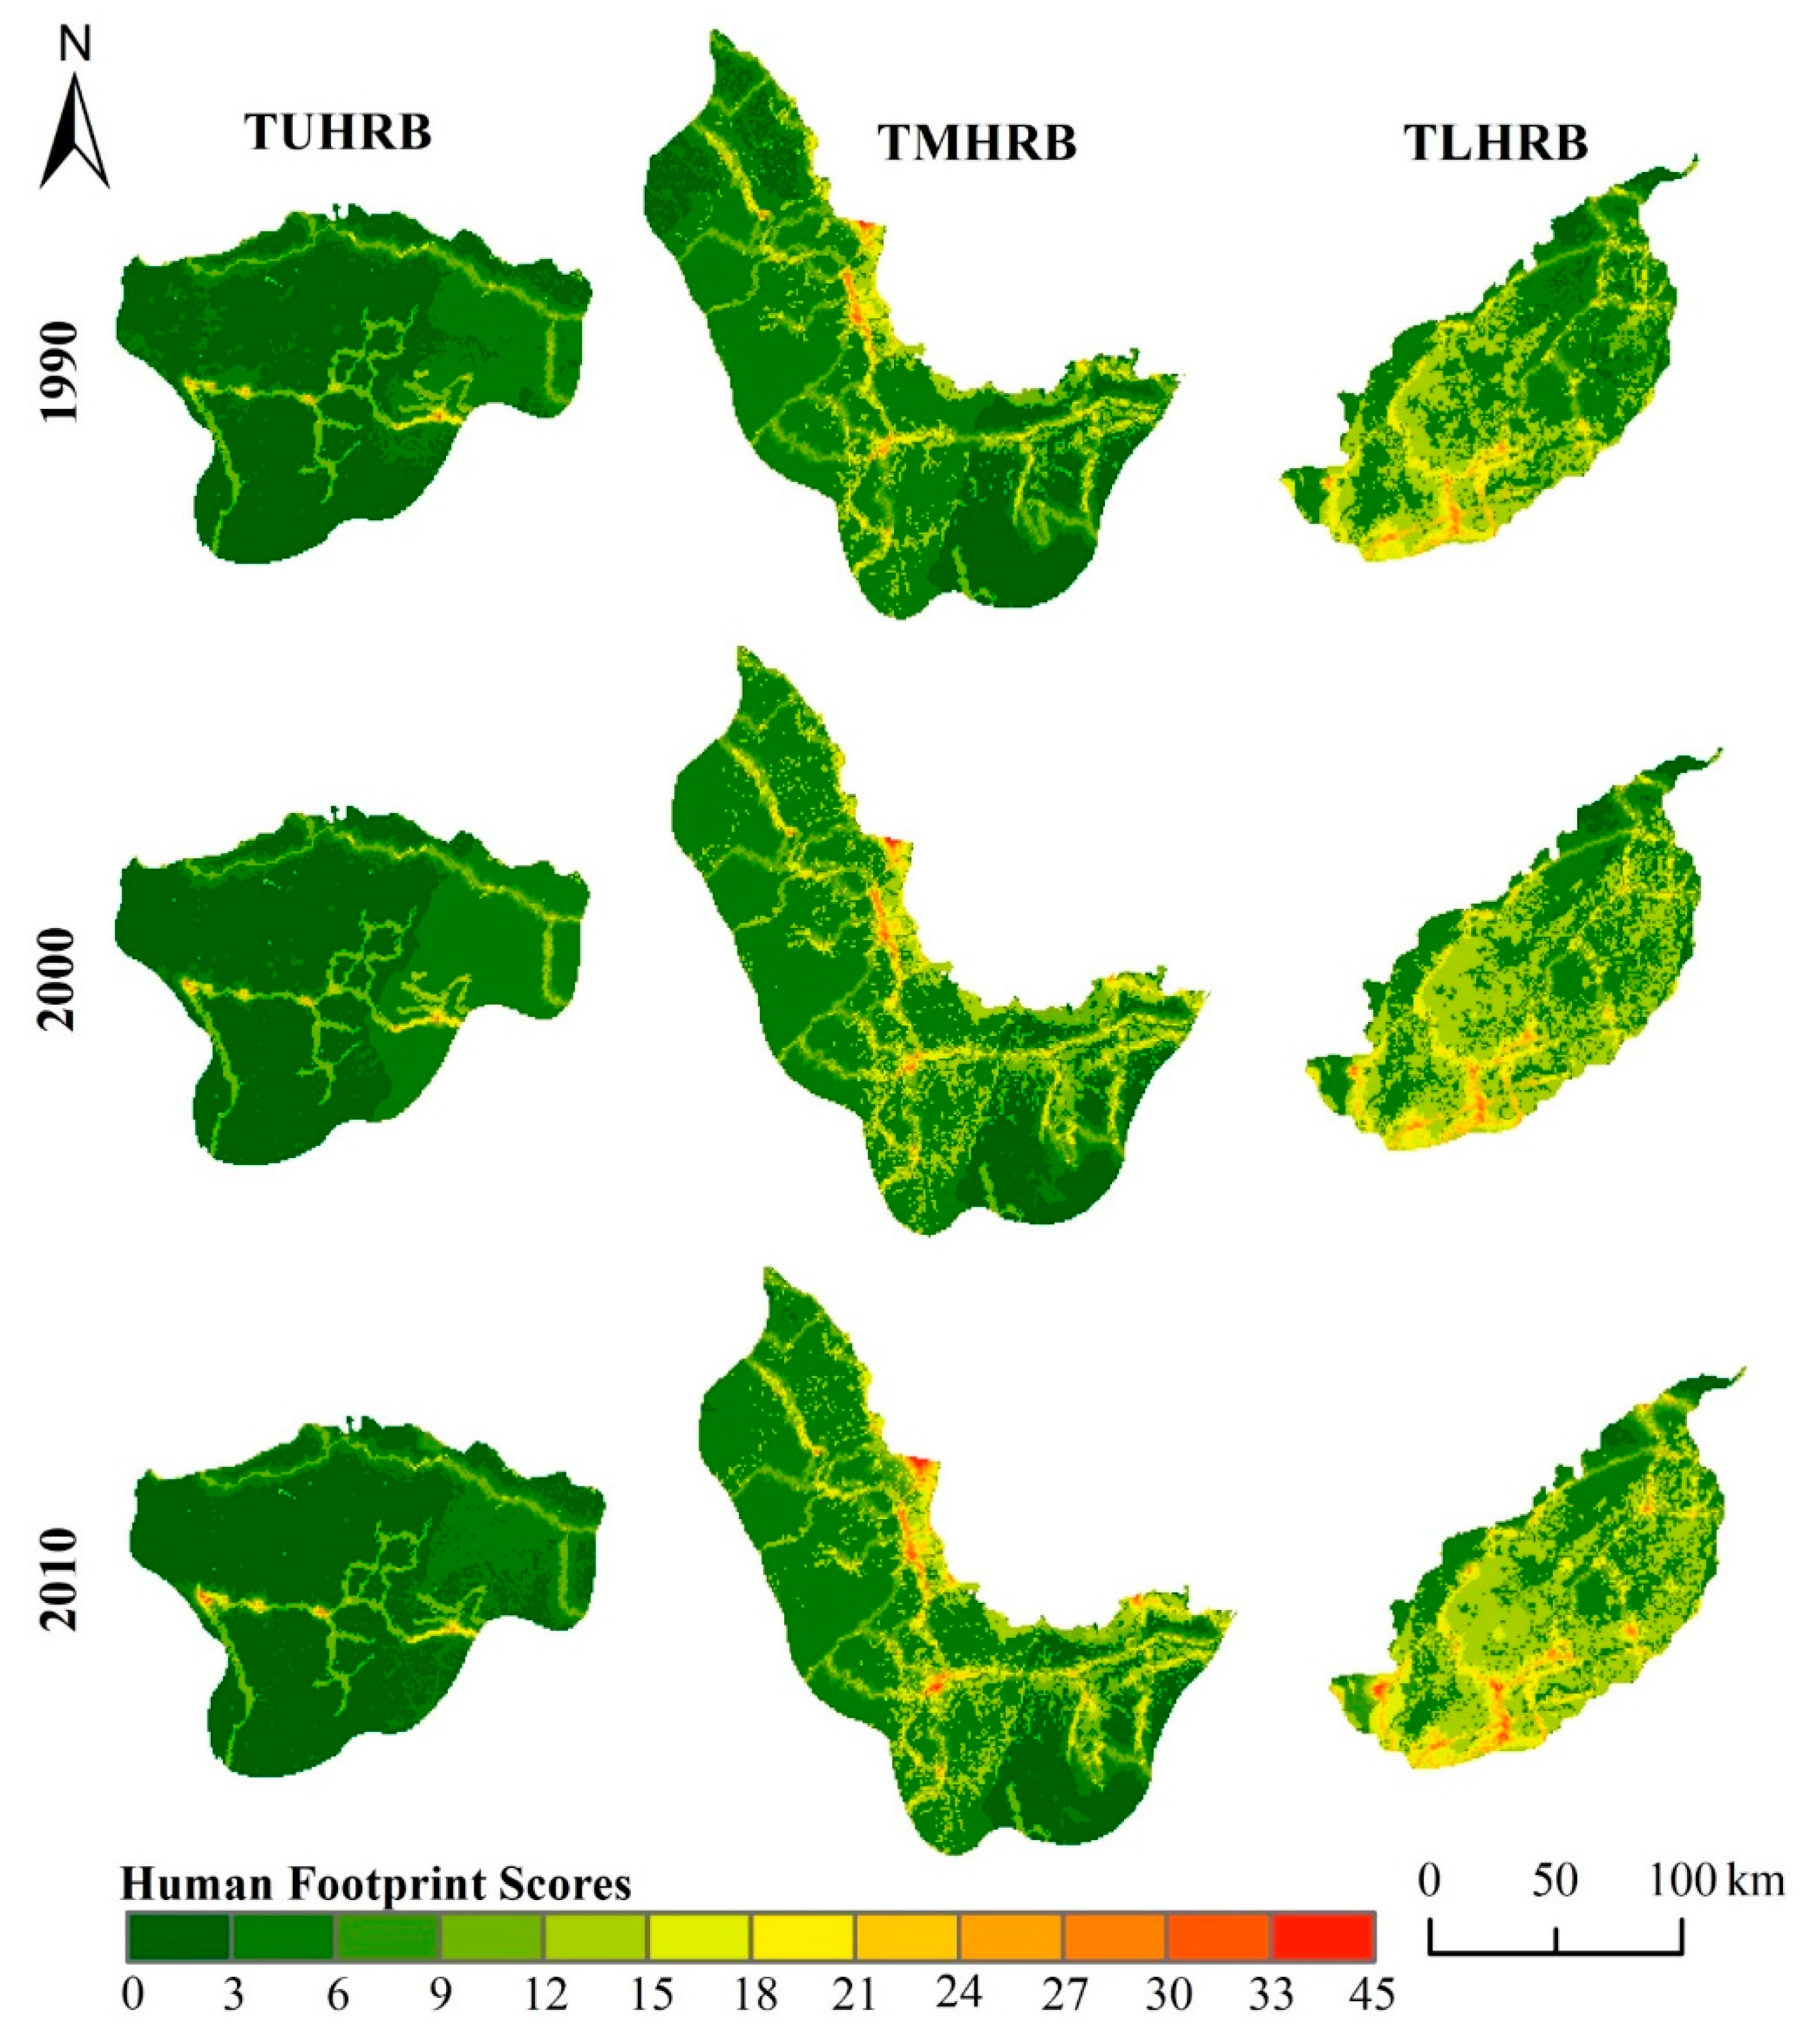
3.2. The Spatial Distribution of Human Footprint

The human footprint scores ranged from 0 to 45, where the values 0 and 45 represented the respective minimum and maximum human influence intensity during 1990–2010. The results indicated that the intensity of human activities in all three study zones (TUHRB, TMHRB, and TLHRB) increased successively, with average human footprint scores of 3.79, 6.76 and 9.68, respectively (Figure 5 and Table 3). In addition, there were differences in the spatial distribution of human activities intensity across the study zones (Figure 5). Areas with high intensity human activities were mainly distributed in the central and western regions of the TUHRB, whereas intense human activities were distributed in the middle and northern regions of the TMHRB, and in the central and southern regions in the TLHRB. The intensity of human activities in the TUHRB increased by just 1.22% during this period, while in the TMHRB and TLHRB, it increased by 16.97% and 23.56%, respectively.

3.3. Formatting of Mathematical Components

In general, wetland losses varied across the different study zones, and the loss of wetlands increased moving from the upper to lower reaches of the basin (Figure 6a). In the TUHRB and TMHRB, wetland loss rates were mainly concentrated in the 0–0.3 range, and the amount and spatial distribution of wetland loss was relatively scattered. However, loss rates for wetlands in the TLHRB were mainly concentrated between 0.3–0.8, the amount of wetland loss was greater, and the spatial distribution was relatively concentrated (Figure 6a). In addition, the loss of wetland in different periods was also different, with greater wetland losses occurring during 1990–2000 compared to 2000–2010.

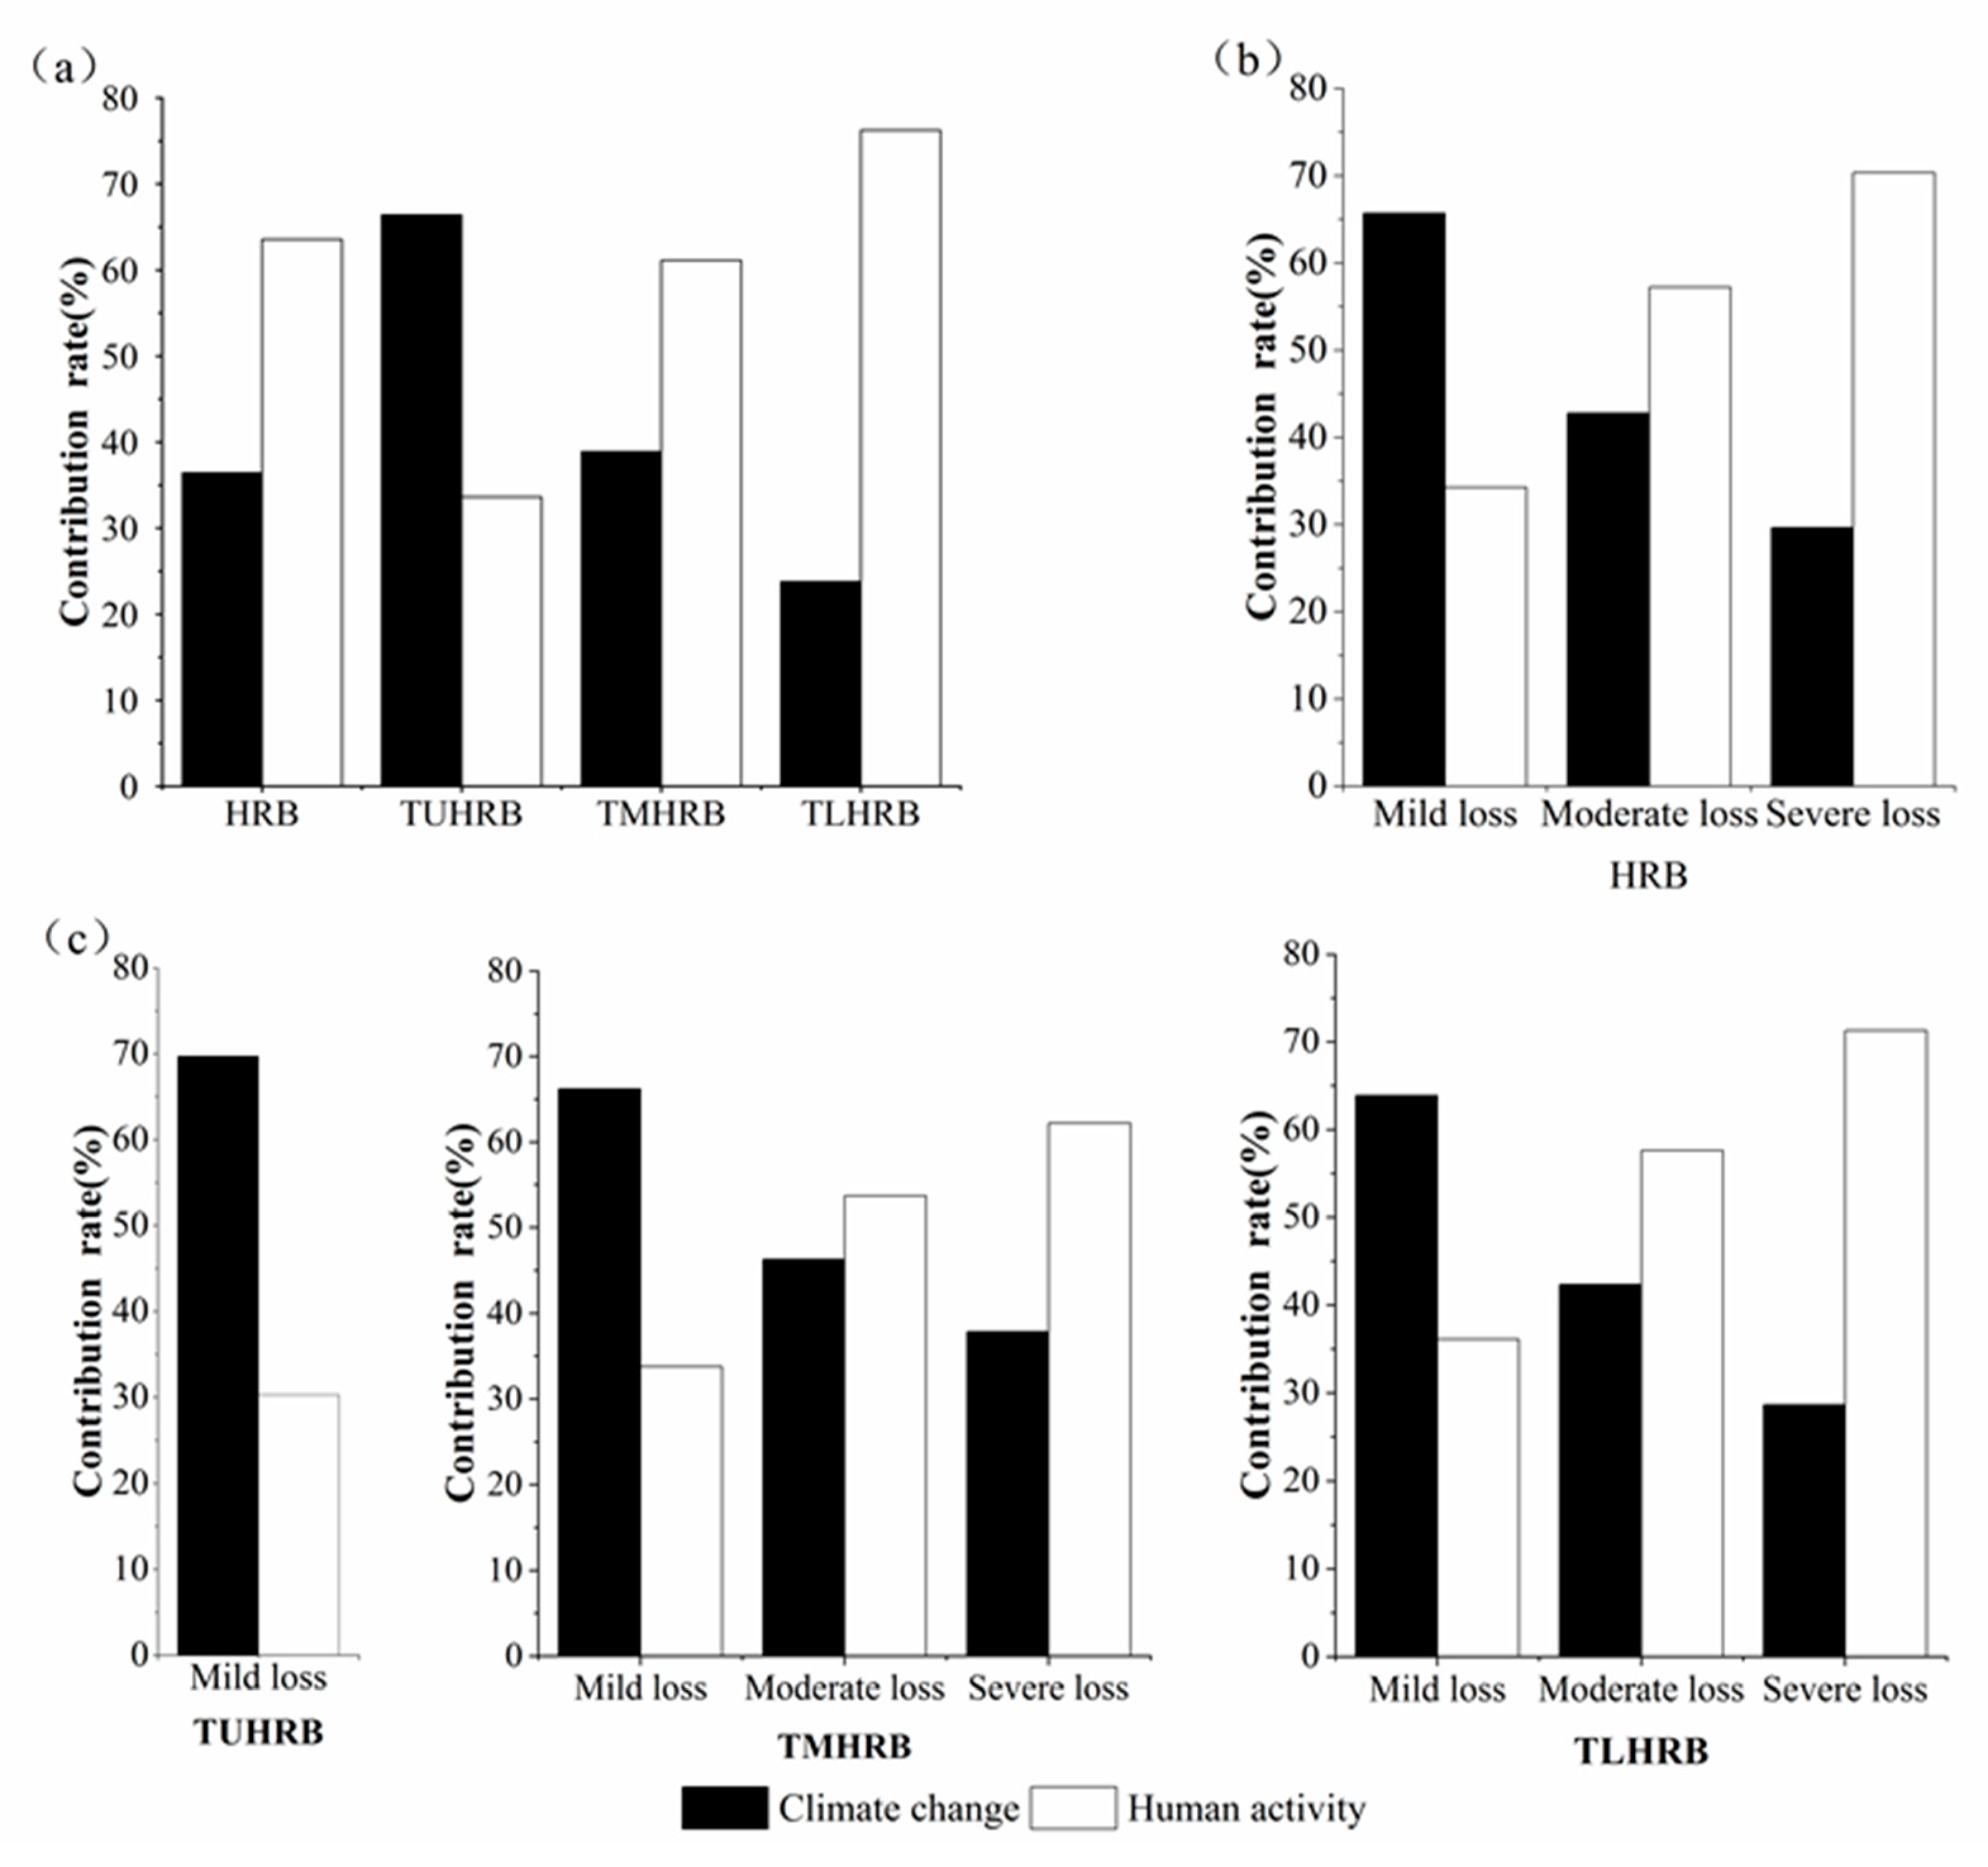
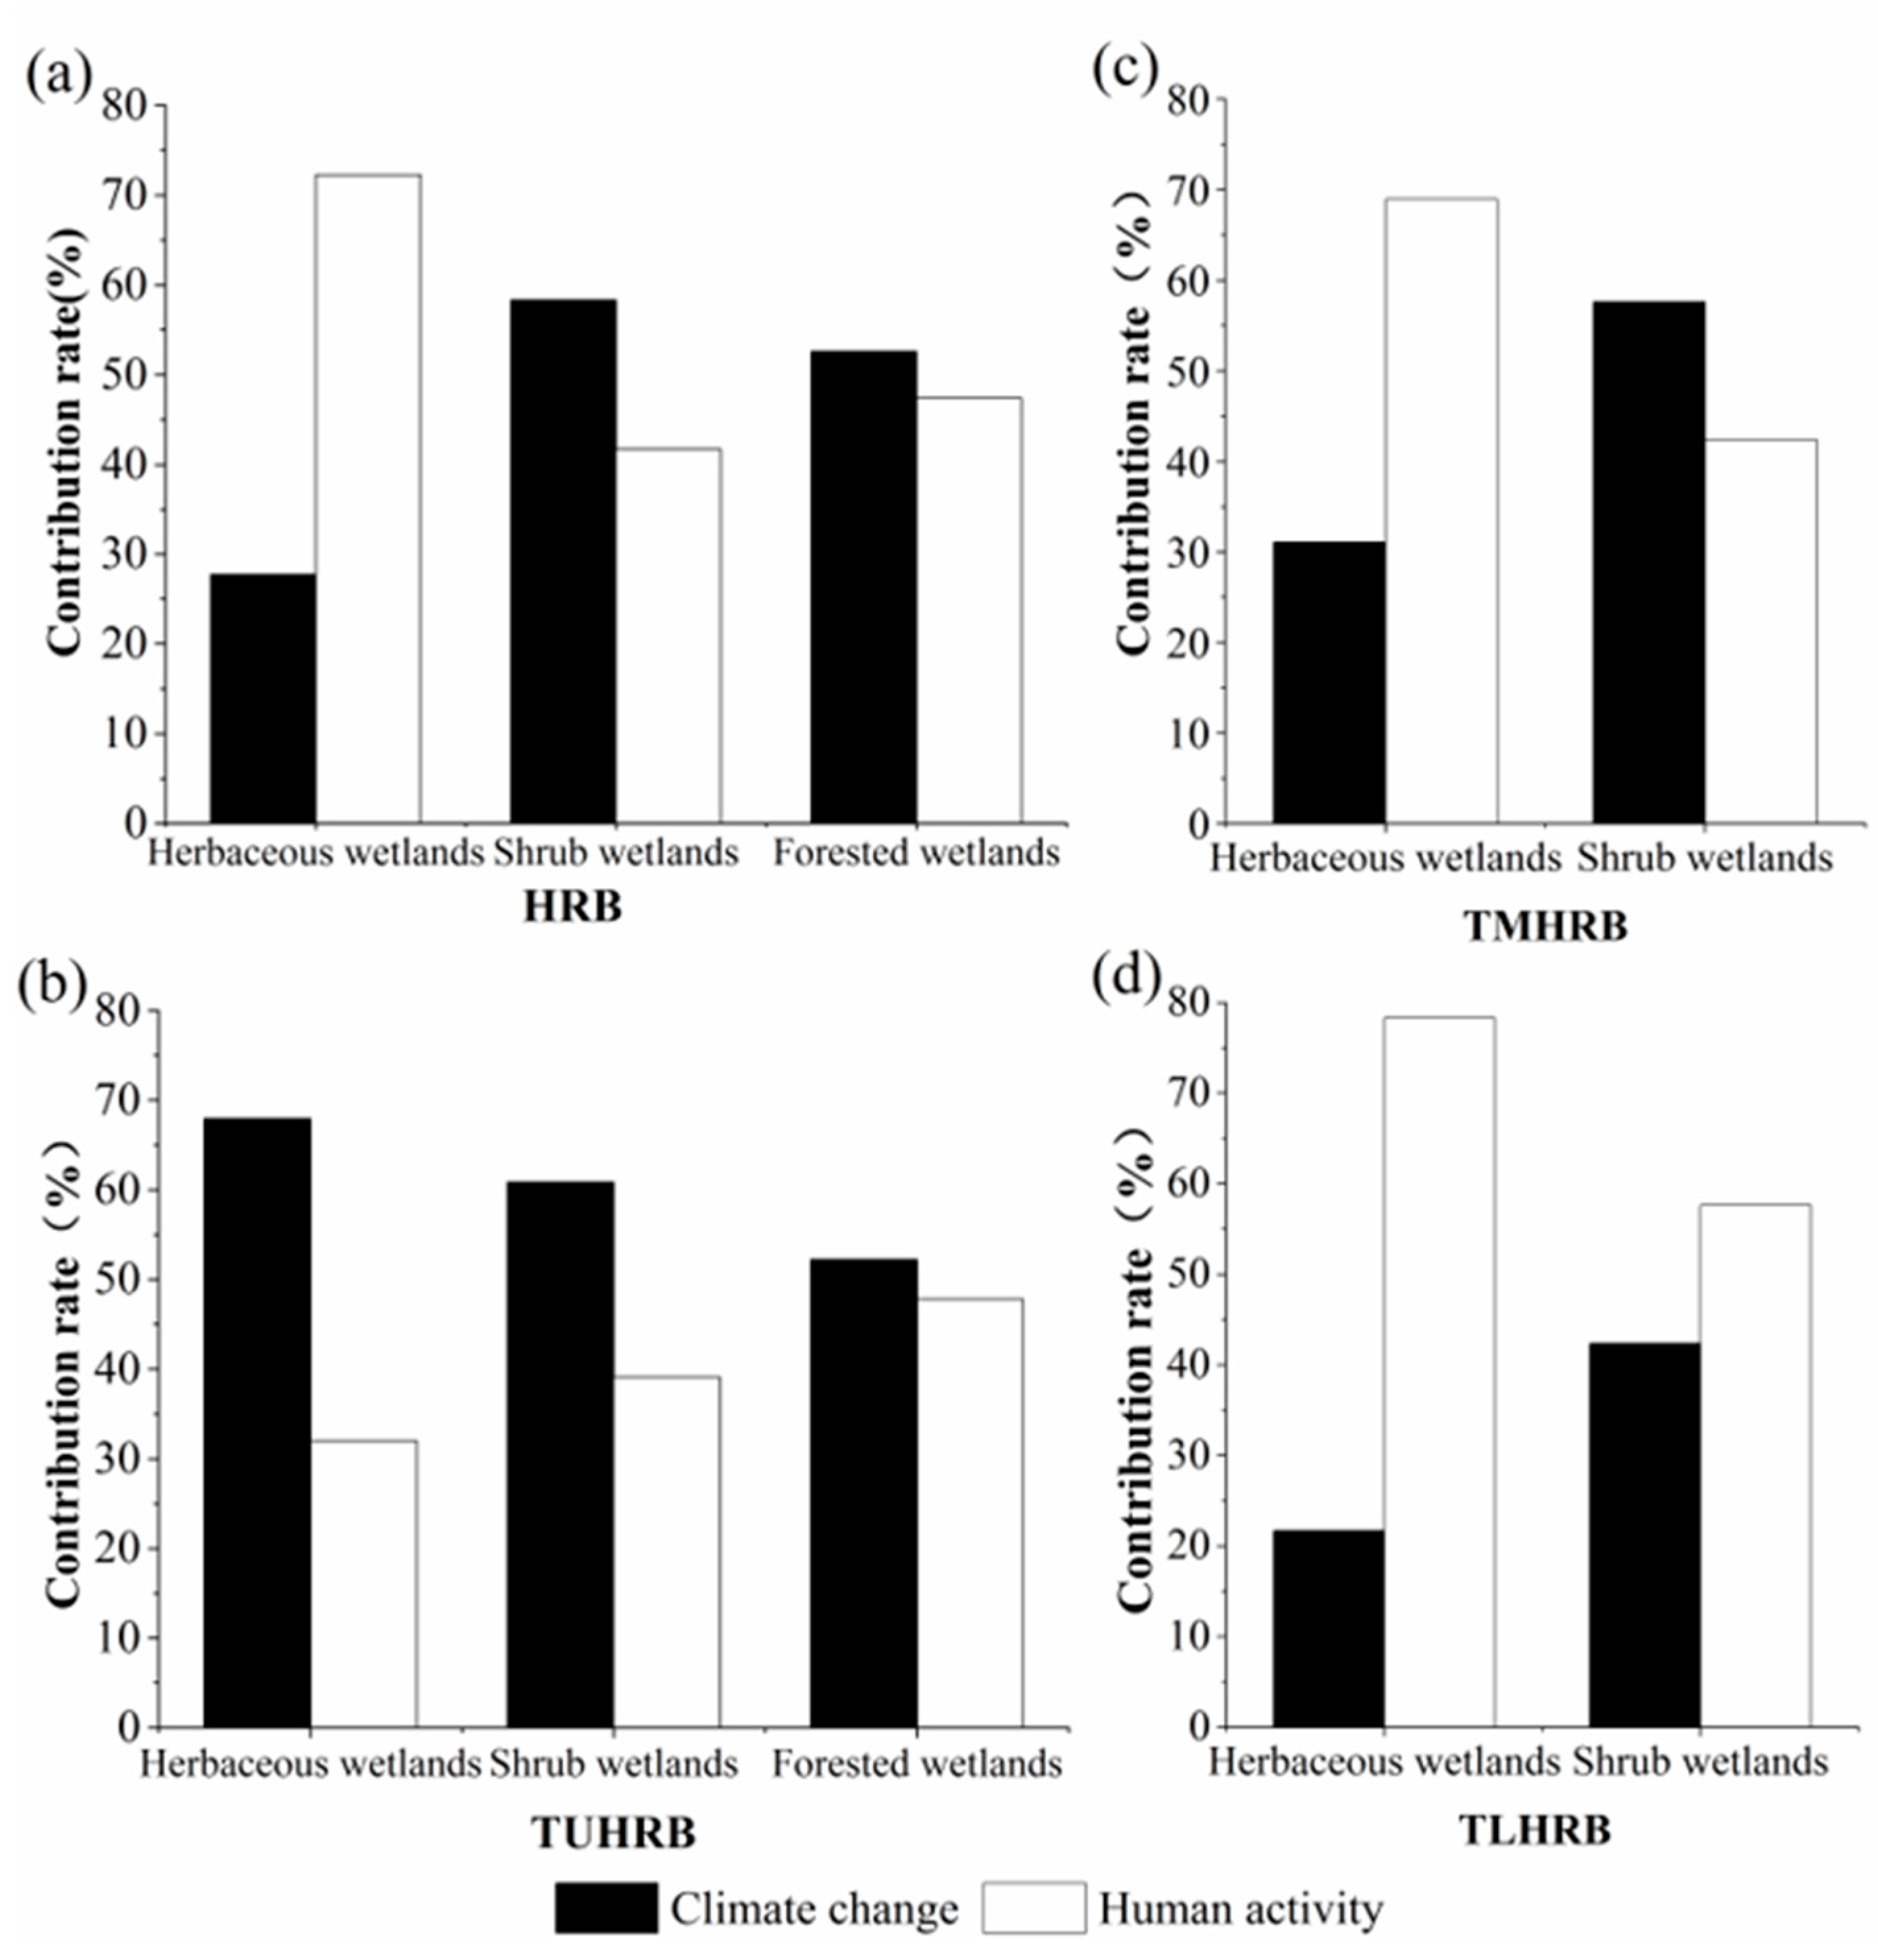
3.4. The Relative Importance of Climate Change and Human Activities on Wetland Changes

The majority of wetland changes could be attributed to human activities for the overall HRB, with a contribution rate of 63.57% over the past 20 years (Figure 7a). By sub-area, climate impacts exerted a greater influence on wetland changes in the TUHRB (66.38%), while human activities exerted a greater influence in the TMHRB and TLHRB, with respective contribution rates of 61.12% and 76.23%.
The wetland loss levels were defined as: 0–0.3 for mild loss, 0.3–0.5 for moderate loss, and 0.5–1 for severe loss (Figure 7c). The results indicated that climate change had a relatively larger impact (65.72%) on wetland loss categorized as mild (Figure 7b,c), while moderate and severe wetland losses were influenced by human activities, with contribution rates of 57.22% and 70.35% in the HRB, respectively. In addition, the study results revealed the spatial distribution of wetland changes resulting from human activities or climate change (Figure 6b). In general, mild-level wetland losses were dominated by climate change, and moderate-severe-level losses were dominated by human activities.
In this study, the relative importance of climate change and human activities on three types of wetland (herbaceous, shrub, and forested wetlands) was explored. It should be noted that changes to forested wetlands in the TMHRB and TLHRB were not analyzed (Figure 8c,d). The results showed that human activities played a larger role in herbaceous wetland changes (contribution rate of 72.28%), whereas climate change had a larger impact on the shrub and forested wetland areas, with respective contribution rates of 58.33% and 52.58% in the HRB (Figure 8a). In addition, the relative importance of the two stressors varied across the TUHRB, TMHRB, and TLHRB areas. Specifically, forested wetland areas were more affected by human activities than herbaceous and shrub wetlands in the TUHRB (Figure 8b), while shrub wetlands were more affected by climate change than herbaceous wetlands in the TMHRB and TLHRB (Figure 8c,d).

4. Discussion

In this study, the relative importance of climate change and human activities on wetland changes in the HRB during 1990–2010 was quantified. The results indicated that human activities played a larger role than climatic changes in regard to wetland changes in the overall river basin. However, climate change had a relatively larger effect on wetland in the upper reaches of the basin. One reason for this is that the rugged terrain of the upper reaches (Figure 1) was not conducive to large-scale human developments on wetlands in the area. This is reinforced by our finding that the intensity of human activities (human footprint was 3.78) remained basically unchanged from 1990 to 2010 (Figure 5). At the same time, this area in the Greater Khingan Range experienced an observed warming trend [45], which could lead to an overall reduction in wetland areas. Further, wetlands in this region may continue to degenerate and shift northward as the climate warms during the rest of this century [45,46]. In a previous study, the driving factors of wetland changes in the Greater Khingan Range mountains and upper reaches of the Heilongjiang River Basin were analyzed [47]. The study found that, compared with human activities, the impact of climate change on wetland areas was a relatively more significant factor. In another study, Chen et al. distinguished the relative importance of natural factors and human activities on wetland, and the results showed that human activities played a significant role in the impact on wetland in the Songnen and Sanjiang Plains of the middle and lower reaches of HRB, with contribution rates of 58.33% and 52.58%, respectively [19]. These results are supported by the findings of our study in the HRB. In our study area, the TUHRB was formed of semi-natural areas (low human activity intensity), and the dominant factor of wetland changes was climate. It was the same with the Amazon River Basin, where wetland changes were mainly controlled by precipitation and underlying surface composition [17]. However, with the development and utilization of the Amazon River Basin [48,49], the impact of human activities on wetland changes may increase. In areas with a high intensity of human activities such as Heihe River Basin, which had a dense population [50], human activities were the dominant factors involved in wetland changes in this basin [24]. It was the same with the TMHRB and TLHRB, which were in heavily populated areas, where the dominant factor of wetland changes was human activity.
In the sub-areas of the HRB examined in this study, the areas with wetland losses categorized as mild were mainly affected by climate change. This possibly due to the warming trend observed in the HRB during the study period, since temperature increases can affect wetland hydrological processes [9], accelerate the water cycle, increase soil temperatures, and affect the growth of wetland vegetation [51], which can lead to degraded wetland function [52]. These factors can lead to wetland changes that may take many years to develop. At the same time, the areas with mild wetland losses also experienced small changes in the intensity of human activities. For example, the intensity of human activities in the TUHRB area, with a small degree of wetland loss, only increased by 1.22% from 1990 to 2010 (Figure 5). On the contrary, the area with severe wetland loss was greatly affected by human activities over that short time period, indicating that human activities can lead to a large-scale reduction in wetlands. For example, large areas of wetland had been converted to farmland, resulting in severe wetland losses [21]. In addition, the intensity of human activities increased by 23.56 percent during in 1990–2010 in areas with severe wetland loss, particularly in the TLHRB area. However, the global human footprint increased by just 9% during 1993–2009, which indicates that wetlands in the TLHRB were seriously threatened by human pressure [29]. In general, the impacts of human activities on wetland losses can be more easily mitigated than those of climatic changes. For example, China has implemented national ecological projects such as “returning farmland to forests” [16], and some wetland areas are protected. Overall, the results of this study showed that the area of the HRB experiencing severe wetland loss was greatly affected by human activities (controllable factors). Therefore, it is necessary to strengthen wetland protections in key areas, particularly those that have experiences severe losses, and to promote the future restoration of wetlands.
In general, herbaceous wetlands were greatly affected by human activities, while shrub and forested wetlands were more greatly affected by climate. This is primarily due to the fact that the herbaceous wetlands areas were mainly distributed in the TMHRB and TLHRB areas, where human activities had a greater effect on wetland change, while shrub and forested wetlands were mainly distributed in the TUHRB area, where climate change had a greater impact on wetland change (Figure 4 and Figure 7a). In the TUHRB area, the forested wetland was more affected by human activities compared to herbaceous and shrub wetlands. A possible reason for this is that the TUHRB area was located in a mountainous region, which is an important forest area and wood production source of China [53]. Thus, long-term logging may have led to the reduction in forested wetland area or conversion to other wetland types [47]. In addition, surface water in some forested wetlands has been drained to make way for agroforestry applications, another form of wetland degradation [54]. Shrub wetlands were more affected by climate change than herbaceous wetlands in the TMHRB and TLHRB areas, possibly due to the fact that shrub plants have greater a greater capacity for evapotranspiration compared to herbaceous plants [55], and may be more sensitive to climate change. On the other hand, shrubs were more distributed in valleys [56], while herbaceous wetlands were mainly distributed in areas with relatively flat terrain (Figure 1 and Figure 4). Humans usually choose herbaceous wetland to cultivate for farmland, so shrub wetland was less affected by human activity.
Since the founding of the People’s Republic of China, the wetland area in the HRB has been continuously decreasing [23]. From the end of the 1990s, when the importance of wetlands in ecological functions was widely recognized, China have taken some measures to protect wetlands, such as the enactment of wetland protection regulations, the wetland restoration pilot, etc. [57]. However, the results of our study show that, during the period 2000–2010, the loss of wetlands in the TLHRB was still relatively serious, and human activities were dominant factors. This may be due to some farmers’ private reclamation of wetlands [21]. Therefore, public education on wetland protection should be carried out, especially for farmers. To promote wetland restoration, appropriate protection areas should be established for the areas with a large loss of wetland in the HRB. In addition, herbaceous wetland suffered the most serious wetlands loss among the three types of wetlands, which was mainly caused by human activities. Therefore, we should strengthen the protection of herbaceous wetlands. For example, we can forbid the conversion of herbaceous wetland into farmland, especially in the TMHRB and TLHRB. In the TUHRB, deforestation should be reduced appropriately to protect forested wetlands.
Wetland resources’ protection is inseparable from sustainable utilization, and sustainable utilization should be based on wetland protection in the future. Therefore, some measures can be taken to promote the rational utilization of wetland resources in the HRB. For example, wetlands can be used to develop wetland tourism. While developing the tourism industry, we must protect the wetland ecosystem and wildlife habitat at the same time.

5. Conclusions

In this study, we examined the relative importance of climate change and human activities on wetlands by analyzing the severity of loss across multiple wetland types. Results from this research can help to provide a basis for the scientific management of wetlands, to help better protect and utilize wetland resources, particularly in sensitive areas in middle and high latitudes.
This relative importance of climate change and human activities on wetland changes was quantified based on wetland distribution, climate and human activities datasets by using the LMG method from the R package “relaimpo”. The main conclusions were as follows: (1) in general, human activities had a greater impact on wetland change than climate change in the HRB; (2) locations with low amounts of wetland loss were mainly affected by climate change, while locations with moderate loss and severe loss were more affected by human activities; (3) herbaceous wetlands were more affected by human activities, while shrub and forested wetland types were more greatly affected by climate change. For wetland management and protection, we should make rational and sustainable use of wetland resources, focus on the protection of wetland types with serious losses (herbaceous wetlands), establish conservation areas (areas in wetlands with sever loss) and improve farmers’ awareness of wetland protection.

Author Contributions

Methodology, Y.D., H.H. and D.Z.; Resources, Y.D., H.H. and H.D.; Software, Y.D.; Writing—original draft, Y.D.; Writing—review and editing, H.H., D.Z., M.S. and H.D. All authors have read and agreed to the published version of the manuscript.

Funding

This research was jointly supported by the National Key Research and Development Program of China (No. 2016YFA0602301 and No. 2017YFA0604403), the Joint Fund of National Natural Science Foundation of China (No. U19A2023).

Acknowledgments

Thanks to Michael Sunde for proofreading the English to improve the manuscript.

Conflicts of Interest

The authors declare no conflict of interest.

References

  1. Zhao, D.; He, S.H.; Wang, J.W.; Wang, L.; Du, H.; Liu, K.; Zong, S. Predicting wetland distribution changes under climate change and human activities in a mid- and high-latitude region. Sustainability 2018, 10, 863. [Google Scholar] [CrossRef] [Green Version]
  2. Costanza, R.; d’Arge, R.; de Groot, R.; Farber, S.; Grasso, M.; Hannon, B.; Limburg, K.; Naeem, S.; O’Neill, R.V.; Paruelo, J.; et al. The value of the world’s ecosystem services and natural capital. Nature 1997, 387, 253–260. [Google Scholar] [CrossRef]
  3. Bullock, A.; Acreman, M. The role of wetlands in the hydrological cycle. Hydrolol. Earth Syst. Sci. Discuss. 2003, 7, 358–389. [Google Scholar] [CrossRef] [Green Version]
  4. Davidson, N.C. How much wetland has the world lost? Long-term and recent trends in global wetland area. Mar. Freshw. Res. 2014, 65, 934–941. [Google Scholar] [CrossRef]
  5. Arias, M.E.; Cochrane, T.A.; Kummu, M.; Lauri, H.; Holtgrieve, G.W.; Koponen, J.; Piman, T. Impacts of hydropower and climate change on drivers of ecological productivity of Southeast Asia’s most important wetland. Ecol. Model. 2014, 272, 252–263. [Google Scholar] [CrossRef]
  6. Hartig, E.K.; Gornitz, V.; Kolker, A.; Mushacke, F.; Fallon, D. Anthropogenic and climate-change impacts on salt marshes of Jamaica Bay, New York City. Wetlands 2002, 22, 71–89. [Google Scholar] [CrossRef]
  7. Li, S.; Wang, G.; Deng, W.; Hu, Y.; Hu, W. Influence of hydrology process on wetland landscape pattern: A case study in the Yellow River Delta. Ecol. Eng. 2009, 35, 1719–1726. [Google Scholar] [CrossRef]
  8. Kotze, D.C. The effects of fire on wetland structure and functioning. Afr. J. Aquat. Sci. 2013, 38, 237–247. [Google Scholar] [CrossRef]
  9. House, A.R.; Thompson, J.R.; Acreman, M.C. Projecting impacts of climate change on hydrological conditions and biotic responses in a chalk valley riparian wetland. J. Hydrol. 2016, 534, 178–192. [Google Scholar] [CrossRef] [Green Version]
  10. Baldwin, A.H.; Egnotovich, M.S.; Clarke, E. Hydrologic change and vegetation of tidal freshwater marshes: Field, greenhouse, and seed-bank experiments. Wetlands 2001, 21, 519–531. [Google Scholar] [CrossRef]
  11. Helbig, M.; Chasmer, L.E.; Desai, A.R.; Kljun, N.; Quinton, W.L.; Sonnentag, O. Direct and indirect climate change effects on carbon dioxide fluxes in a thawing boreal forest–wetland landscape. Glob. Chang. Biol. 2017, 23, 3231–3248. [Google Scholar] [CrossRef] [PubMed] [Green Version]
  12. Ju, W.; Chen, J.M.; Black, T.A.; Barr, A.G.; McCaughey, H.; Roulet, N.T. Hydrological effects on carbon cycles of Canada’s forests and wetlands. Tellus B Chem. Phys. Meteorol. 2006, 58, 16–30. [Google Scholar] [CrossRef]
  13. Gedan, K.B.; Silliman, B.R.; Bertness, M.D. Centuries of human-driven change in salt marsh ecosystems. Ann. Rev. Mar. Sci. 2009, 1, 117–141. [Google Scholar] [CrossRef] [Green Version]
  14. Zhang, W.; Zhu, Y.; Jiang, J. Effect of the urbanization of wetlands on microclimate: A case study of Xixi Wetland, Hangzhou, China. Sustainability 2016, 8, 885. [Google Scholar] [CrossRef] [Green Version]
  15. Li, Y.; Shi, Y.; Zhu, X.; Cao, H.; Yu, T. Coastal wetland loss and environmental change due to rapid urban expansion in Lianyungang, Jiangsu, China. Reg. Environ. Chang. 2014, 14, 1175–1188. [Google Scholar] [CrossRef]
  16. Sica, Y.V.; Quintana, R.D.; Radeloff, V.C.; Gavier-Pizarro, G.I. Wetland loss due to land use change in the Lower Paraná River Delta, Argentina. Sci. Total. Environ. 2016, 568, 967–978. [Google Scholar] [CrossRef]
  17. Hoorn, C.; Wesselingh, F.P.; ter Steege, H.; Bermudez, M.A.; Mora, A.; Sevink, J.; Sanmartín, I.; Sanchez-Meseguer, A.; Anderson, C.L.; Figueiredo, J.P.; et al. Amazonia through time: Andean uplift, climate change, landscape evolution, and biodiversity. Science 2010, 330, 927–931. [Google Scholar] [CrossRef] [Green Version]
  18. Jiang, W.; Wang, W.; Chen, Y.; Liu, J.; Tang, H.; Hou, P.; Yang, Y. Quantifying driving forces of urban wetlands change in Beijing City. J. Geogr. Sci. 2012, 22, 301–314. [Google Scholar] [CrossRef]
  19. Chen, H.; Zhang, W.; Gao, H.; Nie, N. Climate Change and Anthropogenic Impacts on Wetland and Agriculture in the Songnen and Sanjiang Plain, Northeast China. Remote Sens. 2018, 10, 356. [Google Scholar] [CrossRef] [Green Version]
  20. Liu, X.; Dong, G.; Wang, X.; Xue, Z.; Jiang, M.; Lu, X.; Zhang, Y. Characterizing the spatial pattern of marshlands in the Sanjiang Plain, Northeast China. Ecol. Eng. 2013, 53, 335–342. [Google Scholar] [CrossRef]
  21. Yan, F.; Zhang, S.; Liu, X.; Yu, L.; Chen, D.; Yang, J.; Yang, C.; Bu, K.; Chang, L. Monitoring spatiotemporal changes of marshes in the Sanjiang Plain, China. Ecol. Eng. 2017, 104, 184–194. [Google Scholar] [CrossRef]
  22. Mao, D.; Wang, Z.; Luo, L.; Ren, C.; Jia, M. Monitoring the evolution of wetland ecosystem pattern in northeast China from 1990 to 2013 based on remote sensing. J. Nat. Resour. 2016, 31, 1253–1263. [Google Scholar]
  23. Niu, Z.; Zhang, H.; Wang, X.; Yao, W.; Zhou, D.; Zhao, K.; Zhao, H.; Li, N.; Huang, H.; Li, C.; et al. Mapping wetland changes in China between 1978 and 2008. Chin. Sci. Bull. 2012, 57, 2813–2823. [Google Scholar] [CrossRef] [Green Version]
  24. Jiang, P.; Cheng, L.; Li, M.; Zhao, R.; Huang, Q. Analysis of landscape fragmentation processes and driving forces in wetlands in arid areas: A case study of the middle reaches of the Heihe River, China. Ecol. Indic. 2014, 46, 240–252. [Google Scholar] [CrossRef]
  25. Cui, L.; Gao, C.; Zhou, D.; Mu, L. Quantitative analysis of the driving forces causing declines in marsh wetland landscapes in the Honghe region, northeast China, from 1975 to 2006. Environ. Earth. Sci. 2014, 71, 1357–1367. [Google Scholar] [CrossRef]
  26. Fan, J.; Xiao, Y. Characteristics of wetland plant resources and its protection and application in Heilongjiang Province. J. Northeast For. Univ. 2011, 39, 76–86. [Google Scholar]
  27. Myneni, R.B.; Keeling, C.D.; Tucker, C.J.; Asrar, G.; Nemani, R.R. Increased plant growth in the northern high latitudes from 1981 to 1991. Nature 1997, 386, 698–702. [Google Scholar] [CrossRef]
  28. Sanderson, E.W.; Levy, M.J.A.; Redford, K.H.; Wannebo, A.V. The human footprint and the last of the wild. Bioscience 2002, 52, 891–904. [Google Scholar] [CrossRef]
  29. Venter, O.; Sanderson, E.W.; Magrach, A.; Allan, J.R.; Beher, J.; Jones, K.R.; Possingham, H.P.; Laurance, W.F.; Wood, P.; Fekete, B.M.; et al. Global terrestrial human footprint maps for 1993 and 2009. Sci. Data 2016, 3, 160067. [Google Scholar] [CrossRef] [Green Version]
  30. Grömping, U. Relative importance for linear regression in R: The package relaimpo. J. Stat. Softw. 2006, 17, 1–27. [Google Scholar] [CrossRef] [Green Version]
  31. Aguirre-Gutiérrez, J.; Seijmonsbergen, A.C.; Duivenvoorden, J.F. Optimizing land cover classification accuracy for change detection, a combined pixel-based and object-based approach in a mountainous area in Mexico. Appl. Geogr. 2012, 34, 29–37. [Google Scholar] [CrossRef] [Green Version]
  32. Gao, B. NDWI—A normalized difference water index for remote sensing of vegetation liquid water from space. Remote. Sens. Environ. 1996, 58, 257–266. [Google Scholar] [CrossRef]
  33. McFeeters, S.K. The use of the Normalized Difference Water Index (NDWI) in the delineation of open water features. Int. J. Remote Sens. 1996, 17, 1425–1432. [Google Scholar] [CrossRef]
  34. Ke, Y.; Quackenbush, L.J.; Im, J. Synergistic use of QuickBird multispectral imagery and LIDAR data for object-based forest species classification. Remote Sens. Environ. 2010, 114, 1141–1154. [Google Scholar] [CrossRef]
  35. Li, S.; Wu, J.; Gong, J.; Li, S. Human footprint in Tibet: Assessing the spatial layout and effectiveness of nature reserves. Sci. Total Environ. 2018, 621, 18–29. [Google Scholar] [CrossRef] [PubMed]
  36. Johnson, C.N.; Balmford, A.; Brook, B.W.; Buettel, J.C.; Galetti, M.; Guangchun, L.; Wilmshurst, J.M. Biodiversity losses and conservation responses in the Anthropocene. Science 2017, 356, 270–275. [Google Scholar] [CrossRef]
  37. Garris, H.W.; Mitchell, R.J.; Fraser, L.H.; Barrett, L.R. Forecasting climate change impacts on the distribution of wetland habitat in the Midwestern United states. Glob. Chang. Biol. 2015, 21, 766–776. [Google Scholar] [CrossRef]
  38. González-Abraham, C.; Ezcurra, E.; Garcillán, P.P.; Ortega-Rubio, A.; Kolb, M.; Creel, J.E.B. The human footprint in Mexico: Physical geography and historical legacies. PLoS ONE 2015, 10, e0121203. [Google Scholar] [CrossRef] [Green Version]
  39. Fu, J.Y.; Jiang, D.; Huang, Y.H. 1 km grid population dataset of China. Glob. Chang. Res. Data Publ. Repos. 2014, 69, 136–139. [Google Scholar]
  40. Center for International Earth Science Information Network—CIESIN—Columbia University; Information Technology Outreach Services—ITOS—University of Georgia. Global Roads Open Access Data Set, Version 1; (gROADSv1); NASA Socioeconomic Data and Applications Center (SEDAC): Palisades, NY, USA, 2013.
  41. Li, S.; Zhang, Y.; Wang, Z.; Li, L. Mapping human influence intensity in the Tibetan Plateau for conservation of ecological service functions. Ecosyst. Serv. 2018, 30, 276–286. [Google Scholar] [CrossRef]
  42. Elvidge, C.D.; Imhoff, M.L.; Baugh, K.E.; Hobson, V.R.; Nelson, I.; Safran, J.; Dietz, J.B.; Tuttle, B.T. Night-time lights of the world: 1994–1995. ISPRS J. Photogramm. 2001, 56, 81–99. [Google Scholar] [CrossRef]
  43. Du, H.; He, H.S.; Wu, Z.; Wang, L.; Zong, S.; Liu, J. Human influences on regional temperature change-comparing adjacent plains of China and Russia. Int. J. Climatol. 2016, 37, 2913–2922. [Google Scholar] [CrossRef]
  44. Wu, M.; He, H.S.; Zong, S.; Tan, X.; Du, H.; Zhao, D.; Liu, K.; Liang, Y. Topographic controls on vegetation changes in alpine tundra of the Changbai Mountains. Forests 2018, 9, 756. [Google Scholar] [CrossRef] [Green Version]
  45. Jin, H.; Yu, Q.; Lü, L.; Guo, D.; He, R.; Yu, S.; Sun, G.; Li, Y. Degradation of permafrost in the Xing’anling Mountains, northeastern China. Permafrost. Periglac. 2007, 18, 245–258. [Google Scholar] [CrossRef]
  46. Sun, J.; Li, X.Z.; Wang, X.W.; Lv, J.J.; Li, Z.M.; Hu, Y.M. Latitudinal pattern in species diversity and its response to global warming in permafrost wetlands in the Great Hing’an Mountains, China. Russ. J. Ecol. 2011, 42, 123–132. [Google Scholar] [CrossRef]
  47. Zhao, D.; He, H.; Wang, W.; Liu, J.; Du, H.; Wu, M.; Tan, X. Distribution and driving factors of forest swamp conversions in a cold temperate region. Int. J. Environ. Res. Public Health 2018, 15, 2103. [Google Scholar] [CrossRef] [Green Version]
  48. Serrão, E.A.S.; Nepstad, D.; Walker, R. Upland agricultural and forestry development in the Amazon: Sustainability, criticality and resilience. Ecol. Econ. 1996, 18, 3–13. [Google Scholar] [CrossRef]
  49. Foley, J.A.; Asner, G.P.; Costa, M.H.; Coe, M.T.; DeFries, R.; Gibbs, H.K.; Howard, E.A.; Olson, S.; Patz, J.; Ramankutty, N.; et al. Amazonia revealed: Forest degradation and loss of ecosystem goods and services in the Amazon Basin. Front. Ecol. Environ. 2007, 5, 25–32. [Google Scholar] [CrossRef]
  50. Zhu, G.; Su, Y.; Huang, G.; Feng, Q.; Liu, Z. Hydrogeochemical processes in the groundwater environment of Heihe River Basin, northwest China. Environ. Earth Sci. 2010, 60, 139–153. [Google Scholar]
  51. Werner, B.A.; Johnson, W.C.; Guntenspergen, G.R. Evidence for 20th century climate warming and wetland drying in the North American Prairie Pothole Region. Ecol. Evol. 2013, 3, 3471–3482. [Google Scholar] [CrossRef]
  52. Wrona, F.J.; Prowse, T.D.; Reist, J.D.; Hobbie, J.E.; Lévesque, L.M.J.; Vincent, W.F. Climate change effects on aquatic biota, ecosystem structure and function. AMBIO 2006, 35, 359–369. [Google Scholar] [CrossRef] [Green Version]
  53. Li, Y.; Hu, Y.; Chang, Y.; Zhou, R.; Hu, Z. A view to forest harvest policy from multiple-class management spatial analysis in Great Hing’an Mountains. J. Nat. Resour. 2009, 24, 11–19. [Google Scholar]
  54. Cui, W.; Mu, C.; Lu, H.; Bao, X.; Wang, B. Effects of draining for forestation on carbon storage of wetland ecosystem in Daxing’an Mountains of northeastern China. J. Beijing For. Univ. 2013, 35, 28–36. [Google Scholar]
  55. Wang, P.; Li, X.Y.; Wang, L.; Wu, X.; Hu, X.; Fan, Y.; Tong, Y. Divergent evapotranspiration partition dynamics between shrubs and grasses in a shrub-encroached steppe ecosystem. New Phytol. 2018, 219, 1325–1337. [Google Scholar] [CrossRef] [PubMed] [Green Version]
  56. Zhao, X.; Xu, L.; Jin, G. Effect of topography on shrub regeneration in a mixed broadleaved-Korean pine forest in the Xiaoxing’an Mountains. Biodiver. Sci. 2015, 23, 767–774. [Google Scholar] [CrossRef] [Green Version]
  57. Wang, Z.; Song, K.; Ma, W.; Ren, C.; Zhang, B.; Liu, D.; Chen, J.M.; Song, C. Loss and fragmentation of marshes in the Sanjiang Plain, Northeast China, 1954–2005. Wetlands 2011, 31, 945. [Google Scholar] [CrossRef]
Figure 1. Study area location with focal areas representing: typical area in the upper reaches of the HRB (TUHRB), typical area in the middle reaches of the basin (TMHRB), and typical area in the lower reaches of the basin (TLHRB).
Sustainability 12 00912 g001
Figure 2. Logical workflow used for this analysis.
Sustainability 12 00912 g002
Figure 3. The logical workflow used to map the human footprint.
Sustainability 12 00912 g003
Figure 4. The spatial distribution of wetland types within the typical areas of the upper, middle and lower reaches of the Heilongjiang river basin (HRB) in 1990, 2000 and 2010.
Sustainability 12 00912 g004
Figure 5. The spatial distribution of human footprints in in typical areas of upper, middle and lower reaches of the HRB in 1990, 2000 and 2010.
Sustainability 12 00912 g005
Figure 6. (a) Wetland loss rates in the TUHRB, TMHRB, and TLHRB during 1990–2000 and 2000–2010. (b) The spatial distribution of wetland affected by climate change or human activities in the TUHRB, TMHRB and TLHRB during 1990–2010.
Sustainability 12 00912 g006
Figure 7. (a) The relative importance of climate change and human activities on wetlands in the overall HRB, and sub-areas (TUHRB, TMHRB, TLHRB). (b) The relative importance of climate change and human activities on mild, moderate and severe levels of wetland loss in the overall HRB. (c) The relative importance of climate change and human activities on mild, moderate and severe levels of wetland loss in the overall HRB and sub-areas.
Sustainability 12 00912 g007
Figure 8. (a) The relative importance of climate change and human activities on herbaceous, shrub, and forested wetlands in the HRB, and the relative importance of climate change and human activities on herbaceous, shrub, and forested wetlands in (b) TUHRB, (c) TMHRB and (d) TLHRB.
Sustainability 12 00912 g008
Table 1. Human influence scores for different land use types.
Land-Use TypesDescriptionsScores
Built-up landRefers to land use in large, medium and small cities and built-up areas above county and town levels10
Rural settlementsRefers to rural settlements independent of cities and towns8
Reservoir/pondsRefers to the man-made facilities for water reservation8
CroplandRefers to lands for crops, including dry and paddy fields7
GrasslandRefers to lands for grassland, including sparse grassland, moderate grassland and dense grassland0
Forest landRefers to lands for woodland, including arbor, shrub and bamboo, etc.0
Natural WaterRefers to lands covered by natural water bodies, including stream, rivers, lakes, permanent ice0
Unused landRefers to lands that are not used, including bare land, sandy, saline alkali soil, Gobi and others0
Table 2. The area and proportion of herbaceous, shrub and forested wetlands in the the upper reaches of HRB (TUHRB), middle reaches of HRB (TMHRB) and lower reaches of HRB (TLHRB) for 1990, 2000 and 2010.
Study AreasWetland Types1990 (km2)2000 (km2)2010 (km2)Proportion (%)
TUHRBHerbaceous wetlands1181.211176.831175.1938.59
Shrub wetlands1389.591378.221371.1945.22
Forested Wetlands519.13499.12463.7216.19
TMHRBHerbaceous wetlands2695.082310.552190.0591.97
Shrub wetlands218.11196.54188.337.71
Forested Wetlands9.078.178.10.32
TLHRBHerbaceous wetlands5147.782867.991636.296.77
Shrub wetlands87.5369.5958.162.22
Forested Wetlands40.5835.4830.461.01
Table 3. Human footprints and mean values in the TUHRB, TMHRB and TLHRB for 1990, 2000 and 2010.
Study Areas199020002010Mean Value
TUHRB3.783.763.833.79
TMHRB6.117.017.156.76
TLHRB8.669.6910.79.68

