A Regression Tree Approach for Investigating the Impact of High Speed Rail on Tourists’ Choices


Abstract
1. Introduction
2. HSR and Tourism: Is There a Link?
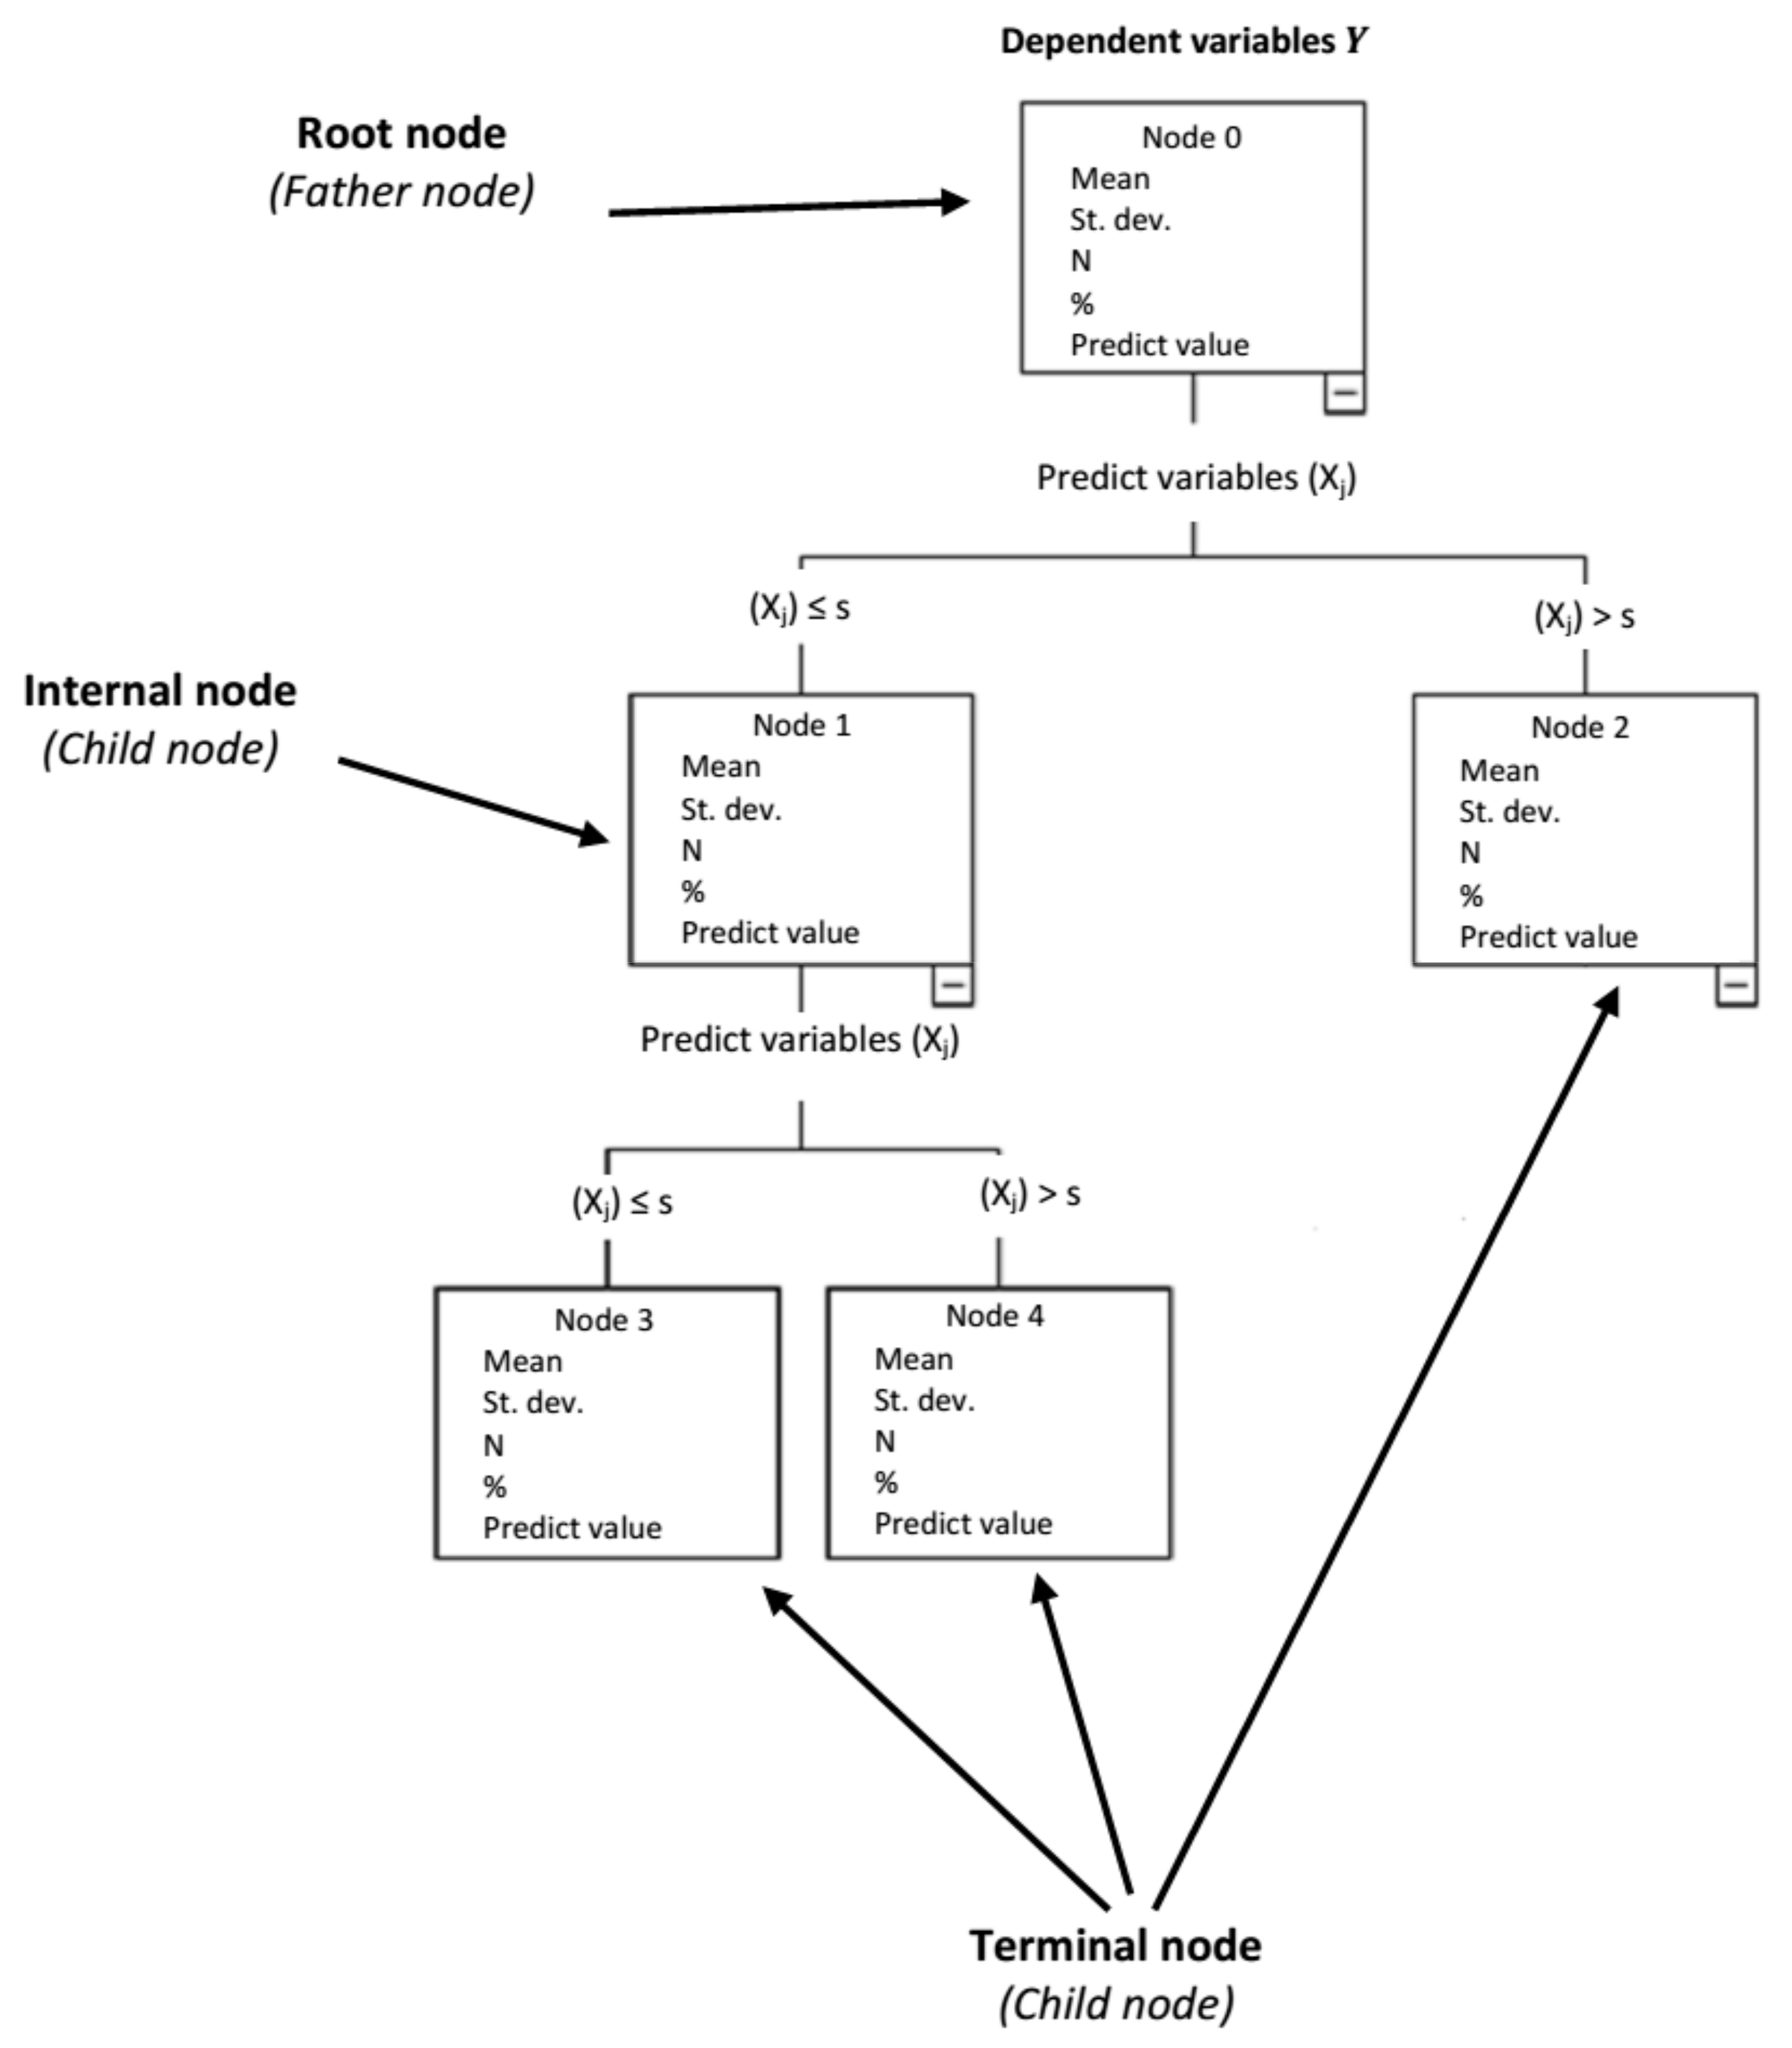
3. The Methodology
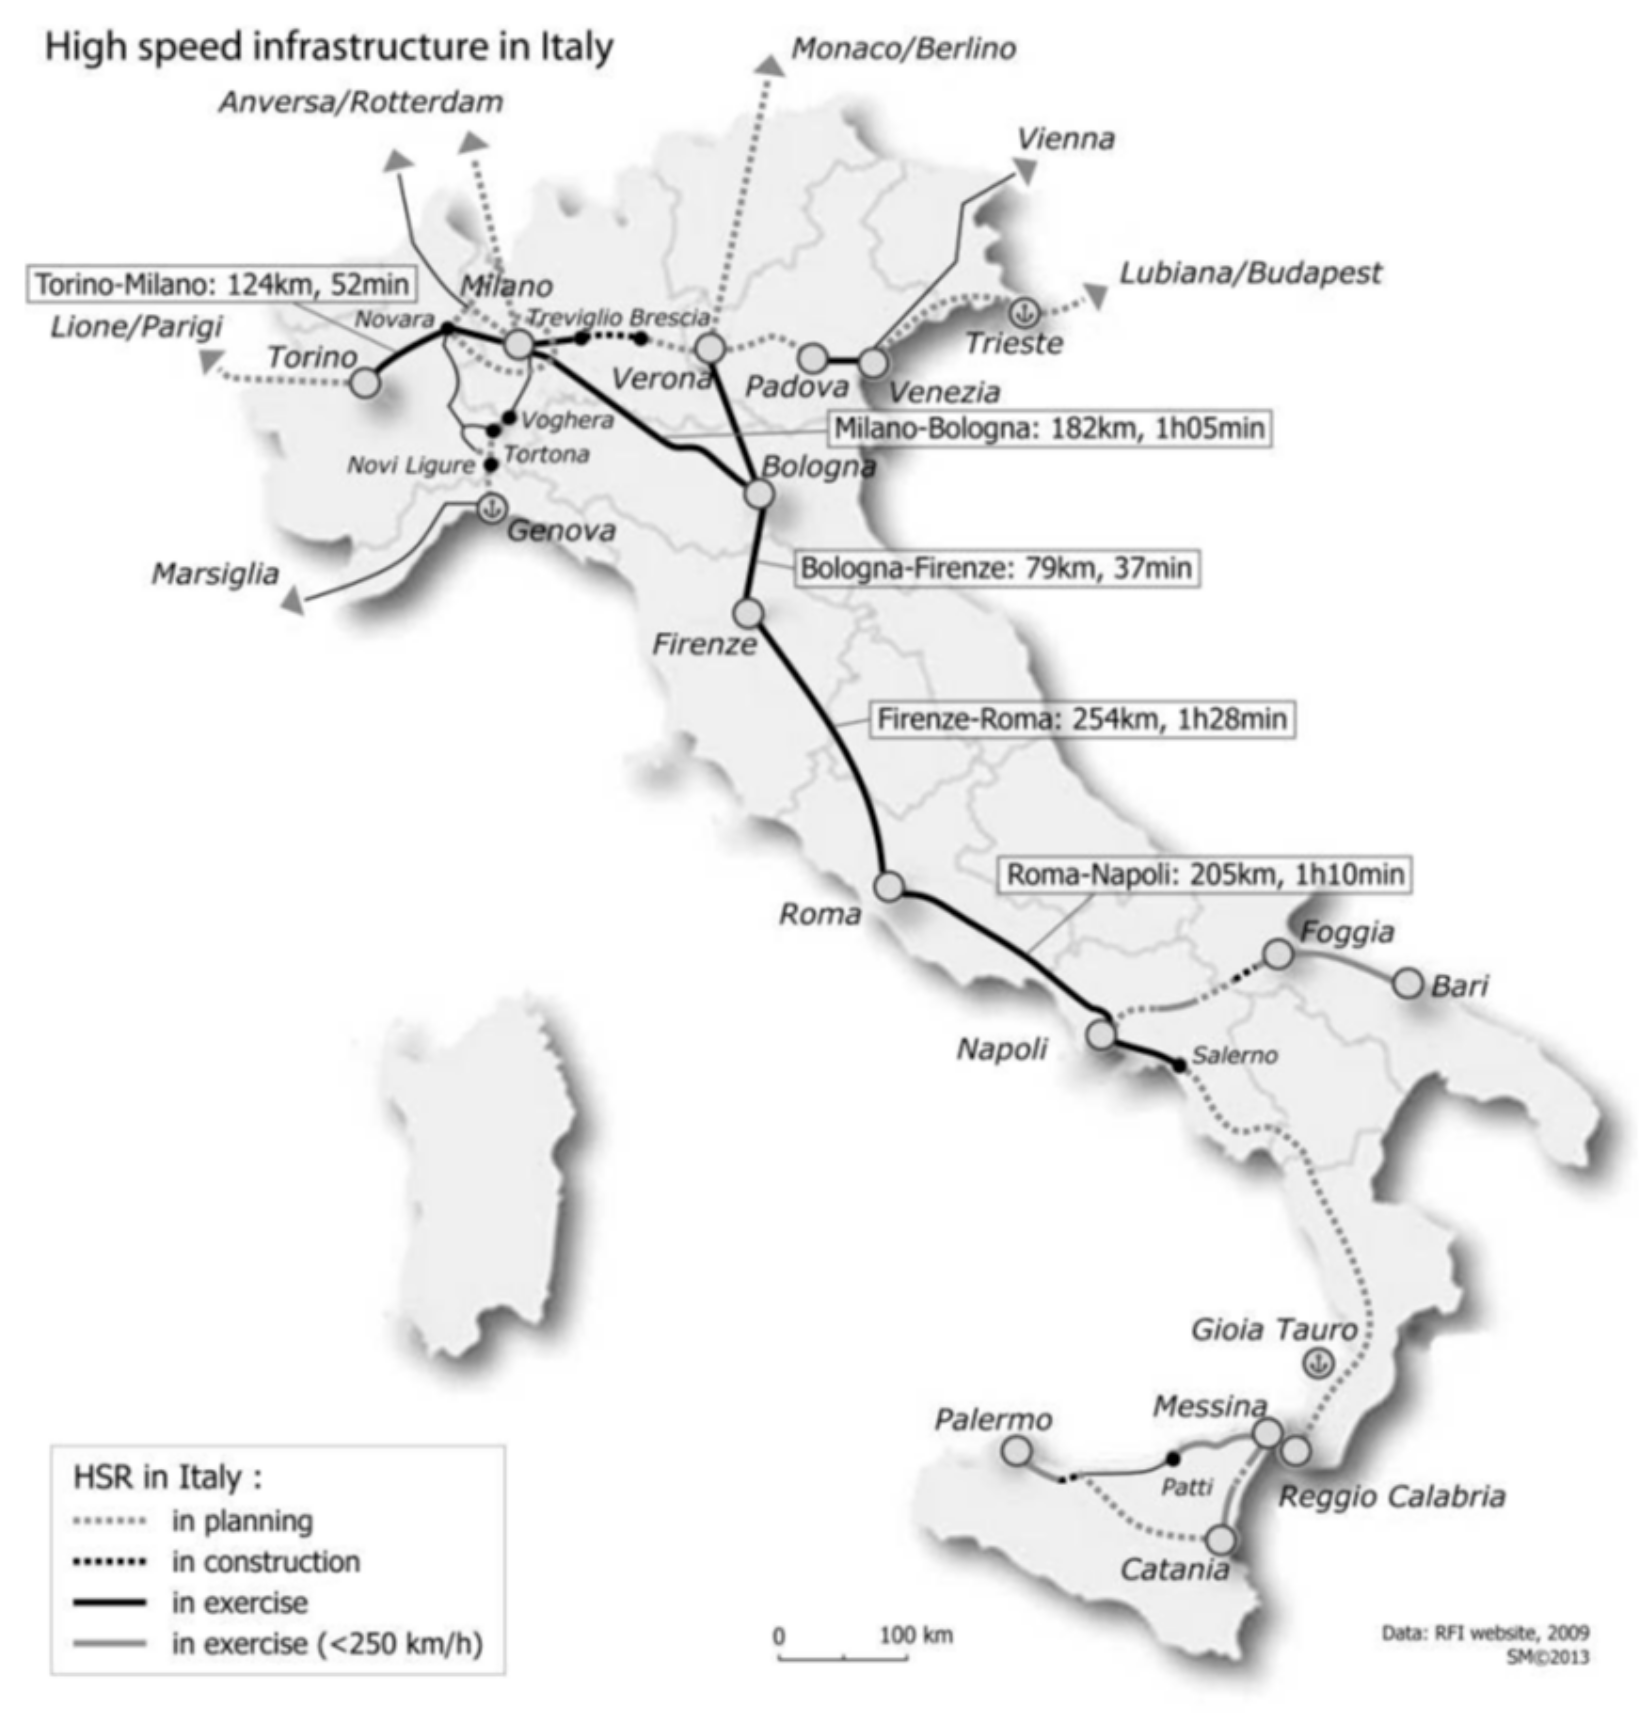
4. The Case Study
- ItalianTourist: no. of Italian Tourists, i.e., number of arrivals from other Italian provinces travelling for both tourism and business tourism purposes (Italian Census, ISTAT, www.istat.it);
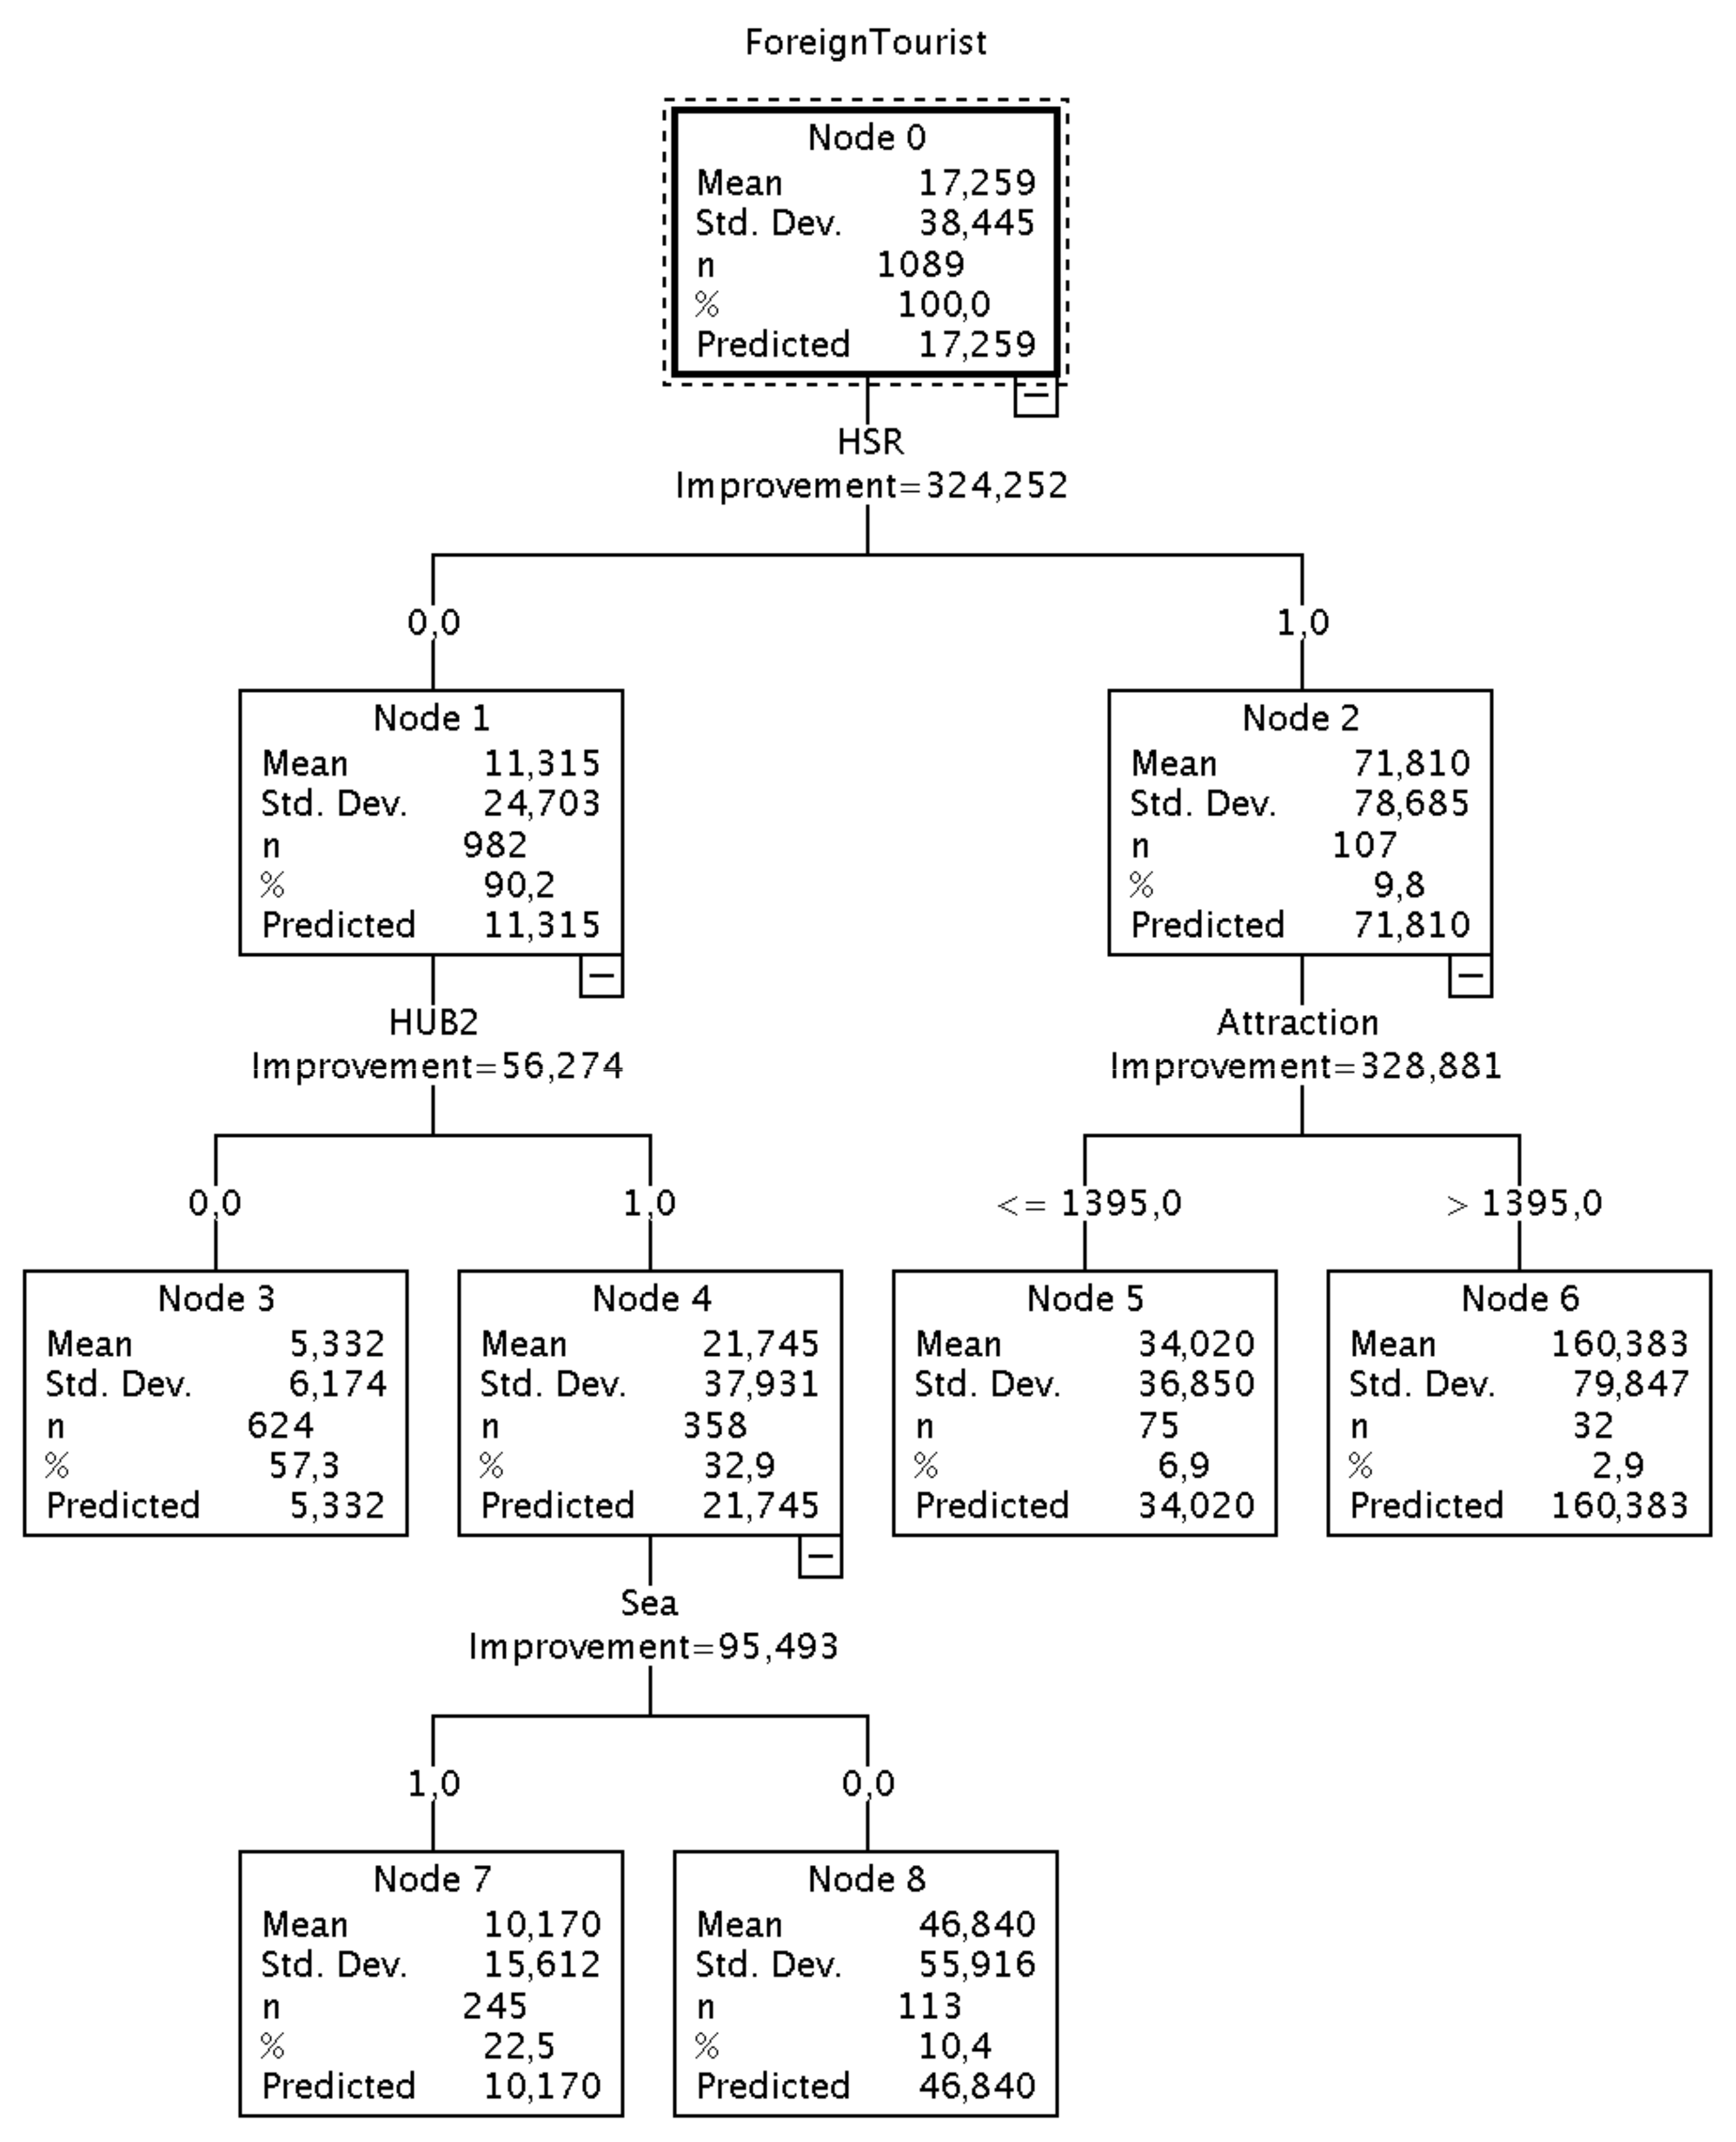
- ForeignTourist: no. of Foreign Tourists; number of arrivals from other countries travelling for both tourism and business tourism purposes (Italian Census, ISTAT, www.istat.it);
- Overnights_Italian: no. of nights spent in tourist installations by Italian tourists (nights—hundreds of thousands—Census data);
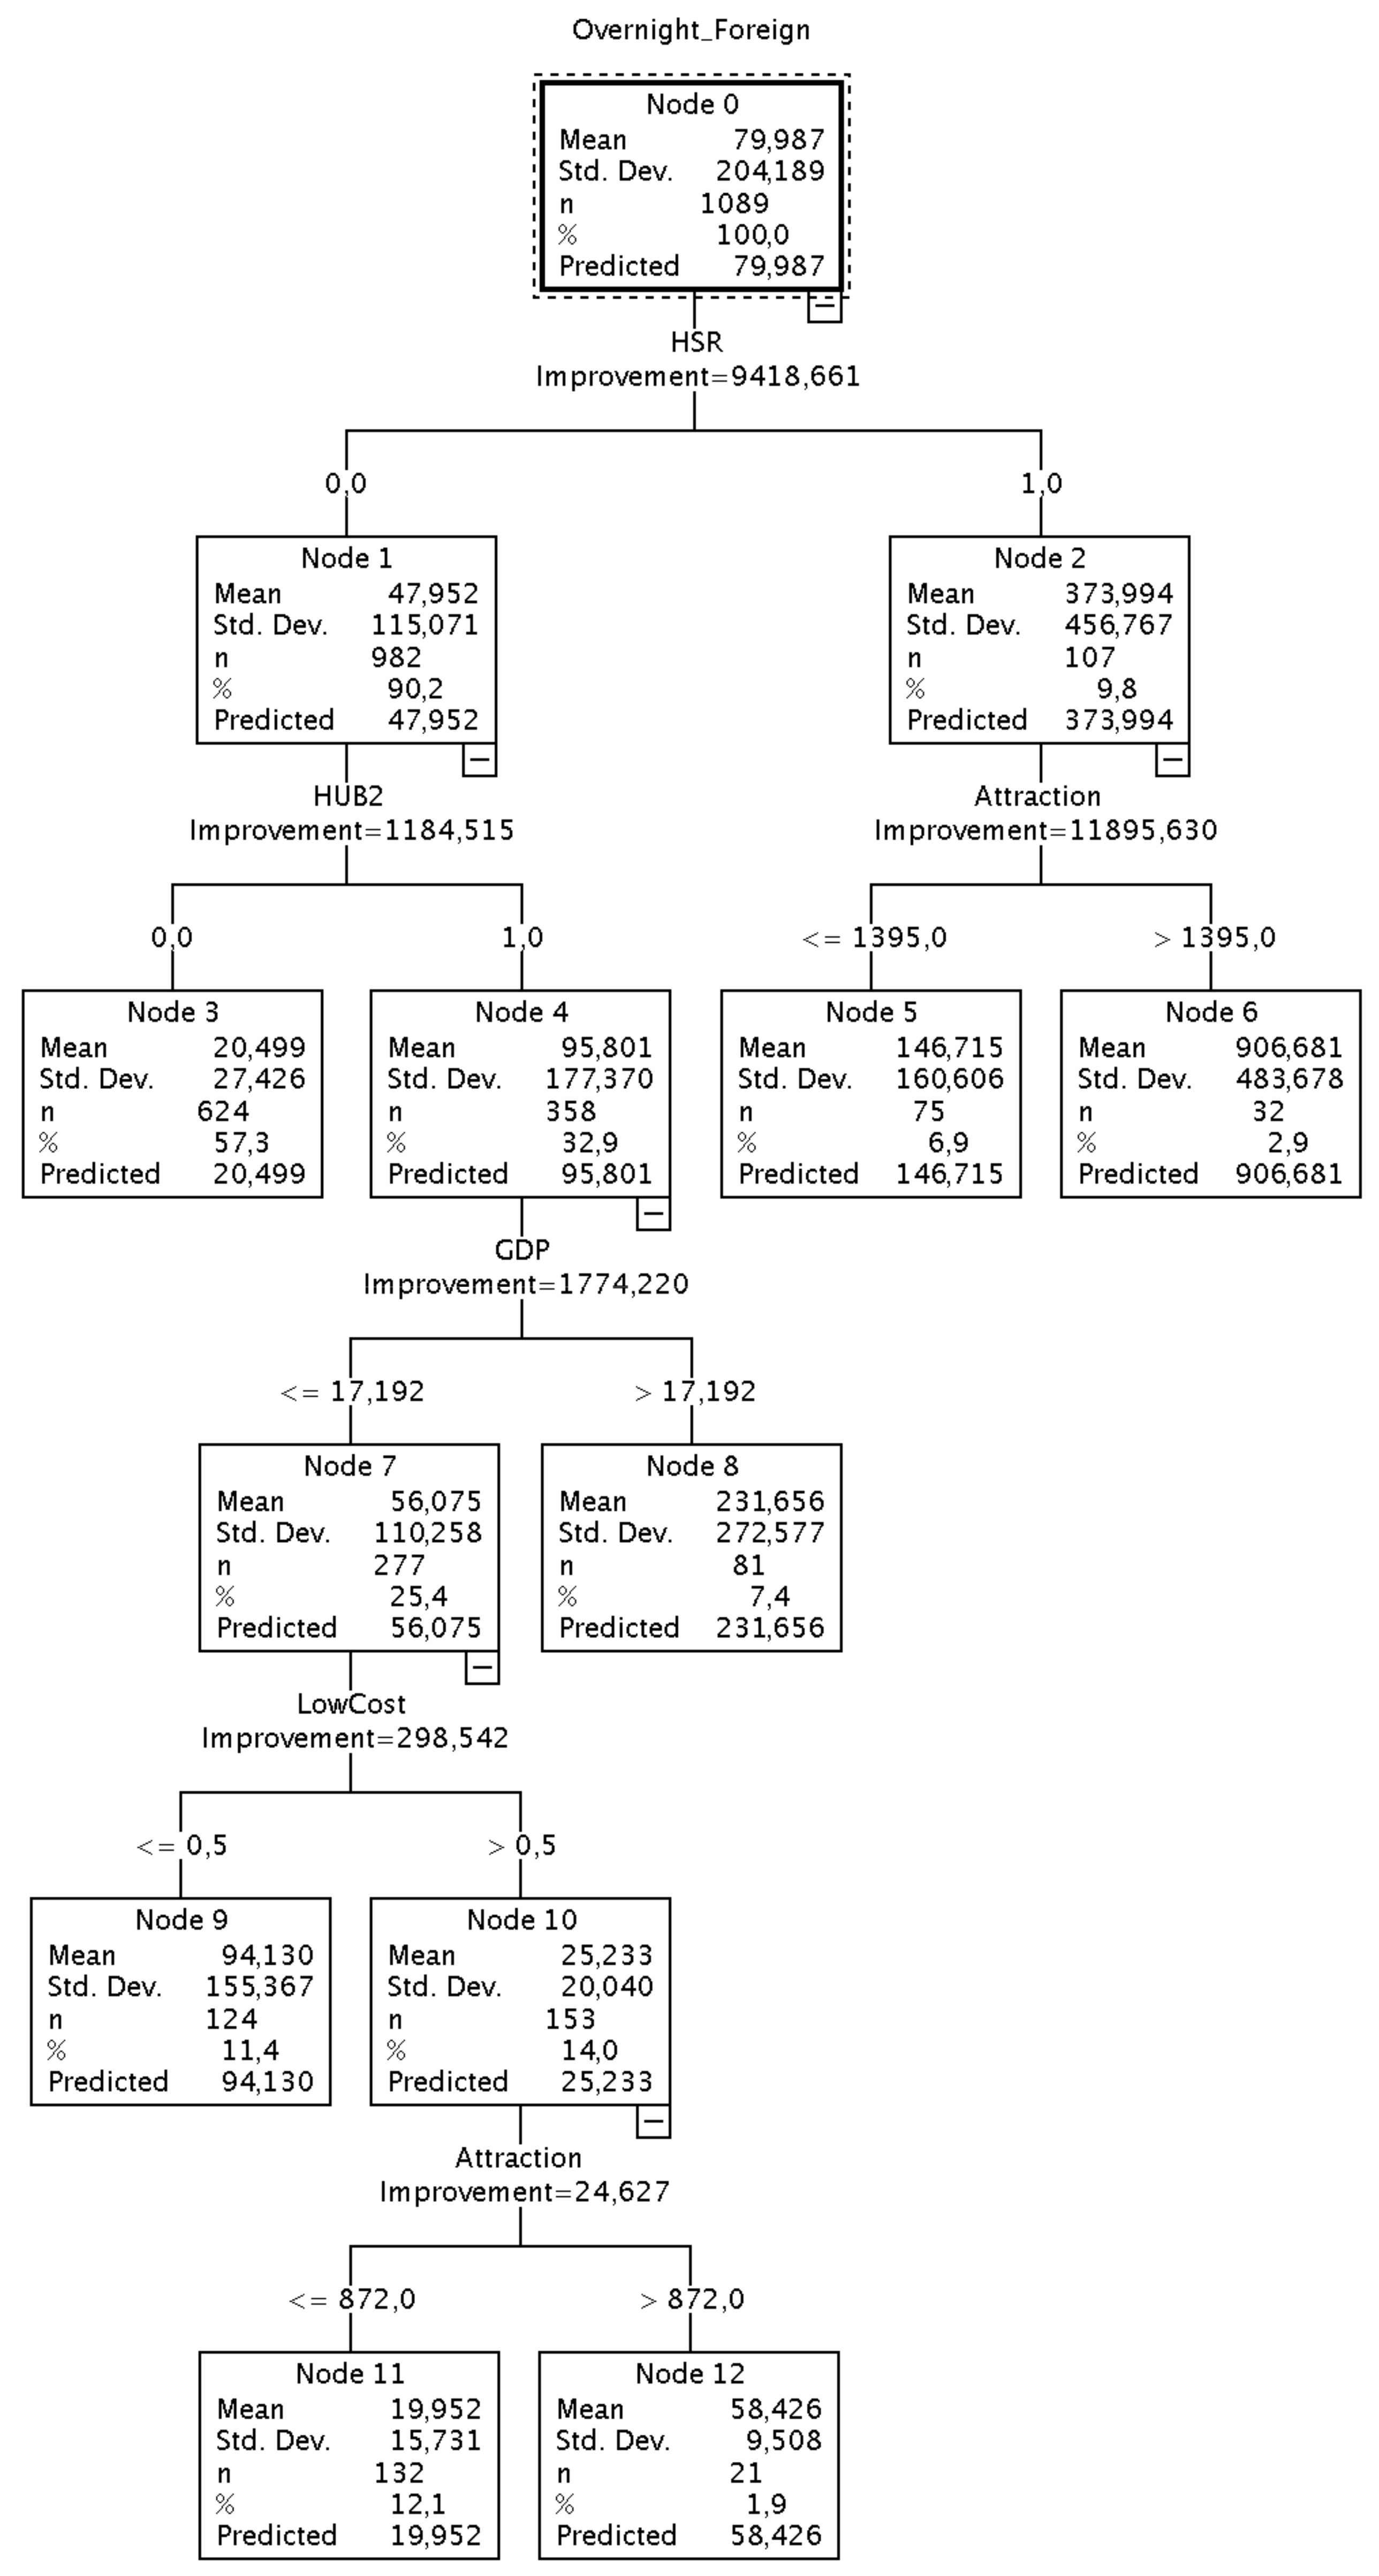
- Overnights_Foreign: no. of nights spent in tourist installations by Foreign tourists (hundreds of thousands—Census data).
- Transportation systems variables
- HSR is a dummy variable assuming Value 1 if the HSR is present, 0 if otherwise;
- HUB2 is a dummy variable assuming Value 1 if the airport is not a first level hub; 0 if otherwise;
- LowCost: no. of operating bases of low-cost airlines.
- Attractiveness variables
- GDP is the Gross Domestic Product of the province (Italian Census, ISTAT, www.istat.it);
- Attraction: is the no. of activities in a given province (sum of museums, historical sites, etc., information collected through different websites);
- Sea is a dummy variable assuming Value 1 if the province is close to the sea; 0 if otherwise;
- POP is the number of inhabitants in a given province (hundreds of thousands—Census data);
- Unemployment: percentage of unemployed in a given province (Census data).
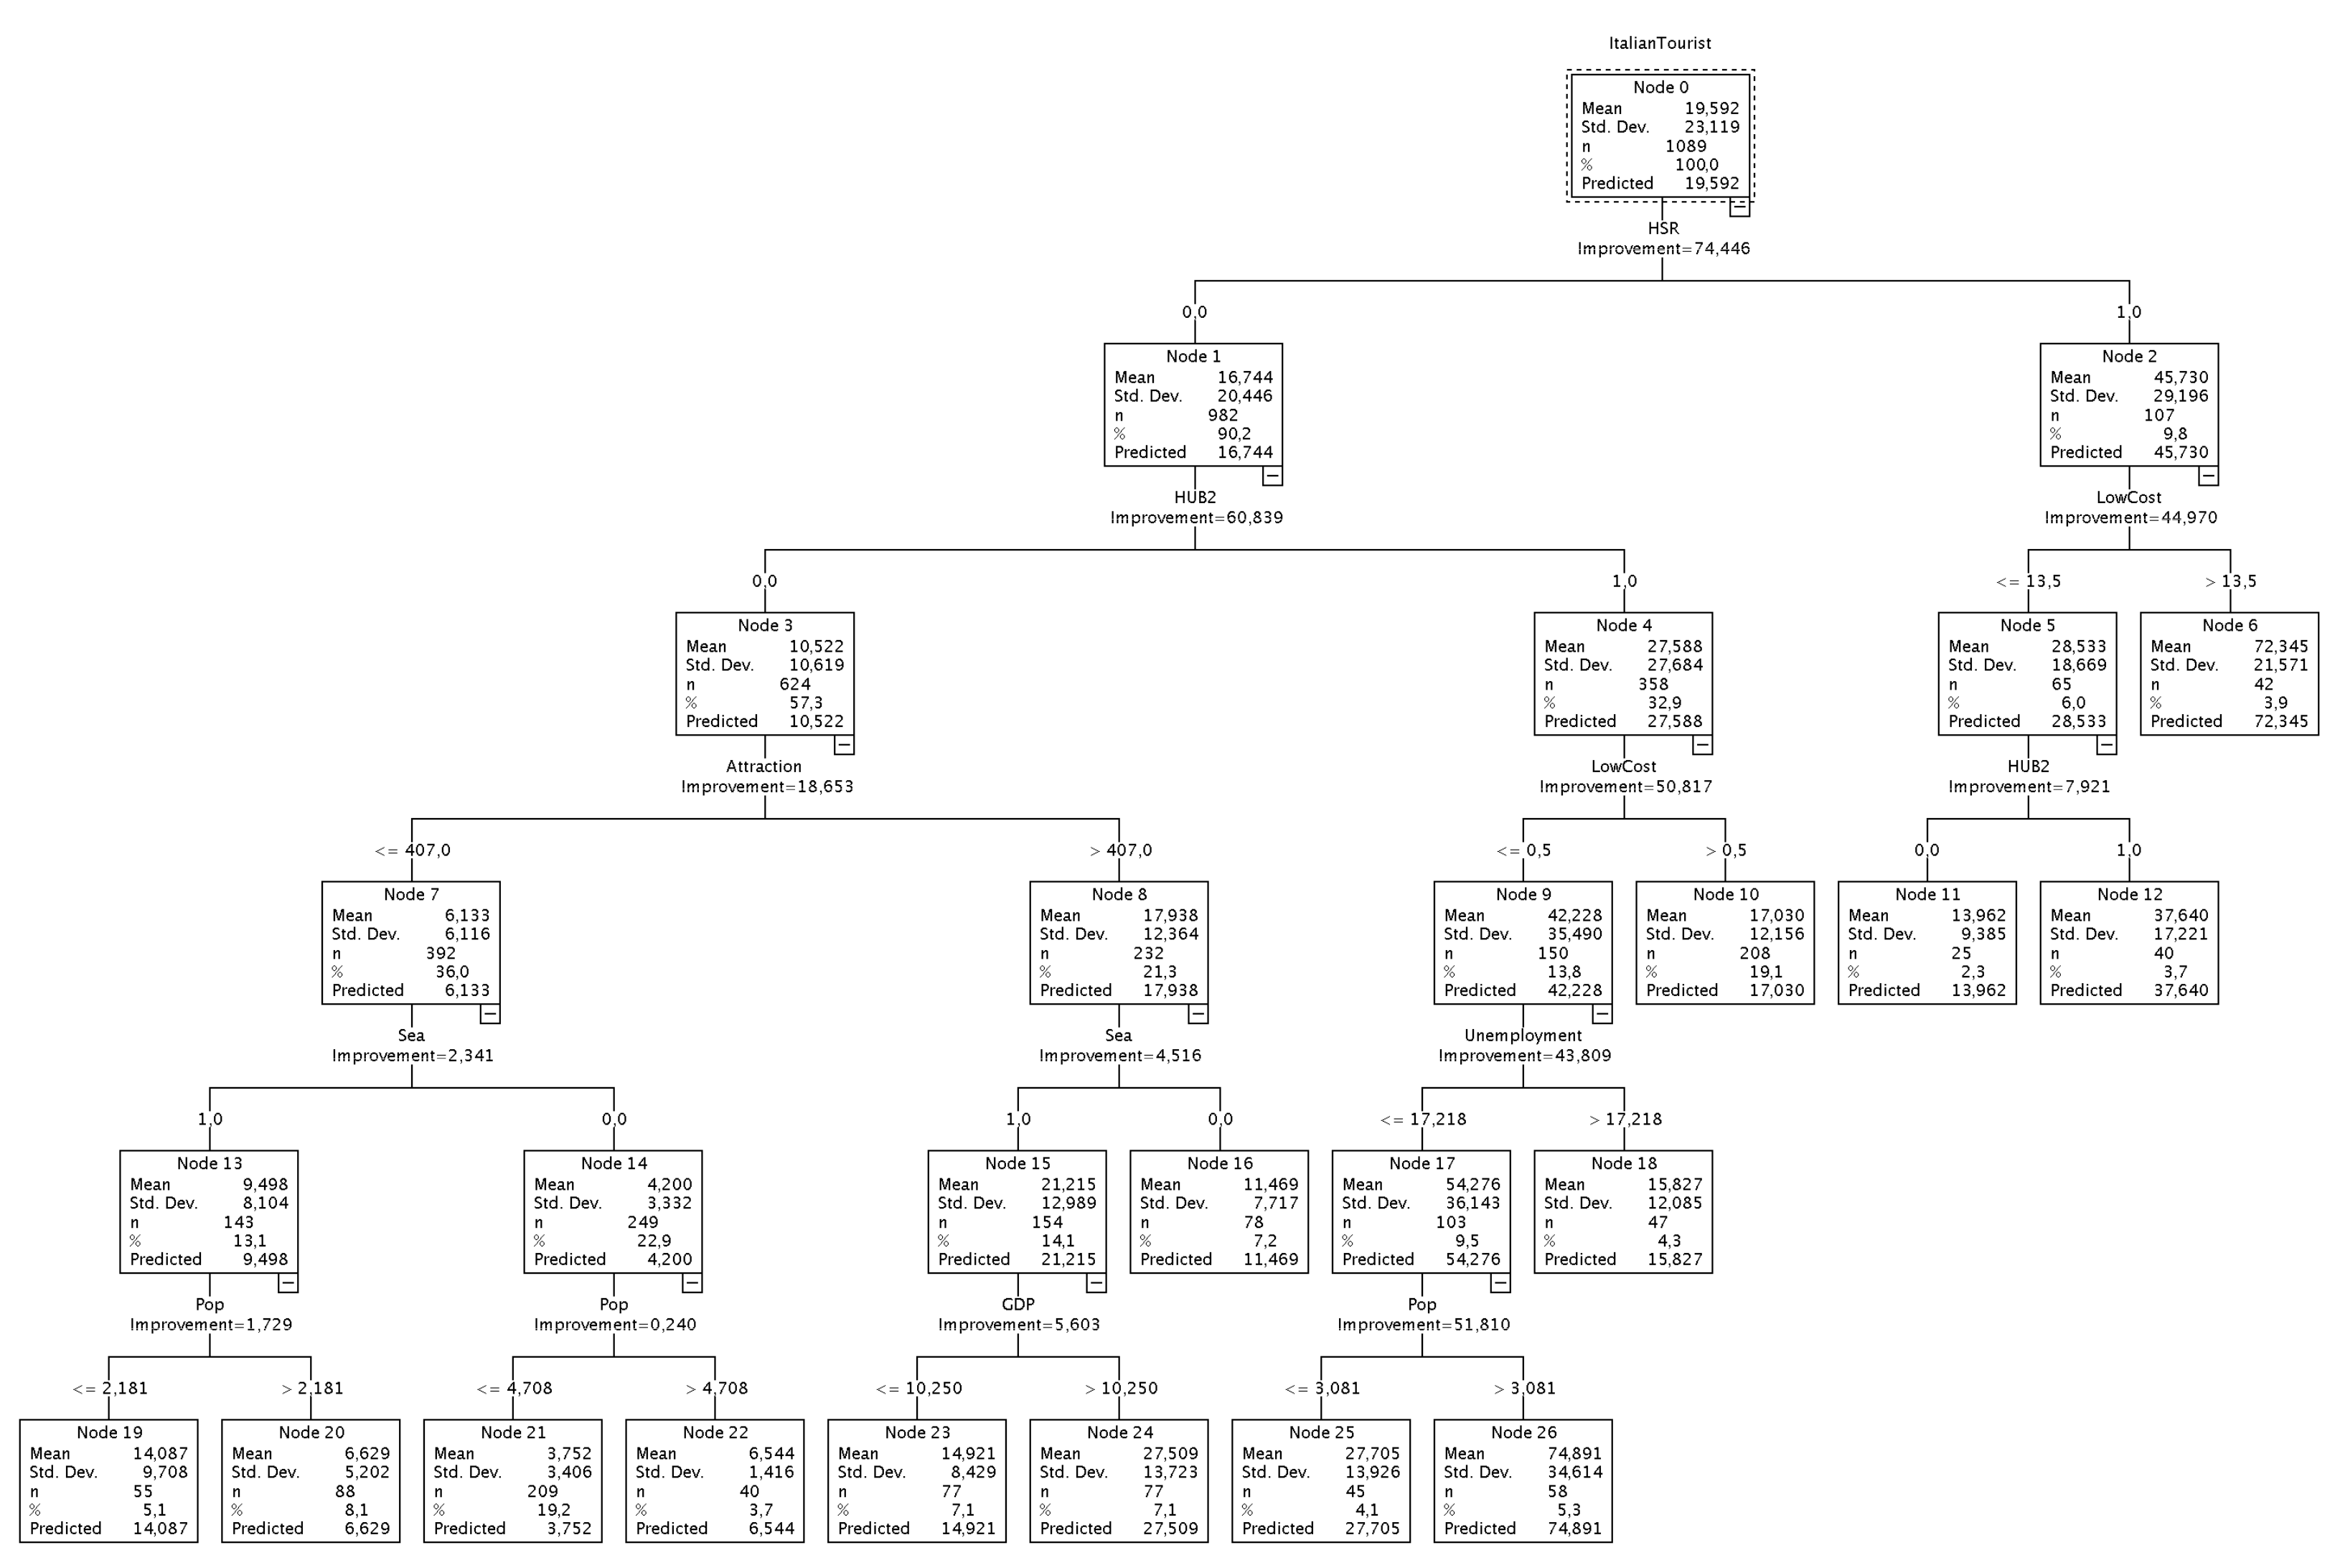
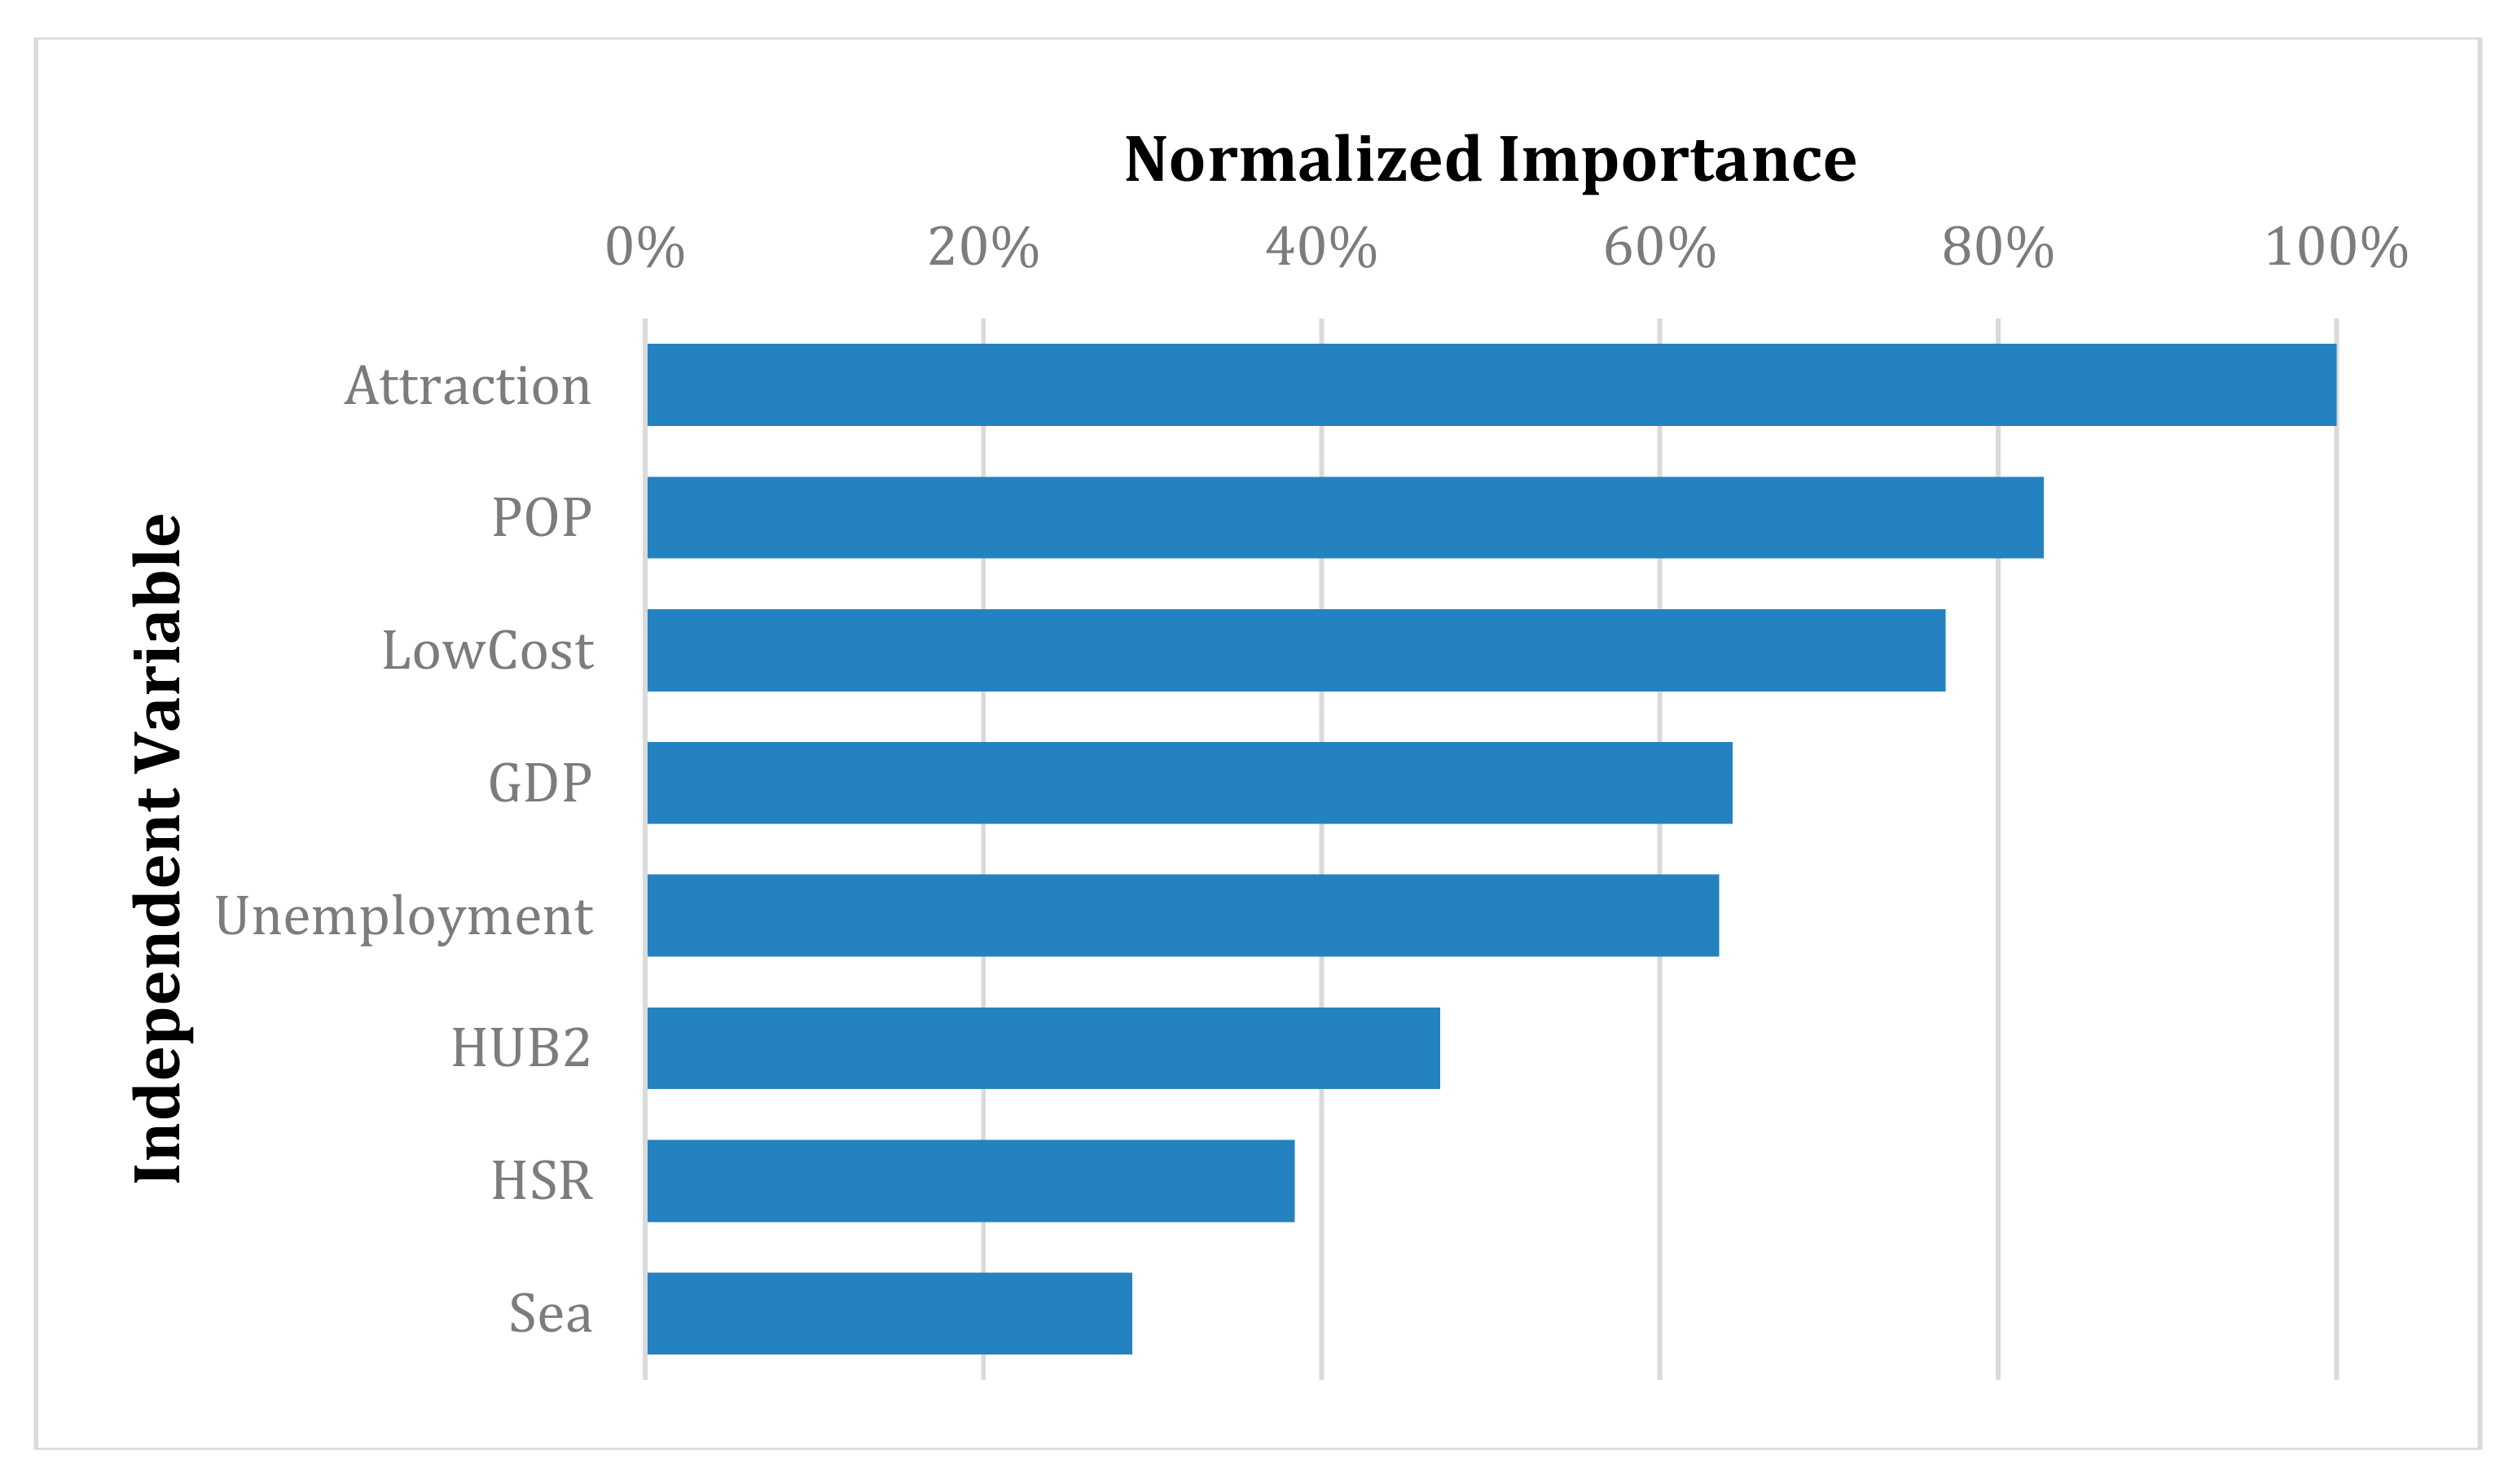
5. Results and Discussion
6. Conclusions and Further Perspectives
Author Contributions
Funding
Conflicts of Interest
References
- Hunt, J.D. Image as a factor in tourism development. J. Travel. Res. 1975, 13, 1–7. [Google Scholar] [CrossRef]
- Kim, H. Perceived attractiveness of Korean destinations. Ann. Tourism Res. 1998, 25, 340–361. [Google Scholar]
- Jha, S.M. Tourism Marketing, Bombay; Himalaya Publishing House: Delhi, India, 1995. [Google Scholar]
- Das, D.; Sharma, S.K.; Mohapatra, P.K.; Sarkar, A. Factors influencing the attractiveness of a tourist destination: A case study. J. Serv. Res. 2007, 7, 103–134. [Google Scholar]
- Kaul, R.N. Dynamics of Tourism: A Trilogy; Sterling Publishers Private Limited: New Delhi, India, 1985. [Google Scholar]
- Khadaroo, J.; Seetanah, B. The role of transport infrastructure in international tourism development: A gravity model approach. Tour. Manag. 2008, 29, 831–840. [Google Scholar] [CrossRef]
- Guirao, B.; Campa, J.L. The effects of tourism on HSR: Spanish empirical evidence derived from a multi-criteria corridor selection methodology. J. Transp. Geogr. 2015, 47, 37–46. [Google Scholar] [CrossRef]
- Cascetta, E.; Papola, A.; Pagliara, F.; Marzano, V. Analysis of mobility impacts of the high speed Rome–Naples rail link using withinday dynamic mode service choice models. J. Transp. Geogr. 2011, 19, 635–643. [Google Scholar] [CrossRef]
- Pagliara, F.; Mauriello, F.; Garofalo, A. Exploring the interdependences between High Speed Rail systems and tourism: Some evidence from Italy. Transp. Res. Part A: Policy Pr. 2017, 106, 300–308. [Google Scholar] [CrossRef]
- Delaplace, M.; Pagliara, F.; La Pietra, A. Does high-speed rail affect destination choice for tourism purpose? Disneyland Paris and Futuroscope case studies. Belgeo 2016, 3, 1–23. [Google Scholar]
- Pagliara, F.; Mauriello, F. Modelling the impact of High Speed Rail on tourists with Geographically Weighted Poisson Regression. Transp. Res. Part A: Policy Pr. 2020, 132, 780–790. [Google Scholar] [CrossRef]
- Della Corte, V.; Piras, A.; Zamparelli, G. Brand and image: The strategic factors in destination marketing. Int. J. Leis. Tour. Mark. 2010, 1, 358. [Google Scholar] [CrossRef]
- Coronado, J.M.; Garmendia, M.; Moyano, A.; Ureña, J.M. Assessing Spanish HSR network utility for same-day tourism. Rech. Transp. Secur. 2013, 29, 161–175. [Google Scholar] [CrossRef][Green Version]
- Mimeur, C.; Facchinetti-Mannone, V.; Carroue, G.; Berion, P. Les stratégies de développement touristique des territoires de l’espace Rhin-Rhône: Une nouvelle cohérence impulsée par le TGV? Recherche Transport et Sécurité 2013, 29, 193–210. [Google Scholar] [CrossRef]
- Delaplace, M.; Perrin, J. Multiplication des dessertes TGV et Tourismes urbains et d’affaires, Regards croisés sur la Province et l’Ile de France. Recherche Transport et Sécurité 2013, 29, 177–191. [Google Scholar] [CrossRef]
- Bazin, S.; Beckerich, C.; Delaplace, M. Desserte TGV et villes petites et moyennes, une illustration par le cas du tourisme à Arras, Auray, Charleville-Mézières et Saverne. Les Cahiers Scientifiques du Transport 2013, 63, 33–62. [Google Scholar]
- Wang, X.; Huang, S.; Zou, T.; Yan, H. Effects of the high speed rail network on China’s regional tourism development. Tour. Manag. Perspect. 2012, 1, 34–38. [Google Scholar] [CrossRef]
- Chen, X. Assessing the Impacts of High Speed Rail Development in China’s Yangtze River Delta Megaregion. J. Transp. Technol. 2013, 3, 113–122. [Google Scholar] [CrossRef]
- Bazin, S.; Delaplace, M. Desserte ferroviaire à grande vitesse et tourisme: Entre accessibilité, image et outil de coordination. Teoros 2013, 2, 37–46. [Google Scholar]
- Cvelbar, L.K.; Dwyer, L.M.; Koman, M.; Mihalič, T. Drivers of Destination Competitiveness in Tourism: A Global Investigation. J. Travel Res. 2016, 8, 1041–1050. [Google Scholar] [CrossRef]
- Bazin, S.; Beckerich, C.; Delaplace, M. High Speed Railway, Service Innovations and Urban and Business Tourisms Development. In Economics and Management of Tourism: Trends and Recent Developments; Collecçao Manuais; Sarmento, M.A., Matias, A., Eds.; Universidade Luisiada Editora: Lisbon, Portugal, 2011. [Google Scholar]
- Chen, Z.; Haynes, K.E. Tourism Industry and High Speed Rail - Is There a Linkage: Evidence from China’s High Speed Rail Development. GMU School of Public Policy Research Paper No. 2012-14. Available online: https://ssrn.com/abstract=2130830 (accessed on 25 January 2020).
- Kurihara, T.; Wu, L. The Impact of High Speed Rail on Tourism Development: A Case Study of Japan. Open Transp. J. 2016, 10, 35–44. [Google Scholar] [CrossRef]
- Giurao, B.; Soler, F. Impacts of the new high-speed service on small touristic cities: The case of Toledo, in The Sustainable City V. Urban Regeneration and Sustainability. Wessex Trans. Ecol. Environ. 2008, 117, 465–473. [Google Scholar]
- Campa, J.L.; López-Lambas, M.E.; Guirao, B. High speed rail effects on tourism: Spanish empirical evidence derived from China’s modelling experience. J. Transp. Geogr. 2016, 57, 44–54. [Google Scholar] [CrossRef]
- Albalate, D.; Fageda, X. High speed rail and tourism: Empirical evidence from Spain. Transp. Res. Part A: Policy Pr. 2016, 85, 174–185. [Google Scholar] [CrossRef]
- Albalate, D.; Campos, J.; Jiménez, J.L. Tourism and high speed rail in Spain: Does the AVE increase local visitors? Ann. Tour. Res. 2017, 65, 71–82. [Google Scholar] [CrossRef]
- Sun, Y.-Y.; Lin, Z.-W. Move fast, travel slow: The influence of high-speed rail on tourism in Taiwan. J. Sustain. Tour. 2017, 26, 433–450. [Google Scholar] [CrossRef]
- Wang, D.-G.; Niu, Y.; Qian, J. Evolution and optimization of China’s urban tourism spatial structure: A high speed rail perspective. Tour. Manag. 2018, 64, 218–232. [Google Scholar] [CrossRef]
- Seddighi, H.; Theocharous, A. A model of tourism destination choice: A theoretical and empirical analysis. Tour. Manag. 2002, 23, 475–487. [Google Scholar] [CrossRef]
- Barros, C.P.; Assaf, A.G. Analyzing Tourism Return Intention to an Urban Destination. J. Hosp. Tour. Res. 2012, 36, 216–231. [Google Scholar] [CrossRef]
- Delaplace, M.; Pagliara, F.; Perrin, J.; Mermet, S. Can High Speed Rail Foster the Choice of Destination for Tourism Purpose? Procedia Soc. Behav. Sci. 2014, 111, 166–175. [Google Scholar] [CrossRef]
- Pagliara, F.; Delaplace, M.; Vassallo, J.M. High-speed trains and tourists: What is the link? In Evidence from the French and Spanish Capitals. In proceedings of the conference Urban Transport XX—Urban Transport and the Environment in the 21st century, England, UK; WIT Press: Southampton, UK, 2014; Volume 138, pp. 17–27. [Google Scholar]
- Pagliara, F.; La Pietra, A.; Gomez, J.; Vassallo, J.M. High Speed Rail and the tourism market: Evidence from the Madrid case study. Transp. Policy 2015, 37, 187–194. [Google Scholar] [CrossRef]
- Curtis, P.G.; Kokotos, D.X. A Decision Tree Application in Tourism-based Regional Economic Development. MPRA paper no. 25302. Available online: http://mpra.ub.uni-muenchen.de/25302/.2008 (accessed on 25 January 2020).
- Legoherel, P.; Wong, K.K.F. Market Segmentation in the Tourism Industry and Consumers’ Spending. J. Travel Tour. Mark. 2006, 20, 15–30. [Google Scholar] [CrossRef]
- Fitzmaurice, G.M.; Laird, N.M.; Ware, J.H. Applied Longitudinal Analysis; John Wiley & Sons: Hoboken, NJ, USA, 2012. [Google Scholar]
- Chang, L.-Y.; Chen, W.-C. Data mining of tree-based models to analyze freeway accident frequency. J. Saf. Res. 2005, 36, 365–375. [Google Scholar] [CrossRef] [PubMed]
- Galimberti, G.; Montanari, A. Regression Trees for Longitudinal Data with Time-Dependent Covariates. In Studies in Classification, Data Analysis, and Knowledge Organization; Jajuga, K., Sokolowski, A., Bock, H.-H., Eds.; Springer: Berlin/Heidelberg, Germany, 2002; pp. 391–398. [Google Scholar]
- Sela, R.J.; Simonoff, J.S. RE-EM trees: A data mining approach for longitudinal and clustered data. Mach. Learn. 2012, 86, 169–207. [Google Scholar] [CrossRef]
- Barros, R.C.; De Carvalho, A.C.; Freitas, A.A. Automatic Design of Decision-Tree Induction Algorithms; Springer Science and Business Media LLC.: Berlin/Heidelberg, Germany, 2015. [Google Scholar]
- D’Ambrosio, A.; Heiser, W.J. A Recursive Partitioning Method for the Prediction of Preference Rankings Based Upon Kemeny Distances. Psychometrika 2016, 81, 774–794. [Google Scholar] [CrossRef] [PubMed]
- D’Ambrosio, A.; Aria, M.; Siciliano, R. Robust Tree-Based Incremental Imputation Method for Data Fusion. In Proceedings of the Computer Vision—ECCV 2012, Florence, Italy, 7–13 October 2012; Springer Science and Business Media LLC.: Berlin/Heidelberg, Germany, 2007; Volume 4723, pp. 174–183. [Google Scholar]
- Han, J.; Pei, J.; Kamber, M. Data Mining: Concepts and Techniques; Elsevier: Waltham, MA, USA, 2011. [Google Scholar]
- Gatnar, E. Tree-Based Models in Statistics: Three Decades of Research; Springer: New York, NY, USA, 2002. [Google Scholar]
- Gordon, A.D.; Breiman, L.; Friedman, J.H.; Olshen, R.A.; Stone, C.J. Classification and Regression Trees; CRC Press: Boca Raton, FL, USA, 1984. [Google Scholar]
- James, G.; Witten, D.; Hastie, T.; Tibshirani, R. An Introduction to Statistical Learning; Springer: New York, NY, USA, 2013. [Google Scholar]
- Yohannes, Y.; Webb, P. Classification and Regression Trees, CART: A User Manual for Identifying Indicators of Vulnerability to Famine and Chronic Food Insecurity; The International Food Policy Research Institute: Washington, DC, USA, 1999; Volume 3. [Google Scholar]
- Montella, A.; Aria, M.; D’Ambrosio, A.; Mauriello, F. Analysis of powered two-wheeler crashes in Italy by classification trees and rules discovery. Accid. Anal. Prev. 2012, 49, 58–72. [Google Scholar] [CrossRef] [PubMed]
- Ishwaran, H. Variable importance in binary regression trees and forests. Electron. J. Stat. 2007, 1, 519–537. [Google Scholar] [CrossRef]
- Pham, H. Springer Handbook of Engineering Statistics; Springer Science & Business Media: Berlin, Germany, 2006. [Google Scholar]
- Therneau, T.M.; Atkinson, E.J. An Introduction to Recursive Partitioning Using the RPART Routines. Available online: https://r.789695.n4.nabble.com/attachment/3209029/0/zed.pdf (accessed on 25 January 2020).
- Ping, Y.; Pagliara, F.; Wilson, A. How Does High-Speed Rail Affect Tourism? A Case Study of the Capital Region of China. Sustainability 2019, 11, 472. [Google Scholar] [CrossRef]
- Campa, J.L.; Pagliara, F.; Lopez-Lambas, M.E.; Arce, R.; Guirao, B. Impact of High-Speed Rail on Cultural Tourism Development: The Experience of the Spanish Museums and Monuments. Sustainability 2019, 11, 5845. [Google Scholar] [CrossRef]


| Tourism Trend | 2006 | 2007 | 2008 | 2009 | 2010 | 2011 | 2012 | 2013 | 2014 | 2015 | 2016 | 2017 |
|---|---|---|---|---|---|---|---|---|---|---|---|---|
| Italians | 172.4 | 171.2 | 166.5 | 165.5 | 165.5 | 166.4 | 158.2 | 155.0 | 180.9 | 190.2 | 203.5 | 209.3 |
| Foreigners | 142.3 | 148.3 | 147.8 | 145.8 | 151.6 | 161.1 | 164.9 | 167.9 | 176.8 | 182.6 | 199.4 | 210.7 |
| Total | 314.7 | 319.5 | 314.3 | 311.3 | 317.1 | 327.5 | 323.1 | 322.9 | 357.7 | 372.8 | 402.9 | 420.7 |
| Variable | Minimum | Maximum | Mean | Std. Dev. |
|---|---|---|---|---|
| ItalianTourist | 0.33 | 122.90 | 19.59 | 23.12 |
| ForeignTourist | 0.08 | 252.92 | 17.26 | 38.44 |
| Overnights_Italian | 0.08 | 894.21 | 87.24 | 129.33 |
| Overnights_Foreign | 0.10 | 1,463.61 | 79.99 | 204.19 |
| HSR | ||||
| POP | 0.86 | 43.40 | 5.87 | 6.29 |
| Low-Cost | 0.00 | 19.00 | 2.00 | 4.64 |
| HUB2 | ||||
| GDP | 1.60 | 138.40 | 15.84 | 19.49 |
| Unemployment | 2.10 | 269.58 | 22.55 | 29.99 |
| Sea | ||||
| Attract | 49.00 | 1,981.00 | 526.77 | 372.88 |
© 2020 by the authors. Licensee MDPI, Basel, Switzerland. This article is an open access article distributed under the terms and conditions of the Creative Commons Attribution (CC BY) license (http://creativecommons.org/licenses/by/4.0/).
Share and Cite
Pagliara, F.; Mauriello, F.; Russo, L. A Regression Tree Approach for Investigating the Impact of High Speed Rail on Tourists’ Choices. Sustainability 2020, 12, 910. https://doi.org/10.3390/su12030910
Pagliara F, Mauriello F, Russo L. A Regression Tree Approach for Investigating the Impact of High Speed Rail on Tourists’ Choices. Sustainability. 2020; 12(3):910. https://doi.org/10.3390/su12030910
Chicago/Turabian StylePagliara, Francesca, Filomena Mauriello, and Lucia Russo. 2020. "A Regression Tree Approach for Investigating the Impact of High Speed Rail on Tourists’ Choices" Sustainability 12, no. 3: 910. https://doi.org/10.3390/su12030910
APA StylePagliara, F., Mauriello, F., & Russo, L. (2020). A Regression Tree Approach for Investigating the Impact of High Speed Rail on Tourists’ Choices. Sustainability, 12(3), 910. https://doi.org/10.3390/su12030910