1. Introduction
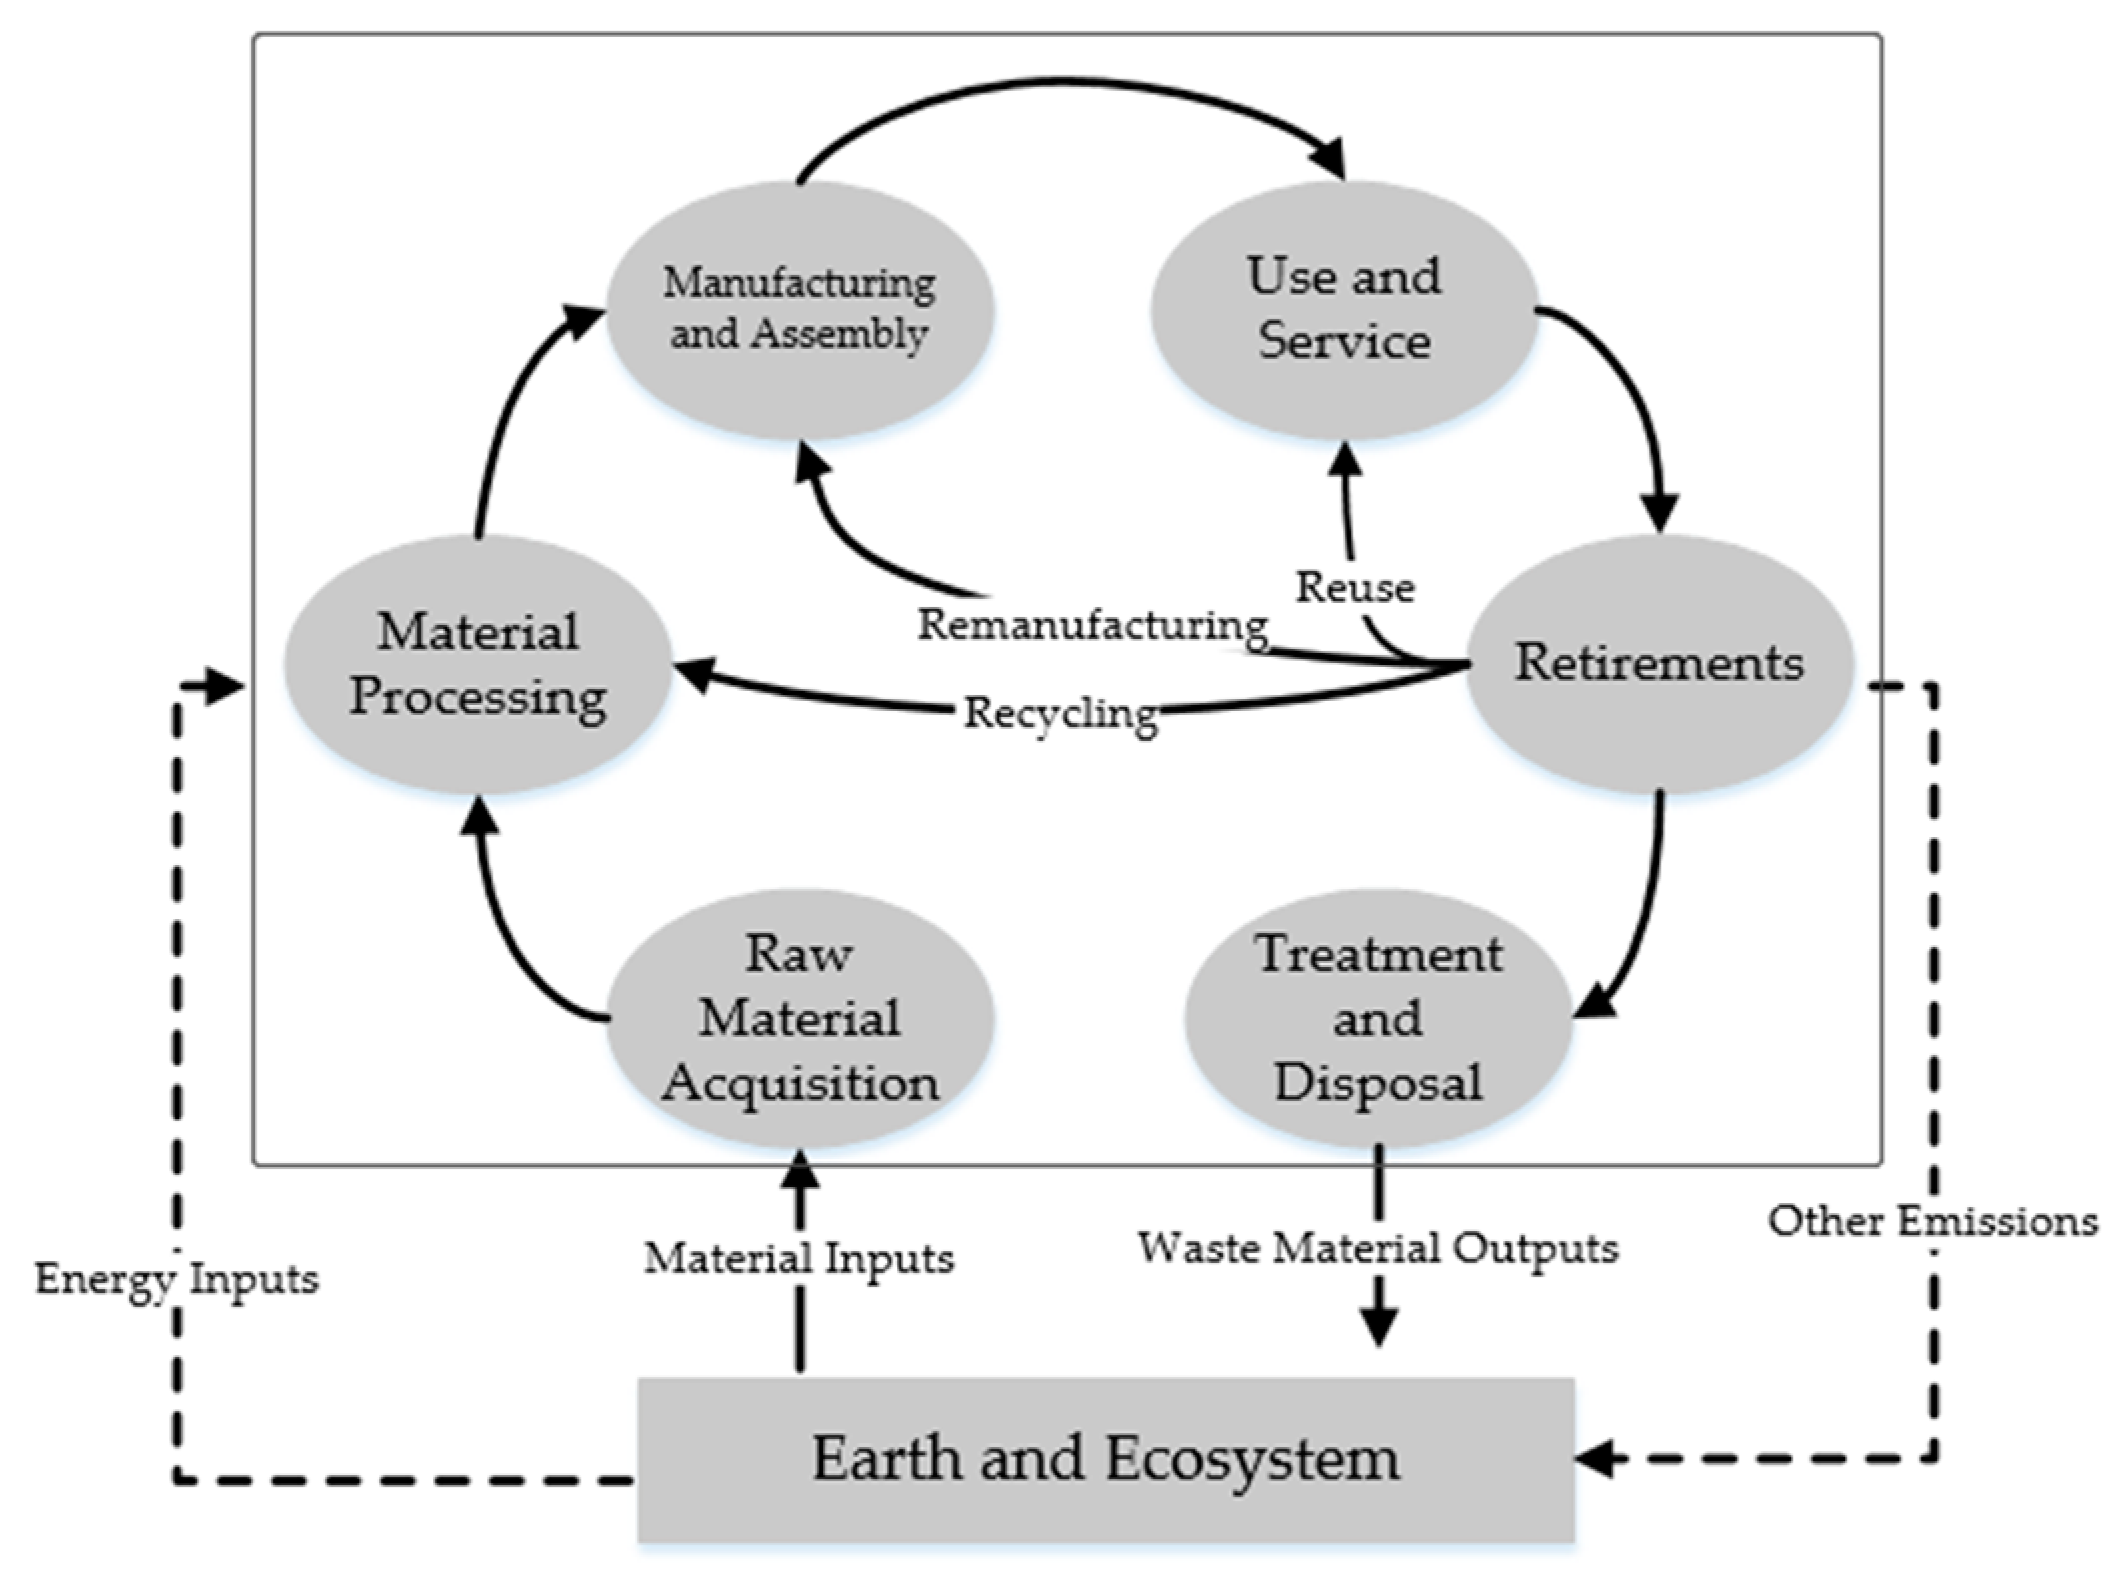
In contrast to the forward supply chain that involves raw material and product flows from manufacturers to final consumers, as shown in
Figure 1, remanufacturing is the process of collecting end-of-life retirements back and restoring them to as-new conditions, bringing them to the market again [
1,
2]. On the one hand, remanufacturing can create substantial economic benefits because the high rate of cost saving. It saves the company 40–65% in manufacturing costs through the reuse of parts and materials [
3]. Xerox has made a profitable business from remanufacturing through the life cycle assessment (LCA) system, using modular design on photocopiers such as FXA, DC265, Xerox 5100, etc. [
4]. Similarly, Kodak extends some components’ life by remanufacturing them [
5]. According to a survey from the US International Trade Commission, in 2011, the remanufacturing industry created economic benefits of about
$43 billion in the USA market [
6].
On the other hand, remanufacturing is a product recovery strategy that helps promote sustainable development, due to the immediate consequence of the material reduction [
1,
7]. In practice, many countries have enacted laws to promote remanufacturing operations to achieve sustainability. For example, the European Union enacted the Waste Electrical and Electronics Equipment (WEEE) Directive 2002/96/EC for e-waste in 2003 [
5]. Similarly, China, Japan, and the USA have enacted such laws as the WEEE Recycling Management Regulation, End-of-life Vehicle Recycling Law, Universal Waste Regulations Act, and Extended Producer Responsibility Act to encourage remanufacturing operations development [
8,
9]. At present, the issues on economic, social, and environmental aspects are obtaining more and more recognitions in the world. Many brand-name original equipment manufacturers (OEMs) have created business models in which remanufacturing is an integral part [
10]. For example, OEMs such as Kodak, IBM, Bosch, Xerox, Fuji, and Dell, have created successful manufacturing–remanufacturing strategies and remanufactured their used cores in-house [
11]. However, not all OEMs have a remanufacturing capability [
12], for lack of the specialized technology, production line, and infrastructure needed for remanufacturing. In practice, some OEMs (see, e.g., Ford, BMW, Hewlett-Packard) choose to outsource their remanufacturing operations to contracted remanufacturers (CRs) [
1,
13].
Whether remanufacturing is done in-house or outsourced, it affects the sale of new products, because the lower quality remanufactured products are always priced lower than new units. This lower consumers’ willingness-to-pay for the remanufactured products may allow OEMs to reach a new market segment and extend market share [
14]. For example, Robert Bosch Tool attempted to reach a low-end market in which Bosch does not have a majority share through remanufactured products, which also fends off the competition from cheap imports [
1]. The lower price of remanufactured products may make price-sensitive consumers prefer them to new products [
7,
15]. According to auction results, consumers’ willingness-to-pay for remanufactured products is 15.3% lower than that for new products [
16]. One manager of a global PC OEM confidently believes that one new product sale is cannibalized for every four remanufactured products sold [
1]. The cannibalization problem of the difference in prices set for the new and remanufactured product essentially comes from the quality differentiation of the two products [
17,
18].
It is should be noted, that since remanufactured products are restored from end-of-life products or their components, an increase in the quality of the new products would also increases the quality of the remanufactured product to a certain extent [
19]. That is, unlike the quality differentiation between independent products, the quality of remanufactured products depends on that of the original products [
20]. As such, to reach a new market segment through remanufacturing and deal with the cannibalization problems from remanufactured products, OEMs usually use consumers’ preference towards a different product quality as a competitive lever [
20]. For example, Lexmark made their end-of-life cores unable to be remanufactured to fend off the cannibalization problems from remanufactured products [
20]. On the other hand, interestingly, in order to hold and extend new market segments, some OEMs have strategically invested to make high-quality cores suitable for reuse in remanufacturing [
14,
21]. For example, Xerox invested in a modular design to make sure that used cores could be remanufactured [
5,
22]. Similarly, many brand-name OEMs, such as Cummins [
5], Caterpillar [
23], and Electrolux [
14], made the remanufacturing process more efficient.
Although many studies have recently investigated how an OEM can use product quality as a strategic lever under remanufacturing (e.g., [
19,
20]), they all assume that remanufacturing operations are undertaken by OEMs or independent remanufacturers (IRs). In practice, IRs’ remanufacturing without permission may face legal action or other hindrances from OEMs. For instance, Lexmark wrote letters to hundreds of cartridge remanufacturers to tell them that if they remanufactured Prebate cartridges without a license, they would face legal proceedings [
24]. Similarly, Canon and Epson filed lawsuits with several IRs. Besides litigation, in operations management, OEMs always have the flexibility to outsource their remanufacturing operations to competent CRs. To the best of our knowledge, there is little literature highlighting how OEMs can use product quality as a strategic lever under the scenario of remanufacturing outsourcing. To fill this gap, in this paper, we extend the prior research to investigate the economic and environmental implications of OEMs’ strategic desired quality level choices under remanufacturing outsourcing strategies.
More specifically, we begin our study by developing two theoretical models corresponding to two remanufacturing scenarios where OEMs can undertake remanufacturing operations (1) in-house or (2) outsource them to a CR. In both models, we assume that the OEM can decide the quality of the new product, which can be used as a strategic lever to reach new market segment or deal with the cannibalization problems caused by remanufacturing. That is, using these two models, we explore:
- (1)
How does the OEM set an optimal product quality level for new products under the in-house and outsourcing remanufacturing scenarios?
- (2)
How does the remanufacturing outsourcing strategy impact the equilibrium strategies, such as the optimal quantities, economic, and environmental implications?
- (3)
Which remanufacturing scenario is economically better for the parties involved, such as the OEM and the industry?
- (4)
Which scenario induces a less negative environmental impact: in-house or outsourcing?
We derive some interesting insights. In particular, we find that, consistent with conventional wisdom, to deal with the cannibalization problems arising from remanufactured products, an OEM is more likely to choose a lower quality for new products when outsourcing remanufacturing to CRs. That is, when outsourcing remanufacturing operations to a CR, the OEM prefers a lower quality level to reduce the CR’s competitive advantage. Among other results, our analysis reveals that outsourcing remanufacturing to a CR hurts the OEM and the industry but may be beneficial for our environment.
The remainder of this paper is organized as follows.
Section 2 reviews the related literature and explains our contributions in details.
Section 3 describes both models.
Section 4 demonstrates the analysis and equilibriums of both models (in-house and outsourcing).
Section 5 discusses the differences between two OEMs’ remanufacturing strategies.
Section 6 presents the conclusion.
2. Literature Review
Our study relates to three main streams of research. The first stream is remanufacturing outsourcing. Specifically, Zhang and Ren [
25] introduced a CR for patent products, and investigated the performance of close-loop supply chains. They found that a coordinated pricing mechanism would stimulate all members to joint decision-making, and also improve the environmental performance. Huang and Wang [
26] developed three hybrid remanufacturing models to study the economic and environmental implications of remanufacturing capacity, in which an OEM is inclined to collaborate with a CR by licensing outsourcing. Recently, Zou et al. [
27] studied how outsourcing remanufacturing affects consumer environmental awareness, and found that outsourcing remanufacturing does not decrease the quantity of new products and may not improve the environmental performance. Xia and Zhang [
28] analyzed the impact of outsourcing remanufacturing on sustainability issues, and drew a conclusion that outsourcing improves its unfavourable market competitive position. Sundin and Bras [
14] elucidated the economic and environmental benefits and provided an argument for why products to be used for functional sales should be remanufactured. In addition, many researchers, including [
3,
29,
30], studied outsourcing decision about economic and environmental implications related to a closed-loop supply chain. The above literature studied the economic and environmental issues under remanufacturing outsourcing, but did not pay any attention to the issue that the OEM can choose its preferred product quality. Our paper contributes to this stream by extending the inquiry to investigate the economic and environmental implication of OEMs’ strategic desired quality level choices under remanufacturing outsourcing. That is, we focus on the quality decisions of OEMs and analyze the impacts of outsourcing remanufacturing on the following factors: quality, quantity, profit, and the environment.
The second research stream we review is related to the quality decision between independent products. By developing two vertical differentiation models of fixed and variable quality costs, Motta [
31] studied the effect of quantity versus pricing competition on quality choice and profits. Desai et al. [
32] considered an endogenous quality context where an OEM can select the quality level of a component to analyze the trade-off between marketing and manufacturing. Choudhary et al. [
33] investigated how personalized pricing impacts manufacturers’ quality choices through a vertical product differentiation model. Matsubayashi [
34] utilized a Bertrand price competition model to discuss quality competition between two firms who competitively choose quality levels to maximize their profit, and derived that products differentiation can increase firms’ profits and consumers’ welfare in a quality-sensitive market. Moreover, product quality can help to create or strengthen a competitive barrier. Karaer and Erhun [
35] regarded quality as an incumbent’s entry-deterrence strategy, and investigated incumbents’ quality choices under different settings. The above papers highlight the quality choice with independent products. As mentioned earlier, unlike quality decisions between independent products, the increase in the quality of the new products would also increases the quality of the remanufactured product to a certain extent [
19,
20]. As such, we contribute to the research by considering quality decisions between new and remanufactured products.
Thirdly, although most researches have not considered remanufacturing and quality choice simultaneously, there are a few exceptions. To our best knowledge, Oersdemir et al. [
20] were the first to analyze quality choices in a remanufacturing context. They characterized the quality level as a lever that OEM uses to compete with IRs, and their result indicates that OEMs will deter the IR’s entry through deciding on a higher quality when the OEM has a significant competitive advantage. Kleber et al. [
19] adjusted the decision-making object from “quantity” to “price” on Oersdemir et al.’s (2014) basis, also in the context of where quality can be chosen, which studies the stability of the consumers’ willingness-to-pay discount factor of remanufacturing by comparing a constant discount factor with a probability distribution discount factor. These two papers provide the key modelling basis for our paper. However, in practice, it should be noted that IR remanufacturing may face legal action or other hindrances from OEMs (e.g., the earlier-mentioned cases of Lexmark, Canon, and Epson, etc.). Apart from litigation, in operations management, OEMs always have the flexibility to outsource remanufacturing operations to CRs. To the best of our knowledge, they do not address the quality choice under remanufacturing outsourcing. To fill this gap, in this paper, we extend the above-mentioned literature to address OEMs’ strategic quality choices under remanufacturing outsourcing strategies. That is, instead of focusing on strategic quality choices for or against an IR, our study centers the strategic quality choices of OEMs that outsource remanufacturing to a CR.
Our paper makes some notable differences. Firstly, there have been numerous papers that studied the economic and environmental implications of remanufacturing outsourcing, but they paid little attention to how OEMs can use product quality as a strategic lever under the scenario of remanufacturing outsourcing. Secondly, the current literature has been concerned with quality decisions between independent products, but has ignored the quality decisions between new and remanufactured products. As mentioned earlier, unlike quality decisions between independent products, the increase in the quality of the new products would also increases the quality of the remanufactured product to a certain extent. As such, we contribute to the research by considering quality decisions between new and remanufactured products. Thirdly, we provide a complementary approach to Kleber et al. [
19] and Oersdemir et al. [
20] by extending the strategic quality choices of OEMs that outsource remanufacturing to a CR.
3. Model Description and Assumption
Two theoretical models were developed, in which an OEM produces new products with remanufacturing operations (1) undertaken by the OEM (Model I) or (2) outsourced to a CR (Model O). It should be noted, that in both our models, unlike quality differentiation decisions between independent products, the increase in the quality of the new products would also increases the quality of the remanufactured product to a certain extent [
19,
20]. All related notations are presented in
Table 1.
Like [
20], we study a single period model with the following consequences. First, the OEM decides the optimal quality levels for the new products and the license fees for remanufactured units. Second, both the OEM and CR choose the optimal quantities of
and
simultaneously.
Following [
20], we assume that the unit variable production cost for a new product with quality level
s is
, where
is a scaling parameter of unit cost. Accordingly, the cost of a remanufactured unit is
, where
represents the remanufacturing cost factor. This form of cost function reflects certain key characteristics when remanufactured and new products are placed in the market simultaneously. First, since the increase in the quality of the new products would also increases the quality of the remanufactured product to a certain extent, we assume that the remanufacturing cost is also related to the quality of new products. Second, since remanufacturing a product requires less raw material and energy than making a new product [
36], the above cost functions indicate that remanufacturing a unit is less costly than producing a new one; that is,
.
Consistent with [
20,
37], our paper assumes that consumers are heterogeneous in their willingness-to-pay for quality and are uniformly distributed in the range [0, 1] in a market with a size normalized to 1. In practice, consumers always perceive that the quality of remanufactured products is lower than that of the new units [
20,
38]. Moreover, [
39] provided the empirical support that consumers’ willingness-to-pay for remanufactured products is 15.3% less than that for new products. We accordingly use a parameter,
, to represent the discount factor for willingness-to-pay for a remanufactured product, which has also been modelled in [
7,
20,
23]. We assume
is the consumer’s willingness-to-pay for a unit product’s quality level, that is, a consumer is willing to pay
for a product of quality level
. Given the prices of new and remanufactured products
and
, the net utilities that a consumer of type
receives from new and remanufactured products are
and
, respectively. Additionally, each consumer has three options: buy nothing, buy a new product, or buy a remanufactured product, to maximize their utility.
Figure 2 graphically depicts each consumer’s utility derived from the different options, and we can identify the indifferent point among the different options. For example, the indifferent point between buying a new product or a remanufactured product is at
, and the consumer with
prefers new products to remanufactured ones.
Like [
19,
20], based on the net utilities at the indifferent point, we can derive reverse demand functions for new and remanufactured products as follows:
5. Model Analysis
In this section, we intend to understand the OEM’s strategic quality choice under remanufacturing outsourcing. That is, we first address the questions posed at the beginning of this paper by analysing the differences between two remanufacturing scenarios in the equilibrium solutions and then extend our analysis to economic and environmental performance.
5.1. Analysis on Optimal Solutions
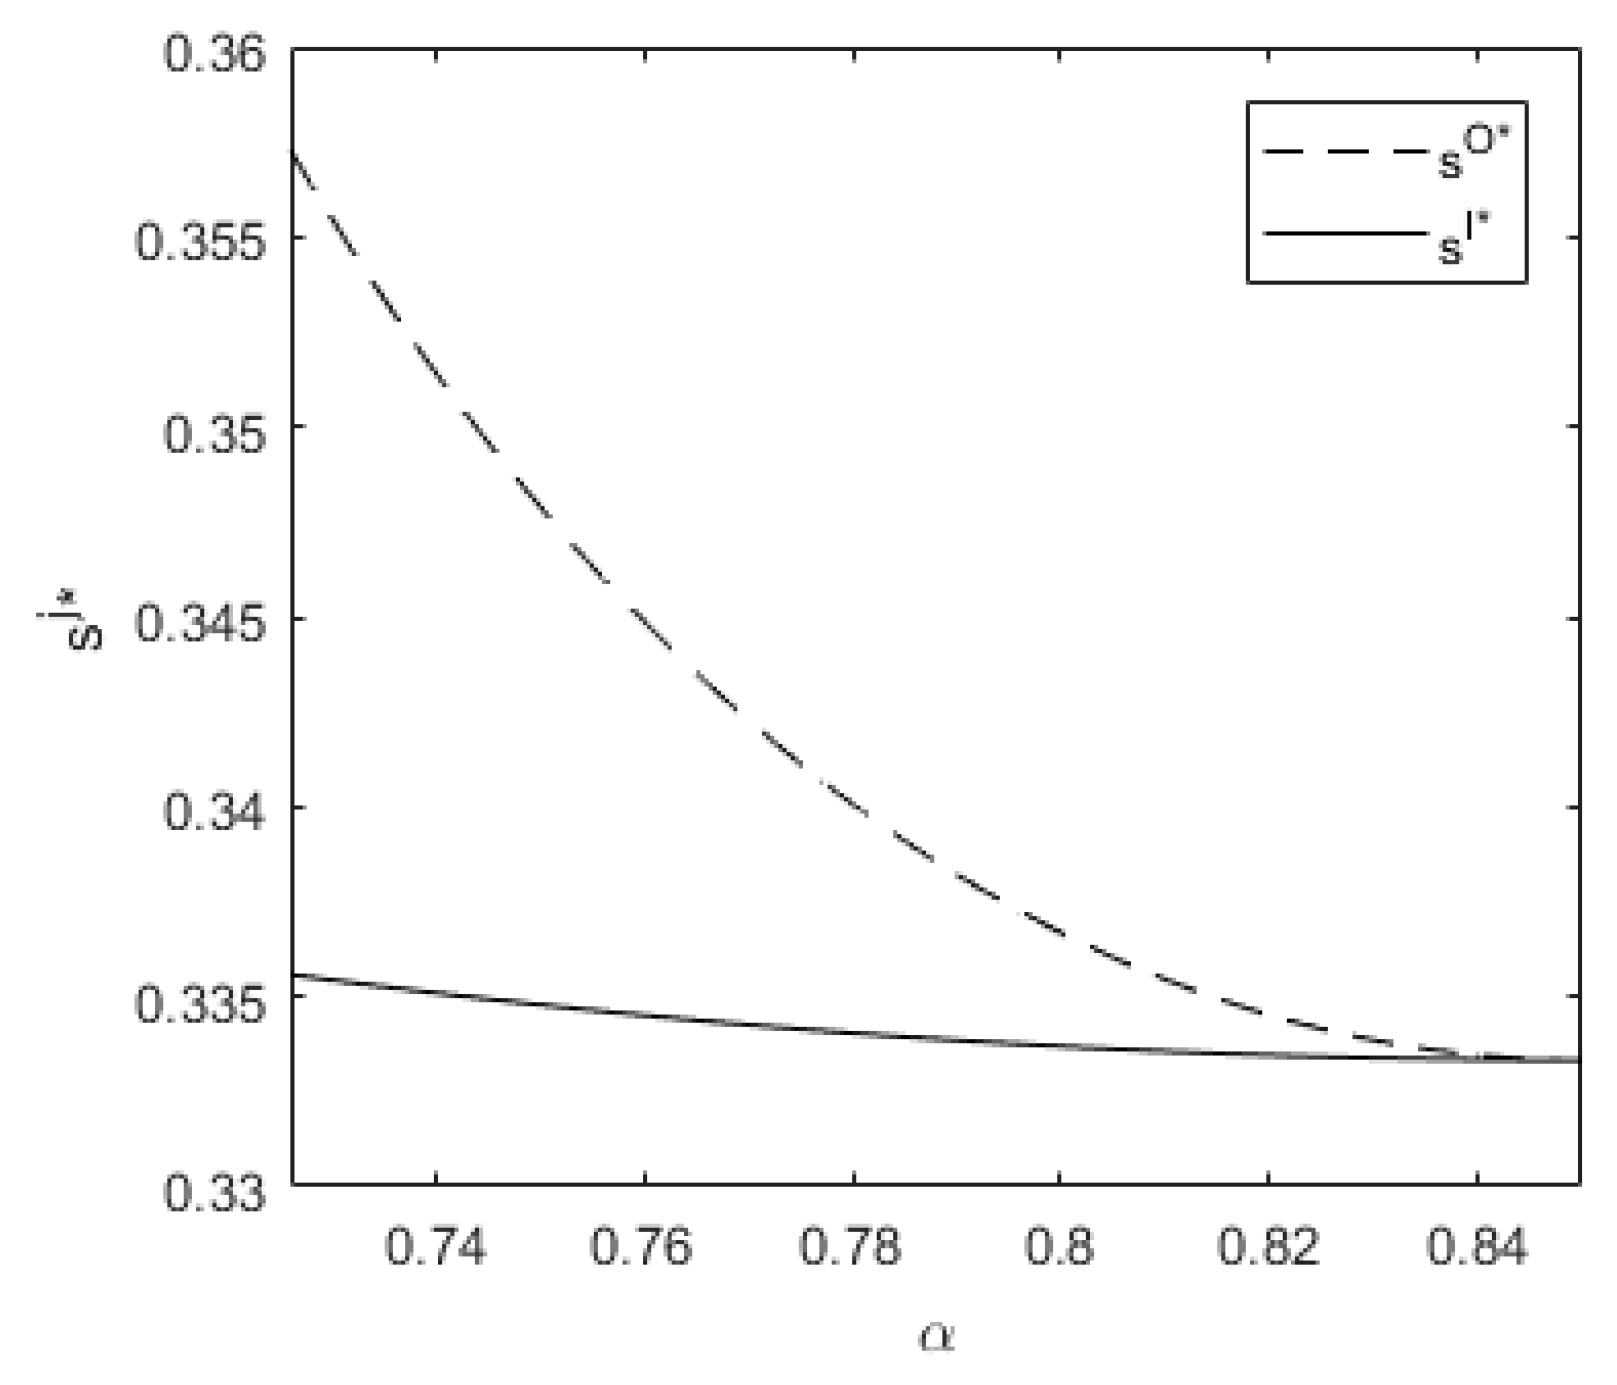
Based on Lemmas 1 and 2, we now address the first question: How does the OEM set an optimal product quality level for new products under the in-house and outsourcing remanufacturing scenarios?
Proposition 1. The optimal quality level determined by the OEM in Model O is always lower than that in Model I, that is .
Proposition 1 reveals that remanufacturing outsourcing will decrease the optimal quality level of the product system. That is, when outsourcing remanufacturing operations to the CR, the OEM would prefer a lower quality level to reduce the CR’s competitive advantage. Recall that, in Model I, the OEM is very powerful and undertakes remanufacturing operations in-house. Thus, if the OEM decreases the quality of new products, the prices of both remanufactured and new products will decrease. Then, the OEM will suffer from the decreasing quality strategy in Model I. However, in Model O, the OEM outsources its remanufacturing operations to the CR. Thus, under this scenario, the OEM has two major tasks: selling new products and limiting potential cannibalization problems from the CR. In this case, decreasing product quality decreases the prices but increases the quantities of new products, which, in turn, leads to lower consumer willingness-to-pay for remanufactured products. Although the consumers’ willingness-to-pay for remanufactured products decreases, the remanufacturing cost does not decrease proportionally, which results in a less intense cannibalization problem.
It should be noted that this observation is partly consistent with that of [
20], who concluded that “when the IR has the competitive advantage, the OEM chooses a lower quality level to deemphasize its competitor’s advantage.” Obviously, the reason why the similarity emerges is that the competition between both parties remains unchanged. In their model, both parties have competition between both remanufactured products; however, in our models, the OEM should deal with the cannibalization problems arising from the CR.
To understand Proposition 1 better, we adopt the numerical experiments to simulate variation in optimal equilibrium outcomes. As in [
20], in all numerical examples, we let
. In addition, we set
, because consumers’ willingness-to-pay for remanufactured products is 15.3%, less than that for new products [
16]. All simulations were run in Matlab 2017 software.
Figure 3 depicts the OEM’s optimal quality level under two remanufacturing scenarios. Obviously, the optimal quality level determined by the OEM in Model O is always lower than that in Model I (
). In addition, we find that the optimal quality levels
and
both decrease with
. That is, in Model I, when the remanufacturing cost factor
decreases, the OEM increases the new product quality level. Similarly, as the remanufacturing cost decreases, the OEM increases the quality level of
in Model O.
Based on Lemmas 1 and 2, we then highlight how the remanufacturing outsourcing strategy impacts the optimal quantities.
Proposition 2. The OEM produces a greater quantity of new products in Model O than in Model I; that is, .
From Proposition 2, we can conclude that the equilibrium quantity of new products under the outsourcing scenario is higher than that in Model I. We can explain this from two aspects. On the one hand, in Model O, the OEM faces external competition from the CR’s remanufactured products. Therefore, the OEM has more incentive to manufacture greater quantities of new products, because the more new products there are, the lesser the potential market for remanufactured products. On the other hand, as Proposition 1 stated, the optimal quality level of a new product in Model O is lower than that in Model I (). This means that the prices of new products decreased due to quality decrease, which is accompanied by an increase in demand for new products from consumers in Model I and a demand increase in Model O. Therefore, the OEM manufactures a smaller quantity of new products to meet the market demand when remanufacturing in-house, and simulates greater consumption of new products to compete with remanufactured products when outsourcing.
Figure 4 illustrates what Proposition 2 stated: that the OEM always produces greater quantities of new products when outsourcing remanufacturing operations to a CR than when remanufacturing in-house; i.e.,
. Moreover, based on
Figure 4, we can conclude that as
increases, the quantities of both products increase. However,
Figure 4 also reveals that the difference between the quantities of both products decreases in both models. That is, the rate of increase when remanufacturing in-house is always greater than that when outsourcing to a CR.
Regarding the equilibrium quantities of remanufactured products in both models, based on Lemmas 1 and 2, we offer the following proposition.
Proposition 3. The quantities of remanufactured products produced by the CR in Model O are fewer than those remanufactured by the OEM in Model I; i.e., .
Interestingly, outsourcing remanufacturing induces lesser product quantities than those in Model I; specifically,
(see
Figure 5). More specifically, in Model I, both remanufactured and new products are produced by the OEM to maximize its profitability, so a monopolist OEM is inclined to remanufacture as much as possible. However, when outsourcing remanufacturing to the CR, there is a vertical competition between the OEM and CR in Model O, which results in a double marginalization problem between two parties. Such double marginalization problems mean that fewer remanufactured products are sold in Model O than in Model I. Moreover, based on Proposition 2, we find that when facing competition from the CR’s remanufactured products, the OEM has a greater incentive to manufacture more new products compared to that in Model I, meaning that the potential market for the remanufactured products decreases. Thus, as Proposition 3 shows, the quantities of remanufactured products in Model O are fewer than those in Model I.
5.2. Economic Implications
We now analyze which remanufacturing scenario (in-house or outsourcing) is better for the OEM and the industry in economic benefits.
Based on Lemmas 1 and 2, we first determine which remanufacturing scenario is better for the OEM as follows.
Proposition 4. The OEM’s profit in Model O is lower than that in Model I; that is, .
Proposition 4 implies that the OEM always suffers when outsourcing remanufacturing to a CR. This argument is supported by prior studies, such as [
23]. Note that, in Model I, both products are offered by the OEM. As such, it can strategically balance the optimal quantities of both products and obtain monopolistic profits from consumers. However, in Model O, since the remanufacturing operations have been outsourced to the CR, the OEM has a higher incentive to limit cannibalization problems from the CR. Naturally, such competition would decrease the potential profits of the OEM. Moreover, in Model O, remanufacturing outsourcing induces a double marginalization problem between both parties. Such double marginalization problems will lower the profits obtained from remanufacturing in Model O more than that in Model I.
Proposition 4 is quite consistent with the common wisdom that, although the OEM obtains revenue from outsourcing fees, in-house remanufacturing earns more for not necessarily sharing the profits to the CR [
38]. In particular, we further find that although the OEM suffers a loss in selling new products in Model I (see Proposition 2), the profitability of selling remanufactured products significantly “compensates” for the former profit “loss” (see Proposition 3).
Figure 6 graphically depicts the profit of the OEM under the two scenarios. In particular, consistent with our above analysis, we can see that the profitability in Model I is higher than that in Model O; i.e.,
. Furthermore, we find that the rate of decrease in profit experienced when producing remanufactured products in-house is always greater than that when outsourcing remanufacturing operations to the CR. That is, the difference between the optimal profits of the OEM in both models decrease with
.
Proposition 4 indicates that outsourcing remanufacturing operations to the CR is always detrimental to the OEM. However, it should be noted that such outsourcing allows the CR to share the profits availed from remanufacturing and is always beneficial for the CR. So, which remanufacturing scenario is better for the industry overall? Based on Lemmas 1 and 2, we summarize our findings in the following proposition.
Proposition 5. Outsourcing remanufacturing operations to a CR is always detrimental to the industry; that is, .
Proposition 5 suggests that the benefits the CR receives from engaging in remanufacturing cannot “compensate” for the profit loss of the OEM, which results in a lower industry profit in Model O than in Model I. The intuition behind Proposition 5 is that the competition between both parties increases while the marginal revenue from both products decreases which, in turn, decreases both parties’ profits.
Figure 7 graphically depicts the profit of the industry under the two remanufacturing scenarios, revealing that the industry also suffers from outsourcing remanufacturing (
).
5.3. Environmental Implications
LCA analysis is compiled and quantified on related inputs and outputs to each life cycle stage from cradle to grave, including material production, manufacturing, use, and retirements (end-of-life products) management [
41]. Since remanufacturing is always applied as a way of restoring end-of-life products to as-new conditions, LCA methods can provide a systematic accounting of environmental burdens and impacts for it [
42,
43]. In practice, Xerox has made a profitable business from remanufacturing through the LCA system use of modular design on photocopiers such as FXA, DC265, Xerox 5100, etc. [
4].
As
Figure 8 shows, in this subsection, LCA methodology is exploited to evaluate the environmental impact through the whole life of our two remanufacturing systems, which is widely used in much research to study the environmental impact, such as [
44,
45]. Based on product LCA, we use
, , , and
to denote the per unit environmental impact from four separate phases: manufacturing, product usage, disposal, and remanufacturing.
More specifically, in the production phase, given the per unit environmental impact is
, the environmental impact that comes from manufacturing new products is
. Following [
44,
46], the per unit environmental impact of new and remanufactured product is identical in the usage phase. The total environmental impact due to the product usage phase is a function of the quantity of new and remanufactured in use, that is
. In the disposal phase,
represents the per unit environmental impact. Recall that we study a single-period model, and the disposal environmental impact stems from those end-of-life new products that have not been remanufactured. Thus, the environmental impact of disposal is
. Similarly to the manufacturing phase, the environmental impact of the remanufacturing phase is
. We can derive that the full life cycle environmental impact of both models is given by
.
Consequently, we can answer the question of which scenario induces a less negative environmental impact: in-house or outsourcing, as follows.
Proposition 6. The effect of two models on the environment is as follows:
- (1)
When , outsourcing remanufacturing is more environmental-friendly even though it hurts the OEM and the industry.
- (2)
When , outsourcing and in-house remanufacturing have an identical environmental impact.
- (3)
When , outsourcing remanufacturing not only hurt the OEM and the industry, but also are detrimental to the environment.
Recall that the optimal quantities of remanufactured products are constrained by the quantities of new products. Then, combined with Propositions 2 and 3, we can derive the production quantity relationship
. Together with the environmental impact on the full life cycle assessment, we find that the environmental impact is determined by the ratio of
. A similar threshold is derived in [
44,
45].
From Proposition 6 we can see that when is less than a certain threshold, outsourcing remanufacturing to the CR is beneficial for the environment, even when the OEM produces a large quantity of new products to prevent consumer transfer and limit the potential market for remanufactured products. On the contrary, if the ratio of is greater than the threshold, i.e., , remanufacturing in-house is definitely conducive for both the OEM’s economic and environment performances. Note that there are more quantities of both products in Model I than in Model O i.e., , that is, outsourcing remanufacturing induces less environmental impact of product usage by the consumer. Together with , we can find that these two environmental impacts “compensate” for the environmental impact “loss” in the production and disposal phase, which leads to less environmental impact in Model O when below this threshold, that is .
Clearly, when OEMs undertake remanufacturing in-house it not always benefits the environment, even though OEMs tend to remanufacture more in Model I. That is, remanufacturing reduces the raw material and energy consumption in the remanufacturing phase, but when below the threshold, the environmental impact of the product usage phase in Model I greatly exceeds that in Model O because there is a higher total products quantity in Model I. Recall that in proposition 4 and proposition 5, OEM remanufacturing in-house always brings a higher profit for the OEM and the industry. A similar argument is concluded in Sun et al. [
47], who stated that remanufacturing in-house is better for an OEM concerned with economic benefits, but outsourcing remanufacturing is more beneficial for policy makers who value environmental sustainability. It should be noted that they studied the economic and environmental issues under remanufacturing outsourcing, but did not pay any attention to the issue that the OEM can choose its preferred product quality. Our paper extends this to investigate the economic and environmental implication of OEMs’ strategic desired quality level choices under remanufacturing outsourcing.
6. Conclusions
Remanufacturing is widely acknowledged to be profitable and sustainable. Therefore, many OEMs, including Lexmark and Canon, have created sustainable business models in which remanufacturing is an integral part. Due to the lack of professional in-house remanufacturing knowledge, OEMs usually outsource remanufacturing operations to CRs. In practice, whether done in-house or outsourced, remanufacturing will impact new product sales due to the internal cannibalization problem raised by remanufactured products. Such cannibalization problems depend on the quality differentiation evaluations of consumers [
17,
18]. It should be noted that, unlike quality differentiation between independent products, the increase in the quality of the new products would also increases the quality of the remanufactured product to a certain extent [
20].
Therefore, we developed two theoretical models to investigate how OEMs can use product quality as a strategic lever under the scenario of remanufacturing outsourcing. More specifically, we developed two models corresponding to two remanufacturing scenarios: OEMs can undertake remanufacturing operations in-house or outsource them to a CR. Our paper extends remanufacturing research on quality choice by introducing a CR, and also contributes to the present quality choice literature. We also examined the environmental impacts of outsourcing remanufacturing strategy.
We derived some valuable insights. Our analysis reveals that outsourcing remanufacturing will decrease the optimal quality level of the product system. That is, when outsourcing remanufacturing operations to a CR, the OEM selects a lower quality level to de-emphasize the CR’s competitive advantage. In particular, among other results, we found that outsourcing remanufacturing to a CR stimulates more production of new products, but hurts the OEM and the industry. Additionally, there is a ratio threshold regarding the environmental impact for different life cycle phases, above which remanufacturing in-house is definitely beneficial for OEMs in economics and the environment, but for the rest, outsourcing is equally or more environmental-friendly even though cutting down the profit.
This paper could be extended in the following ways. First, we use profit optimization models to investigate the related economic and environmental implications, an assumption that, although common in the literature of remanufacturing (see, e.g., [
12,
38,
48]), future research may want to change and perform a new analysis (perhaps multi-objective optimization) if the paper’s focus is on “Sustainable Analysis”. Second, our models assume that the quality of new products can only be decided by OEMs. Future research could study the CR’s potential influences on the quality of remanufactured products. Finally, to enable a focus on the investigation of the economic and environmental implications of OEMs’ strategic desired quality level choices under remanufacturing outsourcing, our model considers production costs only. Future research can further address reverse logistics costs such as the collection of used products, disassembly cost, and transportation cost.


