Article

International Strategy for Sustainable Growth in Multinational Pharmaceutical Companies

1
Graduate School of Technology Management, Ritsumeikan University, Osaka 567-8570, Japan
2
Eli Lilly Japan K.K., Hyogo 651-0086, Japan
3
Faculty of Business Administration, Ritsumeikan University, Osaka 567-8570, Japan
4
School of Environment and Society, Tokyo Institute of Technology, Tokyo 152-8550, Japan
*
Authors to whom correspondence should be addressed.
Sustainability 2020, 12(3), 867; https://doi.org/10.3390/su12030867
Submission received: 25 December 2019 / Revised: 15 January 2020 / Accepted: 21 January 2020 / Published: 23 January 2020
(This article belongs to the Section Economic and Business Aspects of Sustainability)

Abstract

:
Although it is generally agreed that the pharmaceutical industry is in a state of rapid internationalization, there is no clear comprehensive explanation of the current state and effectiveness of an international strategy. There are many studies about internationalization but they neither focus on the pharmaceutical industry nor evaluate the effectiveness of an international strategy with a control. Therefore, we investigate the current state of internationalization with a sample of the 30 multinational pharmaceutical companies, as well as the effectiveness of an international strategy by comparing two international strategies. In this study, we define an international strategy as a strategy that controls the geographic distribution of sales across regions to maximize total sales. The results show that 33% of the companies are still home-region-oriented, and we did not find any evidence of the effectiveness of an international strategy that pursues a balanced geographic distribution across regions in terms of total sales and adjusted total sales. The results provide the practical implication that pharmaceutical companies should weigh up the specific markets to secure higher sales through the advantage of adapting to customers’ needs. This paper contributes to the research on sustainable growth by empirically providing results of comparisons of different international strategies in the pharmaceutical industry.

1. Introduction

The business model of the pharmaceutical industry involves making investments into research and development (R&D), delivering the resulting products to the market, and then collecting the return on these investments as profits [1]. It is already known that scientifically novel and innovative products can generate higher profits, and pharmaceutical companies have tried to make their organization more discovery-oriented and more science-driven [2]. In fact, the pharmaceutical industry has traditionally been highly profitable due to the high value added from innovation and low manufacturing costs [3], and the global pharmaceuticals market is growing, reaching about 935 billion USD in 2017. This business model requires a pharmaceutical company to secure profits enabling reinvestments into R&D as well as sales and marketing (S&M) by sustaining sales growth and controlling R&D expenditures. However, many pharmaceutical companies have recently been facing significant challenges regarding their business models. One such challenge is the growing pressure on the industry’s profitability as healthcare budgets increase with a rapidly aging society, especially in developed countries. For example, EU countries and Japan are closely regulating pharmaceutical prices [4,5]. Another challenge is an increase in the cost of launching a new pharmaceutical product, as regulatory requirements to ensure patient safety and efficacy are more demanding for advanced drugs and clinical success rates have declined [6,7,8]. The success ratio from “target-to-hit” to “launch” was only 4%, and the cost to launch is an average of 1,778 million USD over 13 years [9]. In fact, the return on investment is continuously declining and it is said that the pharmaceutical business model is being broken up [10].
Given this background, the pharmaceutical industry is said to be undergoing rapid internationalization, with the expectation of growing sales with overseas expansions and thereby slowing the increase in R&D costs through global trials [11,12,13,14]. The foundation of this strategy rests on the assumption that internationalization contributes positively to a firm’s performance. For instance, Vernon [15] reports a positive relationship between a company’s performance indicators, such as return on sales and return on investment, and the firm’s internationalization. Levitt [16] asserts that well-managed companies move from customized products to internationally standardized products because technology and internationalization homogenize consumer preferences. Kogut [17] explains that internationalization helps a company capture economies of scale. However, this assumption has not yet been confirmed because previous studies on the relationship between a company’s performance indicators and its internationalization reveal a wide variety of findings that include both positive and negative relationships, as well as an absence of any relationships [18,19,20,21,22]. Kotler [23] finds that many notable international products fail due to the lack of adaptation and points out that the differences in various countries in the following three aspects demand international customization: customer preferences, resources and buying behaviors, and environmental factors such as regulations. Bartlett and Ghoshal [24] argue that the growing complexities of international businesses make it difficult to effectively respond to the diverse demands of markets. Buckley and Ghaur [25] explain the conflict between the cost advantages of standardization versus the revenue advantages of adaptation through achieving responsiveness to customer niches. In sum, there is still a debate over whether multinational pharmaceutical companies should take an international strategy to make sales around the world on the assumption that customer needs are the same across regions, or an international strategy to make sales in a specific region on the assumption that customer needs are different across regions, when promoting internationalization for sustainable growth.
Thus, we analyze the effectiveness of international strategy on the pharmaceutical industry using data on the 30 multinational pharmaceutical companies from 2010 to 2017. In this study, we define international strategy as a strategy that controls the geographic distribution of sales across regions to maximize total sales (TS), and classify multinational pharmaceutical companies into four categories based on the geographic distribution of sales across regions, as shown in Table 1 [26]. This classification is based on the triad power concept [27]. The triad was a geographic space consisting of the United States, the EU, and Japan, but the triad expanded to a broader region (i.e., North America, Europe, and Asia-Pacific and others) [26]. Since the triad is of approximate equal size according to the geographic distribution of sales in the pharmaceutical industry [28], this classification can be applied to the pharmaceutical industry.

2. Background

2.1. State of Internationalization

Rugman and Verbeke [26] conducted an investigation into the level of internationalization of the companies listed on the Fortune Global 500. Their study reveals that very few companies are considered global and that most are home-region-oriented (2.4% and 84.2%, respectively). They also discuss how widespread geographic diversification may have managerial pitfalls similar to the conventional drawbacks of product diversification, such as an unclear focus. In addition, Oh and Rugman [29] analyzed longitudinal sales data from 1998 to 2008 using a sample of companies listed on the Fortune Global 500. They found that most international companies were anchored in their home region (84.8%, of which 26.7% are domestic) over the 10 year study period. However, they do not focus on the pharmaceutical industry, as there are few pharmaceutical companies in the Fortune Global 500 (less than 5%), and the data is somewhat outdated.

2.2. Pharmaceutical Indusrtry Specific Characteristics of Internationalization

The pharmaceutical industry is a highly regulated industry because most of their products are directly life-related products. Due to strict regulations, the flexibility in changing product characteristics (e.g., indication, appearance) per country or region is low. Companies in most industries enter new countries with a very similar product to that in their home markets that they can use to test foreign customer acceptance of their offerings and are thereby able to transfer the full production process of a particular product to various markets [30]. However, companies in the pharmaceutical industry cannot test acceptance of their medical products in the same manner. In general, medical products such as prescription drugs require a country’s regulatory approval to launch them in other countries or regions, which is based on a large amount of scientific data that incurs significant costs and takes extensive time with a very low probability of technical success. Even though pharmaceutical companies understand the acceptance of the country or regions, they have to ask for another country’s regulatory approval to change the characteristics of their medical products (e.g., to expand indications, to switch from a capsule to a tablet).

3. Materials and Methods

3.1. Data

We targeted the 50 largest multinational pharmaceutical companies based on worldwide drug sales from 2010 and 2017 [31,32]. We hand-collected data on the TS and geographic sales of drugs and selling, general, and administrative (SG&A) expenditures for the eight year period. As some pharmaceutical companies are expanding their product ranges, we counted the sales of pharmaceutical drugs for humans and excluded the sales of drugs for animals, as well as devices, diagnostics, and royalties, as much as possible. The data sources were the individual company’s annual reports and financial reports, such as 10-K and 20-F forms. For non-US data, we converted the currency units to USD based on the period average data in the International Monetary Fund’s International Financial Statistics [33]. Of the sample, we obtained the necessary data from 30 of the 50 largest companies, as shown in Table 2.

3.2. Classification of Internationalization

We divided the 30 companies into the previously mentioned four categories based on the classification provided by Rugman and Verbeke [26], and supplemented these by adding a domestic category (less than 10% of sales in foreign countries) [34,35]. The distribution of global pharmaceutical sales was roughly 40% in North America, 30% in Europe, and 30% in Asia-Pacific and others as of 2014 [28], which thus comprise our three regions of study. As the market size of the three regions is almost the same, we did not adjust TS by regional market size. We note that each company’s geographical category could vary to some extent; for example, the country information in Europe is sometimes not detailed in the annual or financial reports.

3.3. Effectiveness of Internationalization in Terms of TS

Since previous studies did not set a control to research the effectiveness of internationalization [21,22,36], the differences in an effectiveness among international strategies have not been shown quantitatively. Since the dataset is limited to 30 multinational pharmaceutical companies, we refer to the concept of case research that it makes sense to select polar types, given the limited number of cases [37]. Thus, we compare global companies to home-region-oriented companies as a control as a comparison of the two extreme international strategies.

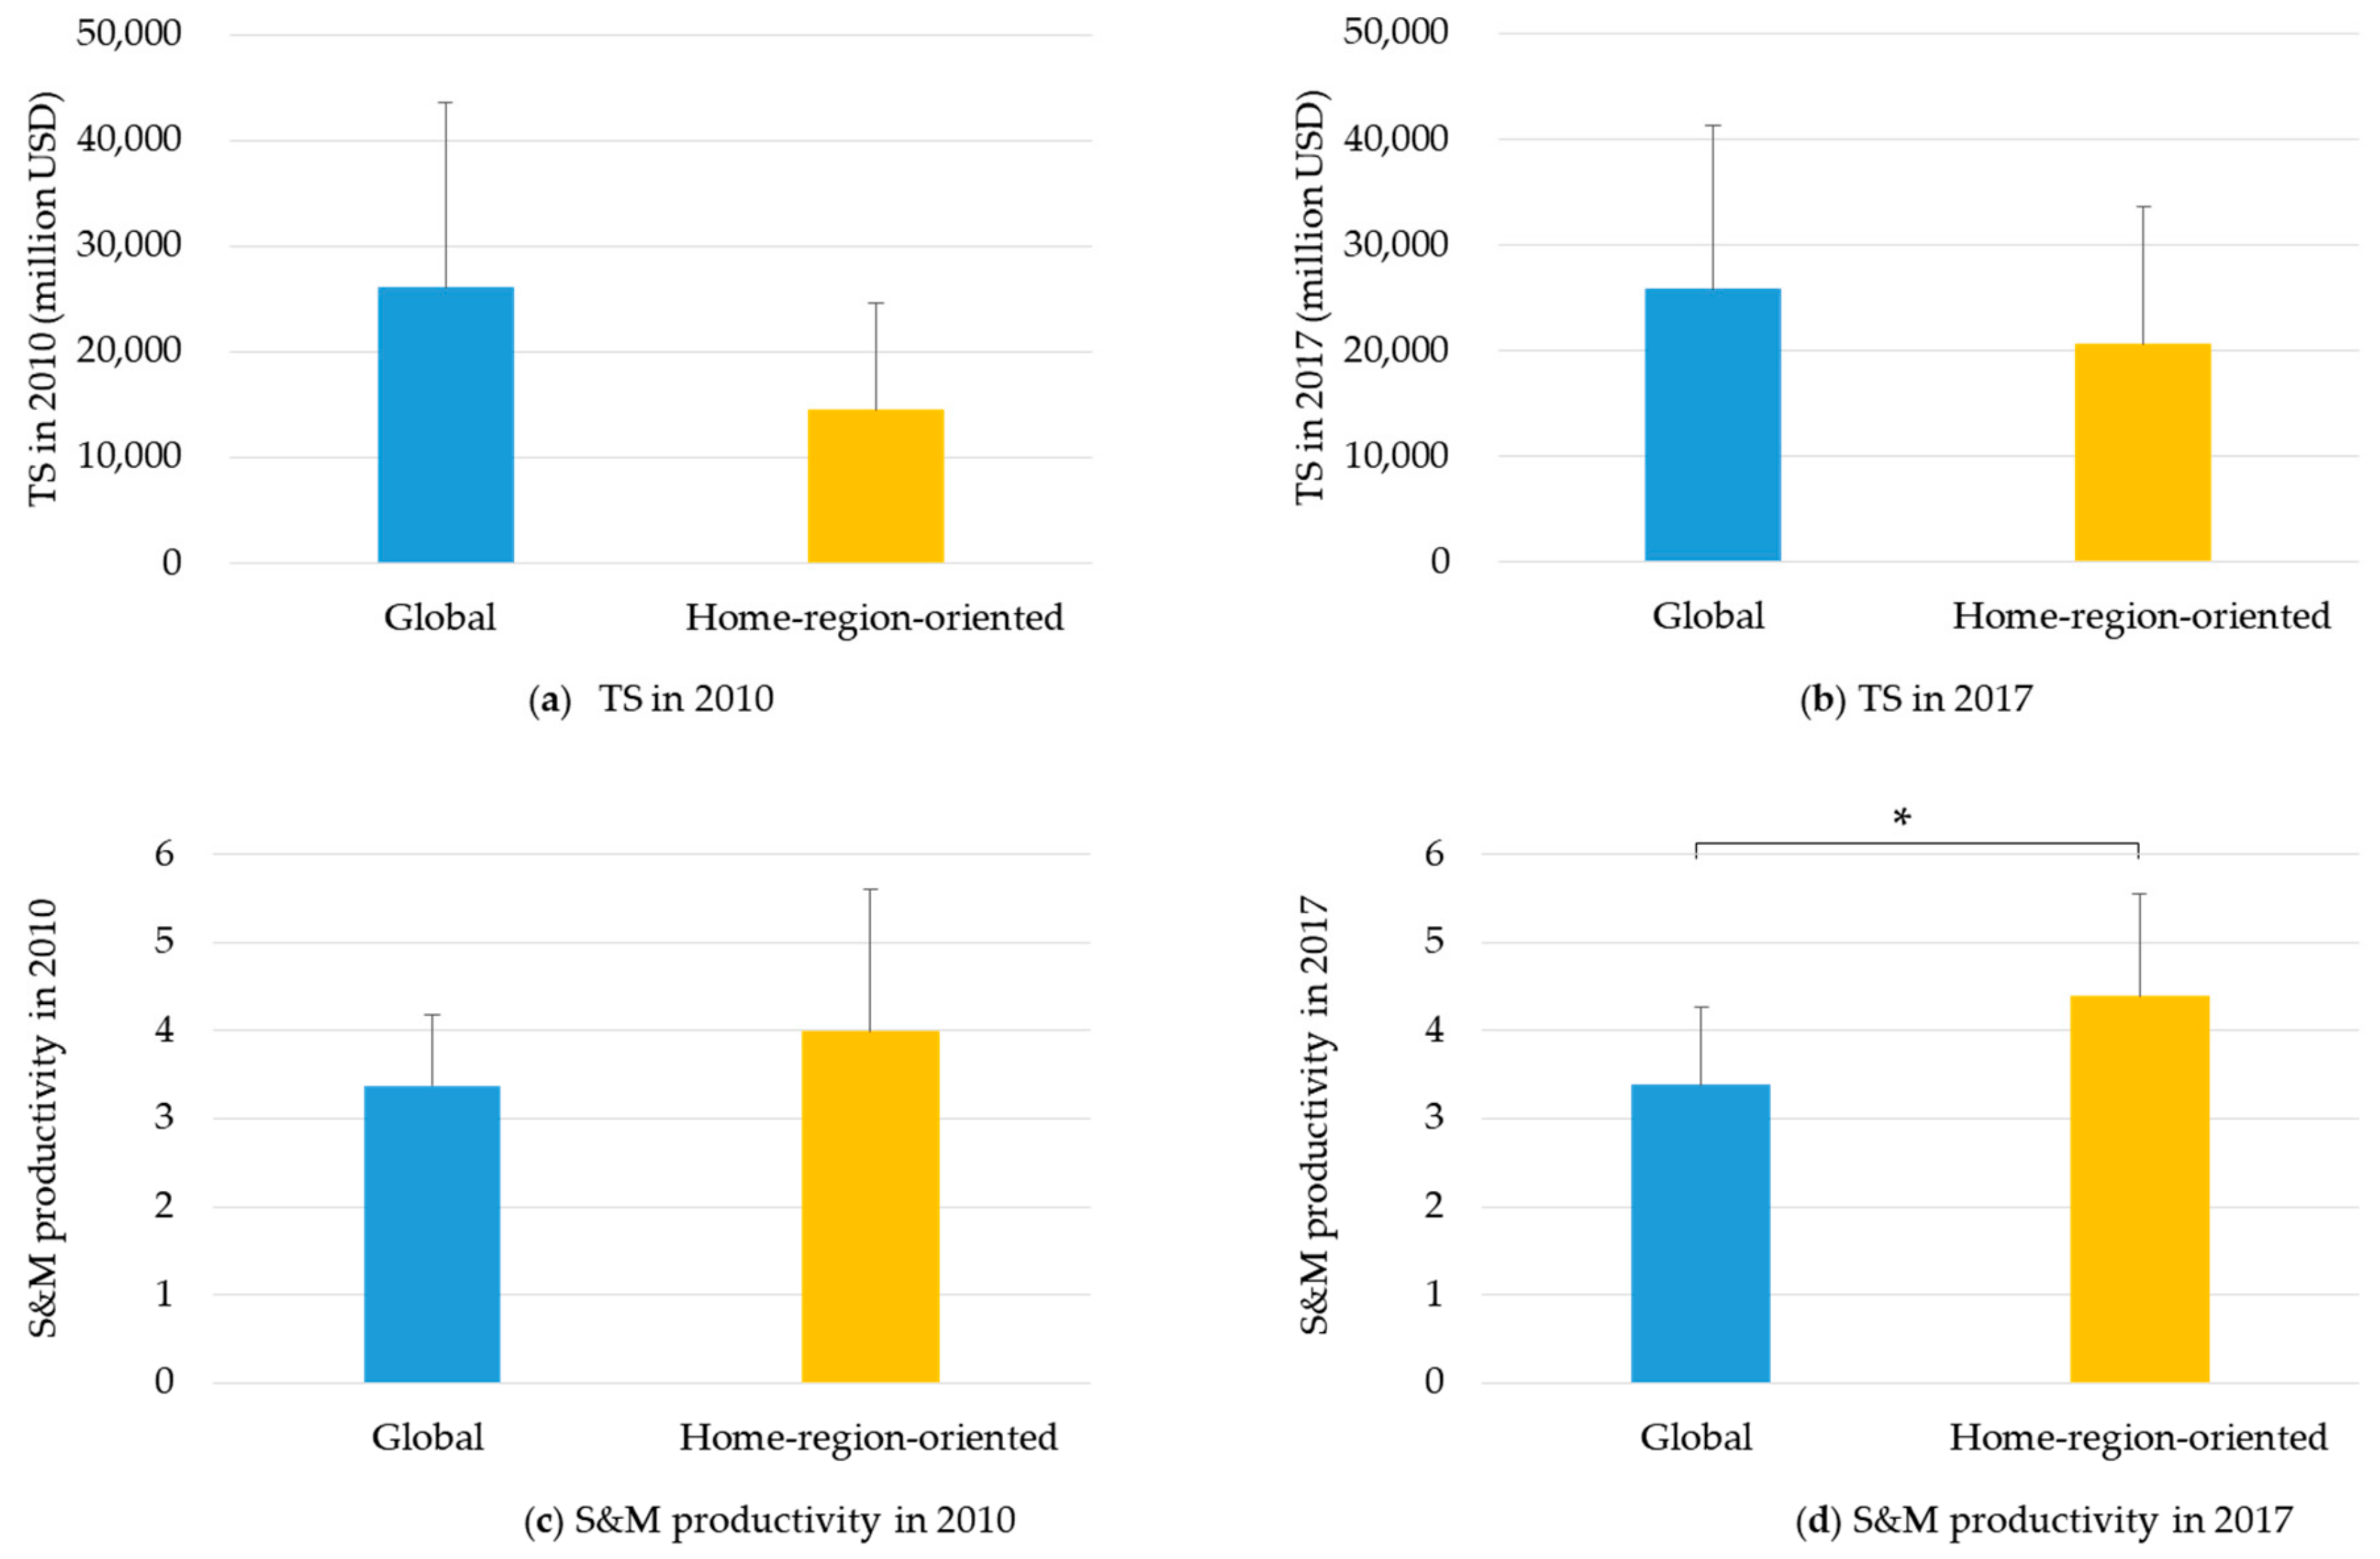
3.3.1. Comparison of Global Companies versus Home-Region-Oriented Companies in Terms of TS and Adjusted TS

To evaluate the effectiveness of an international strategy, we used two groups of companies using 2017 data: global companies and home-region-oriented companies as a control. We compared global companies to home-region-oriented companies in terms of TS as an indicator representing the effectiveness of international strategy. If we did not see any statistical differences between these two groups, we then compared global companies to home-region-oriented companies in terms of adjusted TS, which we obtained by dividing TS by SG&A expenditures, or S&M productivity, so that we could cancel the difference in the SG&A expenditures of both groups. SG&A expenditures are made to expand the sales and market share of products. Logically, high SG&A expenditures can increase TS [38]. We tested whether or not the data satisfied the normality requirement by the Shapiro–Wilk test. When the data satisfied normality, we performed the Student’s t-test or Welch’s t-test depending on homoscedasticity by the Levene test. When the data did not satisfy normality, we performed the Mann–Whitney U test. A pre-set significance level was the two-sided p-value of 0.05 [39]. All statistical computations in this study were performed in the IBM SPSS statistical software for Windows, version 26.0.

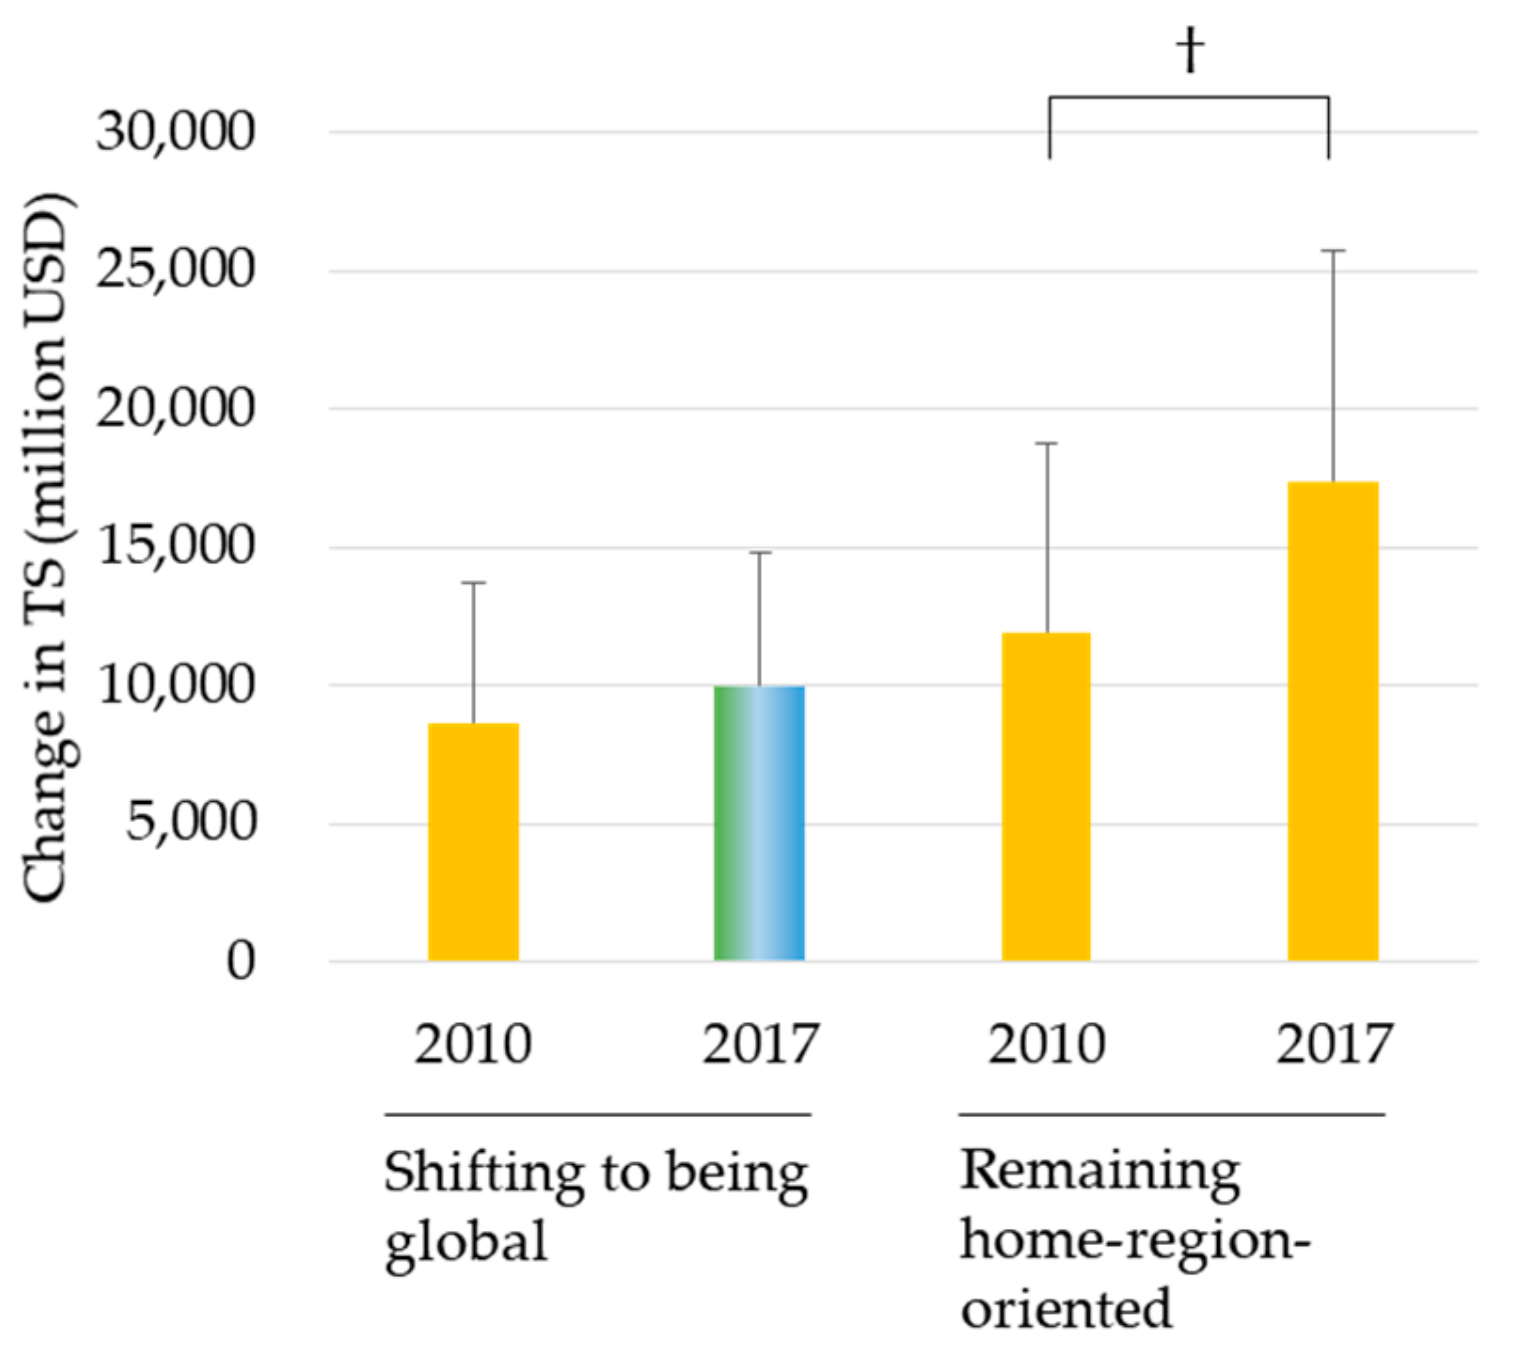
3.3.2. Comparison of Companies That Shift to Being Global versus Those That Remain Home-Region-Oriented in Terms of TS

To evaluate the impact of an international strategy change on the effectiveness in performance (i.e., change in TS from 2010 to 2017), we defined two groups of companies using 2017 data: those who shifted to being global (i.e., companies that were home-region-oriented in 2010 and shifted to bi-regional or global) and those that remained home-region-oriented (i.e., companies that were home-region-oriented in 2010 and remain as such in 2017) as a control. We tested whether or not the data satisfied the normality requirement by the Shapiro–Wilk test. Since the data satisfied normality, we performed a paired t-test using a pre-set significance level (two-sided p-value of 0.05) [39].

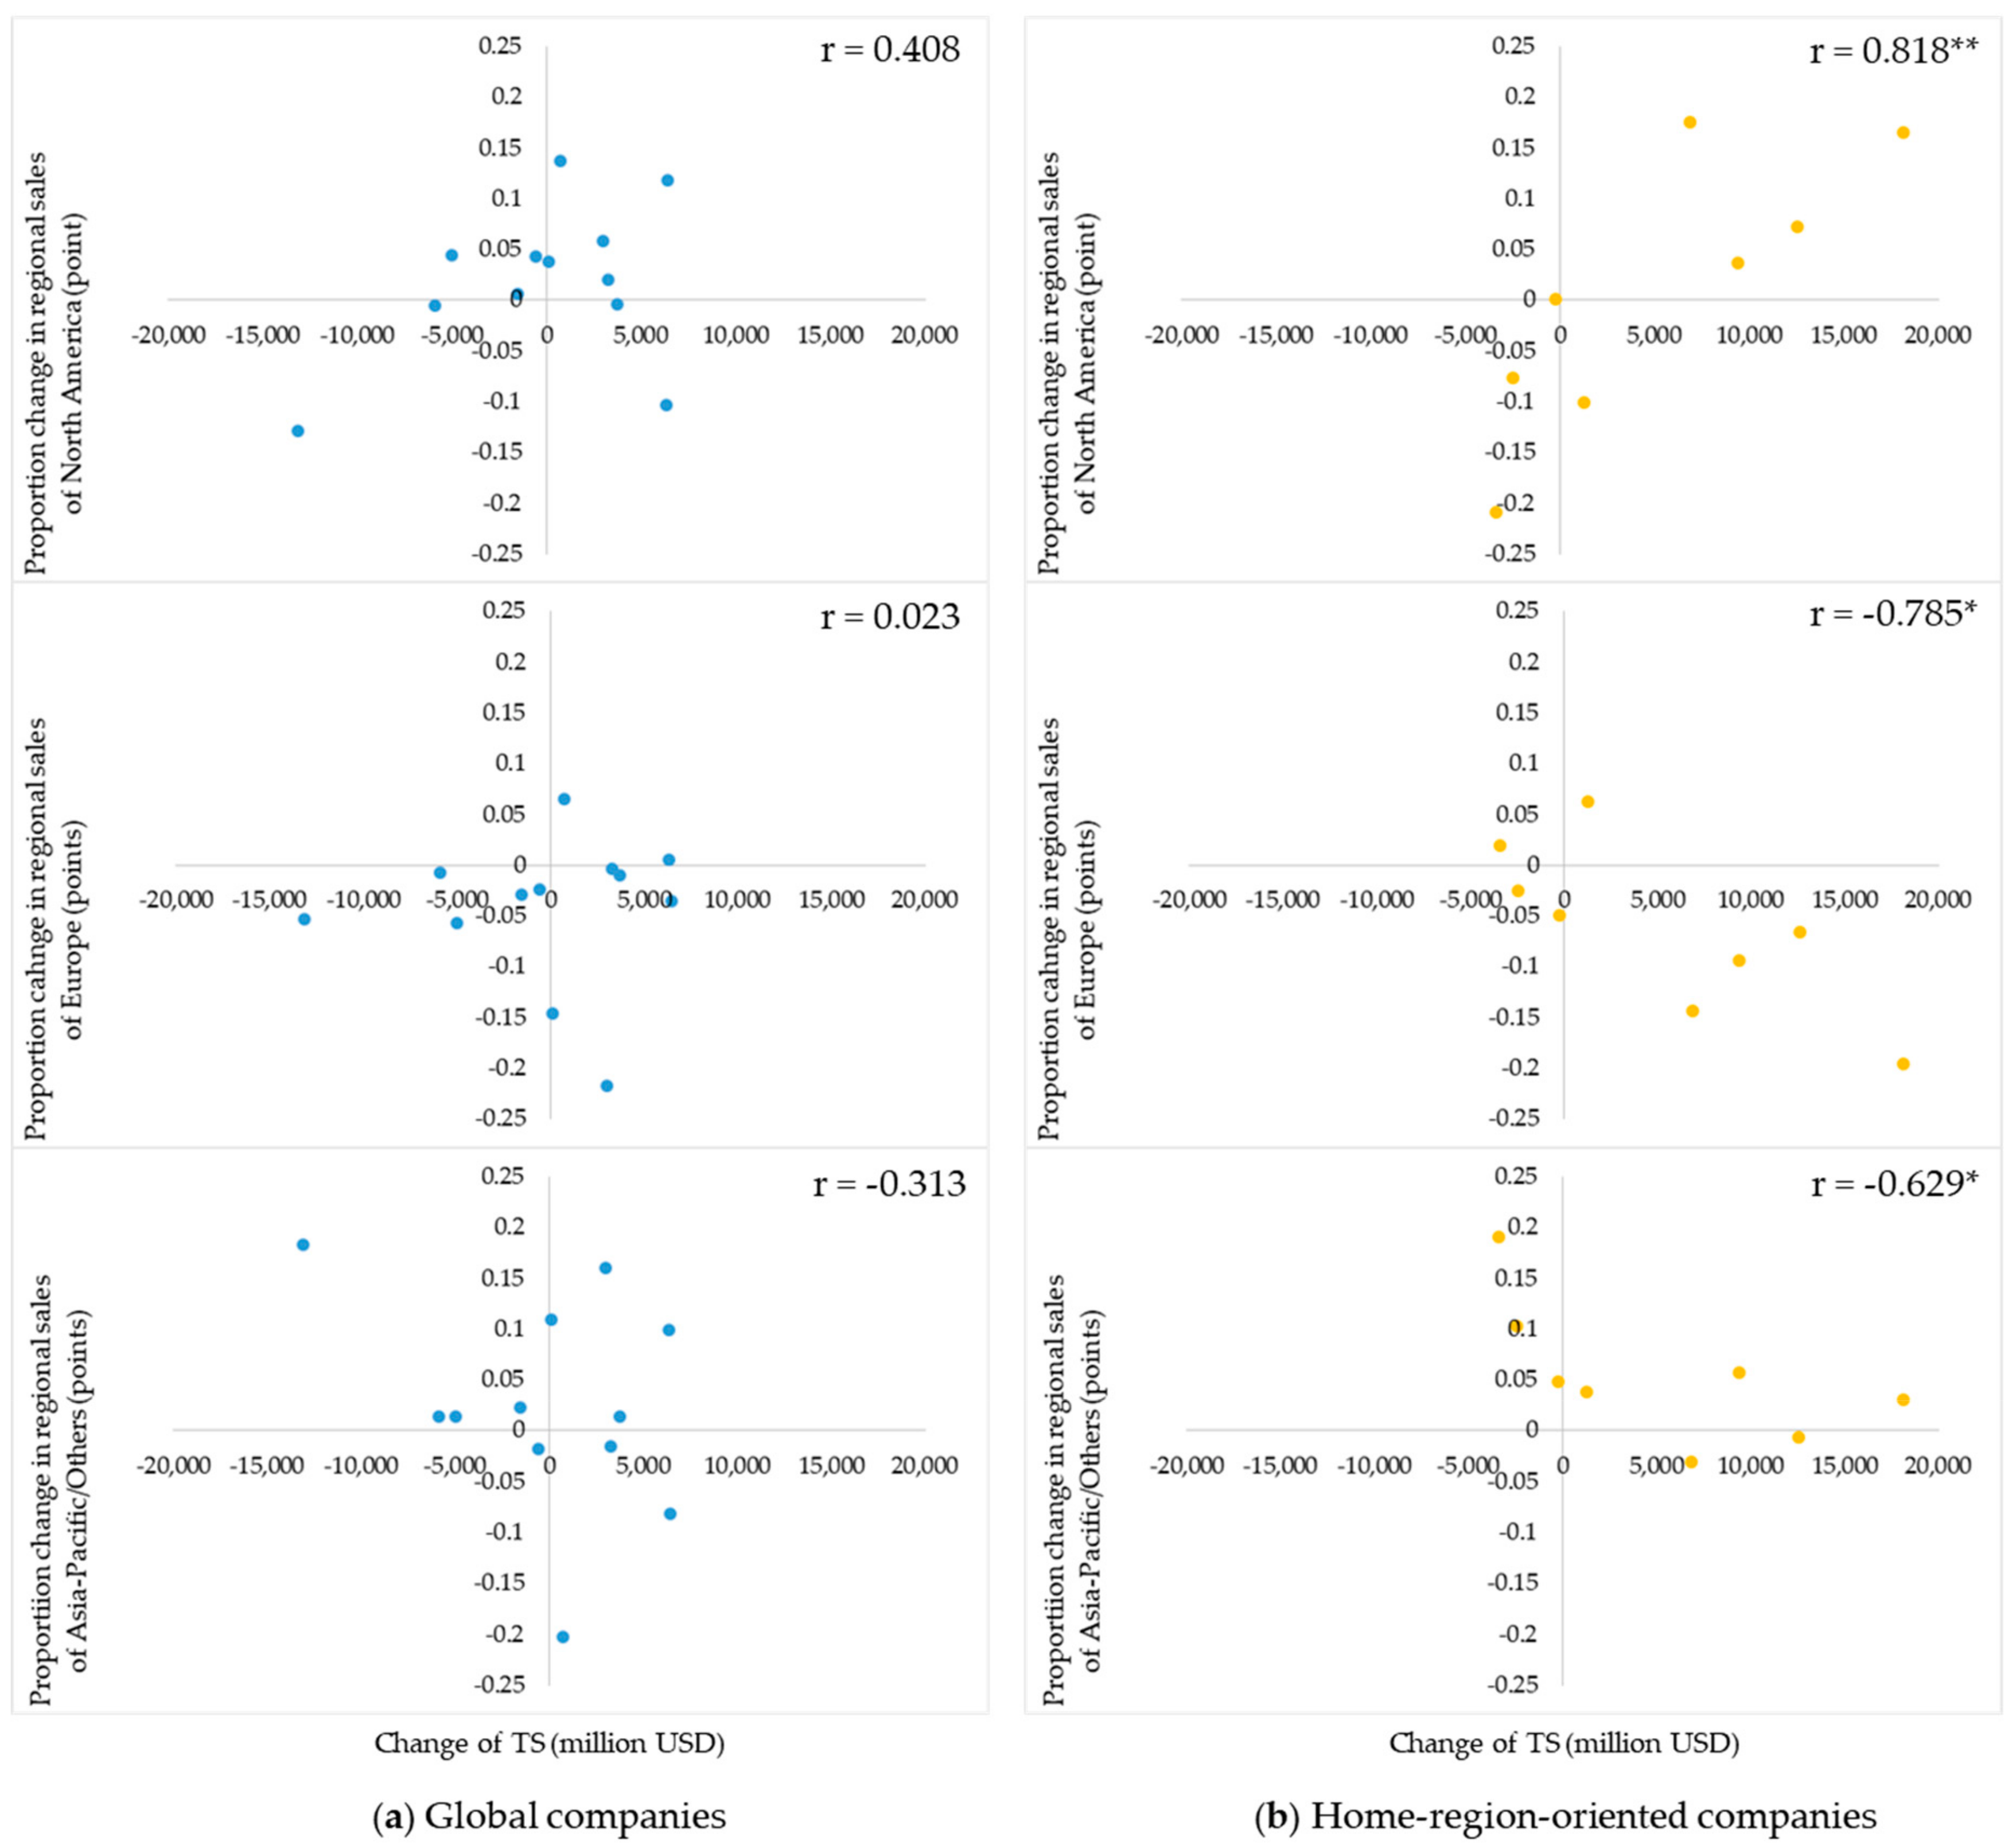
3.4. Growth Patterns of Global Companies Versus Home-Region-Oriented Companies

To understand a growth driver in the TS of global companies and home-region-oriented companies, we evaluate the Pearson correlation coefficient between the change in TS from 2010 to 2017 and the change in the proportion of the individual regions using a pre-set significance level (two-sided p-value of 0.05) [39].

4. Results

4.1. State of Internationalizaion in the Pharmaceutical Industry

Table 3 shows the resulting classifications and category transitions. In 2017, 12 companies (40%) were global and 10 companies (33%) were home-region-oriented. There were no domestic companies. From 2010 to 2017, the number of global companies increased from eight to 12, whereas home-region-oriented companies decreased from 15 to 10. Two bi-regional companies, three home-region-oriented companies, and one host-region-oriented company became global companies, whereas two global companies shifted to being bi-regional or host-region-oriented. The largest companies in the pharmaceutical industry were shifting to a global orientation, although one-third were still anchored in their home regions. A company-level breakdown of classification is displayed in Appendix A: Table A1.

4.2. Comparison of Global Companies versus Home-Region-Oriented Companies in Terms of TS and Adjusted TS

Figure 1 shows a comparison of TS and S&M productivity in 2010 and 2017 between global companies and home-region-oriented companies based on the data in 2017. There are no statistical differences in the TS and S&M productivity between global companies and home-region-oriented companies in 2010 (p = 0.069, Welch’s t-test; p = 0.456, Mann-Whitney U test, respectively). However, the S&M productivity of global companies was lower than that of home-region-oriented companies (p < 0.05, Student’s t-test), whereas the TSs of global companies and home-region-oriented companies were not statically different in 2017 (p = 0.409, Student’s t-test). Our results indicate that an international strategy of home-region orientation improved effectiveness in adjusted TS (i.e., S&M productivity).

4.3. Comparison of Companies that Shift to Being Global versus Those that Remain Home-Region-Oriented

Fifteen companies were home-region-oriented companies in 2010. Five companies shifted to being global (i.e., became a bi-regional company or a global company), one company shifted to being host-region-oriented, and nine companies remained home-region-oriented in 2017, as shown in Table A1. Figure 2 shows the change in TS from 2010 to 2017 between companies that shift to being global and those that remain home-region-oriented. Although many home-region-oriented companies shifted to being global, they did not change their TS from 2010 to 2017 (p = 0.352, Paired t-test), but companies that remained home-region-oriented increased their TS from 2010 to 2017 (p = 0.053, Paired t-test). We did not see a positive impact of an international strategy change on the effectiveness in performance.

4.4. Growth Patterns of Global Companies versus Home-Region-Oriented Companies

Figure 3 shows the correlation between the change in TS and the change of contribution on TS by regional sales. The growth of Asia-Pacific/Others had a negative correlation on the growth of TS (global: r = −0.313, p = 0.161; home-region-oriented: r = −0.629, p < 0.05), whereas the growth of North America had a positive correlation on the growth of TS (global: r = 0.408, p = 0.094; home-region-oriented: r = 0.818, p < 0.01). In addition, the proportion change between North America and Asia-Pacific/Others was inversely correlated (global: r = −0.713, p < 0.01; home-region-oriented: r = −0.843, p < 0.01). Overall, their growth patterns are considered similar between both groups (i.e., global companies and home-region-oriented companies), and the increase in the proportion of regional sales of North America contributed to the growth in TS for both groups.

5. Discussion

What does the current state of internationalization in the pharmaceutical industry look like? We found an increase in the proportion of global companies from 2010 to 2017, as shown in Table 3. Although it might not be appropriate to directly compare the results of this study with the results of prior studies, the pharmaceutical industry seems to be more aggressive in its pursuit of an international strategy to shift to being global compared to other industries [26]. This finding supports the international expansion of capability-driven industries, such as biotechnology, and linkage-driven industries, such as pharmaceuticals, from being home-region-oriented to being bi-regional or global [40]. However, we found that the proportion of home-region-oriented companies is still comparable to that of global companies, as shown in Table 3. In other words, some companies are still anchored in their home regions. According to the capabilities-based entrepreneurial theory, internationalization has three stages: “sensing” to identify and access new and/or innovative competencies, technologies, and knowledge; “mobilizing” or “seizing” to integrate these capabilities and market opportunities to create new products or services; and “operating” or “transforming” to effectively operate processes such as sales, distribution, and manufacturing and to expand the company’s regional scope [41,42]. In the mobilizing or seizing and operating or transforming stages, individual companies should satisfy environmental and internal company requirements for internationalization. Additionally, they should also recognize that a product may not be attractive to customers worldwide when it is dominant in a specific regional market. Given these challenges, a company requires sophisticated international management skills, international transferability of technological knowledge, and different competitive strategies for each region [42,43,44,45]. For the pharmaceutical industry, although pharmaceutical companies and regulatory authorities are working on broader regulatory harmonization to respond to the globalization of drug development, manufacturing, and distribution as an agenda of the International Council for the Harmonization of Technical Requirements for Pharmaceuticals for Human Use (ICH), differences by region exist, such as customer preferences (e.g., the color, taste, and shape of medications), the medical environment (e.g., the number of doctors, hospitals, and access to drugs), and biological and medical factors (e.g., standard body size and disease prevalence). Therefore, it seems to be quite difficult to find a one-size-fits-all solution across all regions. In fact, our results show that an international strategy to make sales around the world (i.e., a balanced geographic distribution of sales across regions) is not always effective in terms of TS and S&M productivity, as shown in Figure 1, even though there is no difference in the number of blockbusters (10,000 million USD or more sales in 2017) between global companies and home-region-oriented companies (average 4.42 products, average 4.80 products, respectively). This finding also proves that the capabilities-based entrepreneurial theory can apply to the pharmaceutical industry.
We investigated the impact of an international strategy change (i.e., shifting to global) on the effectiveness in performance but did not see any positive impact, as shown in Figure 2. Then, we compared companies that shifted toward a global or bi-regional orientation with those that remained home-region-oriented as a control. Companies that remained home-region-oriented showed higher S&M productivity in 2017 than those that shifted to a global company, although there was no statistically significant difference (p = 0.070, Student’s t-test; data not shown). This trend was similar to what we found in global companies versus home-region-oriented companies, as shown in Figure 1. Why, then, do some companies pursue an international strategy to make a balanced geographic distribution of sales across regions? One possibility is that they might seek another benefit from the increase in foreign regional sales called multinationality [46]. Lee and Habte-Giorgis [47] find that multinationality positively relates to Tobin’s q (TQ), which is defined as the ratio of the market value of a company to the replacement cost of its assets [48]. Similarly, Oh [49] reports that the multinationality of large global companies listed on the Fortune Global 500 positively affects TQ. Contractor et al. [21] suggest that the internationalization of knowledge-based sectors other than the pharmaceutical industry fits the S-curve in accounting performance, such as return on sales, and Oh and Contractor [22] state that most companies show an S-curve relationship between multinationality and performance, such as TQ. We found that the increase in multinationality has a positive effect on the change in TQ in the pharmaceutical industry (β = 0.555, R2 = 0.308, F = 5.351, p < 0.05), however, the TQ in 2017 of companies that remained home-region-oriented is higher than that of global-shifting companies (p < 0.05, Welch’s t-test). Thus, our results do not support the hypothesis. Therefore, further research will be required to reveal the reasons some companies pursue an international strategy to make a balanced geographic distribution of sales across regions.
In this study, we analyzed the change in TS and the change in sales in each region and found similar growth patterns between global and home-region-oriented companies. Put simply, an international strategy to focus on North America is effective for the growth of TS. Surprisingly, the proportion of Asia-Pacific/Others negatively affected TS, although it had been assumed that emerging markets have an opportunity to grow in the pharmaceutical industry, as sales in the emerging markets of Brazil, Russia, India, China, Mexico, Indonesia, South Korea, and Turkey doubled in the last five years, reaching a world market share of approximately 20% [14]. The difference in customer product preferences in Asia-Pacific/Others versus North America might be greater than that of Europe versus North America. Among many theories on global expansion, the integration–responsiveness model is one of the most popular approaches [50]. We can explain how the pharmaceutical industry is unique using this model. Responsiveness is very limited because drug modification requires a myriad of data, regulatory approval, significant cost, and lengthy time investments. Additionally, the growing complexities of international businesses prohibit an effective response to the diverse demands of markets, according to Bartlett and Ghoshal [24]. Discovering how to acquire global competitiveness with multinational flexibility, learning capabilities, and innovations is a critical agenda item for all pharmaceutical companies.

6. Conclusions and Implications

6.1. Research Conclusions

We investigated the status and effectiveness of internationalization in the pharmaceutical industry. Three major conclusions emerge from our research. First, we confirmed that the pharmaceutical industry seems to be more aggressive in its pursuit of an international strategy to shift to a global approach, yet some of the largest companies remain anchored in their home regions. This result complements the previous studies by clarifying the status of internationalization in the pharmaceutical industry with updated data over the past eight years, which is one objective of our research. Second, we found that the multinational pharmaceutical companies did not benefit from an international strategy to make sales around the world (i.e., a balanced geographic distribution of sales across regions) in terms of TS and S&M productivity. This finding provides an important insight into the effectiveness of an international strategy with a statistical approach, which is another objective of our research. Last, we found that multinational pharmaceutical companies increase their TS by focusing on regional sales in North America, which may imply that an international strategy to make sales in a specific region on the assumption that customer needs are different across regions is a better strategy when promoting internationalization for sustainable growth.

6.2. Implications, Research Limitations, and Areas of Future Research Works

This study provides implications for considering sustainable growth in the pharmaceutical industry from the perspective of internationalization. For theoretical implications, our results are consistent with the three-stage theory of internationalization representing the S-curve relationship and the capabilities-based entrepreneurial theory [21,41,42]. What are the underlying causes in the pharmaceutical industry that mean a “global” international strategy does not seem applicable or work well? Both theories indicate that diversity impedes international expansion. Since diversity in regulatory requirements, which is a typical environmental diversity, is diminishing with the progress in the standardization of regulations by ICH, it would be reasonable to consider diversity in healthcare needs, as this is another typical environmental requirement. The medical needs of lung cancer would be a good example to explain the diversity in healthcare needs. Lung cancer is among the highly prevalent cancers in the United States, Europe, and Asia [51]. At first glance, its diversity seems small. Advancements in science and technology have made it possible to classify lung cancer at the genetic level, and a specific type of lung cancer requires targeted drug treatments. For example, the prevalence of lung cancer with EGFR mutations is high in Asia but low in the United States and Europe [52,53]. Since our study does not include qualitative research, such as investigating each company’s management for internationalization, future research works focusing on the reasons why a “global” international strategy does not work well in the pharmaceutical industry are needed to reach an effective conclusion. For practical implications, pharmaceutical companies should weigh up the specific markets to secure higher sales through the advantage of being able to adapt to customers’ evolving needs. We have evaluated the effectiveness of an international strategy and find that home-region orientation has contributed to sales growth. Earlier, a blockbuster strategy putting the product that satisfies the medical needs of an extremely large market (e.g., H2 blockers to treat ulcers of the stomach and intestines) at the center of the sales growth strategy was popular, but the pharmaceutical industry is abandoning the blockbuster strategy and shifting to a nichebuster or multibuster strategy targeting specific markets with niche drugs such as orphan drugs for cancer, because there are numerous signs that a blockbuster strategy is not suitable for sustainable growth [54]. However, it does not seem easy to change a strategy, as our study shows that pharmaceutical companies were shifting to a global orientation. According to Onetti et al. [55], the context of business decisions is growing more complex than in the past, and when making strategic decisions on a business model, a company should define the activities which provide the company’s value proposition, the locations across which the company resources and/or value adding activities are spread, and the management methods of the activities. They highlight that location decisions are more and more relevant in the extant competitive scenario. Since our study does not include qualitative research such as investigating each company’s international strategic decision-making process, future research works are needed to obtain tangible solutions for the practical application of our findings. In addition, this study has approached sustainable growth from the perspective of internationalization. According to Ito and Lechevalier [56], sustainable growth requires both exporting (i.e., internationalization) and innovation (i.e., R&D). Therefore, future studies that approach sustainable growth from the perspective of R&D must derive the comprehensive implications of a business model for the pharmaceutical industry. A new business model is desirable to ensure sustainable growth in the pharmaceutical industry and to fulfill important responsibilities for human healthcare through continuous product delivery based on a sustainable business model.

Author Contributions

Conceptualization, F.T.; methodology, F.T.; software, F.T.; validation, F.T; formal analysis, F.T.; investigation, F.T.; resources, F.T.; data curation, F.T.; writing—original draft preparation, F.T.; writing—review and editing, T.M., Y.L., S.S. and K.K.; supervision, K.K. All authors have read and agreed to the published version of the manuscript.

Funding

This work was supported by the JSPS KAKENHI grant numbers JP23730336 and JP15H05183. The funding sources had no involvement in the study design; in the collection, analysis and interpretation of data; in the writing of the report; and in the decision to submit the article for publication.

Acknowledgments

We are grateful to the editors and the referees for their valuable comments that helped to improve this paper.

Conflicts of Interest

Fumio Teramae, one of the authors, is an employee of Eli Lilly Japan K.K. The company does not have any direct relationship to the content of this article.

Appendix A

Table A1. Company-level breakdown of classification.
CompanyRankClassificationProportion of Regional Sales (%)
North AmericaEuropeAsia-Pacific/Others
International strategy: Global
AlexionN/AHost-region-oriented38.0450.9411.02
39Global43.8829.1726.95
Astellas Pharma18Home-region-oriented19.6019.9260.53
23Global33.3126.4640.23
AstraZeneca7Bi-regional49.9831.1018.91
11Global37.0525.8137.14
Bayer14Global27.5937.6934.72
15Global29.5437.3633.10
Boehringer Ingelheim16Global45.4832.4922.03
19Global45.0931.5123.40
GlaxoSmithKline6Global32.9132.0235.07
7Global37.3126.3136.37
Merck & Co4Global43.9829.3526.67
4Global43.4328.6127.96
Merck KGaA21Home-region-oriented17.6250.4031.96
27Global21.3535.7542.91
Mylan24Home-region-oriented52.6533.1414.21
22Global42.2633.6624.08
Novartis2Bi-regional41.9638.5019.53
2Global42.5635.6221.82
Roche5Global37.9725.5536.48
3Global49.7221.9628.32
Sanofi3Global29.5229.6140.87
6Global33.8227.1739.01
International strategy: Bi-regional
Pfizer1Global43.0324.3732.59
1Bi-regional49.5316.1934.28
Shionogi45Home-region-oriented12.1123.3464.52
N/ABi-regional3.6046.6249.78
Takeda15Home-region-oriented34.0612.1853.76
20Bi-regional33.7917.7248.49
UCB33Bi-regional36.7647.2416.04
30Bi-regional49.4730.8019.75
International strategy: Home-region-oriented
AbbVieN/AHome-region-oriented59.7620.9619.29
8Home-region-oriented67.0214.3618.62
AbbVieN/AHome-region-oriented59.7620.9619.29
8Home-region-oriented67.0214.3618.62
Amgen13Home-region-oriented76.7723.23
10Home-region-oriented78.6021.40
Biogen36Home-region-oriented50.2641.887.86
24Home-region-oriented67.7627.474.76
Bristol-Myers Squibb11Home-region-oriented64.7417.7017.57
12Home-region-oriented54.6724.0121.32
Celgene35Home-region-oriented60.3734.944.69
21Home-region-oriented64.0225.5910.40
Daiichi Sankyo19Home-region-oriented27.0710.8062.14
26Home-region-oriented19.348.2972.37
Eisai20Home-region-oriented41.506.0852.40
32Home-region-oriented20.598.0171.40
Eli Lilly9Home-region-oriented55.7522.1322.12
13Home-region-oriented55.9017.2426.86
Gilead Sciences22Home-region-oriented53.1439.896.98
9Home-region-oriented69.6920.349.97
Johnson & Johnson8Unknown48.7751.23
5Home-region-oriented54.2345.77
International strategy: Host-region-oriented
Novo Nordisk17Global38.8530.7130.44
16Host-region-oriented51.9318.9729.10
Shire37Host-region-oriented67.2132.79
18Host-region-oriented63.6036.40
Sumitomo Dainippon44Home-region-oriented35.1564.85
40Host-region-oriented56.7943.21
Teva Pharmaceutical12Host-region-oriented58.2724.4817.24
14Host-region-oriented53.4927.1719.34
Top: in 2010; bottom: in 2017. Sumitomo Dainippon: a regional sale of Japan in 2010 is 54.7% according to their annual report. Category: blue color represents global, green color represents bi-regional, yellow color represents home-region-oriented, and gray color represents host-region-oriented.

References

  1. Booth, B.; Zemmel, R. Prospects for productivity. Nat. Rev. Drug Discov. 2004, 3, 451–456. [Google Scholar] [CrossRef]
  2. Kneller, R. The importance of new companies for drug discovery: Origins of a decade of new drugs. Nat. Rev. Drug Discov. 2010, 9, 867–882. [Google Scholar] [CrossRef] [PubMed]
  3. Ogrean, C. A snapshot of the world of global multinationals: An industry based analysis of Fortune Global 500 companies. Stud. Bus. Econ. 2017, 12, 136–154. [Google Scholar] [CrossRef] [Green Version]
  4. Angelis, A.; Lange, A.; Kanavos, P. Using health technology assessment to assess the value of new medicines: Results of a systematic review and expert consultation across eight European countries. Eur. J. Health Econ. 2018, 19, 123–152. [Google Scholar] [CrossRef] [Green Version]
  5. Teramae, F.; Yamaguchi, N.; Makino, T.; Sengoku, S.; Kodama, K. Holistic cost-effectiveness analysis of anticancer drug regimens in Japan. Drug Discov. Today 2019, in press. [Google Scholar] [CrossRef]
  6. Munos, B. Lessons from 60 years of pharmaceutical innovation. Nat. Rev. Drug Discov. 2009, 8, 959–968. [Google Scholar] [CrossRef] [PubMed]
  7. Scannell, J.W.; Blanckley, A.; Boldon, H.; Warrington, B. Diagnosing the decline in pharmaceutical R&D efficiency. Nat. Rev. Drug Discov. 2012, 11, 191–200. [Google Scholar]
  8. Smietana, K.; Siatkowski, M.; Moller, M. Trends in clinical success rates. Nat. Rev. Drug Discov. 2016, 15, 379–380. [Google Scholar] [CrossRef]
  9. Paul, S.M.; Mytelka, D.S.; Dunwiddle, C.T.; Persinger, C.C.; Munos, B.H.; Lindborg, S.R.; Schacht, A.L. How to improve R&D productivity: The pharmaceutical industry’s grand challenge. Nat. Rev. Drug Discov. 2010, 9, 203–214. [Google Scholar]
  10. Scott, K. Pharma’s Broken Business Model: An Industry on the Brink of Terminal Decline. Endpoints News. Available online: https://endpts.com/pharmas-broken-business-model-an-industry-on-the-brink-of-terminal-decline/ (accessed on 23 December 2019).
  11. Glickman, S.W.; McHutchison, J.G.; Peterson, E.D.; Cairns, C.B.; Harrington, R.A.; Califf, R.M.; Schulman, K.A. Ethical and scientific implications of the globalization of clinical research. N. Engl. J. Med. 2009, 360, 816–823. [Google Scholar] [CrossRef]
  12. Jeong, S.; Sohn, M.; Kim, J.H.; Ko, M.; Seo, H.; Song, Y.K.; Choi, B.; Han, N.; Na, H.S.; Lee, J.G.; et al. Current globalization of drug interventional clinical trials: Characteristics and associated factors, 2011–2013. Trials 2017, 18, 288. Available online: https://link.springer.com/article/10.1186/s13063-017-2025-1 (accessed on 23 December 2019). [CrossRef] [PubMed] [Green Version]
  13. Moorkens, E.; Meuwissen, N.; Huys, I.; Declerck, P.; Vulto, A.G.; Simoens, S. The market of biopharmaceutical medicines: A snapshot of a diverse industrial landscape. Front. Pharmacol. 2017. [Google Scholar] [CrossRef] [PubMed] [Green Version]
  14. Tannoury, M.; Attieh, B.Z. The influence of emerging markets on the pharmaceutical industry. Curr. Ther. Res. 2017, 86, 19–22. [Google Scholar] [CrossRef] [PubMed]
  15. Vernon, R. Sovereignty at bay: The multinational spread of U.S. enterprises. Thunderbird Int. Bus. Rev. 1971, 13, 1–3. [Google Scholar] [CrossRef]
  16. Levitt, T. The globalization of markets. Harv. Bus. Rev. 1983, 61, 92–102. [Google Scholar]
  17. Kogut, B. Designing global strategies: Profiting from operational flexibility. Sloan Manag. Rev. 1985, 26, 27–38. [Google Scholar] [CrossRef]
  18. Siddharthan, N.S.; Lall, S. Recent growth of the largest US multinationals. Oxford Bull. Econ. Stat. 1982, 44, 1–13. [Google Scholar] [CrossRef]
  19. Kumar, M.S. Growth, Acquisition and Investment: An. Analysis of the Growth of Industrial Firms and Their Overseas Activities; Cambridge University Press: Cambridge, UK, 1984; 211p. [Google Scholar]
  20. Grant, R.M. Multinationality and performance among British manufacturing companies. J. Int. Bus. Studies 1987, 18, 79–89. [Google Scholar] [CrossRef]
  21. Contractor, F.; Kundu, S.K.; Hsu, C.C. A three-stage theory of international expansion: The link between multinationality and performance in the service sector. J. Int. Bus. Stud. 2003, 34, 5–18. [Google Scholar] [CrossRef]
  22. Oh, C.H.; Contractor, F. A regional perspective on multinational expansion strategies: Reconsidering the three-stage paradigm. Br. J. Manag. 2014, 25, S42–S59. [Google Scholar] [CrossRef]
  23. Kotler, P. Global standardization—Courting danger. J. Consum. Mark. 1986, 3, 13–15. [Google Scholar] [CrossRef] [Green Version]
  24. Bartlett, C.A.; Ghoshal, S. Managing across Borders: The Transnational Solution; Harvard Business School Press: Boston, MA, USA, 1989. [Google Scholar]
  25. Buckley, P.J.; Ghaur, P.N. Globalisation, economic geography and the strategy of multinational enterprises. J. Int. Bus. Stud. 2004, 35, 81–98. [Google Scholar] [CrossRef]
  26. Rugman, A.M.; Verbeke, A. A perspective of regional and global strategies of multinational enterprises. J. Int. Bus. Stud. 2004, 35, 3–18. [Google Scholar] [CrossRef] [Green Version]
  27. Ohmae, K. Triad Power: The Coming Shape of Global Competition; The Free Press: New York, NY, USA, 1985. [Google Scholar]
  28. Gautam, A.; Pan, X. The changing model of big pharma: Impact of key trends. Drug Discov. Today 2016, 21, 379–384. [Google Scholar] [CrossRef] [Green Version]
  29. Oh, C.H.; Rugman, A.M. The dynamics of regional and global multinationals, 1999–2008. Multinatl. Bus. Rev. 2014, 22, 108–117. [Google Scholar]
  30. Farrell, D. Beyond offshoring: Assess your company’s global potential. Harv. Bus. Rev. 2004, 82, 82–90. [Google Scholar]
  31. Cacciotti, J.; Clinton, P. Pharma Exec’s Top 50 Companies 2010. Available online: https://www.slideshare.net/healthcaremanas/top-50-pharmaceutical-companies-2010-pharma-exec-report (accessed on 11 January 2020).
  32. Christel, M. Pharma Exec’s Top 50 Companies 2018. Available online: http://www.pharmexec.com/pharm-execs-top-50-companies-2018?pageID=2 (accessed on 11 January 2020).
  33. International Monetary Fund. International Financial Statistics. Exchange Rates. Available online: http://data.imf.org/?sk=4C514D48-B6BA-49ED-8AB9-52B0C1A0179B&sId=1409151240976 (accessed on 27 September 2018).
  34. Geringer, J.M.; Beamish, P.W.; Dacosta, R.C. Diversification strategy and internationalization: Implications for MNE performance. Strateg. Manag. J. 1989, 10, 109–119. [Google Scholar] [CrossRef]
  35. Qian, G.; Khoury, T.; Peng, M.; Qian, Z. The performance implications of intra- and inter-regional geographic diversification. Strateg. Manag. J. 2010, 31, 1018–1030. [Google Scholar] [CrossRef] [Green Version]
  36. Liu, C.; Guo, X.; Wang, Z. R&D expenses and operating performance in pharmaceutical industry. In International Conference on Humanities Education and Social Sciences; Francis Academic Press: London, UK, 2018; pp. 525–530. [Google Scholar]
  37. Pettigrew, A. Longitudinal field research on change: Theory and practice. Organ. Sci. 1990, 1, 267–292. [Google Scholar] [CrossRef]
  38. Weiss, D.; Naik, P.; Weiss, R. The ‘big pharma’ dilemma: Develop new drugs or promote existing ones? Nat. Rev. Drug Discov. 2009, 8, 533–534. [Google Scholar] [CrossRef]
  39. Witte, R.S.; Witte, J.S. Statistics, 11th ed.; Wiley: Hoboken, NJ, USA, 2017. [Google Scholar]
  40. Oh, C.H.; Kim, M.; Shin, J. Paths and geographic scope of international expansion across industries. Int. Bus. Rev. 2019, 28, 560–574. [Google Scholar] [CrossRef]
  41. Doz, Y.; Santos, J.; Williamson, P. From Global to Metanational: How Companies Win in the Knowledge Economy; Harvard Business School Press: Boston, MA, USA, 2001. [Google Scholar]
  42. Teece, D.J. A dynamic capabilities-based entrepreneurial theory of the multinational enterprise. J. Int. Bus. Stud. 2014, 45, 8–37. [Google Scholar] [CrossRef] [Green Version]
  43. Kuemmerle, W. Foreign direct investment in industrial research in the pharmaceutical and electronics industries—Results from a survey of multinational firms. Res. Policy 1999, 28, 179–193. [Google Scholar] [CrossRef]
  44. Patel, P.; Vega, M. Patterns of internationalization of corporate technology: Location vs. home country and advantage. Res. Policy 1999, 28, 145–155. [Google Scholar] [CrossRef]
  45. Wiersema, M.F.; Bowen, H.P. Corporate diversification: The impact of foreign competition, industry globalization, and product diversification. Strateg. Manag. J. 2008, 29, 115–132. [Google Scholar] [CrossRef]
  46. Yang, Y.; Driffield, N. Multinationality-Performance Relationship. Manag. Int. Rev. 2012, 52, 23–47. [Google Scholar] [CrossRef] [Green Version]
  47. Lee, J.; Habte-Giorgis, B. Empirical approach to the sequential relationships between firm strategy, export activity, and performance in U.S. manufacturing firms. Int. Bus. Rev. 2004, 13, 101–129. [Google Scholar] [CrossRef]
  48. Tobin, J. A general equilibrium approach to monetary theory. J. Money Credit Bank. 1969, 1, 15–29. [Google Scholar] [CrossRef]
  49. Oh, H.M. Market value creation through international expansions: Evidence from Fortune Global 500 firms. J. Int. Trade Commer. 2016, 12, 157–167. [Google Scholar] [CrossRef]
  50. Prahalad, C.K.; Doz, Y.L. The Multinational Mission: Balancing Local Demands and Global Vision; NY Free Press & Collier Macmillan: New York, NY, USA, 1987. [Google Scholar]
  51. International Agency for Research on Cancer. Cancer Today. Available online: http://gco.iarc.fr/today/online-analysis-map (accessed on 12 January 2020).
  52. Johnson, B.E.; Kris, M.G.; Berry, L.D.; Kwiatkowski, D.J.; Iafrate, A.J.; Wistuba, M.V.G.I.; Franklin, W.A.; Ladanyi, M.; Su, P.F.; Sequist, L.V.; et al. A multicenter effort to identify driver mutations and employ targeted therapy in patients with lung adenocarcinomas: The Lung Cancer Mutation Consortium (LCMC). J. Clin. Oncol. 2013, 31, 8019. [Google Scholar]
  53. Kris, M.G.; Natale, R.B.; Herbst, R.S.; Lynch, T.J.J.; Prager, D.; Belani, C.P.; Schiller, J.H.; Kelly, K.; Spiridonidis, H.; Sandler, A.; et al. Efficacy of gefitinib, an inhibitor of the epidermal growth factor receptor tyrosine kinase, in symptomatic patients with non-small cell lung cancer. J. Am. Med Assoc. 2003, 290, 2149–2158. [Google Scholar] [CrossRef] [PubMed] [Green Version]
  54. Montalban, M.; Sakinç, M.E. Financialization and productive models in the pharmaceutical industry. Ind. Corp. Chang. 2013, 22, 981–1030. [Google Scholar] [CrossRef]
  55. Onetti, A.; Zucchella, A.; Jones, M.V.; McDougall-Covin, P.P. Internationalization, innovation and entrepreneurship: Business models for new technology-based firms. J. Manag. Gov. 2012, 16, 337–368. [Google Scholar] [CrossRef]
  56. Ito, K.; Lechevalier, S. Why some firms persistently out-perform others: Investigating the interactions between innovation and exporting strategies. Ind. Corp. Chang. 2010, 19, 1997–2039. [Google Scholar] [CrossRef]
Figure 1. Comparison of global companies versus home-region-oriented companies in total sales (TS) and sales and marketing (S&M) productivity: (a) TS in 2010. Global companies, n = 12; home-region-oriented companies, n = 9; (b) TS in 2017. Global companies, n = 12; home-region-oriented companies, n = 9; (c) S&M productivity in 2010. Global companies, n = 11 (one company does not provide S&M productivity); home-region-oriented companies, n = 9 (one company does not provide S&M productivity); (d) S&M productivity in 2017. Global companies, n = 11 (one company does not provide S&M productivity); home-region-oriented companies, n = 9 (one company does not provide S&M productivity). *, p < 0.05.
Sustainability 12 00867 g001
Figure 2. Comparison of change in total sales (TS) by shifting to being global versus remaining a home-region-oriented. Companies that shifted to being global, n = 5; companies that remained home-region-oriented, n = 9. †, p < 0.1
Sustainability 12 00867 g002
Figure 3. Growth pattern of global companies and home-region-oriented companies from 2010 to 2017. The X axis represents the change in total sales (TS) from 2010 to 2017 and the Y axis represents the proportion change in sales per region from 2010 to 2017. (a) Global companies, n = 12; (b) home-region-oriented companies, n = 8 (two companies do not provide the data of regional sales). *, p < 0.05, **, p < 0.01.
Sustainability 12 00867 g003
Table 1. Definition of four categories.
CategoryDefinition
GlobalMore than 20% of sales in all three regions
Bi-regionalMore than 20% of sales in two regions but less than 50% in the home region
Home-region-orientedMore than 50% of sales within the home region
Host-region-orientedMore than 50% of sales in one region besides the home region
Category: blue color represents global, green color represents bi-regional, yellow color represents home-region-oriented, and gray color represents host-region-oriented.
Table 2. List of sample pharmaceutical companies per home region.
North AmericaEuropeAsia-Pacific/Others
AbbVieAstraZenecaAstellas Pharma
AlexionBayerDaiichi Sankyo
AmgenBoehringer IngelheimEisai
BiogenGlaxoSmithKlineShionogi
Bristol-Myers SquibbMerck KGaASumitomo Dainippon
CelgeneNovartisTakeda
Eli LillyNovo NordiskTeva Pharmaceutical
Gilead SciencesRoche
Johnson & JohnsonSanofi
Merck & CoShire
MylanUCB
Pfizer
Table 3. Classification of the largest pharmaceutical companies in 2010 and 2017.
CategoryIn 2010
(1)(2)(3)(4)(5)Total
In 2017(1) Global6231012(40%)
(2) Bi-regional112004(13%)
(3) Home-region-oriented0090110(33%)
(4) Host-region-oriented101204(13%)
(5) Unknown000000(0%)
Total8
(27%)
3
(10%)
15
(50%)
3
(10%)
1
(3%)
Category: blue color represents global, green color represents bi-regional, yellow color represents home-region-oriented, gray color represents host-region-oriented, and white color represents unknown.

