Abstract
Dematerialization is a phenomenon in which resource consumption and pollutant discharge decrease during economic development. In order to explore the optimal paths of Beijing’s dematerialization, this study combines material flow analysis method and the Tapio decoupling model to construct a city dematerialization evaluation model, and establishes a system dynamics model to simulate the comprehensive dematerialization levels and the dematerialization levels of eight materials under four scenarios. The results show that the key factors affecting the dematerialization levels of resource and discharge end were non-metals consumption and CO2 emissions respectively. During 2016–2030, Beijing would achieve weak decoupling state under four scenarios, but the degree of dematerialization would be different. For the comprehensive dematerialization level, during 2017–2024, an industrial restructuring (IR) scenario, which would strengthen R&D investment and optimize the industrial structure, would be the optimal choice. During 2025–2030, an environmental governance (EG) scenario, which means increasing the investment in pollution control, would bring about the best dematerialization level. There would be differences in the optimal dematerialization paths for eight materials. For example, economic sustainable degrowth (ESD) and EG scenarios would be the optimal paths for dematerialization of atmospheric pollutants in the period 2017–2021 and 2022–2030, respectively.
1. Introduction
The rapid development of the global economy has brought a lot of resource consumption, environmental pollution and greenhouse gas emissions [1]. Global GDP increased from USD 33.58 trillion to USD 76.10 trillion during 2000–2016, an increase of 2.27 times [2]. With economic growth, a large amount of resources are put into economic activities. For example, steel is used for infrastructure construction to support economic development. Global steel consumption increased from 846.86 Mt (million tonnes) to 1636.99 Mt during 2000–2016 [3,4]. At the same time, a large amount of energy consumption in the global economic activities has brought about a sharp increase in carbon emissions. From 2000 to 2016, global carbon emissions increased by 1.39 times to 32.41 Gt (gigatonnes) CO2 in 2016 [5]. In the face of this severe development problem, the UN released 17 sustainable development goals (SDGS) in 2015, which aim to address development issues in the social, economic and environmental dimensions. The goals point out that sustainable consumption and production patterns should be promoted [6]. The key to achieving sustainable development over the long term depends on whether and to what extent resources consumption and environmental pollution can be separated from economic output, that is, as economic output increases, resources consumption and environmental pollutants discharge decrease [7]. Many scholars use the concept of dematerialization to measure the reduction of resource pressure and environmental pressure in the process of economic development, which reflects the materials reduction of resource end and discharge end in the whole system. It not only includes the decrease of material input from ecological environment system to economic system, but also the decrease of pollutants from economic system to ecological environment system [8,9,10,11].
Table 1 shows the results of dematerialization studies in different study regions. The dematerialization research based on MFA is mainly at the global and national levels, and there are relatively few studies at the city level. There are differences between the results of the dematerialization assessment at the global level and the country level. The dematerialization trend of developed countries or economies may be offset by the resource intensification of developing countries or economies [14]. Hence, at the global level, it is difficult to determine whether dematerialization has occurred in country level or economies [13,14,15,17]. Similarly, due to the different levels of economic development of cities within the country, it is necessary to conduct dematerialization research at city level to judge the development stage of the city [20]. In addition, cities are the specific implementers of global or national policies and the main force driving the realization of the overall goals. In order to achieve decoupling between economic output and resource environment pressures at the global or national level, practical policies should be formulated at the city level. From the perspective of dematerialization evaluation methods, decoupling analysis has been widely used. The decoupling index usually describes the relationship between changes in the percentage of resources consumption or pollutants discharge and the corresponding changes in the percentage of GDP, which can accurately reflect the degree of dematerialization [22,23]. In terms of research objects, there are many studies of dematerialization focus on the relationship between a single material and economic output, such as CO2, various other air pollutants [24,25], electricity [26], water [27,28] and waste [29]. However, to achieve sustainable development requires the coordinated development of resources, environment and economy. For example, the European Union issued the “Europe 2020 Strategy” as a strategic platform for sustainable development, and proposed to build a more resource-efficient, greener and more competitive economy [30]. China proposes “Program” to actively implement UN 2030 sustainable development strategy The Chinese government also proposed “China’s National Plan on Implementation of the 2030 Agenda for Sustainable Development” to actively implement the 2030 Agenda for Sustainable Development, and proposed a series of measures to effectively use energy resources and strengthen environmental protection to promote sustained and steady economic growth [31]. Therefore, it is necessary to establish a resource-economy-environment comprehensive dematerialization evaluation model at the city level.

Table 1.
The comparison of dematerialization studies.
In different stages of economic development, the population structure and industrial patterns of each city are quite different. According to the specific characteristics of the city, feasible development measures should be proposed that are appropriate for the specific area. Therefore, on the basis of the evaluation of the dematerialization level, it is necessary to find the factors affecting the coordinated development of resource-economy-environment. By establishing the interaction between various influencing factors, the dematerialization level under different policies is simulated, and the specific development path of city dematerialization is formulated accordingly. The relationship between city economic development and resources and environment is characterized by nonlinearity, dynamics and complexity. System dynamics (SD) modelling is especially suitable for solving the problems of large-scale complex socio-economic system, which can fully reflect the internal nonlinear structure and dynamic changes of the system, and can simulate the city development trend under various constraints [1,32,33,34].
As the capital of China, Beijing is an important economic development centre. In 2016, Beijing’s GDP accounted for 3.3% of China’s GDP [35]. Meanwhile, Beijing consumed a lot of resources and generated a large amount of waste. Beijing’s natural gas consumption and domestic waste production accounted for 7.6% and 4.1% of China’s, respectively [36]. Therefore, the resource and environmental problems faced by Beijing’s rapid economic development are more prominent. Beijing, as a pioneer in development, can provide reference for the development of other cities.
Based on the above discussion, this study (1) extends the MFA data of Beijing based on Dai and Liu [21], adopts decoupling index model to comprehensively evaluate Beijing’s dematerialization level. Furthermore, the relationship between the dematerialization index of constituent material and the dematerialization index of resource end and discharge end in Beijing is analyzed; (2) establishes a system dynamics (SD) model of city dematerialization development, and demonstrate the applicability of the SD model in Beijing resource-economy-environment system; (3) discusses the influence of four development strategies on Beijing’s dematerialization development, including business as usual (BAU), economic sustainable degrowth (ESD), industrial restructuring (IR) and environmental governance (EG), and give the optimal paths of Beijing’s dematerialization development.
2. Materials and Methods
The research framework of this study is shown in Figure 1. The analysis of city dematerialization paths mainly includes three parts. Firstly, using the material flow analysis method to establish a city material metabolism accounting framework and a detailed material flow account. Secondly, by studying the comprehensive dematerialization level and relationships between dematerialization level of constituent materials and dematerialization level of resource end and discharge end, the development trend and characteristics of city dematerialization are comprehensively analyzed. Finally, considering various influencing factors of the four subsystems of economy, population, resources and environment, the system dynamics model is constructed to simulate the development trend of city dematerialization under different policies, and the optimal development paths of city dematerialization is determined.
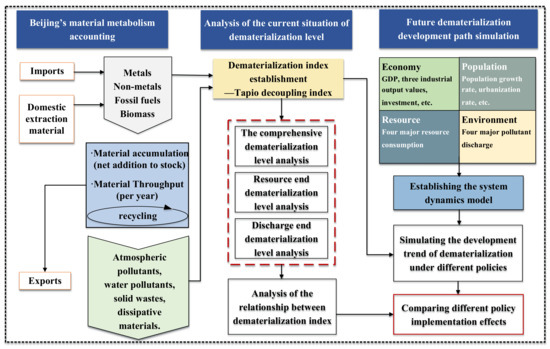
Figure 1.
Research framework of city dematerialization development paths.
2.1. Material Metabolism Accounting
Material flow analysis (MFA) is a method for measuring the scale and structure of socio-economic metabolism [37,38]. It quantifies the material input of the particular economic system, the change of material stocks in an economic system, and the material output to other economies and the environment in a certain time range in terms of mass [39,40], which can objectively reflect the material flow between the economic system and the environmental system, and measure the resource and environmental pressures of the economic system [41,42]. The MFA method has been widely used in resource use accounting and environmental impact accounting [16,37,43,44,45]. The MFA was originally a tool for studying the metabolism of materials at global and national scales [46,47]. Then, the MFA was developed to the region and city level [36,48,49,50,51]. The two most important indicators in the framework of city material flow accounting are direct material input (DMI) and domestic processed output (DPO). The materials that enter a regional economic system mainly include domestic extraction material (DE) and imports, and the sum of these two parts is called direct material input. The DMI represents the resources needed to maintain the normal activities of the economic system, which can reflect the resource demand pressure of the economic system on the natural environment system. In contrast, the materials flowing out of the economic system include DPO and exports. The DPO is the materials that enter the natural environment system from the economic system. The DPO indicates the pollutants discharge returned to the natural environment system after a series of production and consumption processes in the economic system, which can reflect the environmental discharge pressure of the economic system on the natural environment system. Exports are materials that enter from one economic system to another. In order to describe the resources consumption and pollutants discharge of materials in the economic system in detail and demonstrate the influences of different material flows on the economic system, the DMI is divided into metals, non-metals, fossil fuels and biomass, respectively and the DPO is divided into atmospheric pollutants, water pollutants, solid waste and dissipative materials, respectively [52,53]. The detailed accounting method of the Beijing’s MFA is shown in Supplementary Information A and the accounting results can be found in Supplementary Information B. Beijing’s MFA data accounting results are discussed in Supplementary Information C.
2.2. Evaluation Method of City Dematerialization Level
In the decoupling model for evaluating the dematerialization level, there are two commonly used decoupling indicators, namely the OECD decoupling index [54] and the Tapio decoupling index [55]. The calculation results of the OECD decoupling index are greatly influenced by the selection of the base year. If the base year is chosen differently, the calculation results of the decoupling index value may vary significantly. The Tapio decoupling indicator is the elasticity, and the base year is not required for calculation. Moreover, the OECD decoupling evaluation cannot distinguish between absolute decoupling and relative decoupling, and cannot further classify undecoupling state [56]. The Tapio decoupling index provides the more detailed decoupling degree. It can be seen that the division of Tapio decoupling is the further development and improvement of the decoupling theory. At present, the Tapio decoupling index has been widely used in related literature [13,19,20,21]. Therefore, this study uses the Tapio decoupling model to measure the city dematerialization level. The decoupling model is constructed as follows:
where, is the decoupling index of year j relative to year i, k = DMI, DPO, REPI (Resource and Environmental Pressure Index, REPI = 0.5 × DMI + 0.5 × DPO [21]), which can represent the decoupling index of resource end, decoupling index of discharge end, and the comprehensive decoupling index; and indicate the economic drivers of the year i and year j respectively, represented by GDP in that year; and represent the environmental pressure of the year i and year j respectively. This study uses DMI, DPO, and REPI to represent environmental pressure of resource end, environmental pressure of discharge end, and the comprehensive environmental pressure respectively.
From Equation (1), the decoupling index of eight kinds of materials can be defined as follows:
where, k = 1, 2, 3, 4, 5, 6, 7, 8, respectively represent eight materials of resource end and discharge end, namely metals, non-metals, fossil fuels, biomass, atmospheric pollutants, water pollutants, solid waste, dissipative materials.
Thus, the materialization index of DMI and DPO can be decomposed as follows:
Referring to the Tapio decoupling framework [55], this study divides the degree of decoupling into three categories: decoupling, coupling and negative decoupling, and further refines it into eight indicators, as shown in Figure 2. Since Beijing’s GDP has maintained growth since 1992 (△GDP > 0), all possible decoupling states in Beijing are the four on the right side of the Y-axis in Figure 2 (namely expansive negative decoupling, expansive coupling, weak decoupling and strong decoupling). As a result, the decoupling state of Beijing can be uniquely determined.
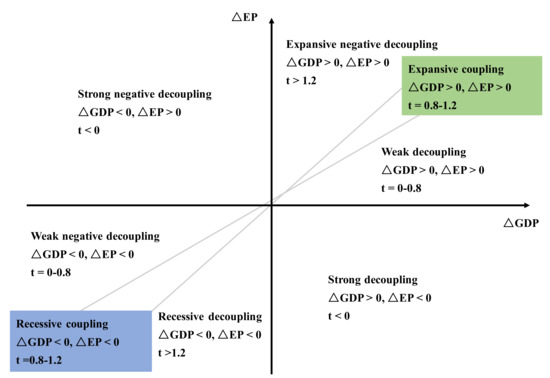
Figure 2.
The framework for dematerialization level judgment based on the Tapio decoupling model (modified from Tapio) [55].
2.3. System Dynamics Model of City Dematerialization Development
2.3.1. Establishment of the System Dynamics Model
In order to simulate Beijing’s dematerialization development in different scenarios in the future, the system dynamics model was established for simulation analysis. The system dynamics method can study the interaction of multiple factors in complex systems, and can effectively simulate the changes of various indicators in the system under different policies [1]. Based on the relationship between the variables in the system, this study determines the causal relationship and the feedback loop, and uses Vensim (Vensim is a visual modeling tool which could build simulation models based on causal diagrams and flowcharts. In the software, various types of variable marks are required to be connected by various graphical arrow marks, and the quantity) to describe the relationship between the indicators as the causal relationship map and the stock flow graph [1,34,57]. Finally, the flow chart of system dynamics model of city dematerialization development is established, as shown in Figure 3.
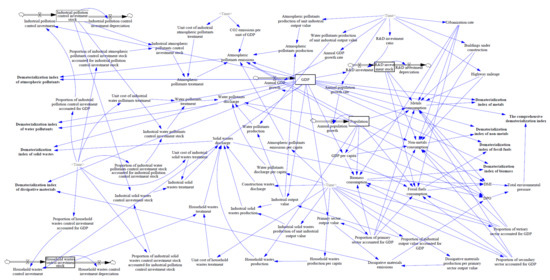
Figure 3.
Beijing’s dematerialization development system dynamics model flow diagram.
In this model, nine dematerialization index variables are set to comprehensively reflect the city dematerialization level, including the city comprehensive dematerialization level, four dematerialization indexes at resource end and four dematerialization indexes at discharge end. In order to illustrate the flow chart of the system dynamics model (see Figure 3), this whole flow chart has been decomposed in Supplementary Information D, and all the formulas and parameters used in the model are shown in Supplementary Information E, which can improve the transparency of structure and data of the model.
This study sets parameters and variables based on the statistical data of Beijing from 1992 to 2016. The relationship between four key variables (metals consumption, non-metals consumption, fossil fuels consumption, and biomass consumption) is obtained by nonlinear fitting, which can better simulate the city dematerialization index under the influence of multiple parameters. The main variables and their influencing factors are shown in Table 2.
Table 2.
Main variables and influencing factors.
2.3.2. Scenario Design
The problems of uncoordinated development of resource, environment and economy in Beijing need to be resolved. Hence, by comparing the Beijing’s dematerialization development level under different development policies, the development paths of dematerialization in Beijing could be optimized. Based on the comprehensive consideration of the model structure, the actual background of Beijing and the existing relevant literatures, four scenarios were set up. The first is business as usual (BAU) scenario. According to Beijing Municipal Commission of Development and Reform [65], Beijing’s economic growth rate will gradually decrease from 2016 to 2030. Beijing’s GDP growth rate refers to Zhang, et al. [66]. In the light of the historical trend, this study set two parameters of Beijing’s industrial structure and the proportion of R&D investment in GDP in 2030, while other parameters and variables would remain the current value (2016). The second scenario is economic sustainable degrowth (ESD). According to the study of degrowth theory, economic degrowth is a development model in which social throughput is reduced sustainably and fairly. Through a series of economic contraction measures under this development model, people will successfully reduce the excess demand for material. These measures can eventually bring the economy to a stable and balanced development state that does not excessively pursue rapid GDP growth, that is, people have moderate demand for materials and energy, and the social resources consumption and environmental emissions are greatly reduced [67,68]. Meanwhile, The People’s Government of Beijing Municipality [69] proposed that Beijing should appropriately slow down the economic growth rate and improve the quality of development. So in ESD scenario, this study set the GDP growth rate of Beijing to reduce by 5% per year on the basis of BAU [70]. The third scenario is industrial restructuring (IR). The People’s Government of Beijing Municipality [69] announced that Beijing would strengthen investment in R&D and rely on technological innovation to optimize the industrial structure. This scenario refers to the proportion of tertiary industry in developed cities. For example, the proportion of tertiary industry in Tokyo is maintained at around 90% [71]. This study set the proportion of tertiary industry in Beijing to 90% in 2030, and assume that the proportion of investment in R&D would increase by 10% annually. The last scenario is environmental governance (EG). Based on IR scenario, this scenario would strengthen the end treatment and promote an environmentally friendly, cost-effective economic development model. The annual investment in industrial pollution and household waste control would increase by 15% and 10% respectively compared to BAU scenario based on the historical trends. Table 3 shows the specific parameters of four scenarios.
Table 3.
Parameter settings of four scenarios.
2.4. Data Sources
The specific classification and data sources of material metabolism accounting are shown in Table 4. The material flow data under the three-level classification of input and output of Beijing is calculated. For example, the input end is divided into two parts: domestic extraction material and imports, and these two parts are divided into metals, non-metals, fossil fuels and biomass. The data sources of system dynamics model are shown in Table 5. When the data are missing in the statistical process, the interpolation method is used to supplement.
Table 4.
Data sources of material metabolism accounting.
Table 5.
Data sources of system dynamics model.
3. Results and Discussion
The results and discussion are mainly divided into three parts. The first part shows the historical trend of the comprehensive dematerialization level in Beijing, and the relationship between the dematerialization indexes of eight constituent materials and resource end and discharge end. The second part verifies the feasibility of Beijing’s dematerialization development system dynamics model and sets the business as usual (BAU) scenario, the economic sustainable degrowth (ESD) scenario, the industrial restructuring (IR) scenario and the environmental governance (EG) scenario. In the last part, through the system dynamics simulation analysis under four scenarios, the optimal paths for Beijing’s comprehensive dematerialization and eight constituent materials are given.
3.1. Evaluation of City Dematerialization Level
3.1.1. Analysis of the Comprehensive Dematerialization Level
Figure 4 shows Beijing’s comprehensive dematerialization level, resource end and discharge end from 1993 to 2016. In this period, the trends of the comprehensive dematerialization level, the dematerialization index of resource end and the dematerialization index of discharge end showed a downward trend on average, which indicates that all three kinds of dematerialization levels have increased. In 2016, the comprehensive dematerialization index values, the dematerialization index values of resource end and the dematerialization index values of discharge end were −0.39, −0.46 and −0.21 respectively. According to the Tapio decoupling framework, their dematerialization levels were strong decoupling, which means that there is a clear separation between Beijing’s resources consumption, pollutants discharge and economic development, and the pressure of economic growth on resources and environment have decreased. During 1992–2016, the coefficient of variation (The coefficient of variation (CV) is defined as the ratio of the standard deviation to the mean, which is a statistic that measures the degree of variation in each observation. The coefficient of variation can eliminate the effect of different units and/or averages on the degree of variability of two or more data. (https://en.wikipedia.org/wiki/Coefficient_of_variation)) of the comprehensive dematerialization index values, the dematerialization index values of resource end and the dematerialization index values of discharge end were 6.40, 6.85 and 7.02 respectively. The dematerialization level of discharge end fluctuated the most, and the dematerialization level of comprehensive was the most stable. In the 24 years from 1993 to 2016, the years’ proportions of the comprehensive dematerialization level, the dematerialization index of resource end and the dematerialization index of discharge end reached strong decoupling were 45.8%, 41.7% and 41.7%, respectively. In general, the strong decoupling state is not yet dominant. Although Beijing’s dematerialization level is on the rise, the level of dematerialization is in the fluctuating state, and the ideal state of strong decoupling is not completely achieved. It is necessary to further break the coupling relationship between resources, environment and economic growth. Compared with the resource end, the discharge end is more sensitive to GDP growth. Therefore, there is greater potential to improve the dematerialization level of discharge end in the future.
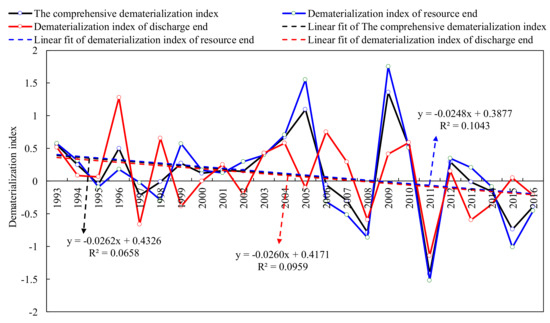
Figure 4.
Beijing’s comprehensive dematerialization index, the dematerialization index of resource end and the dematerialization index of discharge end and their trend.
3.1.2. Analysis of the Relationship between Dematerialization Indexes
It can be known from Formulas (3) and (4) that the dematerialization index of resource end or discharge end consists of four parts, each part is called the contribution of the material to the resource end or the discharge end. For example, indicates the contribution of metals to the dematerialization index of resource end. The contribution of each constituent material to the dematerialization indexes of resource end or discharge end is composed of the product of two parts, that is, the product of the mass ratio of the constituent material in DMI or DPO in the base year and the dematerialization level of the constituent material. Still taking metals as an example, represents the influence weight of dematerialization index of metals on the dematerialization index of resource end, and represents dematerialization index of metals.
Figure 5 shows the contribution of each constituent material to the dematerialization index of DMI and DPO at different periods. It can be seen that the contribution of the biomass to DMI dematerialization index was relatively stable. The contribution degree of metals and fossil fuels also varies less, while the contribution of non-metals fluctuated greatly. In 2016, the contribution proportion of biomass and non-metals decreased by 1.64% and 144.98% compared with 1995. The non-metals consumption in Beijing was mainly concentrated in the construction sector. From 1992 to 2016, the development of the construction sector in Beijing was slow, the construction completion area increased by 26.48%, and the GDP increased by 8.73 times, indicating that the growth rate of non-metals consumption in the construction sector was slow. Compared with 2010, the decrease of non-metals consumption in 2016 resulted in the strong decoupling and the positive contribution to resource end dematerialization level. Non-metals have the greatest impact on the dematerialization index of resource end and play a positive role. From 1992 to 2016, the contribution of atmospheric pollutants to DPO’s dematerialization index was dominant, while the proportions of water pollutants, solid waste and dissipative materials to DPO’s dematerialization were small, mainly because atmospheric pollutants accounted for 87.07% of DPO on average. The average proportion of CO2 in atmospheric pollutants was 98.74%, and the CO2 emissions in the period 1992–2016 increased by 39.66%, which directly determined the weak decoupling trend of DPO. Therefore, from the perspective of contribution degree, to improve the dematerialization level of resource end, it is necessary to focus on non-metals consumption. For the discharge end, controlling CO2 emissions is the key.
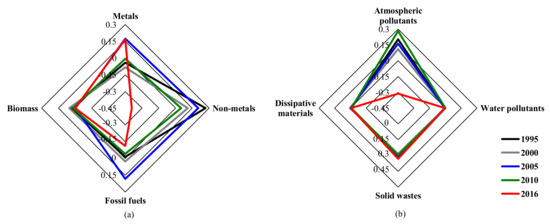
Figure 5.
The contribution of each constituent material to dematerialization level of resource end or discharge end. (a) The contribution of four materials to dematerialization index of DMI; (b) the contribution of four materials to dematerialization index of DPO.
3.2. SD Model Verification
To verify the accuracy and validity of the model, the real and simulated values of 8 key variables such as metals consumption and non-metals consumption from 2012 to 2016 were compared. The results are shown in Table 6. It can be seen that the relative error has reached the requirement of no more than 10% which has a relatively large credibility [33,57,82]. Therefore, this model can reflect the real situation of Beijing’s resource-economy-environment system, and can well simulate Beijing’s dematerialization development.
Table 6.
Verification with historical data (Unit: Million metric tons).
3.3. Simulation Results
3.3.1. Simulation Results of the Comprehensive Dematerialization Level
The simulation results of Beijing’s comprehensive dematerialization indexes from 1992 to 2030 are shown in Figure 6. In general, during 2016–2024, the BAU scenario had the highest dematerialization index, followed by environmental governance (EG) scenario, economic sustainable degrowth (ESD) scenario and industrial restructuring (IR) scenario. After 2025, the dematerialization index of IR would surpass the other three indexes values and grow rapidly, while the other three indexes would continue to grow steadily. Increasing investment in environmental governance can reduce pollutants discharge and thus increase the comprehensive dematerialization index. The economic sustainable degrowth can directly reduce the total pressure between resources, environment and economic growth. Industrial restructuring could have a good impact on the resources consumption end and the pollutants discharge end, thereby increasing the dematerialization levels.
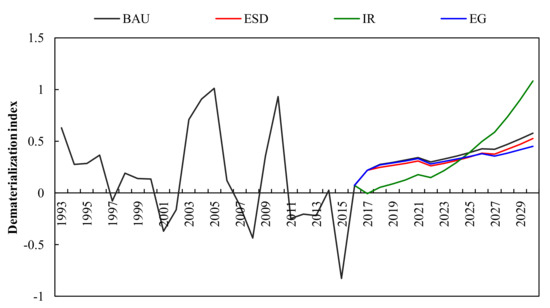
Figure 6.
Simulation results of Beijing’s comprehensive dematerialization indexes under four scenarios.
Compared with the historical trend, after 2017, the fluctuation of the comprehensive dematerialization index all would slow down and show a upward trend under four scenarios (see Figure 6). However, it would remain in the decoupling state (the decoupling index value is between −0.0085 and 1.08). During 2017–2024, under the IR scenario, the dematerialization level would be the best, but it would only reach the strong decoupling state in 2017. At this time, the dematerialization index value is –0.0085. The other three scenarios would all be in weak decoupling. In 2017, the dematerialization index under the IR scenario would drop by 103.86% compared with other scenarios. From 2017 to 2024, the advantage effect of dematerialization development under the IR scenario would gradually decrease, because the proportion of the tertiary sector accounted for GDP would reach 80.90% in 2017, and the proportion of technology investment in GDP would reach 7.07%. By 2025, the dematerialization index value under the IR scenario would be lower than the other three scenarios for the first time, that is, before the ratio of three industrial structures is 0.50:13.00:86.50 and the proportion of technology investment in GDP reaches 15.16%, further increase investment in R&D and promote the optimization of industrial structure can achieve the optimal dematerialization level. From 2025 to 2030, the dematerialization index would always be the highest under the EG scenario, and the IR scenario would always be the lowest. This indicates that after the advantage effect of the IR scenario is minimized (2025), and before the proportion of industrial environmental governance investment and household waste governance investment reaches 0.39% and 0.91% respectively, compared with other scenarios, the development scenario of increasing environmental investment has greater dematerialization potential. By 2030, the dematerialization indexes for the four scenarios would be 0.58, 0.53, 1.08 and 0.45, all of which would reach weak decoupling state. In summary, the all four development scenarios would be able to achieve the weak decoupling state in the future, but the dematerialization level under the BAU scenario is not the best, so it is necessary to adjust the future development policy. From 2017 to 2024, the investment in R&D and the industrial restructuring would be able to significantly reduce the value of the dematerialization index during this period and bring about the greatest improvement of the dematerialization level. During 2025–2030, continuing to increase investment in environmental governance would be the best development measure to further increase the dematerialization level.
3.3.2. Dematerialization Indexes Simulation Results of Eight Materials
Figure 7 shows the simulation results of the dematerialization indexes of eight materials at resource end and discharge end under four scenarios. Compared with the BAU scenario, the dematerialization index of non-metals under the ESD scenario would decrease the most in the eight materials, with an average annual growth rate of 14.92% from 2017 to 2030, mainly owing to the large impact of the GDP growth reduction on the investment in the construction. Due to the technological progress brought by the investment in R&D and the increasing proportion of the tertiary industry, the IR scenario would enable non-metals, fossil fuels and biomass to reach the optimal dematerialization level under all four scenarios. Under the IR scenario, the consumption of metals, non-metals, fossil fuels and biomass in 2030 would be reduced by 70.43%, 32.57% and 3.58%, respectively, compared with the BAU scenario, while the GDP growth rate would be relatively stable in this scenario, no more than 6.80% during 2016–2030, which would significantly increase the dematerialization level. Compared with the BAU scenario, the dematerialization index value of non-metals, fossil fuels and biomass would decrease by 293.84%, 57.21% and 24.39% respectively under the IR scenario. The EG scenario would improve the dematerialization level of atmospheric pollutants most significantly. From 2017 to 2030, the dematerialization index value would change from 0.28 (weak decoupling) to −2.39 (strong decoupling) mainly due to the fact that water pollutants and dissipative materials have reached an ideal strong decoupling state in 2016, which means the potential for dematerialization has become very limited since then. At that time, atmospheric pollutants were still at the weak decoupling level. The environmental governance investment could improve the treatment capacity of atmospheric pollutants, thereby reducing emissions of atmospheric pollutants. From 2017 to 2030, increasing environmental governance investment would increase the average annual growth rate of industrial atmospheric pollutants treatment capacity by 131.23% relative to the BAU scenario. As a result, significant reductions in emissions would occur as the investment in environmental governance increase, which would show significant dematerialization. The best dematerialization scenarios for eight materials during 2017–2030 can be found in Supplementary Information F.
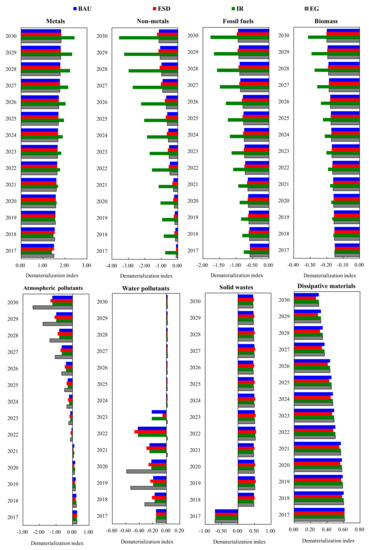
Figure 7.
Simulation results of dematerialization indexes of eight constituent materials of Beijing under four scenarios.
4. Conclusions
Based on the material flow analysis method and the Tapio decoupling model, this study constructs the city dematerialization evaluation model, and obtains the development status and historical trend of Beijing’s dematerialization development. Through analyzing the interaction between the influencing factors, the system dynamics model of Beijing’s dematerialization development is established. By setting four scenarios, namely BAU, economic sustainable degrowth (ESD), industrial restructuring (IR) and environmental governance (EG), this study simulated and analyzed Beijing’s dematerialization development levels, and finally obtained the optimal development paths of Beijing’s dematerialization. The specific contents are as follows:
(1) From 1992 to 2016, Beijing’s comprehensive dematerialization level showed an upward trend of fluctuation, while strong decoupling was not dominant. Compared with resource consumption end, the dematerialization potential of the discharge end would be larger in the future. By analyzing the relationship of dematerialization index between resource end and discharge end and its constituent materials, it could be concluded that the improvement of dematerialization levels of resource end and discharge end in the future need to focus on non-metals consumption and CO2 emissions respectively.
(2) The system dynamics model of Beijing’s dematerialization development was established, taking BAU as a reference, four scenarios of ESD, IR and EG was designed to simulate Beijing’s dematerialization development from 2016 to 2030. Under four scenarios, Beijing would achieve the weak decoupling state, and the optimal development policies would be different in different development periods. In the early stage of development, the investment in R&D and the adjustment of industrial structure would bring about the greatest improvement of dematerialization level. Under the IR scenario, strong decoupling would be achieved in 2017, and the other three scenarios would not be achieved during 2017–2030. During 2017–2024, the IR scenario is the optimal path for dematerialization development in Beijing. In the period 2025–2030, the EG scenarios would become the best choice for Beijing’s dematerialization development.
(3) Simulation analysis of the dematerialization level of each constituent materials was completed. From 2017 to 2030, under four strategies, metals would reach the expansive negative decoupling, solid waste, and dissipative materials would remain weak decoupling that is, the three materials would have little potential for future dematerialization. Non-metals, fossil fuels, biomass, atmospheric pollutants and water pollutants would achieve strong decoupling under four strategies, but the IR scenario would be the optimal path for the dematerialization development of non-metals, fossil fuels and biomass. During 2017–2021, atmospheric pollutants would be more inclined to achieve the development of dematerialization through economic sustainable degrowth measures. From 2022 to 2030, increasing investment in environmental governance is the optimal path for dematerialization development of atmospheric pollutants. From 2017 to 2023, the optimal dematerialization path of water pollutants would vary between ESD and EG scenarios. During 2024–2030, other three strategies would have the same effect.
(4) Through the city level dematerialization study based on system dynamics and MFA, this paper finds that the influence of different materials on the overall level dematerialization is very different. By implementing appropriate development strategies, the degree of dematerialization of the economy can be effectively improved. In addition, the dematerialization study of Beijing could provide the foundation for establishing the system dynamics model and formulating dematerialization development measures on other cities or nations.
Supplementary Materials
The following are available online at https://www.mdpi.com/2071-1050/12/3/829/s1.
Author Contributions
Conceptualization, T.D. and S.S.; methodology, T.D. and S.S.; software, S.S.; writing—original draft preparation, S.S.; writing—review and editing, T.D. and S.S.; visualization, S.S.; supervision, T.D.; project administration, T.D. All authors have read and agreed to the published version of the manuscript.
Funding
This research was funded by the Beijing Social Science Foundation and the Social Science key Project of Beijing Municipal Education Commission, grant number SZ201610005002.
Conflicts of Interest
The authors declare no conflict of interest.
References
- Xing, L.; Xue, M.G.; Hu, M.S. Dynamic simulation and assessment of the coupling coordination degree of the economy–resource–environment system: Case of Wuhan City in China. J. Environ. Manag. 2019, 230, 474–487. [Google Scholar] [CrossRef] [PubMed]
- The World Bank. Indicators. Available online: https://data.worldbank.org/indicator (accessed on 19 October 2019).
- The World Steel Association. Apparent Steel Use (Crude Steel Equivalent). World Total 2018. Available online: https://www.worldsteel.org/internet-2017/steel-by-topic/statistics/steel-data-viewer/C_asu_cse/CHN/IND/WORLD_ALL (accessed on 24 October 2019).
- An, R.Y.; Yu, B.Y.; Li, R.; Wei, Y.M. Potential of energy savings and CO2 emission reduction in China’s iron and steel industry. Appl. Energy 2018, 226, 862–880. [Google Scholar] [CrossRef]
- The World Bank. CO2 Emissions (kt). Available online: https://data.worldbank.org/indicator/EN.ATM.CO2E.KT?view=chart (accessed on 24 October 2019).
- UN. Transforming Our World: The 2030 Agenda for Sustainable Development; UN: New York, NY, USA, 2015. [Google Scholar]
- Kempbenedict, E. Dematerialization, decoupling, and productivity Change. Ecol. Econ. 2018, 150, 204–216. [Google Scholar] [CrossRef]
- Herman, R.; Ardekani, S.A.; Ausubel, J.H. Dematerialization. Technol. Forecast. Soc. Change 1990, 38, 333–347. [Google Scholar] [CrossRef]
- Cleveland, C.J.; Ruth, M. Indicators of dematerialization and the materials intensity of use. J. Ind. Ecol. 1998, 2, 15–50. [Google Scholar] [CrossRef]
- Sun, J.W.; Meristo, T. Measurement of dematerialization/materialization: A case analysis of energy saving and decarbonization in OECD countries, 1960–1995. Technol. Forecast. Soc. Change 1999, 60, 275–294. [Google Scholar] [CrossRef]
- Van Ewijk, S.; Stegemann, J.A. Limitations of the waste hierarchy for achieving absolute reductions in material throughput. J. Clean. Prod. 2016, 132, 122–128. [Google Scholar] [CrossRef]
- Pothen, F.; Welsch, H. Economic development and material use. Evidence from international panel data. World Dev. 2019, 115, 107–119. [Google Scholar] [CrossRef]
- Kan, S.Y.; Chen, B.; Chen, G.Q. Worldwide energy use across global supply chains: Decoupled from economic growth? Appl. Energy 2019, 250, 1235–1245. [Google Scholar] [CrossRef]
- Bithas, K.; Kalimeris, P. Unmasking decoupling: Redefining the resource intensity of the economy. Sci. Total Environ. 2018, 619, 338–351. [Google Scholar] [CrossRef]
- Zhang, C.; Chen, W.Q.; Liu, G.; Zhu, D.J. Economic growth and the evolution of material cycles: An analytical framework integrating material flow and stock indicators. Ecol. Econ. 2017, 140, 265–274. [Google Scholar] [CrossRef]
- Giljum, S.; Dittrich, M.; Lieber, M.; Lutter, S. Global patterns of material flows and their socio-economic and environmental implications: A MFA study on all countries world-wide from 1980 to 2009. Resources 2014, 3, 319–339. [Google Scholar] [CrossRef]
- Krausmann, F.; Gingrich, S.; Eisenmenger, N.; Erb, K.H.; Haberl, H.; Fischer-Kowalski, M. Growth in global materials use, GDP and population during the 20th century. Ecol. Econ. 2009, 68, 2696–2705. [Google Scholar] [CrossRef]
- Gierlinger, S.; Krausmann, F. The physical economy of the United States of America: Extraction, trade, and consumption of materials from 1870 to 2005. J. Ind. Ecol. 2012, 16, 365–377. [Google Scholar] [CrossRef]
- Wu, Y.; Zhu, Q.W.; Zhu, B.Z. Decoupling analysis of world economic growth and CO2 emissions: A study comparing developed and developing countries. J. Clean. Prod. 2018, 190, 94–103. [Google Scholar] [CrossRef]
- Wang, Q.; Zhao, M.; Li, R. Decoupling sectoral economic output from carbon emissions on city level: A comparative study of Beijing and Shanghai, China. J. Clean. Prod. 2019, 209, 126–133. [Google Scholar] [CrossRef]
- Dai, T.J.; Liu, R. Dematerialization in Beijing from the perspective of material metabolism. J. Clean. Prod. 2018, 201, 792–801. [Google Scholar] [CrossRef]
- Zhu, X.P.; Li, R.R. An analysis of decoupling and influencing factors of carbon emissions from the transportation sector in the Beijing-Tianjin-Hebei Area, China. Sustainability 2017, 9, 722. [Google Scholar] [CrossRef]
- Bigano, A.; Śniegocki, A.; Zotti, J. Policies for a more dematerialized EU economy. Theoretical underpinnings, political context and expected feasibility. Sustainability 2016, 8, 717. [Google Scholar] [CrossRef]
- Naqvi, A.; Zwickl, K. Fifty shades of green: Revisiting decoupling by economic sectors and air pollutants. Ecol. Econ. 2017, 133, 111–126. [Google Scholar] [CrossRef]
- Wang, Z.; Zhao, L.; Mao, G.Z.; Wu, B. Eco-efficiency trends and decoupling analysis of environmental pressures in Tianjin, China. Sustainability 2015, 7, 15407–15422. [Google Scholar] [CrossRef]
- Hao, Y.; Zhang, T.L.; Jing, L.J.; Xiao, L. Would the decoupling of electricity occur along with economic growth? Empirical evidence from the panel data analysis for 100 Chinese cities. Energy 2019, 180, 615–625. [Google Scholar] [CrossRef]
- Wang, Q.; Jiang, R.; Li, R.R. Decoupling analysis of economic growth from water use in city: A case study of Beijing, Shanghai, and Guangzhou of China. Sustain. Cities Soc. 2018, 41, 86–94. [Google Scholar] [CrossRef]
- Wang, S.S.; Li, R.R. Toward the coordinated sustainable development of urban water resource use and economic growth: An empirical analysis of Tianjin City, China. Sustainability 2018, 10, 1323. [Google Scholar] [CrossRef]
- Montevecchi, F. Policy mixes to achieve absolute decoupling: A case study of municipal waste management. Sustainability 2016, 8, 442. [Google Scholar] [CrossRef]
- European Commission. Europe 2020: A Strategy for Smart, Sustainable and Inclusive Growth: Communication from the Commission; Publications Office of the European Union: Brussels, Belgium, 2010. [Google Scholar]
- Government of the People’s Republic of China. China’s National Plan on implementation of the 2030 Agenda for Sustainable Development; Government of the People’s Republic of China: Beijing, China, 2016. Available online: https://www.fmprc.gov.cn/web/ziliao_674904/tytj_674911/zcwj_674915/W020161012709956373709.pdf (accessed on 22 January 2020).
- Shen, Q.P.; Chen, Q.; Tang, B.; Yeung, S.; Hu, Y.; Cheung, G. A system dynamics model for the sustainable land use planning and development. Habitat Int. 2009, 33, 15–25. [Google Scholar] [CrossRef]
- Liu, H.B.; Liu, Y.F.; Wang, H.N.; Yang, J.; Zhou, X. Research on the coordinated development of greenization and urbanization based on system dynamics and data envelopment analysis—A case study of Tianjin. J. Clean. Prod. 2019, 214, 195–208. [Google Scholar] [CrossRef]
- Tan, Y.T.; Jiao, L.D.; Shuai, C.Y.; Shen, L. A system dynamics model for simulating urban sustainability performance: A China case study. J. Clean. Prod. 2018, 199, 1107–1115. [Google Scholar] [CrossRef]
- National Bureau of Statistics of China (NBSC). China Statistical Yearbook; China Statistics Press: Beijing, China, 1993–2017. (In Chinese) [Google Scholar]
- Li, Y.X.; Zhang, Y.; Yu, X.Y. Urban weight and its driving forces: A case study of Beijing. Sci. Total Environ. 2019, 658, 590–601. [Google Scholar] [CrossRef]
- Krausmann, F.; Lauk, C.; Haas, W.; Wiedenhofer, D. From resource extraction to outflows of wastes and emissions: The socioeconomic metabolism of the global economy, 1900–2015. Glob. Environ. Change 2018, 52, 131–140. [Google Scholar] [CrossRef]
- Fischer-Kowalski, M.; Krausmann, F.; Giljum, S.; Lutter, S.; Mayer, A.; Bringezu, S.; Moriguchi, Y.; Schütz, H.; Schandl, H.; Weisz, H. Methodology and indicators of economy-wide material flow accounting: State of the art and reliability across sources. J. Ind. Ecol. 2011, 15, 855–876. [Google Scholar] [CrossRef]
- Krausmann, F.; Schandl, H.; Eisenmenger, N.; Giljum, S.; Jackson, T. Material flow accounting: Measuring global material use for sustainable development. Annu. Rev. Environ. Resour. 2017, 42, 647–675. [Google Scholar] [CrossRef]
- Dai, T.J. A study on material metabolism in Hebei iron and steel industry analysis. Resour. Conserv. Recycl. 2015, 95, 183–192. [Google Scholar] [CrossRef]
- Dai, T.J.; Wang, W.J. The characteristics and trends of socioeconomic metabolism in China. J. Ind. Ecol. 2018, 22, 1228–1240. [Google Scholar] [CrossRef]
- Brunner, P.H.; Rechberger, H. Practical Handbook of Material Flow Analysis: For Environmental, Resource, and Waste Engineers; CRC Press: Boca Raton, FL, USA, 2016. [Google Scholar]
- Tran, H.P.; Schaubroeck, T.; Nguyen, D.Q.; Ha, V.H.; Huynh, T.H.; Dewulf, J. Material flow analysis for management of waste TVs from households in urban areas of Vietnam. Resour. Conserv. Recycl. 2018, 139, 78–89. [Google Scholar] [CrossRef]
- Bringezu, S.; van de Sand, I.; Schütz, H.; Bleischwitz, R.; Moll, S. Analysing global resource use of national and regional economies across various levels. In Sustainable Resource Management, 1st ed.; Bringezu, S., Bleischwitz, R., Eds.; Routledge: London, UK, 2017; Volume 1, pp. 10–51. [Google Scholar]
- Schandl, H.; Hatfield-Dodds, S.; Wiedmann, T.; Geschke, A.; Cai, Y.; West, J.; Newth, D.; Baynes, T.; Lenzen, M.; Owen, A. Decoupling global environmental pressure and economic growth: Scenarios for energy use, materials use and carbon emissions. J. Clean. Prod. 2016, 132, 45–56. [Google Scholar] [CrossRef]
- Ayres, R.U.; Kneese, A. Production, consumption, and externalities. Am. Econ. Rev. 1969, 59, 282–297. [Google Scholar]
- Schütz, H.; Bringezu, S. Major material flows in Germany. Fresenius Environ. Bull. 1993, 2, 443–448. [Google Scholar]
- Baccini, P.; Brunner, P.H. Metabolism of the Anthroposphere; Springer: Berlin, Germany, 1991. [Google Scholar]
- Baccini, P.; Bader, H.-P. Regionaler Stoffhaushalt: Erfassung, Bewertung und Steuerung; Spektrum Akademischer Verlag: Heidelberg, Germany, 1996. [Google Scholar]
- Rosado, L.; Kalmykova, Y.; Patrício, J. Urban metabolism profiles. An empirical analysis of the material flow characteristics of three metropolitan areas in Sweden. J. Clean. Prod. 2016, 126, 206–217. [Google Scholar] [CrossRef]
- Cui, X.; Wang, X.; Feng, Y. Examining urban metabolism: A material flow perspective on cities and their sustainability. J. Clean. Prod. 2019, 214, 767–781. [Google Scholar] [CrossRef]
- Dai, T.J.; Liu, R.; Wang, W.J. Material metabolism in Beijing by material flow analysis. Acta Sci. Circumstantiae 2017, 37, 3220–3228. (In Chinese) [Google Scholar]
- Dai, T.J.; Wang, W.J.; Liu, R. Spatio-temporal variation of resource and environmental pressure in China. Resour. Sci. 2017, 39, 1942–1955. (In Chinese) [Google Scholar]
- OECD. Indicators to Measure Decoupling of Environmental Pressure for Economic Growth; OECD: Paris, France, 2002. [Google Scholar]
- Tapio, P. Towards a theory of decoupling: Degrees of decoupling in the EU and the case of road traffic in Finland between 1970 and 2001. Transp. Policy 2005, 12, 137–151. [Google Scholar] [CrossRef]
- Zhong, T.; Huang, X.; Han, L.; Wang, B.Y. Review on the research of decoupling analysis in the field of environments and resource. J. Nat. Resour. 2010, 2010, 1400–1412. (In Chinese) [Google Scholar]
- Wu, D.; Ning, S. Dynamic assessment of urban economy-environment-energy system using system dynamics model: A case study in Beijing. Environ. Res. 2018, 164, 70–84. [Google Scholar] [CrossRef]
- Xuan, Y.N.; Yue, Q. Forecast of steel demand and the availability of depreciated steel scrap in China. Resour. Conserv. Recycl. 2016, 109, 1–12. [Google Scholar] [CrossRef]
- Crompton, P. Explaining variation in steel consumption in the OECD. Resour. Policy 2015, 45, 239–246. [Google Scholar] [CrossRef]
- Fernandez, V. Mineral commodity consumption and intensity of use re-assessed. Int. Rev. Financ. Anal. 2018, 59, 1–18. [Google Scholar] [CrossRef]
- Moynihan, M.C.; Allwood, J.M. The flow of steel into the construction sector. Resour. Conserv. Recycl. 2012, 68, 88–95. [Google Scholar] [CrossRef]
- Cao, Z.; Shen, L.; Liu, L.T.; Zhong, S. Analysis on major drivers of cement consumption during the urbanization process in China. J. Clean. Prod. 2016, 133, 304–313. [Google Scholar] [CrossRef]
- Yuan, X.C.; Sun, X.; Zhao, W.G.; Mi, Z.; Wang, B.; Wei, Y.M. Forecasting China’s regional energy demand by 2030: A Bayesian approach. Resour. Conserv. Recycl. 2017, 127, 85–95. [Google Scholar] [CrossRef]
- Sheng, Y.; Song, L.G. Agricultural production and food consumption in China: A long-term projection. China Econ. Rev. 2019, 53, 15–29. [Google Scholar] [CrossRef]
- Beijing Municipal Commission of Development and Reform. Beijing 13th Five-Year Planning Outline; Social Sciences Academic Press (China): Beijing, China, 2016. (In Chinese) [Google Scholar]
- Zhang, D.; Liu, G.; Chen, C.; Zhang, Y.; Hao, Y.; Casazza, M. Medium-to-long-term coupled strategies for energy efficiency and greenhouse gas emissions reduction in Beijing (China). Energy Policy 2019, 127, 350–360. [Google Scholar] [CrossRef]
- Kallis, G. In defence of degrowth. Ecol. Econ. 2011, 70, 873–880. [Google Scholar] [CrossRef]
- Latouche, S. Degrowth. J. Clean. Prod. 2010, 6, 519–522. [Google Scholar] [CrossRef]
- The People’s Government of Beijing Municipality. Beijing Urban Mater Plan (2016–2035); The People’s Government of Beijing Municipality: Beijing, China, 2017. (In Chinese) [Google Scholar]
- Dai, Y.D.; Kang, Y.B.; Xiong, X.P. Energy Development and Carbon Emission Scenarios Towards 2050 Energy Transition and Low Carbon Development Roadmap for China; China Environmental Science Press: Beijing, China, 2017. (In Chinese) [Google Scholar]
- Bureau of Industrial and Labor Affairs Tokyo Metropolitan Government. Industry and Employment in Tokyo: A Graphic Overview 2018; Bureau of Industrial and Labor Affairs Tokyo Metropolitan Government: Tokyo, Japan, 2018. [Google Scholar]
- National Bureau of Statistics of China (NBSC). China Industry Statistical Yearbook; China Statistics Press: Beijing, China, 1993–2017. (In Chinese) [Google Scholar]
- Editorial Office of China Mining Yearbook. China Mining Yearbook; Seismological Press: Beijing, China, 1993–2017. (In Chinese) [Google Scholar]
- Beijing Municipal Commission of Planning and Natural Resources. Beijing Land and Resources Statistical Yearbook; China Social Sciences Press: Beijing, China, 1993–2017. (In Chinese) [Google Scholar]
- National Bureau of Statistics of China (NBSC). China Energy Statistical Yearbook; China Statistics Press: Beijing, China, 1993–2017. (In Chinese) [Google Scholar]
- The State Forestry Administration of China. China Forestry Statistical Yearbook; China Forestry Publishing House: Beijing, China, 1993–2017. (In Chinese) [Google Scholar]
- Ministry of Agriculture and Rural Affairs of China. China Agriculture Yearbook; China Agriculture Press: Beijing, China, 1993–2017. (In Chinese) [Google Scholar]
- Ministry of Ecology and Environment of China. China Environment Yearbook; China Environment Yearbook Press: Beijing, China, 1993–2017. (In Chinese) [Google Scholar]
- National Bureau of Statistics of China (NBSC). China Rural Statistical Yearbook; China Statistics Press: Beijing, China, 1993–2017. (In Chinese) [Google Scholar]
- Beijing Municipal Bureau of Statistics; NBS Survey Office in Beijing. Beijing Statistical Yearbook; China Statistics Press: Beijing, China, 1993–2017. (In Chinese) [Google Scholar]
- National Bureau of Statistics of China (NBSC); Ministry of Ecology and Environment of China. China Statistical Yearbook on Environment; China Statistics Press: Beijing, China, 2005–2017. (In Chinese) [Google Scholar]
- Li, F.; Sun, Y.; Li, X.; Hao, X.; Li, W.; Qian, Y.; Liu, H.; Sun, H. Research on the sustainable development of green-space in Beijing using the dynamic systems model. Sustainability 2016, 8, 965. [Google Scholar] [CrossRef]
© 2020 by the authors. Licensee MDPI, Basel, Switzerland. This article is an open access article distributed under the terms and conditions of the Creative Commons Attribution (CC BY) license (http://creativecommons.org/licenses/by/4.0/).