A Comprehensive Method for Evaluating Marine Disaster Risk Reduction Capacity in China


Abstract
:1. Introduction
2. Materials and Methods
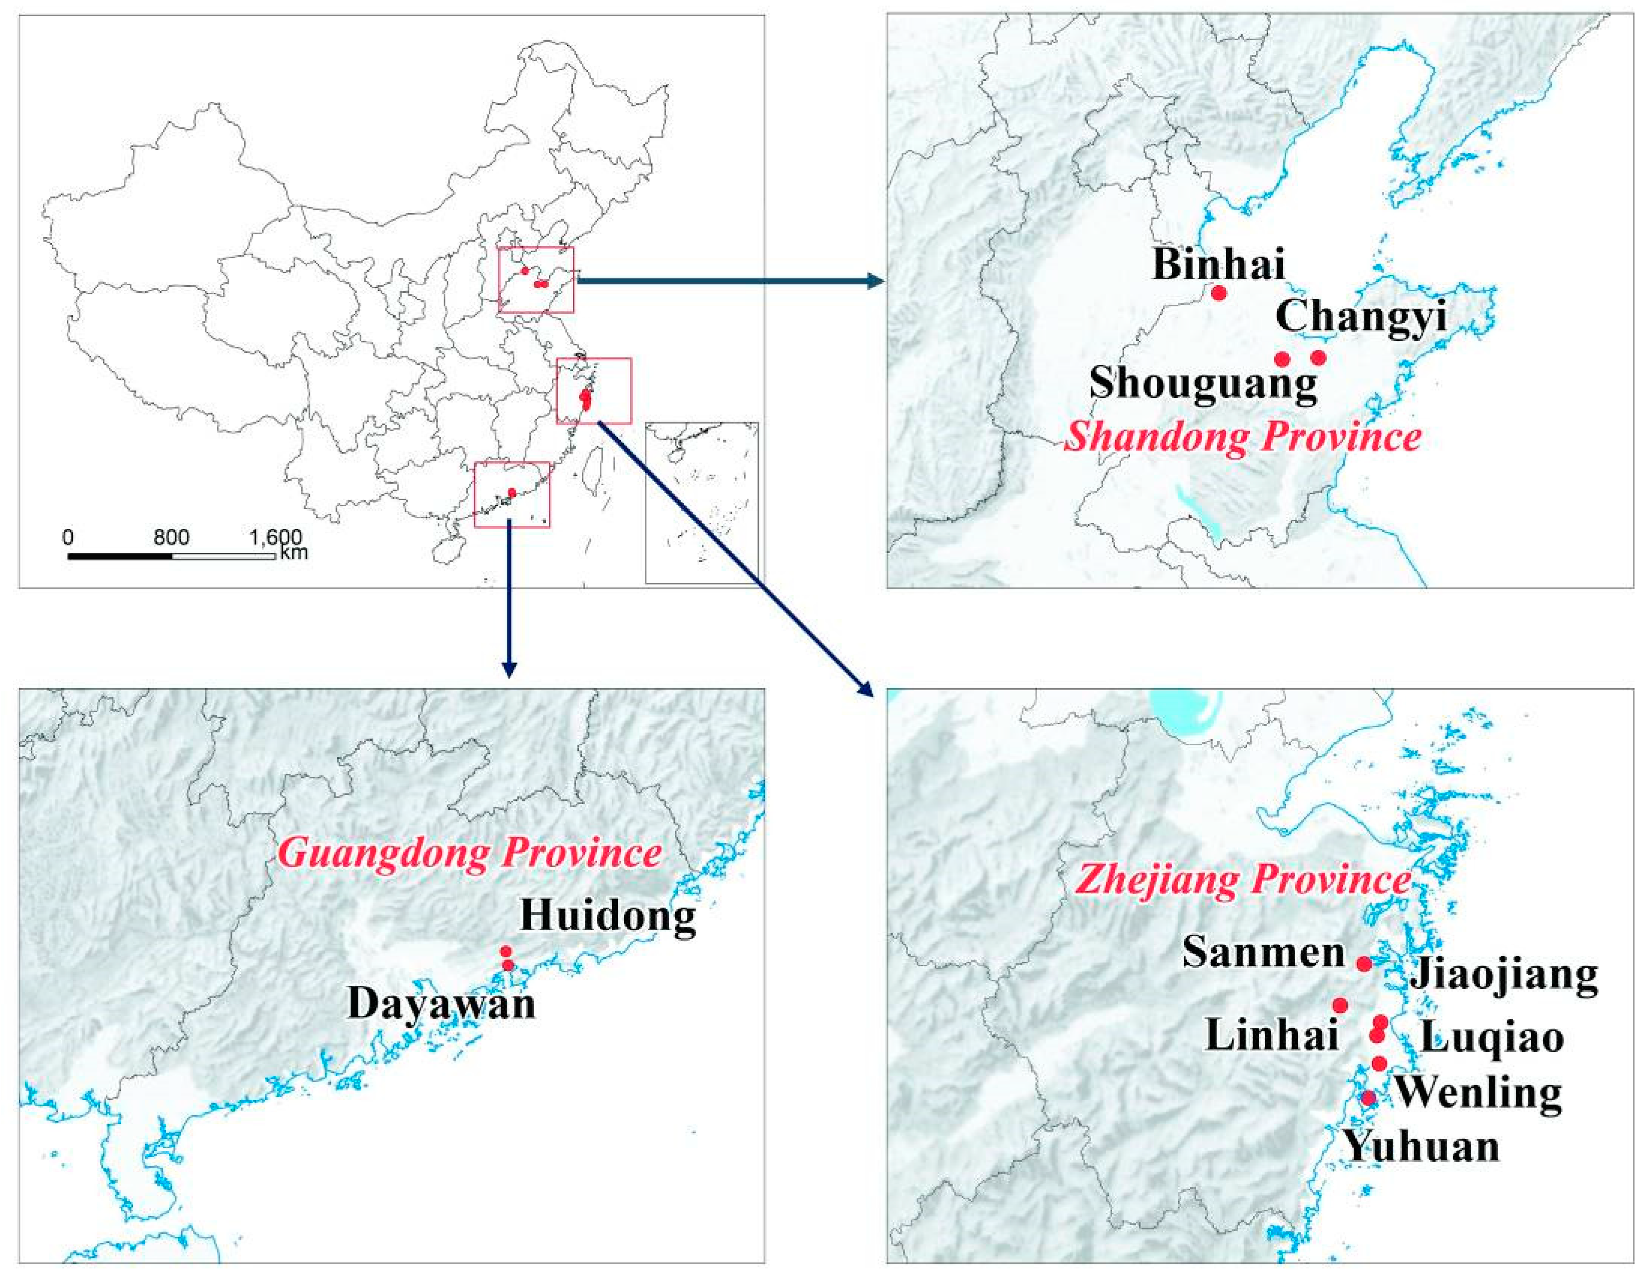
2.1. Study Area and Data Source
2.2. Development of an Evaluation Index System
2.2.1. Management Phase and Capacity Assessment
2.2.2. Capacity Needs and Priority Domains
2.2.3. Assessment Object and Construction Subject
2.2.4. Regional Commonality and Specificity of Indicators
2.3. Establishing the Evaluation Model
2.3.1. Establishing a Hierarchical Structure Model
2.3.2. Constructing Judgment Matrix
2.3.3. Calculating Weight Vectors in Hierarchical Single Arrangement, as well as Conducting the Consistency Test
2.3.4. Calculating the Weight Vector in Total Arrangement, in Addition to Conducting the Consistency Test
2.4. Determining the Basis for Grade Rating
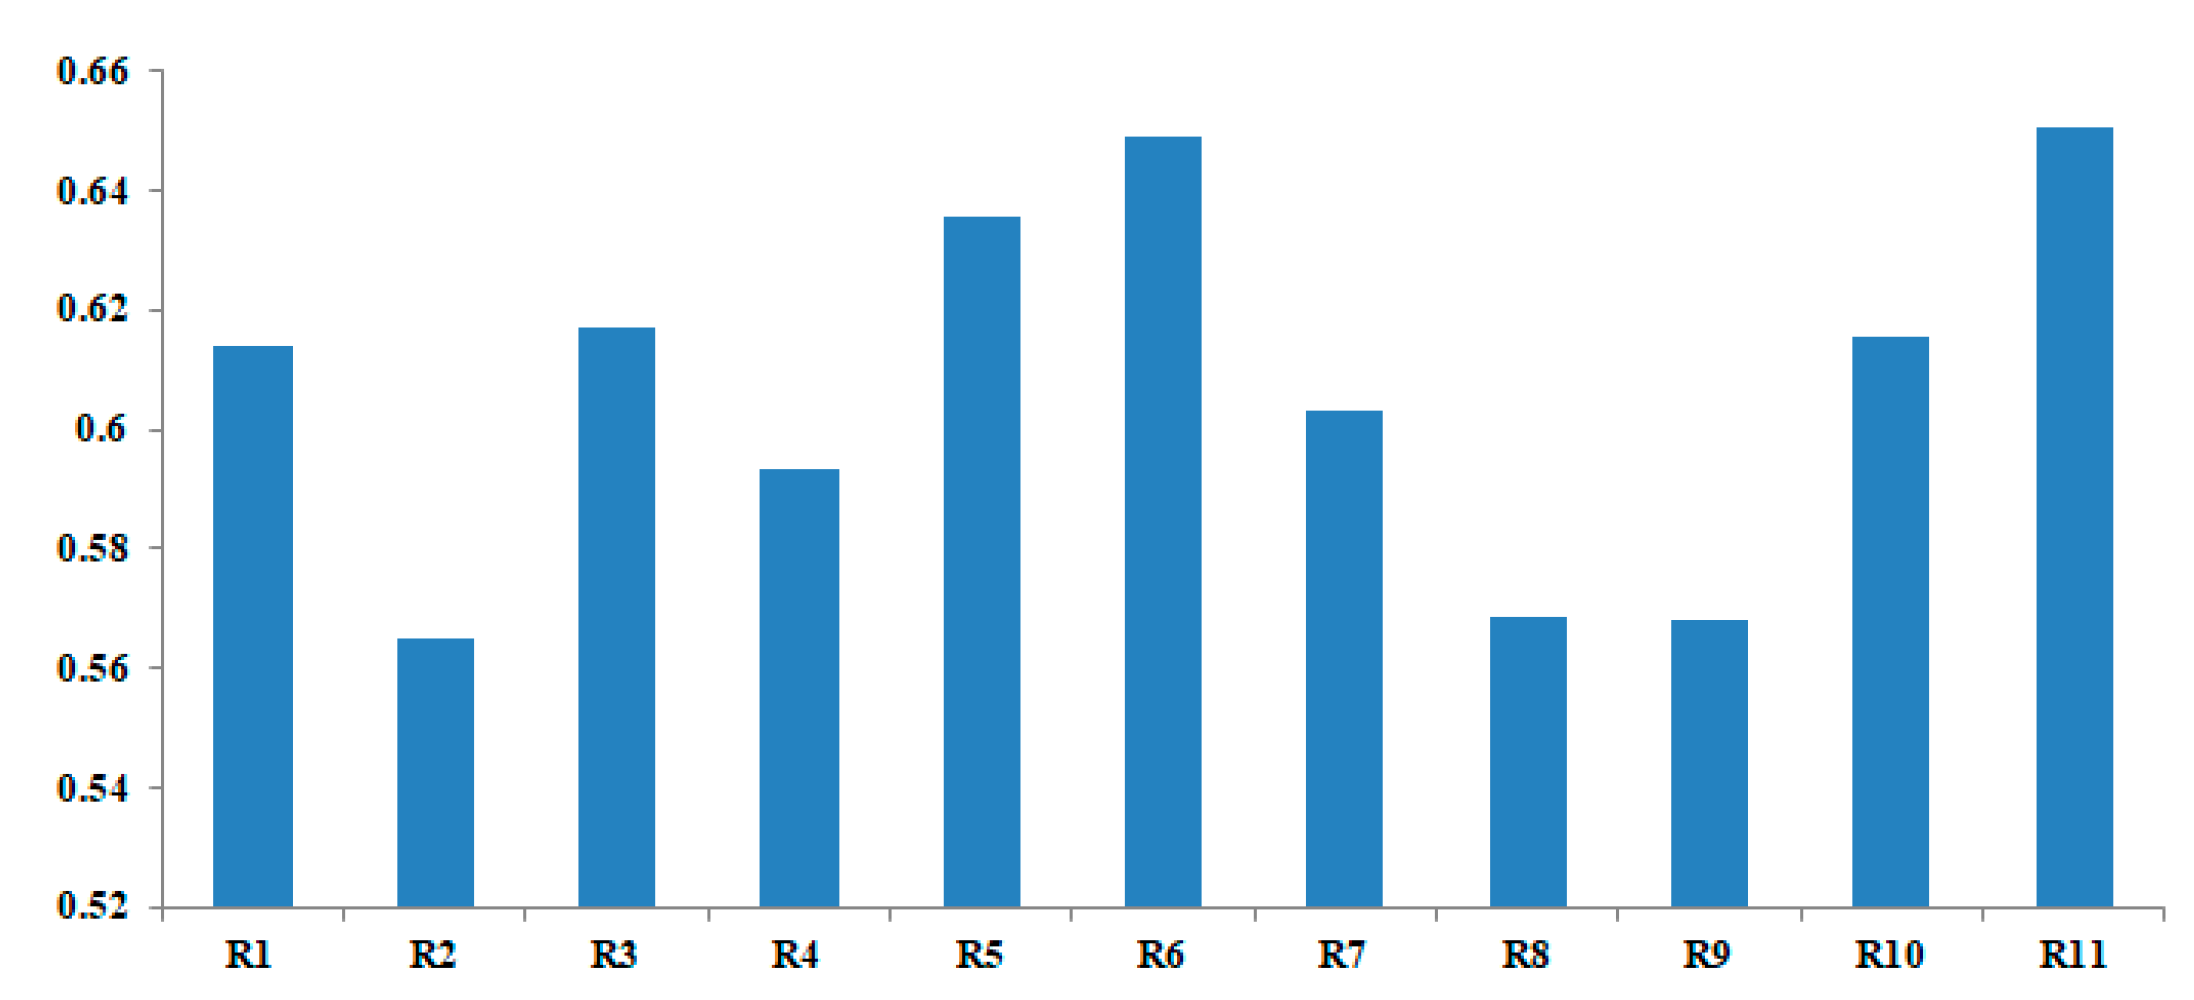
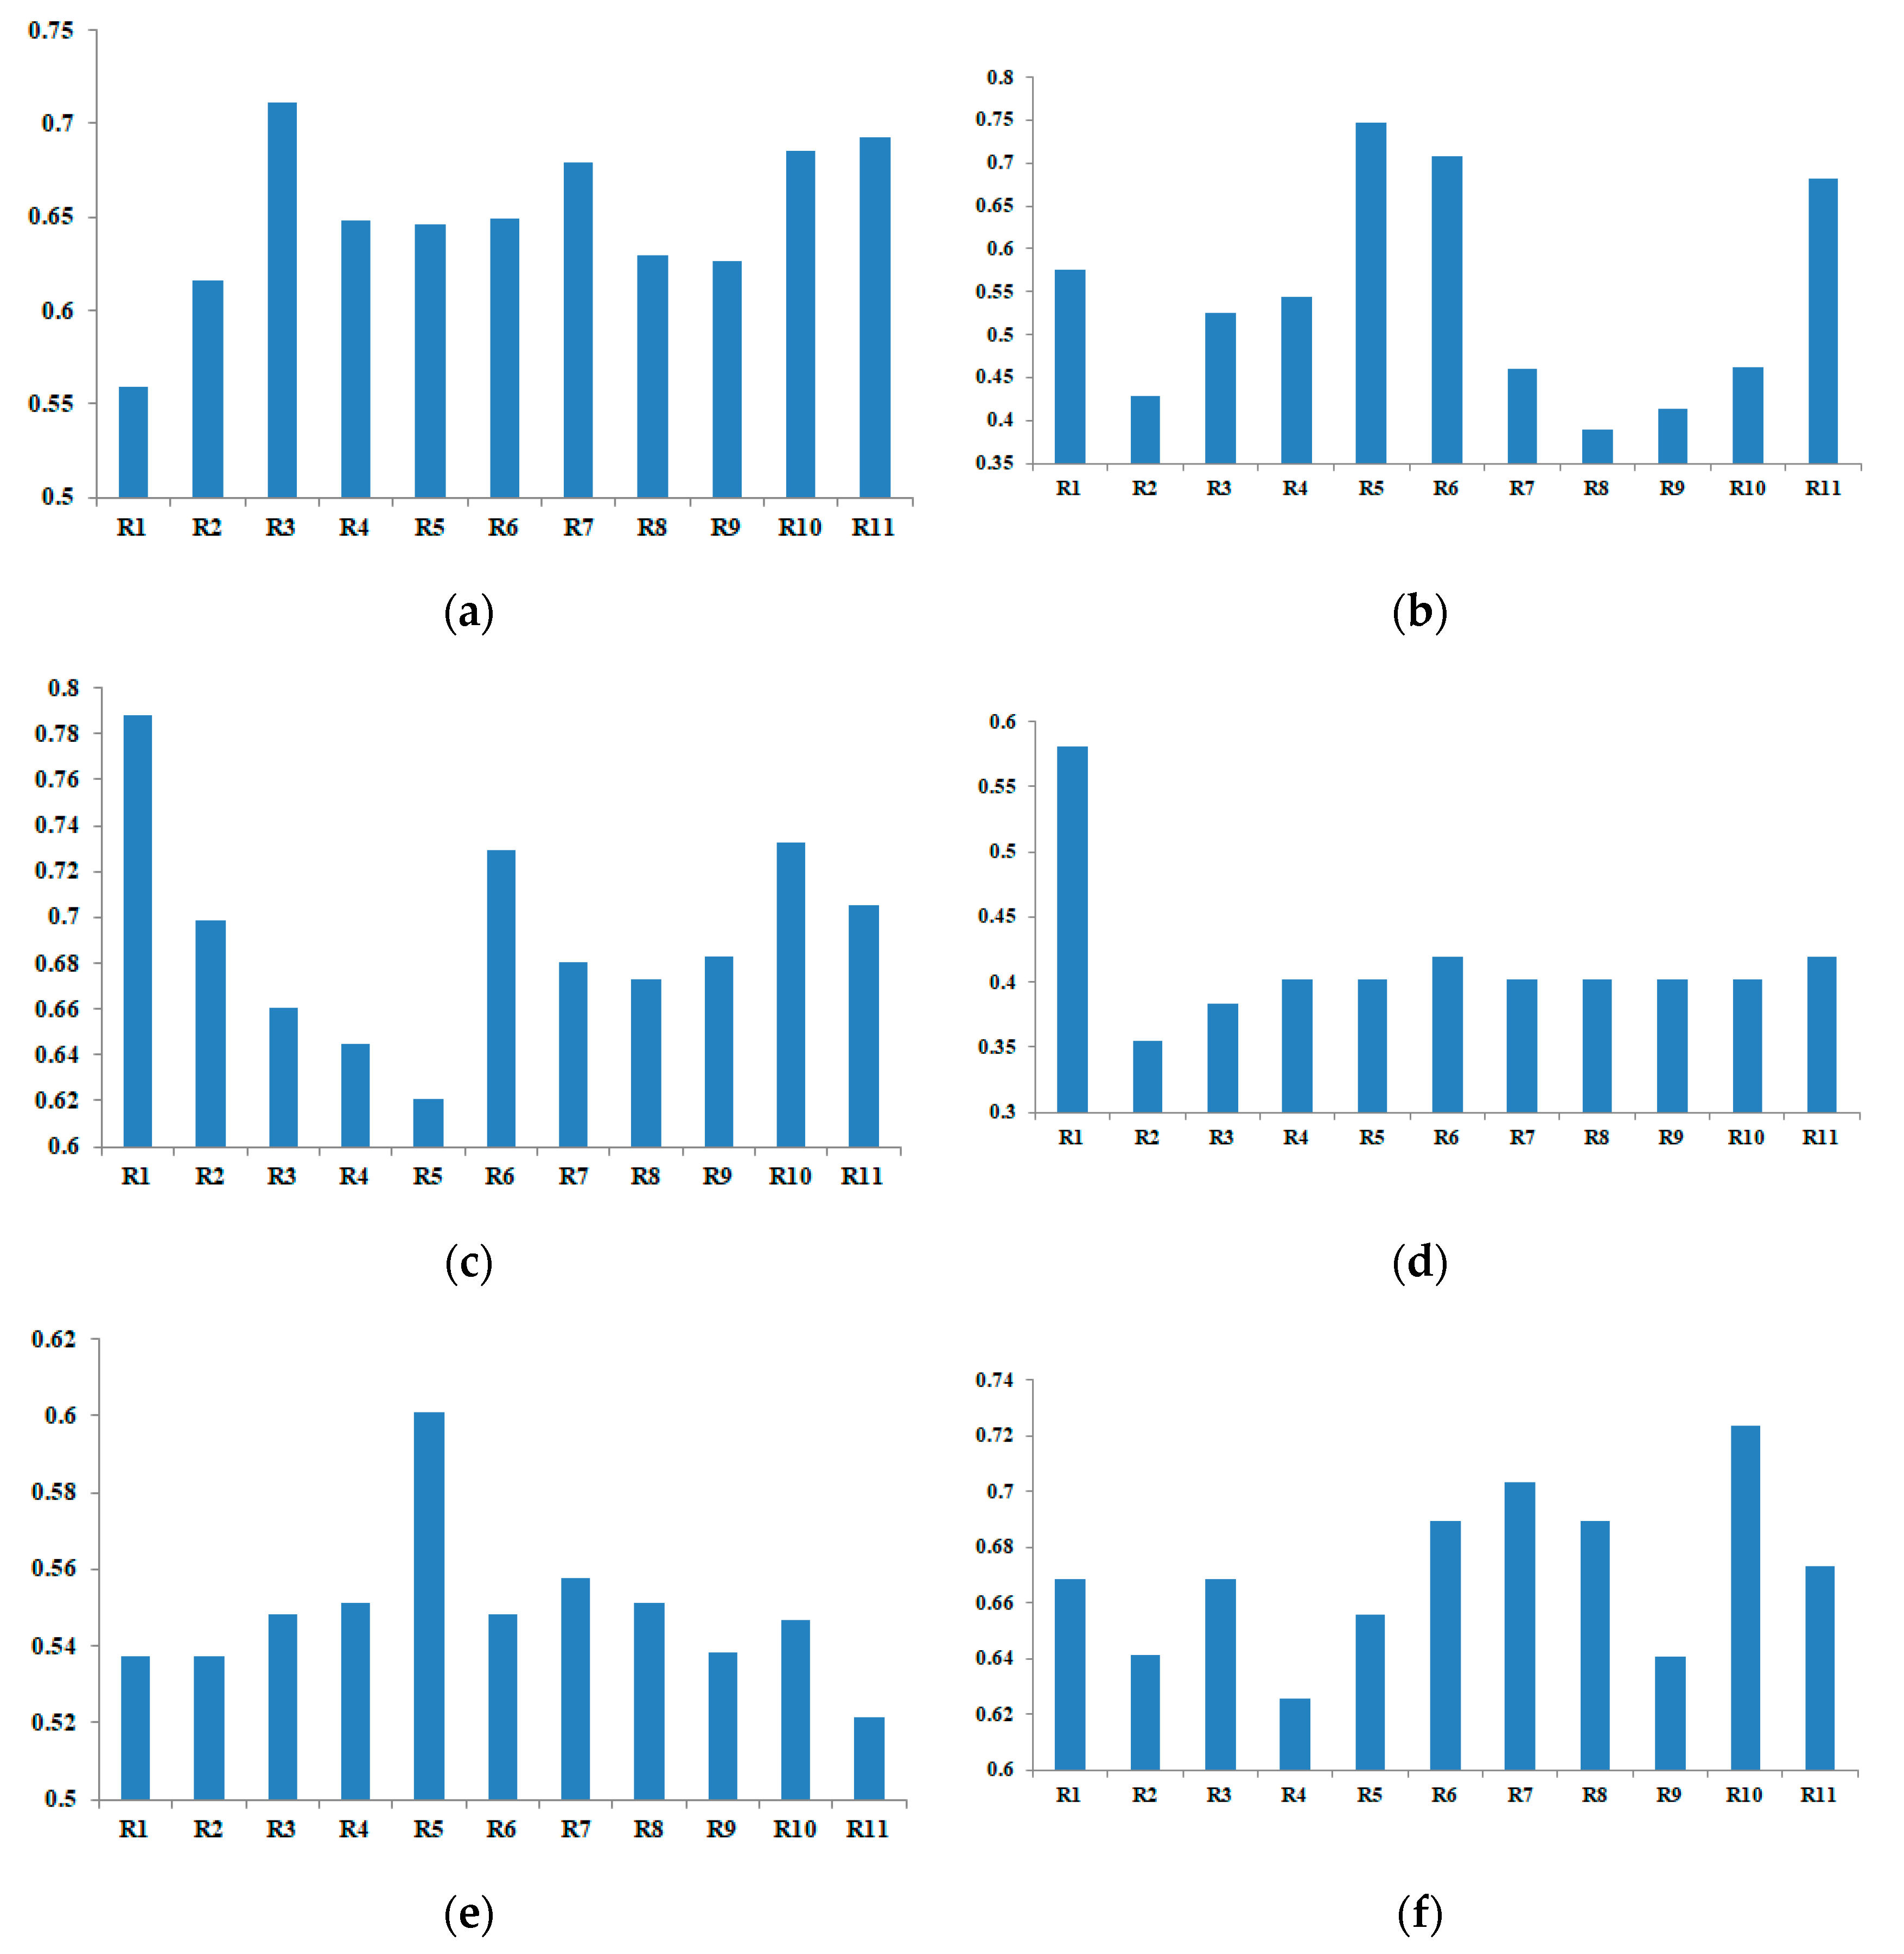
3. Evaluation Results for Pilot Regions
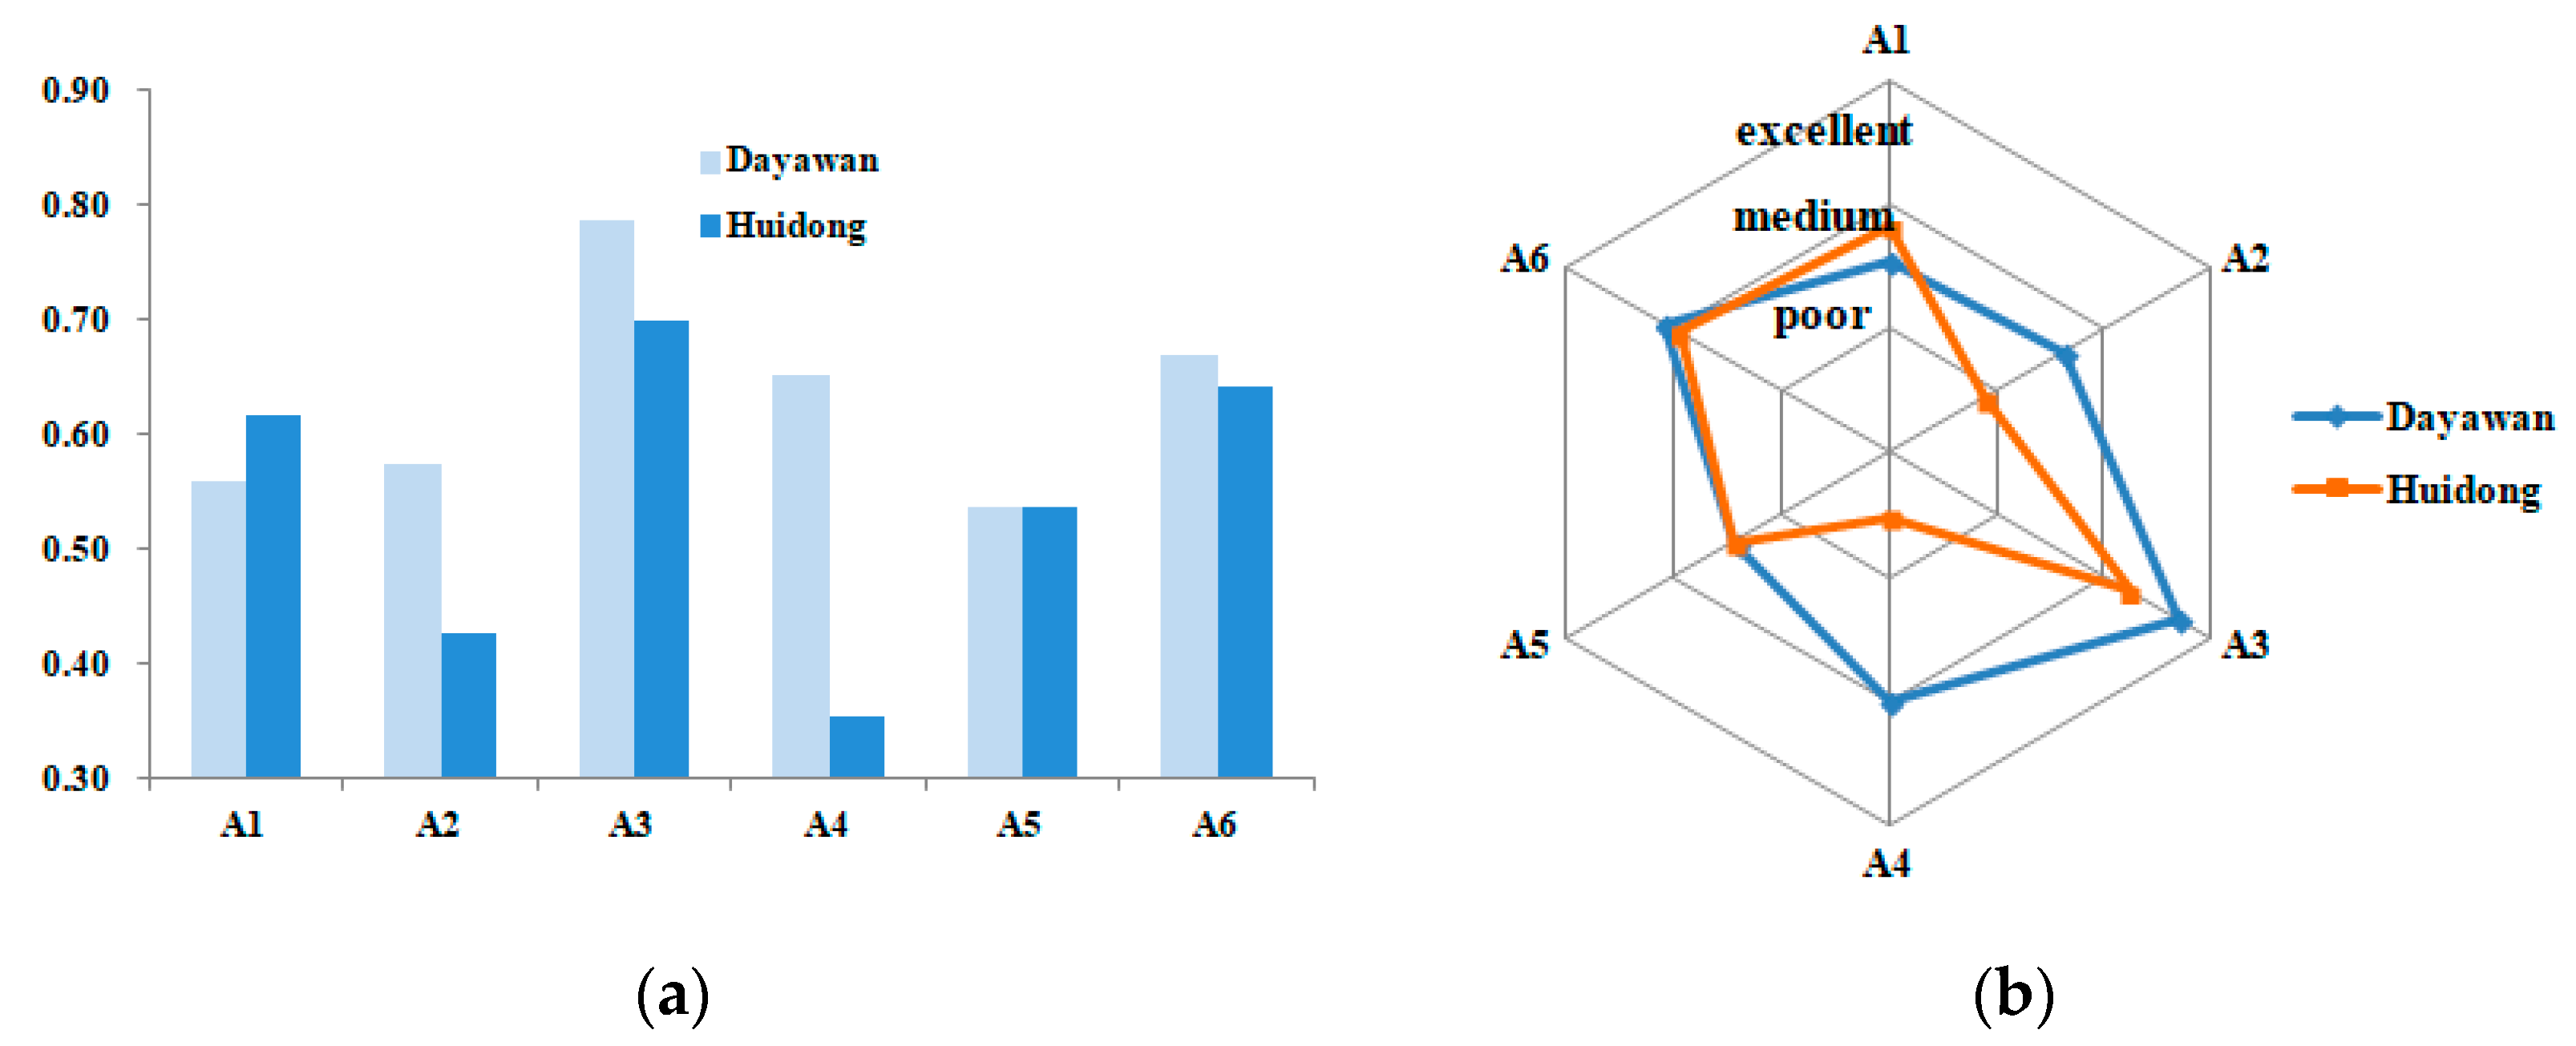
3.1. Evaluation Results for Pilot Regions in Guangdong Province
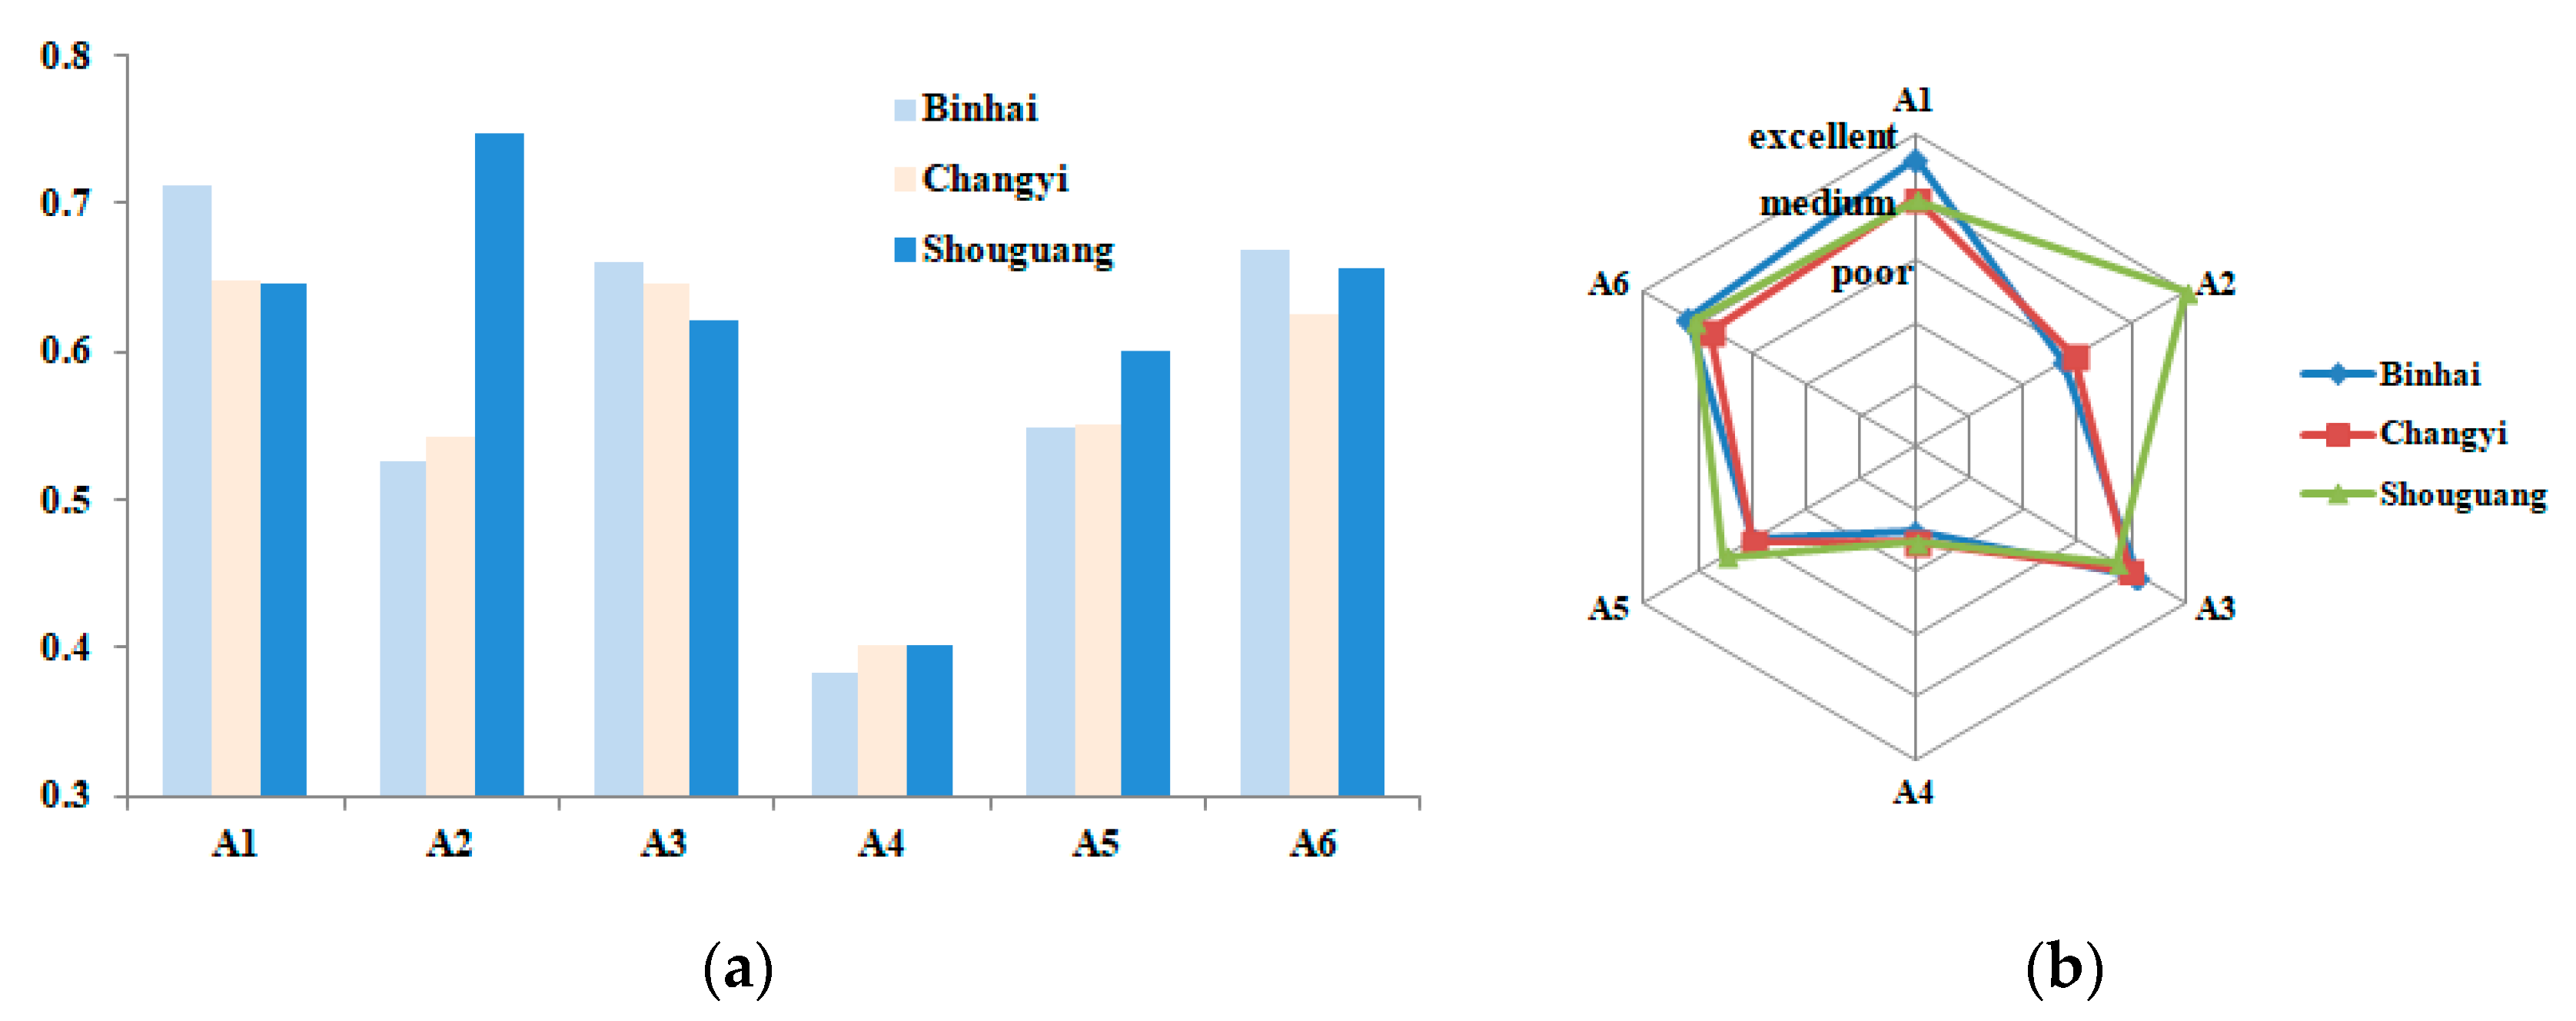
3.2. Evaluation Results for Pilot Regions in Shandong Province
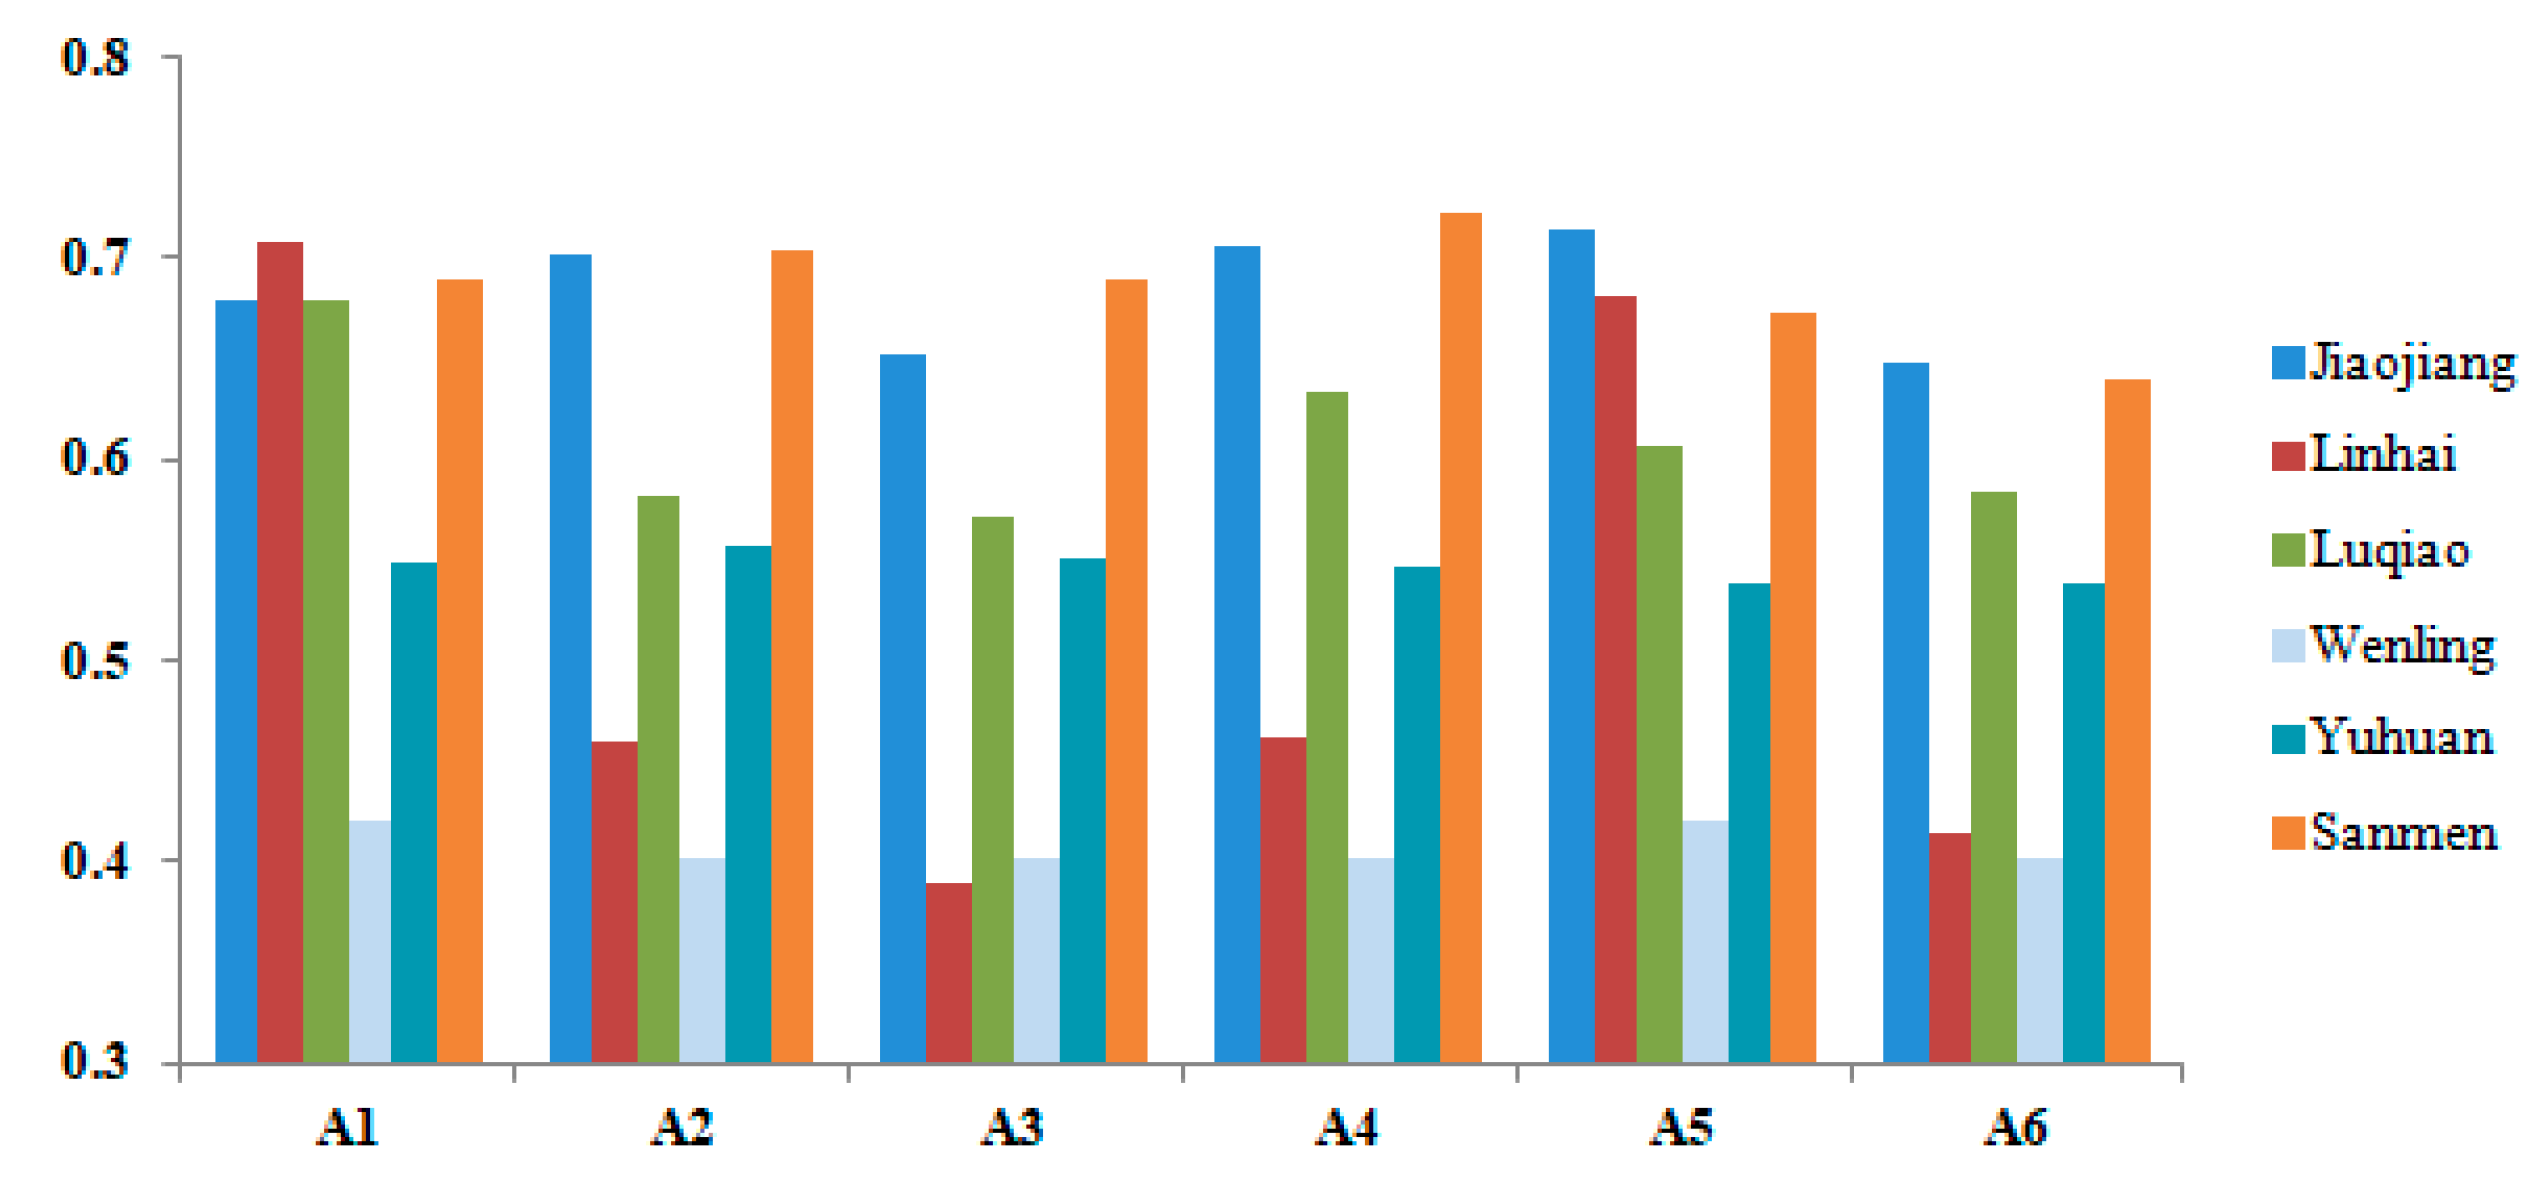
3.3. Evaluation Results for Pilot Regions in Zhejiang Province
3.4. Comparing the Evaluation Results
4. Discussions
5. Conclusions
- (1)
- The relationships between regional marine DRR capacity and various aspects of disaster management before, during, and after disasters were developed systematically. Disaster cycle, risk response, object and subject of capacity assessment, regional commonality, and specificity of indicators were considered comprehensively. By integrating the DRR experience of experts in various fields (such as ocean, hydrology, meteorology, civil affairs, emergency, education, and comprehensive DRR), we established a three-level indicator system for regional marine DRR capacity assessment. It includes six first-level indicators, 21 second-level indicators, and 136 third-level indicators.
- (2)
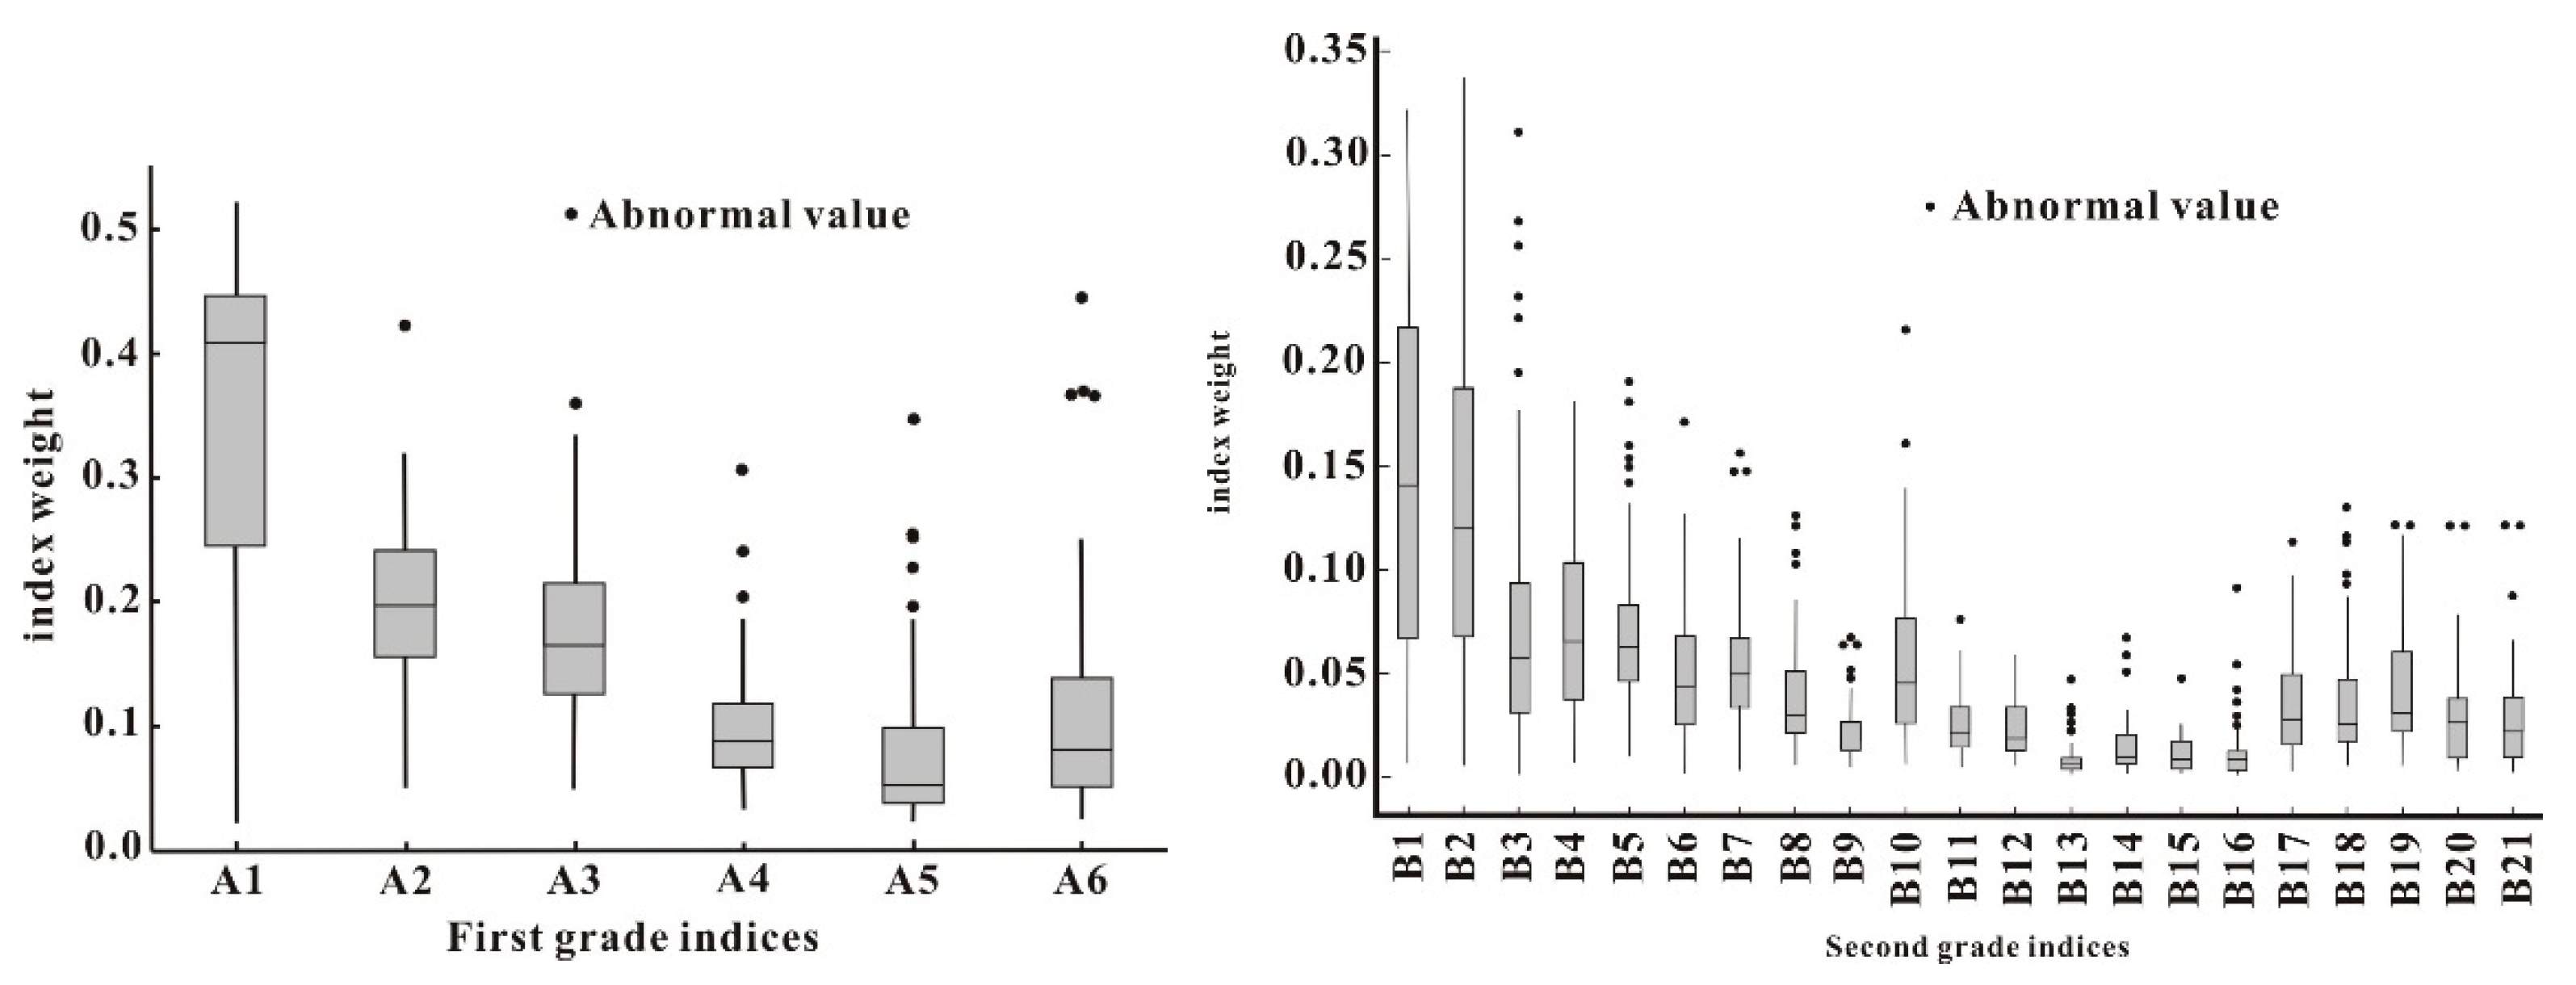
- The Evaluation Index Weights Expert Questionnaire was designed. The questionnaires were handed out to various departments and university experts involved in marine DRR capacities. After calculating the average of the weights provided by these experts, the final weights were found to be reasonable. Reasonable integration of the weights of experts in relevant fields enriched the knowledge and accumulated valuable experience for supporting the regional marine DRR capacity assessment and capacity building.
- (3)
- The evaluation of the three-level indicator system and the index weight results was performed in 11 pilot counties in Shandong, Zhejiang, and Guangdong Province. Through capacity assessment, gap analysis and demand analysis were further refined. It was possible to finally set regional DRR targets within a certain period. The results have important theoretical and practical implications for guiding regional DRR capacity building. They contribute a good foundation for future regional assessment of regional marine DRR capacity.
- (4)
- When implementing the constructed indicator system in different pilot areas, one should account for the different marine disaster risks that need to be dealt with in different regions. The differences in regional indicators should be considered. Through pilot research, the indicator system could eventually be applied to the national assessment of marine disaster mitigation capacity; thus, the indicator system should be versatile in China’s coastal areas. The evaluation indicated that there were very few indicators with regional characteristics. This had almost no impact on the evaluation results; thus, a unified indicator system could be adopted throughout the country.
- (5)
- In pilot assessments, the analysis should cover the hazards, hazard-affected environments, hazard-affected bodies, and response capacity of the marine disaster system. The availability of data on the grassroots management departments should be considered. Representative evaluation indicators need to be further screened and condensed. It is necessary to get a good balance among the integrity of the indicator system and data availability, the representation of indicators and number of indicators, and the key indicators and alternative indicators.
Author Contributions
Funding
Acknowledgments
Conflicts of Interest
References
- Cai, R.S.; Li, B.X.; Fang, W.H.; Fu, S.J.; Han, Z.Q.; Han, J.B.; Tan, H.J. On the comprehensive risk of global change in coastal zone and coastland of China. China Basic Sci. 2017, 6, 24–29. [Google Scholar]
- Qi, Q.H.; Cai, R.S.; Yan, X.H. Discussion on climate change and marine disaster risk governance in the coastal China seas. Mar. Sci. Bull. 2019, 38, 361–367. [Google Scholar]
- State Oceanic Administration of China. 1989–2017 China Marine Disaster Bulletin. 2018. Available online: http://gc.mnr.gov.cn/201806/t20180619_1798021.html (accessed on 23 April 2018).
- International Decade for Natural Disaster Reduction (IDNDR). Guidelines for Natural Disaster Prevention, Preparedness and Mitigation. In Proceedings of the World Conference on Natural Disaster Reduction, Yokohama, Japan, 23–27 May 1994; Available online: http://www.unisdr.org/files/8241_doc6841contenido1.pdf (accessed on 20 December 2019).
- UN Office for Disaster Risk Reduction (UNISDR). Hyogo Framework for Action 2005–2015: Building the Resilience of Nations and Communities to DISASTERS. 2016. Available online: http://www.unisdr.org/files/1037_hyogoframeworkforactionenglish.pdf (accessed on 20 December 2019).
- UN Office for Disaster Risk Reduction (UNISDR). Sendai Framework for Disaster Risk Reduction 2015–2030. 2016. Available online: http://www.unisdr.org/files/43291_sendaiframeworkfordrren.pdf (accessed on 20 December 2019).
- United Nations Development Programme (UNDP). Capacity Needs Assessment in Disaster Risk Reduction: County, District and Community Assessment; UNDP: Liberia, West Africa, 2009. [Google Scholar]
- United Nations Development Programme (UNDP). Capacity Assessment: Practice Note; UNDP: New York, NY, USA, 2008. [Google Scholar]
- World Meteorological Organization (WMO). A Disaster Risk Reduction Roadmap for the World Meteorological Organization. 2017. Available online: https://ane4bf-datap1.s3-eu-west-1.amazonaws.com/wmocms/s3fs-public/programme/brochure/DRRRoadmap.pdf?02bPNJK9PBExfsfOvqDopUwM_UCeG4UC (accessed on 20 December 2019).
- Wu, X.Y.; Gu, J.H. Advance in research on urban emergency management capacity assessment at home and abroad. J. Nat. Disasters 2007, 16, 109–114. [Google Scholar]
- Federal Emergency Management Agency (FEMA); National Emergency Management Association. State Capability Assessment for Readiness. 2009. Available online: https://www.docin.com/p-238379278.html (accessed on 12 February 2018).
- Liu, M. International Experiences of Disaster Emergency Management and Its Inspiration to China’s Relevant Management. Ecol. Econ. 2013, 9, 172–175. [Google Scholar]
- Hu, J.F.; Yang, Y.Q.; Yang, P.G. Research of Comprehensive Risk of Flood Disaster Based on Disaster Reduction Ability. Resour. Sci. 2014, 36, 94–102. [Google Scholar]
- Xie, L.L. A method for evaluating cities’ ability of reducing earthquake disasters. Earthq. Eng. Eng. Vib. 2006, 26, 1–10. [Google Scholar]
- Song, C.; Liu, C.L.; Ye, H. Assessment of City’s ability in Debris Flow Disaster Prevention and Reduction. South North Water Transf. Water Sci. Technol. 2007, 5, 117–120. [Google Scholar]
- Department of Transport & Regional Services. Natural Disaster in Australia: Reforming Mitigation, Relief & Recovery Arrangements—A Report to the Council of Australian Governments by a High Level Official’s Group (2002–2008); Department of Transport & Regional Services: Canberra, Australia, 2004.
- Shi, B.Z. Study on Performance Evaluation of Disaster Prevention and Rescue; A Research Report Commissioned by the Disaster Prevention and Rescue Committee of Taiwan; Disaster Prevention and Rescue Committee of Taiwan: Taiwan, China, 2003.
- Duan, X.F.; Xu, X.G. Research on Contributions of Coastal Dykes to Reducing Losses Caused by Storm Surges. J. Disaster Prev. Mitig. Eng. 2006, 26, 279–283. [Google Scholar]
- Hu, J.F.; Yang, P.G.; Yang, Y.Q.; Wu, J.J. Study on evaluation index system and method for flood control and disaster reduction capacity. J. Nat. Disasters 2010, 19, 82–87. [Google Scholar]
- Li, L.; Shen, Q. The evaluation of storm surge disaster prevention and mitigation capacity: Case of coastal cities in Shandong Province. Chin. Fish. Econ. 2011, 29, 98–106. [Google Scholar]
- Yan, X.J.; Li, Q.F.; Cai, T.; Ren, J.L.; Wan, S.C. Evaluation of urban flood control and disaster reduction capacity. J. Hohai Univ. (Nat. Sci.) 2012, 40, 118–122. [Google Scholar]
- Hui, L.Y. Strengthen Disaster Reduction Capabilities and Raise Public Awareness of Disaster Reduction. 2006. Available online: http://www.cctv.com/agriculture/20061011/103495.shtml (accessed on 12 February 2018).
- Jia, Y. China’s Whole-Nation System was Recognized Internationally National System of Emergency Management Improved Continuously. 2011. Available online: http://society.people.com.cn/GB/14564903.html (accessed on 12 February 2018).
- Civil Affairs Ministry of China. The National Disaster Reduction Committee Office Announced the National Standard of Pilot Communities for Comprehensive Disaster Reduction. 2010. Available online: http://www.mca.gov.cn/article/zwgk/fvfg/jzjj/201005/20100500074887.shtml (accessed on 12 February 2018).
- Fang, W.H. Study on Comprehensive Regional Marine Disaster Coping Capacity Assessment; Beijing Normal University: Beijing, China, 2016. [Google Scholar]
- Jiang, L. Integrating disaster prevention and reduction into national economic and social development plan to enhance national comprehensive disaster prevention and mitigation capacity. China Emerg. Manag. 2014, 5, 7–8. [Google Scholar]
- Yu, H.H. Study on the management of sudden marine disasters in China. Mar. Inf. 2014, 1, 51–55. [Google Scholar]
- Li, J.; Fang, W.H.; Guo, Z.X.; Jia, H.C.; Yang, Y.; Zhao, M.L.; Guan, Q.L.; Li, G.; Li, Y.; Cai, D.H. Establishment and weight quantification of indicator system for marine disaster coping capacity assessment. Mar. Sci. 2016, 40, 117–127. [Google Scholar]
- Saaty, T.L. Decision Making for Leaders: The Analytical Hierarchy Process for Decisions in a Complex World; Lifetime Learning Publications: Belmont, CA, USA, 1982; p. 291. [Google Scholar]
- Winston, W.L. Operations Research: Applications and Algorithms, 4th ed.; Duxbury Press: Duxbury, MA, USA, 2003; Chapter 13. [Google Scholar]
- Organization for Economic Cooperation and Development (OECD). Handbook on Constructing Composite Indicators: Methodology and User Guide. 2005. Available online: http://ina.bnu.edu.cn/docs/20140605101723366354.pdf (accessed on 20 August 2018).
- Jia, H.C.; Cao, C.X.; Ma, G.R.; Bao, D.M.; Wu, X.B.; Xu, M.; Zhao, J.; Tian, R. Assessment of Wetland Ecosystem Health in the Source Region of Yangtze, Yellow and Yalu Tsangpo Rivers of Qinghai Province. Wetl. Sci. 2011, 9, 209–217. [Google Scholar]
- Chinese Government’s Official Web Portal. China’s Actions for Disaster Prevention and Reduction. 2009. Available online: http://english1.english.gov.cn/official/2009-05/11/content_1310629_4.htm (accessed on 20 December 2019).

| First-Grade Indices | Second-Grade Indices | Third-Grade Indices |
|---|---|---|
| Engineering defense capacity A1 | Public engineering defense capacity B1 | The ratio of seawall meeting the protection requirement C1 |
| The ratio of standard seawall C2 | ||
| The proportion of protected people to seawall C3 | ||
| The reciprocal of the vulnerable point density of seawall C4 | ||
| The pump station density of seawall C5 | ||
| The drainage capacity of drainage facilities C6 | ||
| The management level of seawall C7 | ||
| The frequency of patrolling seawall during disasters C8 | ||
| The ratio of high standard seawall C9 | ||
| The length of 200-year return period of seawall C10 | ||
| The length of 100-year return period of seawall C11 | ||
| The length of 50-year return period of seawall C12 | ||
| The reciprocal of the density of pipes into the sea C13 | ||
| The defense capacity of important disaster-bearing bodies B2 | The ratio of the area of culture zone protected by the standard seawall C14 | |
| The ratio of the gross product of culture zone protected by the standard seawall C15 | ||
| The proportion of protected fishing boats C16 | ||
| The proportion of fishing ports above level 2 C17 | ||
| The number of fishing boats which can withstand wind above grade 7 C18 | ||
| The proportion of ports with ice-breaking capacity (only suitable for northern ports) C19 | ||
| Whether to carry out post-evaluation work regarding the protection capacity of ports C20 | ||
| The proportion of owned oil platforms with sea wave and sea ice warning guarantee information C21 | ||
| The proportion of platforms with emergency plan (considering the sea ice and sea waves in north and south divisions separately) C22 | ||
| The proportion of bulwarks with a designing return period of tidal level and waves above 50 years C23 | ||
| Whether the petrochemical zone formulated a marine disaster emergency plan C24 | ||
| The design of tidal level return period of nuclear power plants C25 | ||
| The design of wave height return period of nuclear power plants C26 | ||
| The design of maximum prevention tsunami waves of nuclear power plants C27 | ||
| The target achievement rate of wind resistance capacity C28 | ||
| The target achievement rate of the anti-ice capacity of bridge pier C29 | ||
| The ratio of boats which can withstand wind above grade 8 C30 | ||
| The ratio of large coastal projects carrying out a special evaluation of marine disaster risk C31 | ||
| The setting ratio of indicators (warning signs) C32 | ||
| The proportion of professional life-saving equipment C33 | ||
| The setting proportion of professional rescue teams C34 | ||
| The set number of emergency plans C35 | ||
| The number of emergency exercises C36 | ||
| Natural protection capacity B3 | The area of protected forest (e.g., mangrove forest, Chinese tamarisk forest) per unit shoreline C37 | |
| The area of salt marsh per unit shoreline C38 | ||
| The area of coral reef per unit shoreline C39 | ||
| The proportion of inhabited island C40 | ||
| Disaster warning and forecasting capacity A2 | Monitoring capacity B4 | The sea wave observation point density C41 |
| The water level observation point density C42 | ||
| The water temperature observation point density C43 | ||
| The sea condition video monitoring capacity C44 | ||
| The usage capacity of satellite monitoring systems C45 | ||
| The mobile monitoring capacity C46 | ||
| The aerial monitoring capacity C47 | ||
| The tsunami monitoring capacity C48 | ||
| The team size of observers C49 | ||
| Warning and forecasting capacity B5 | The number of marine forecasting organizations C50 | |
| The team size of marine forecasters C51 | ||
| The marine disaster warning capacity C52 | ||
| The marine environmental forecasting capacity C53 | ||
| The computing power of high-performance computers C54 | ||
| The operational numerical value forecasting capacity C55 | ||
| The receiving capacity of pre-warning products C56 | ||
| The information publishing capacity B6 | The publishing channels C57 | |
| The maximum publishing frequency C58 | ||
| The publishing system of forecasting information C59 | ||
| The short message platform C60 | ||
| The number of outdoor display screens in the evaluation region C61 | ||
| The number of fishing boats in the evaluation area equipped with safety environment guarantee service systems during fishery production C62 | ||
| The number of mobile phone applications on disaster warning and forecasting in the evaluation region C63 | ||
| Disaster emergency response capacity A3 | Emergency command capacity B7 | Whether a marine disaster emergency command organization is established C64 |
| The department of marine disaster emergency command organization C65 | ||
| The administrative position of the general command of the marine disaster emergency command organization C66 | ||
| The type of emergency command communication system C67 | ||
| The type of emergency communication system under extreme disaster conditions C68 | ||
| Emergency response plan system B8 | The ratio of villages (communities) preparing the marine disaster emergency response plan in coastal towns (streets) C69 | |
| The name and number of technical emergency response plans or operation manuals C70 | ||
| The number of emergency exercises for marine disasters last year C71 | ||
| The support capacity for assisting decision B9 | Whether there is an expert technical supporting group for assisting decisions C72 | |
| Whether to establish or use the supporting platform for assisting decisions C73 | ||
| Whether to establish or use a consultation system; if yes, please fill in the communication mode of the consultation system C74 | ||
| Whether there is a team of disaster information staff; if yes, please check the administrative division level of the established disaster information staff C75 | ||
| Whether to carry out risk evaluation work for marine disasters; if yes, please fill in the evaluated disaster type and scale C76 | ||
| Whether to establish a database of geographic information systems of the disaster-bearing system C77 | ||
| Whether to carry out verification work of warning tide level; if yes, please fill in the number of shorelines verified the warning tide level in the evaluation area C78 | ||
| Aiding and rescuing capacity B10 | Whether there is a professional marine rescue team C79 | |
| The number of professional rescue teams C80 | ||
| The expenditure of professional rescue teams last year C81 | ||
| Whether there are rescue helicopters and ships C82 | ||
| The number of rescue helicopters per unit length of coastline C83 | ||
| The number of rescue ships per unit length of coastline C84 | ||
| Post-disaster recovery and repair capacity A4 | Post-disaster emergency repair guarantee capacity B11 | Post-disaster electric power guarantee capacity C85 |
| Post-disaster water supply guarantee capacity C86 | ||
| Post-disaster resettlement capacity B12 | Post-disaster resettlement organization capacity C87 | |
| Post-disaster living guarantee capacity C88 | ||
| Mental recovery capacity B13 | Psychological aid capacity C89 | |
| Epidemic prevention capacity B14 | Epidemic prevention capacity in disaster area C90 | |
| Human epidemic prevention capacity C91 | ||
| Social mobilization capacity B15 | The number of volunteers C92 | |
| Economic recovery capacity B16 | The government compensation capacity C93 | |
| The mutual protection capacity of fishing boats C94 | ||
| The mutual protection capacity of cultivation C95 | ||
| The insurance rate C96 | ||
| Publicity and education capacity A5 | The hardware construction of marine disaster reduction publicity and education B17 | Whether bulletin boards for disaster prevention and reduction publicity are set up in the neighborhood committee, community, and shelter C97 |
| Whether bulletin boards for disaster prevention and reduction publicity are set up in other places (such as roads, squares, shopping malls, outdoor advertising columns) C98 | ||
| Whether a high-tone loudspeaker (alarm) is placed in the evaluated coastal community (village) C99 | ||
| Whether a warning tide level mark is set up in the evaluation area C100 | ||
| Whether a marine disaster warning sign is set up in the evaluation area C101 | ||
| The number of disaster prevention and reduction publicity and education bases for popularizing related knowledge of marine disaster prevention and reduction C102 | ||
| Publicity and education capacity of marine disaster prevention and reduction B18 | The capital amount the government used for the publicity and education of disaster prevention and reduction every year C103 | |
| The capital amount the government used for the publicity and education of marine disaster prevention and reduction every year C104 | ||
| Whether there is a publicity and education plan on marine disaster prevention and reduction in the evaluation area C105 | ||
| Whether a uniform publicity plan on marine disaster prevention and reduction is set up in the evaluation area every year C106 | ||
| The number of specialized organizations working on the publicity and education of marine disaster prevention and reduction knowledge in the evaluation area C107 | ||
| The number of bulletin boards in the neighborhood committee, community, and shelter used for publicizing disaster prevention and reduction C108 | ||
| The number of publicity activities for marine disaster prevention and reduction held in the evaluation area every year C109 | ||
| The number of people attending marine disaster prevention and reduction training in the evaluation area every year C110 | ||
| The number of communities (villages) holding at least one publicity activity about marine disaster prevention and reduction every year C111 | ||
| The situation of compiling or using marine disaster prevention and mitigation publicity materials in the evaluation area C112 | ||
| The people working on the publicity and education of marine disaster prevention and reduction in the evaluation area C113 | ||
| Whether the marine disaster prevention and reduction knowledge is included in the middle school and primary school curriculum C114 | ||
| Whether television and other media broadcast popular scientific knowledge of marine disaster prevention in the evaluation area C115 | ||
| The number of televisions and other media broadcasting popular scientific knowledge of marine disaster prevention in the evaluation area C116 | ||
| Disaster preparedness capacity A6 | The disaster avoidance capacity B19 | The number of emergency shelters per unit area C117 |
| The proportion of the emergency capacity C118 | ||
| The proportion of shelters suitable for marine disaster C119 | ||
| The number of havens per unit coastline C120 | ||
| The number of shelter anchor grounds per unit coastline C121 | ||
| The number of facilities that can bear level 12 wind waves C122 | ||
| The number of sheltered boats C123 | ||
| The material supporting capacity for disaster reduction and relief B20 | The number of disaster relief material storage points C124 | |
| The area of disaster relief material storage points C125 | ||
| The types of reserve materials C126 | ||
| The quantity of reserve materials C127 | ||
| Whether there is a disaster preparedness agreement with local supermarkets C128 | ||
| The disaster relief material purchasing fund every year C129 | ||
| The supporting capacity of social economic base B21 | Fiscal revenue C130 | |
| The traffic network density C131 | ||
| The renminbi (RMB) deposit remaining C132 | ||
| Mobile phone ownership per head C133 | ||
| The proportion of fixed-line telephones C134 | ||
| The number of healthy technical workers per thousand people C135 | ||
| The number of medical beds owned per thousand people C136 |
| A1 | A2 | A3 | A4 | A5 | A6 | |
|---|---|---|---|---|---|---|
| A1 | X1(1,1) | X1(1,2) | X1(1,3) | X1(1,4) | X1(1,5) | X1(1,6) |
| A2 | X1(2,2) | X1(2,3) | X1(2,4) | X1(2,5) | X1(2,6) | |
| A3 | X1(3,3) | X1(3,4) | X1(3,5) | X1(3,6) | ||
| A4 | X1(4,4) | X1(4,5) | X1(4,6) | |||
| A5 | X1(5,5) | X1(5,6) | ||||
| A6 | X1(6,6) |
| A1 | B1 | B2 | B3 |
|---|---|---|---|
| B1 | X2(1,1) | X2(1,2) | X2(1,3) |
| B2 | X2(2,2) | X2(2,3) | |
| B3 | X2(3,3) |
| B1 | C1 | C2 | C3 | C4 | C5 | C6 | C7 | C8 | C9 | C10 | C11 | C12 | C13 |
|---|---|---|---|---|---|---|---|---|---|---|---|---|---|
| C1 | X3(1,1) | X3(1,2) | X3(1,3) | X3(1,4) | X3(1,5) | X3(1,6) | X3(1,7) | X3(1,8) | X3(1,9) | X3(1,10) | X3(1,11) | X3(1,12) | X3(1,13) |
| C2 | X3(2,2) | X3(2,3) | X3(2,4) | X3(2,5) | X3(2,6) | X3(2,7) | X3(2,8) | X3(2,9) | X3(2,10) | X3(2,11) | X3(2,12) | X3(2,13) | |
| C3 | X3(3,3) | X3(3,4) | X3(3,5) | X3(3,6) | X3(3,7) | X3(3,8) | X3(3,9) | X3(3,10) | X3(3,11) | X3(3,12) | X3(3,13) | ||
| C4 | X3(4,4) | X3(4,5) | X3(4,6) | X3(4,7) | X3(4,8) | X3(4,9) | X3(4,10) | X3(4,11) | X3(4,12) | X3(4,13) | |||
| C5 | X3(5,5) | X3(5,6) | X3(5,7) | X3(5,8) | X3(5,9) | X3(5,10) | X3(5,11) | X3(5,12) | X3(5,13) | ||||
| C6 | X3(6,6) | X3(6,7) | X3(6,8) | X3(6,9) | X3(6,10) | X3(6,11) | X3(6,12) | X3(6,13) | |||||
| C7 | X3(7,7) | X3(7,8) | X3(7,9) | X3(7,10) | X3(7,11) | X3(7,12) | X3(7,13) | ||||||
| C8 | X3(8,8) | X3(8,9) | X3(8,10) | X3(8,11) | X3(8,12) | X3(8,13) | |||||||
| C9 | X3(9,9) | X3(9,10) | X3(9,11) | X3(9,12) | X3(9,13) | ||||||||
| C10 | X3(10,10) | X3(10,11) | X3(10,12) | X3(10,13) | |||||||||
| C11 | X3(11,11) | X3(11,12) | X3(11,13) | ||||||||||
| C12 | X3(12,12) | X3(12,13) | |||||||||||
| C13 | X3(13,13) |
© 2020 by the authors. Licensee MDPI, Basel, Switzerland. This article is an open access article distributed under the terms and conditions of the Creative Commons Attribution (CC BY) license (http://creativecommons.org/licenses/by/4.0/).
Share and Cite
Chen, F.; Jia, H.; Zhang, C. A Comprehensive Method for Evaluating Marine Disaster Risk Reduction Capacity in China. Sustainability 2020, 12, 825. https://doi.org/10.3390/su12030825
Chen F, Jia H, Zhang C. A Comprehensive Method for Evaluating Marine Disaster Risk Reduction Capacity in China. Sustainability. 2020; 12(3):825. https://doi.org/10.3390/su12030825
Chicago/Turabian StyleChen, Fang, Huicong Jia, and Chuanrong Zhang. 2020. "A Comprehensive Method for Evaluating Marine Disaster Risk Reduction Capacity in China" Sustainability 12, no. 3: 825. https://doi.org/10.3390/su12030825
APA StyleChen, F., Jia, H., & Zhang, C. (2020). A Comprehensive Method for Evaluating Marine Disaster Risk Reduction Capacity in China. Sustainability, 12(3), 825. https://doi.org/10.3390/su12030825