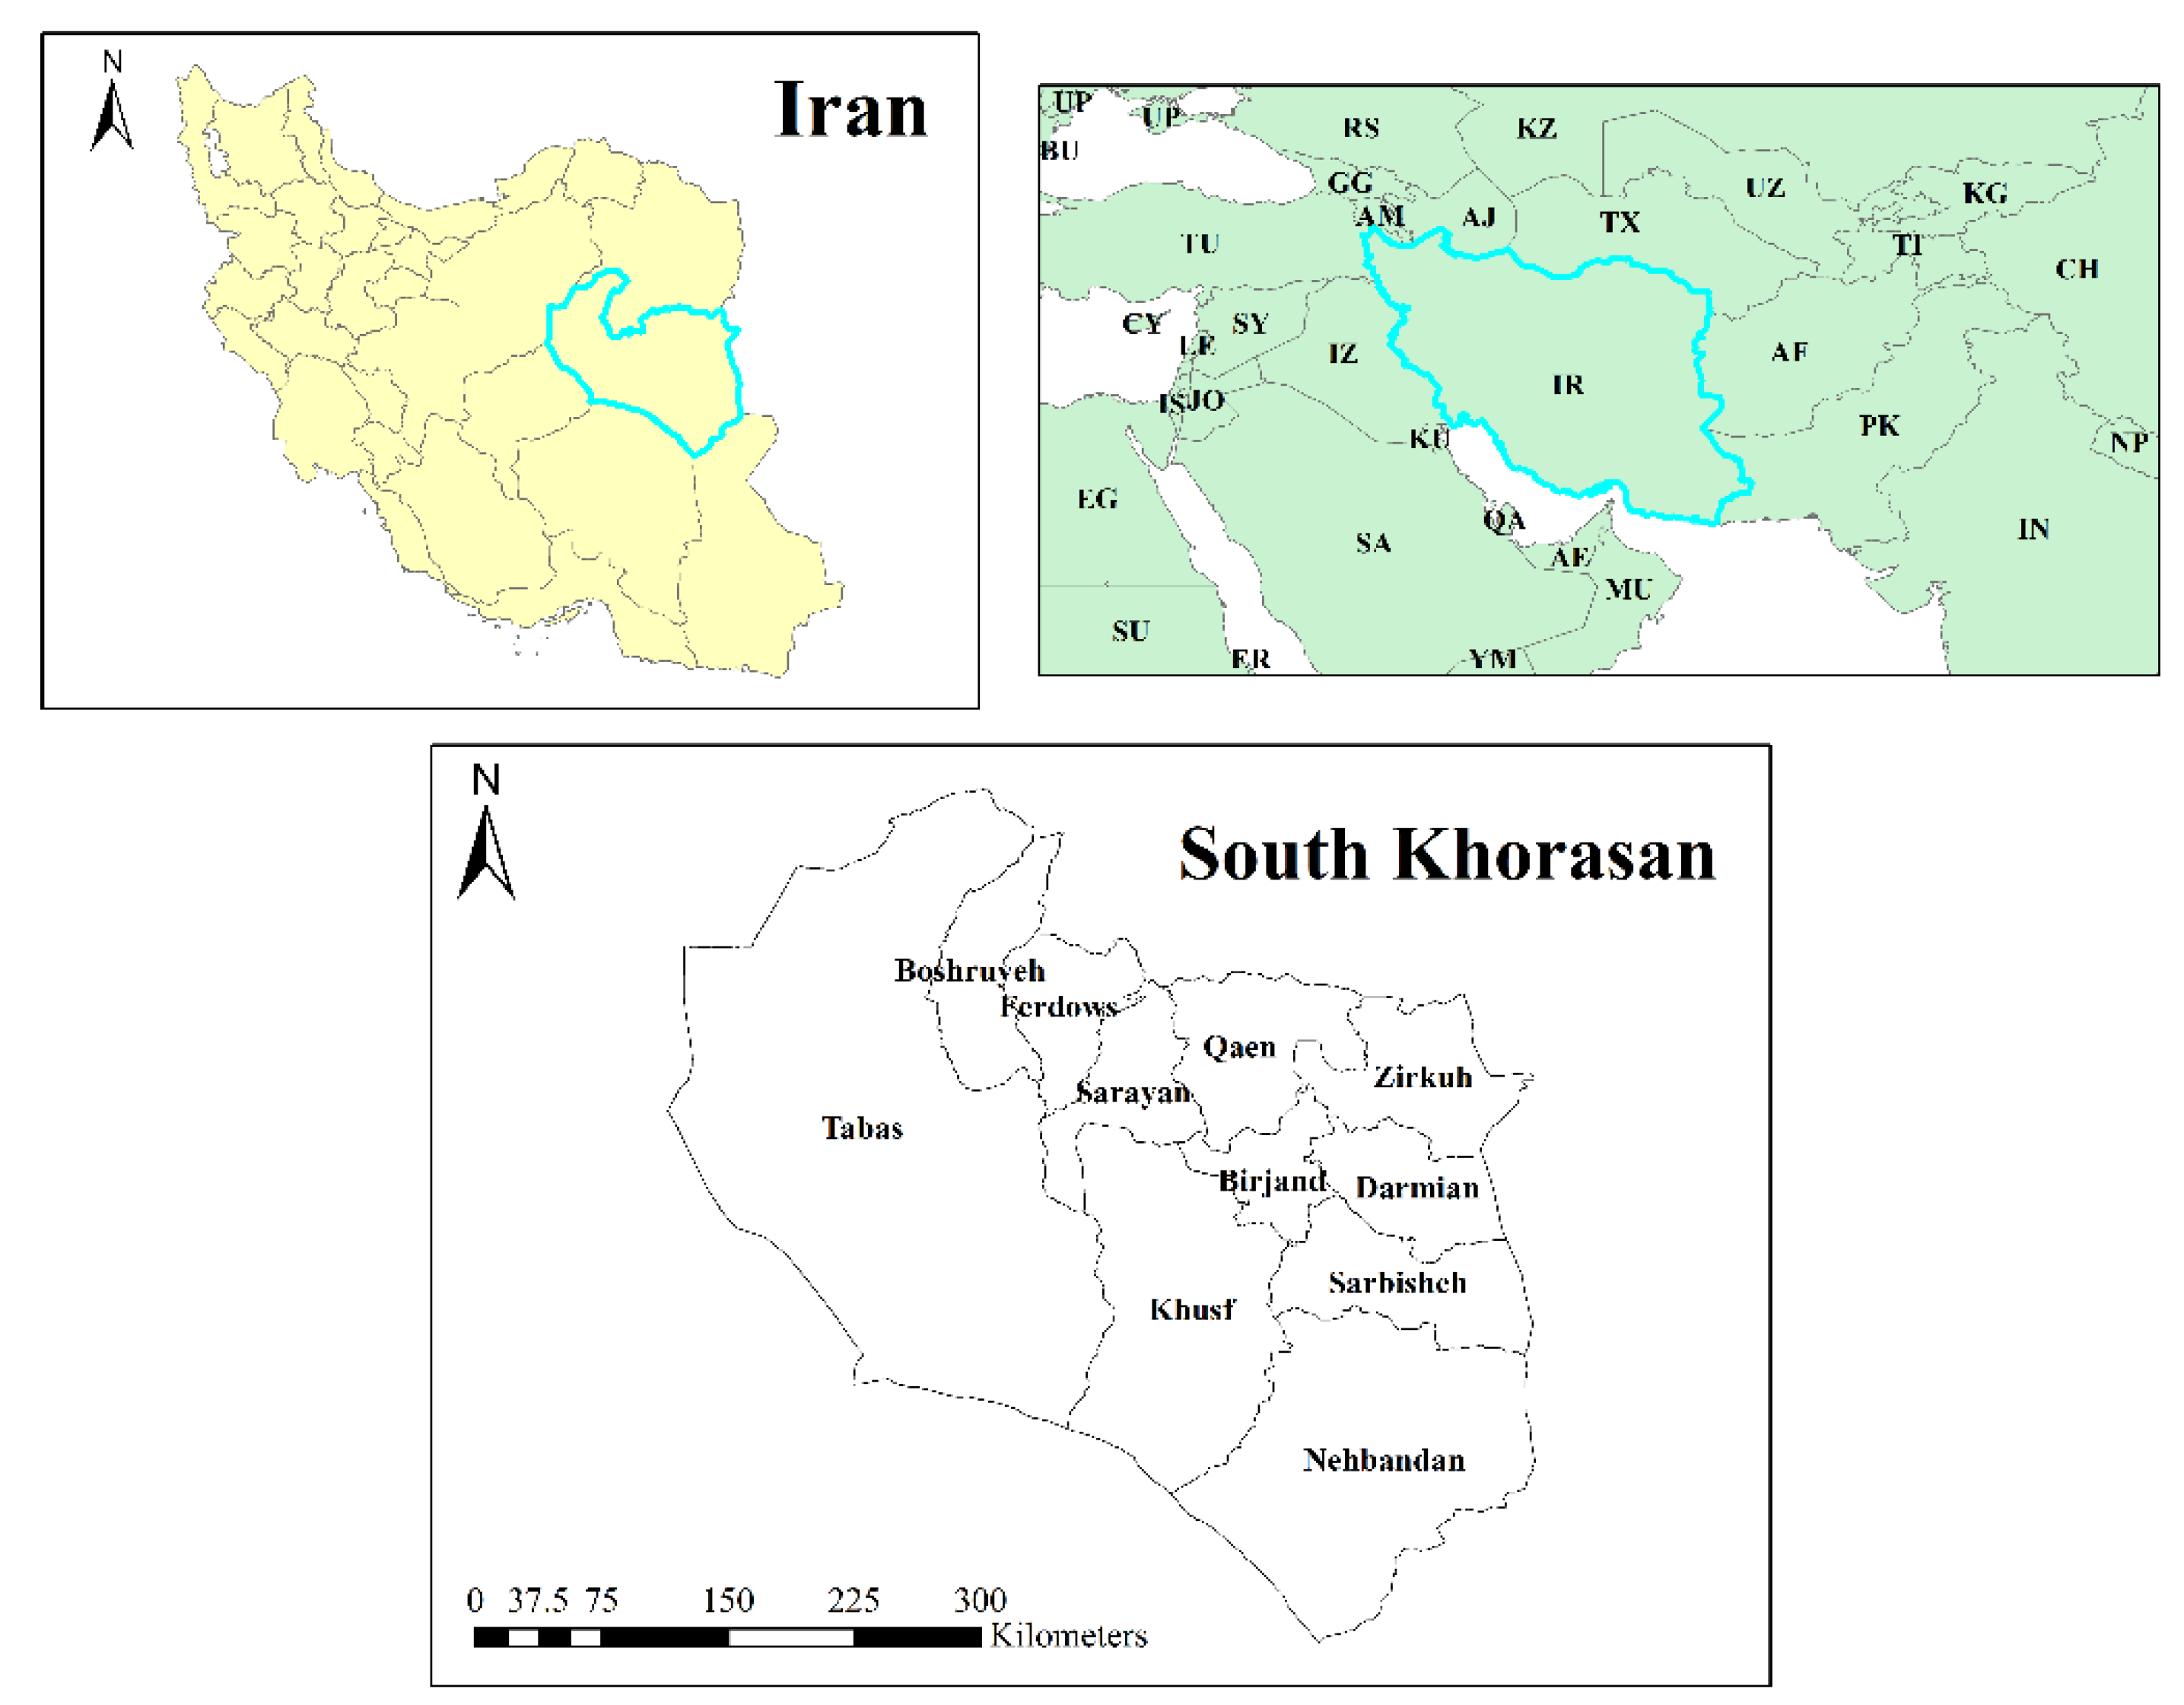
Article

Water-Saving Scenarios Based on Input–Output Analysis and Virtual Water Concept: A Case in Iran

1
Department of Civil Engineering, Faculty of Engineering, Ferdowsi University of Mashhad, Mashhad, Iran
2
Faculty of Civil Engineering and Geosciences, Water Resources Section, Delft University of Technology, Stevinweg 1, 2628 CN Delft, The Netherlands
3
Economic Development Department, Faculty of Social Sciences and Economics, Alzahra University, Tehran 19938 93973, Iran
*
Author to whom correspondence should be addressed.
Sustainability 2020, 12(3), 818; https://doi.org/10.3390/su12030818
Submission received: 3 December 2019 / Revised: 17 January 2020 / Accepted: 20 January 2020 / Published: 22 January 2020
(This article belongs to the Section Environmental Sustainability and Applications)

Abstract

:
The strong desire for achieving self-sufficiency in developing and mostly water-scarce regions has endangered socioeconomic and environmental sustainability. South Khorasan is particularly exposed to such insecurities, largely due to its limited water resource endowments and its comparatively intensive agriculture. In this paper, we apply the water footprint accounting method (WFA) along with a regional input–output (IO) model to analyze the efficiency of the total (direct + indirect) water consumption in different economic sectors and water footprint of the region in 2011. Results show that agriculture is responsible for more than 95% of water consumption in the area, while it accounts for just 27% of value-added. Additionally, this sector has the largest contribution to water footprint composition (92%) when compared to other sectors. Three water-saving scenarios are simulated by the use of IO economic model and water footprint accounting method. Applying the proper cropping pattern has the greatest impact on water conservation with 348.46 Mm3 per year. A 10% increase in water productivity contributes nearly twice as much as reducing the exports and increasing the imports of agricultural crops by 10% in saving water with 115.23 and 65.49 Mm3, respectively. The most significant contribution in each water-saving strategy comes from the agriculture sector since it has the largest direct and indirect water-use coefficient. The results of this study can help local policymakers take appropriate measures to improve the efficiency of water resource utilization, taking into consideration social, economic, and environmental sustainability.

1. Introduction

Water scarcity has been intensified in the past few decades, especially in water-scarce regions, largely due to the emergence of a very rapid economic development period and the continuous growth in the world population. Two different kinds of solutions can be used to deal with water challenges: physical or virtual. Since food production accounts for more than 90% of global water withdrawal [1], agriculture technology is considered to be the most effective physical strategy, covering both machinery and agronomic advances which allows farmers to enhance the efficiency of water resource utilization. On the other hand, importing water-intensive commodities and services from water-abundant regions through active and effective cooperation in regional, national, and global trade network, contributes substantially to importing an immense amount of water virtually. The term virtual water was first introduced by Allan [2] and referred to the amount of water embodied in products and services [3]. The increasing scarcity of water supplies brought about by increased demands and changing lifestyles has emphasized the importance of water-use efficiency. Many studies examined the agricultural water resources utilization efficiency in the global food trade network, highlighting the critical role of agriculture in providing food security [4,5,6,7]. Accordingly, different methods such as bottom-up and top-down approaches have been used to do so. Unlike bottom-up water footprint accounting, which only considers domestic water consumption, the top-down Input–Output (IO) economic model takes the entire supply chain into account [8]. Therefore, it makes it possible to quantify the virtual water content of industrial products and other services available in the economy of a region. In recent years, this model is widely applied to evaluate the virtual water trade at a regional [9,10,11,12], national [13,14,15], and international [16,17,18,19] scale, purely from a sustainability point of view.
In developing countries, decision-makers may oversimplify some important environmental issues associated with indiscriminate use of water in an inefficient way within the economic sectors, mainly due to the political prioritization they have established on achieving complete self-sufficiency in producing their food and other industrial commodities. For example, gross domestic product (GDP) is often prioritized over social well-being and environmental problems when evaluating the performance of an economy [20]. However, socioeconomic repercussions of this lack of consideration of environmental degradation would, in the long term, put the region in grave danger of deprivation. Therefore, it would be of utmost importance to manage the allocation of water supplies to the most efficient and appropriate economic sectors within the regions, in particular in arid regions. Heckscher–Ohlin theory, accordingly, considers natural resource endowments the key factor in the specialization of an area in producing commodities; otherwise, it should import its requirements from the other areas [21]. The IO model is an effective method to identify the most effective and efficient sectors in terms of water utilization efficiency and to trace the intersectoral direct and indirect water consumption using monetary units [22,23].
In this study, we first construct the IO transactions table for the South Khorasan province based on the national IO table in 2011, using the CHARM (Cross-hauling Adjusted Regionalization Method) -RAS method. According to the limited available data in Iran’s economy, the reasons for using this approach are as follows: (1) This method considers the simultaneous exportation and importation which is known as cross-hauling [24]. In other non-survey-based methods of constructing regional IO tables, the sectors/regions can only be either an importer or an exporter. In real situations, though, a sector/region may import the same product it produces. (2) The application of other non-survey-based methods in Iran is just to quantify the intermediate imports from other regions and the exports are calculated as residual. (3) To improve the accuracy in constructing the regional IO table of South Khorasan, the CHARM method is implemented as part of a hybrid approach, in which we have used many available statistical data to construct a meaningful table in the state of lacking information. Additionally, (4) since this study uses the amounts of imports and exports in developing a water-saving strategy, it is imperative to use this method. It is worth mentioning that the CHARM method is used in many studies aimed at constructing the regional IO tables of different parts of the world [25,26,27,28].
Then the volume of water used directly and indirectly by each economic sector is estimated using direct water-use coefficients. The efficiency of these sectors is compared based on their economic outputs in comparison with their water consumption. Furthermore, the contribution of agriculture, as the major user of water in the region, in the total water footprint is quantified.
After uncovering the volume of water embedded in different economic commodities and services, it will be clear whether the limited water supplies of the region are allocated efficiently. South Khorasan is a particularly a interesting case since although it suffers from surface water shortages and also from a high evapotranspiration rate, it relies heavily on its aquifers for producing water-intensive agricultural products. The water scarcity of this region is assessed by Qasemipour and Abbasi [29], considering the trade pattern of the region. This study indicated that the current agricultural water consumption resulted in a water scarcity of 206%, far beyond the sustainability criteria. The stresses imposed on the ecological system of the region are yet to be deteriorated since the growing population is set to increase the demands for food, hence water. Consequently, three water-saving strategies are proposed using the IO model along with the water footprint accounting methodology. Since such information has been conspicuously absent from the decision-making process in South Khorasan, the results of this study count as an important guide for policymakers.

2. Materials and Methods

2.1. Study Area

South Khorasan—with an area of 95385 km2—is the third biggest province in Iran, which lies between 30°15′ N to 34°03′ N latitudes and 57°43′ E to 61°04′ E longitudes. Figure 1 shows the location of the region and its 11 counties, namely Birjand, Boshrooye, Darmian, Ferdows, Khusf, Nehbandan, Qaen, Sarayan, Sarbishe, Tabas, and Zirkooh. These counties together account for more than nine percent of Iran’s territory and accommodate 0.97% of the national population. Since the province is adjacent to the hottest desert in the world (Dasht-e-Loot), the relative humidity is significantly low most of the year and rarely exceeds 50% in only a few weeks a year. The amount of rainfall varies from 89 mm in Tabas to 186 mm in Qaen, while the temporal variability of rainfall is even more uneven, and almost all the precipitation occurs from January to April through heavy showers. Moreover, due to the aridity of the study area along with high wind speed, the evapotranspiration rate is enormously high. Nevertheless, South Khorasan enjoys an agriculture-based economy, and, with a mere 0.52% contribution in the national gross domestic product (GDP), in 2011 ranked last among 31 provinces of Iran [
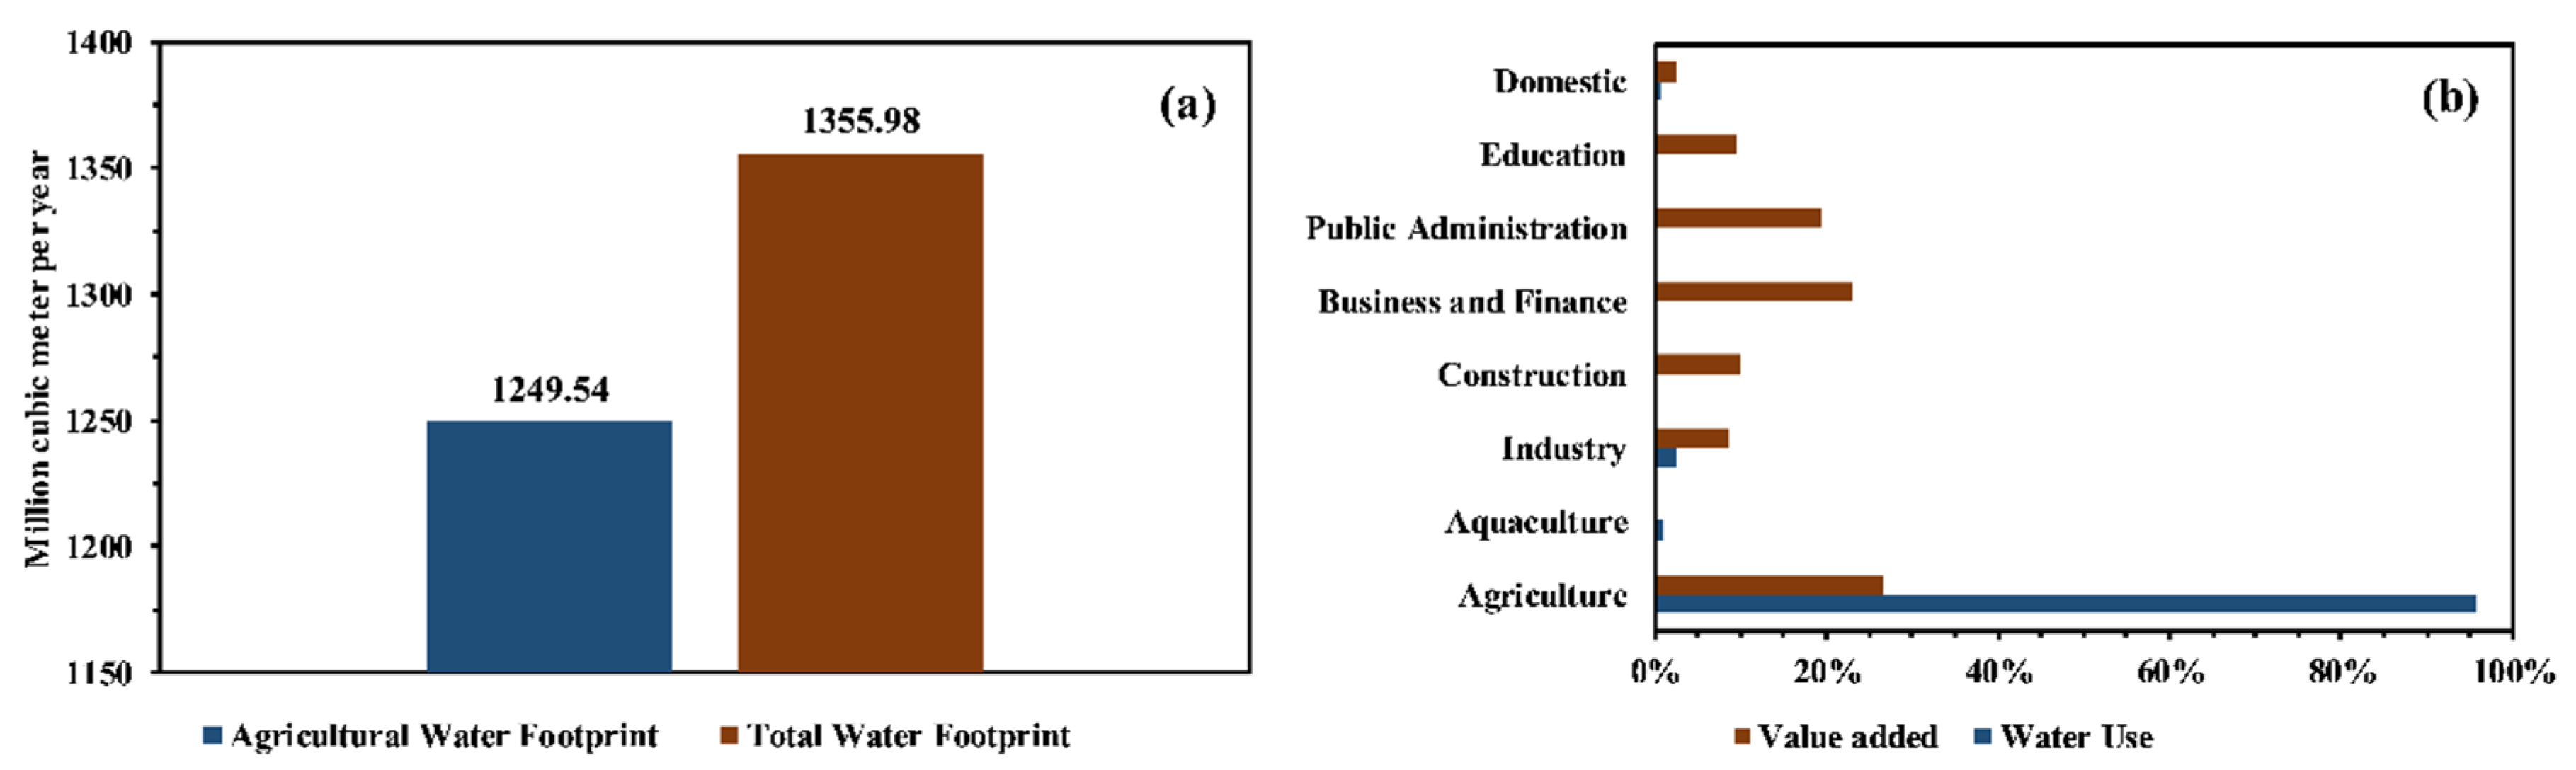
30]. According to the Regional Water Company’s annual reports, more than 91% of local water resources are solely exploited by the agriculture sector while the industry is responsible for a mere 2%.

2.2. Input–Output Economic Structure

The input–output economic technique is extensively used to illustrate inter-industry linkages of a region. This model works based on data representing the monetary flows between different sectors, as shown in Equation (1).
x i = j = 1 n z i j + y i
where n is the number of sectors within the economy of the region, x i is the gross output of sector i which is necessary to meet all the requirements of all sectors j ( z i j ) as well as the final demand ( y i ). Having defined the technical coefficients ( a i j ) as the intersectoral flows from sector i to sector j per the output of sector j, we can rewrite Equation (1) as:
x i = j = 1 n a i j x j + y i
Equation (2) becomes X = A X + Y in matrix notation, which when solved yields Equation (3).
X = ( I A ) 1 Y = L Y
where X denotes the output matrix, ( I A ) 1 is called the Leontief inverse or total requirement matrix, and Y is the final demand matrix [9]. Each element of the Leontief inverse matrix ( l i j ) represents the amount of output of sector i, which is required (either directly or indirectly) to satisfy one monetary unit of sector j’s final demand.

2.3. Constructing Input–Output Tables

Constructing the regional IO tables is possible using two main methods, namely survey-based and non-survey-based, the former of which is very time consuming and therefore expensive [31]. Unlike the non-survey-based techniques which are widely used in the compilation of IO tables, survey-based approaches are unlikely to be used in most circumstances, largely due to lack of detailed information of interregional trade flows [18,32]. In this study, the CHARM method as a hybrid method is used to construct the IO table in South Khorasan. This is largely due to the fact that this study considers the regional trade patterns, and to the fact that other methods in constructing regional IO tables in Iran, such as Location Quotients (LQs), are not able to estimate the exports. The following considerations are used in constructing the regional IO table of South Khorasan:
  • The Statistical Center of Iran (SCI) has annually released the regional accounts of Iran, including outputs, value-added, and intermediate use (superior data) from 2000 to 2015. The required data in this study, such as outputs, value-added, and intermediate use, accordingly are statistically obtained from SCI (Technical coefficients are estimated using the RAS method [31]).
  • We quantified domestic consumption (C) and government expenditures (G) applying the income-expenditure surveys carried out by the SCI, and regional accounts, as well.
According to the above-mentioned points, superior data are used to construct the IO table of the region and, therefore, a hybrid method is employed to do so, rather than a purely non-survey-based approach. The procedures for constructing the regional IO table of South Khorasan are as follows:
First, we calculate using the regional input–output transactions using the national IO table in 2011.
Z i j   R ,   C H A R M = a i j N . X ^ j R
where a i j N , X ^ j R , and Z i j R ,   C H A R M are the national technical coefficient matrix, the diagonalized matrix of the output of sector j in the region, and the regional intersectoral transaction matrix, respectively. Following this, each sector’s value-added can also be quantified using Equation (5).
V j   R ,   C H A R M = X j R i Z i j   R ,   C H A R M
It should be noticed that V j R ,   C H A R M V j R . V j R is the value-added vector of the region R which is released by the SCI, while the V j R ,   C H A R M is the regional value-added which is estimated using the CHARM method and differs from actual information. As mentioned before, for calculating the domestic consumption ( C i R ) and government expenditures ( G i R ), the statistical data provided by SCI are used. Gross fixed investments and inventories can be calculated using the regional to national proportions of total production. In other words:
I i   R = λ ^ i × I i   N
In Equation (6), λ ^ i is defined as x i R x i N and I i   R and I i   N are the regional and national gross fixed investments and inventories, respectively. Considering the basic structure of IO tables, the South Khorasan’s net exports (trade balance) of sector i both domestically and internationally can be measured using Equation (7).
b i R ,   CHARM =   X i R ( j Z i j   R ,   CHARM + C i   R + I i   R + G i   R )
For calculating the mutually simultaneous trade (known as cross-hauling), we should first characterize the degree of heterogeneity of each economic sector using Equation (8).
h i R = h i N = Tv i N | b i N | ( X i   N + j Z ij   N + f i N )
in which
T v i N = e i N + m i N
b i N = e i N m i N
h i R and h i N are the heterogeneity in the regional and national scale, respectively.   T v i N is the total trade volume and b i N denotes to the trade balance (net export) of sector i, both on the national scale. Heterogeneity is all about the product’s characteristics and not its geographical location; therefore, the assumption that regional product heterogeneity is equal to its national counterpart is quite reasonable [24]. Using the degree of heterogeneity calculated in Equation (8) for the sector i, the cross-hauling can be quantified using Equation (11).
q i R ,   CHARM = h i R ( X i R j Z i j   R ,   CHARM + f i R )
Gross exports and imports can then be calculated as follows:
e i R ,   CHARM = q i R ,   CHARM + | b i R ,   CHARM | + b i R ,   CHARM 2
m i R ,   CHARM = q i R ,   CHARM + | b i R ,   CHARM | b i R ,   CHARM 2
It should be maintained that the yielded figures of intermediate use and value-added using this method differ from what SCI has released for the South Khorasan, and this is a weakness of CHARM method. Following this, the first quarter of regional IO table is reconstructed using the RAS method, and then for the regional IO table to be totally constructed, Equations (7)–(13) are used again. The CHARM method not only can yield the regional IO table in full compliance with the national statistical accounts but also is able to estimate the technical coefficients, exports, and imports in all sectors. We refer the readers to Miller and Blair [31] for the detailed descriptions of RAS method since it is beyond the scope of this study. Table 1 shows the technical coefficients and total requirement matrices derived from the CHARM method. All the calculations and procedures used in this research are obtained through programming using Matlab R2013b (MathWorks, Natick, Massachusetts, USA).

2.4. Water Use by Economic Sectors

The term “virtual water” was first introduced by Allan [33] as the volume of water used in the production chain of commodities as a strategy of alleviating the water scarcity in the Middle East and North Africa (MENA) region [34]. In agricultural products, the virtual water content of each crop can be estimated using the CROPWAT model developed by the Food and Agriculture Organization (FAO) of the United Nations [35]. In other products and services, though, the virtual water is calculated by the use of direct water-use coefficients, and it is defined as the amount of water consumed in producing those commodities and services. The term “consumption” here refers to the amount of water that is either evaporated or transferred to other regions as the embodied water in traded commodities [2]. To estimate the water use of each sector, we should first calculate the direct water consumption coefficients as follows:
ω i = w i X i
where ω i is the direct (or first round) effects of inter-industry interactions in the local economy (in m3/103$). The amount of freshwater intake to sector i is expressed by w i in physical units (m3), and X i represents the output of that sector in monetary units ($).
Water, however, is also used indirectly in the supply chain of producing the final products, which includes necessary imports from other economic sectors. The top-down input–output economic approach, unlike the bottom-up water footprint accounting, can calculate this amount of water [13]. Total water consumption can be measured by multiplying the diagonalized direct water consumption matrix by the Leontief inverse matrix [12], as shown in Equation (15):
T W C = ω i ˙ ( I A ) 1 Y
where TWC is the total water consumption, and ω i ˙ is the diagonalized matrix of direct water consumption coefficients. Applying the direct water consumption coefficients, as defined in Equation (14), a decrease in final demand leads to a reduction in total water consumption as summarized in Equation (16):
ω i ˙ ( I A ) 1 Δ Y
in which Δ Y represents the change in the final demand in monetary units (103$/year). It should be mentioned that the final demand here is comprised of domestic consumption plus government expenditure plus exports minus imports, and that the economic impact of this new final demand in compensation of employees is not considered in Equation (16) since labor–input coefficients (either in monetary or physical units) are difficult to obtain. However, if we define the direct value-added coefficient as v a i = v i / x j then we can also measure the concomitant decline in value-added due to a decrease (increase) in exports (imports) as follows:
v a i ˙ ( I A ) 1 Δ Y

2.5. Water-Saving Framework

As described in the previous section, the economic IO model and the water footprint accounting methodology are used in this study to determine whether how much water could be saved through (1) increasing the productivity of irrigation, (2) an increase/decrease in crop imports/exports, and (3) applying the proper cropping pattern. In this section the application of both methodologies will be explained. The first and third scenarios stem from the application of water footprint accounting using the irrigation data of the region at the county spatial resolution and are also crop specific. Measuring the virtual water content (the inverse of water productivity) of each crop type through the use of CROPWAT model, we then quantified the volume of agricultural water consumption for each county based on their production practices. The water productivity of the same crops varies across the counties, likely due to different climatic conditions, technology and/or managerial implications. After estimating the current water productivity of each crop type, we considered a 10% increase in water productivity to determine how much water saving could be achieved. The difference in improved and initial water productivities (ton/m3) results in the volume of water-saving at both a county-level and crop specific. Regarding the third scenario, we first estimated the virtual water contents of each crop type harvested in the region at a county spatial scale. Next, the proper cropping pattern for each county was identified considering the climatic differences (crop evapotranspiration ratio). Applying the potential proper cropping pattern and comparing with the current one, we were able to determine the water-saving potentials.
In order to assess the potential water saving using the IO model associated with the second scenario, we must first estimate the direct water consumption coefficient. After constructing the IO table of the region employing the CHARM-RAS method (Section 2.3), we gain access to the imports/exports, intermediate use, and value-added for each sector available in the table. Having defined the direct water consumption and value-added coefficients, we can determine the volume of water-saving and the changes in the value-added brought about by changes in imports/exports using Equations (16) and (17), respectively. We employed the CHARM-RAS approach to investigate the South Khorasan economy’s structure. This model not only represents the intermediate input matrix (technical coefficients or direct requirements) but also captures both direct and indirect requirements (total requirement matrix) needed to satisfy one monetary unit of final demand.

2.6. Data

The 2011 national IO table was used in this study to construct the regional IO table of South Khorasan. Due to lack of data in sectoral direct water intake, we aggregated 72 sectors available in national IO table into eight main sectors using International Standard Industrial Classification (ISIC) of all economic activities (Table 2). Direct water inputs were obtained from Birjand Water and Waste Water Company. The IO table aggregation was based on the availability of direct water intake data, which was provided by the Regional Water Company of South Khorasan (South Khorasan, Iran).
The 10-year averaged (from 2005) agricultural data, including planting dates, sowing area, crop production, and crop yields along with meteorological data such as the monthly average of the maximum and minimum temperature, relative humidity, monthly precipitation, wind speed, and sunshine hours were obtained from the Agriculture Organization of the South Khorasan and South Khorasan Meteorological Organization, respectively. In many global assessments using the CROPWAT model, however, the climatic data of the capital or the most appropriate station is applied for estimating the virtual water content of crops in each country [37,38]. This cannot be representative of the climate condition in the entire country since each region within a country has its own kind of climate patterns. Accordingly, Qasemipour and Abbasi [39] illustrate a great difference between South Khorasan crop water requirements and Iran’s average.

3. Results

South Khorasan, as a developing region, relies heavily on agriculture as its primary source of income. Population growth has increased the demand for water, while unprecedented drought has limited the blue water resources availability. Groundwater aquifers in South Khorasan, as the only source of freshwater in the region (which accounts for 99% of water withdrawal), are overexploited solely due to intensive agriculture [39]. Therefore, as agriculture is the major user of freshwater in such an arid region, any inefficient use of water would, in the long term, threaten the socioeconomic and environmental sustainability of the region. We therefore suggest a 10% increase in water productivity in agriculture. Different pathways of improving water productivity are proposed at plant, field, system, and basin level [40,41]. Molden et al. [42] give a high priority to water-scarce regions to improve their water productivity.
Final sectoral water multipliers in Table 3 represent the total (direct + indirect) water consumption of each sector based on its inter-industry linkages. Agriculture has the highest water consumption coefficients either directly ( ω i ) or indirectly ( i ω i l ij ). Consequently, it consumes much more water than any other sector.
Figure 2b shows that agriculture is responsible for the most significant share (95.8%) of water consumed in the economy of the region, while its value-added is the highest (27%) with an insignificant difference with Business and Finance (23%) and Public Administration (19%) sectors. Moreover, having involved domestic supply chain along with trade activities, agriculture accounts for the largest share in the water footprint of the region with 92.2% (Figure 2a). The volume of water consumed by other sectors than agriculture is insignificant, hence their water footprints. Taking into account the volume of water exported and/or imported virtually, the water footprint of agriculture is estimated as the volume of water used domestically plus the virtual water imported minus the virtual water exported [3].
Due to the climatic condition of the region with low precipitation and high evapotranspiration, agriculture contributes to using a large volume of limited water supplies inefficiently. This indiscriminate use of limited water resources in agriculture in such an arid region may have serious social and economic repercussions such as migration to big cities, wiping out many of jobs, and many vacant villages as inhabitants move away. Environmental issues, on the other side, include drying qanats (a gently sloping underground channel, developed in ancient Iran by Persian people for the purpose of transferring water from an aquifer with a series of vertical access shafts, which is one of the most elaborate techniques in using water sustainably in hot, arid and semi-arid regions [43]), land subsidence, desertification, and its concomitant dust storms have become major challenges for regional sustainable development.

3.1. First Strategy: A 10% Increase in Water Productivity

Applying a 10% increase in water productivity results in a 115.23 Mm3 (9.96% water reduction) decrease in water consumption (Table 4). This information is achieved using the virtual water content (m3/ton) of crops harvested in all 11 counties of the region based on data reported in Qasemipour and Abbasi [39]. Water-saving associated with this improved water productivity in each county is measured by multiplying the difference of improved and initial water productivities (ton/m3) with the production of each crop (ton).
According to Table 4 Darmian by saving 4.31 Mm3 has the highest percentage of change (−12.32%) in water consumption. This is primarily due to the large scale cultivation of water-intensive products in Darmian in comparison with other counties.
The percentage change in the withdrawal-to-availability (WTA) ratio is also calculated in each county within the region as shown in Boshrooye has the most significant irrigated area within the region, and accordingly, applying a 10% increase in water productivity resulted in the highest percentage change in WTA ratio (57.79%) in this county, followed by Ferdows (36.56%) and Sarayan (35.19%). Sarayan has a larger irrigated area in comparison with Ferdows, but the percentage reduction in WTA ratio is more significant for the latter. This highlights the role of water-intensive crops in the inefficient use of water supplies. Therefore, such an arid region should import water-intensive crops rather than producing them domestically. Using the virtual water concept, the contribution of each group of crops is also measured, and the results are presented in Table 5. As it is expected, although cereals group has the largest cultivated area (45,242 ha), fruits have the highest contribution in water-saving (68.18%) since they have higher virtual water content. Applying this strategy would be costly due to required capital investment, assessment of which is beyond the scope of this study.

3.2. Second Strategy: A 10% Decrease in Exports and a Simultaneously 10% Increase in Imports of Agricultural Products

According to the information of the Statistical Center of Iran [30], South Khorasan with a mere 0.52% of the gross domestic product (GDP) ranked last among 31 regions in Iran. In agriculture, though, South Khorasan with a contribution of 1.33% in the country’s value-added ranked 27th. On the one hand, since the region enjoys an agriculture-based economy, other economic sectors do not contribute much in exports to other regions. On the other hand, since the agriculture sector has the greatest direct water consumption coefficient, and since South Khorasan suffers from severe water scarcity, a 10% decrease in exports and simultaneously a 10% increase in agricultural crops seems more applicable. A volume of about 65.49 Mm3 (10% water reduction) can be saved by applying this strategy, the majority of which (65.30 Mm3) is achieved in the agriculture sector (Table 6), as the major user of water in the region. This strategy, however, has negative effects on the region’s value-added and employment compensation in comparison with the first strategy. Results show that this strategy negatively affects the region’s value-added by a mere 0.89% reduction, which accounts for around $26 million.
The total (direct + indirect) water consumption coefficients, known as total water multipliers, are presented in Table 6 and represent the intersectoral transactions of different economic sectors. Agriculture has the highest total water multiplier (2056.23), followed by aquaculture (1302.48) and Public Administration (811.03), all in m3/103$. The remarkable need for other sector’s output to satisfy final demands makes the total water multipliers of Construction and Public Administration sectors significantly larger than their direct water consumption coefficients.

3.3. Third Strategy: Applying Proper Cropping Pattern

Cropping pattern plays a crucial role in using the water efficiently, especially in arid and semi-arid countries where the spatio-temporal pattern of green (i.e., rainfall) and blue (i.e., surface and groundwater) water availability varies significantly across their regions. Improper allocation of water to regions with low water productivity reduces the efficiency of water consumption. Since water productivity for the different types of crops in South Khorasan varies considerably from county to county, applying the proper cultivation pattern would save an enormous amount of 348.46 Mm3 (30.11% water reduction) of water per year. As shown in Table 7, fiber crops, with a crop production of about 34% of that of cereals, have the most considerable contribution in water-saving with 37.66%. This is while fiber crops with 170.67 Mm3 (14.75%) are the third biggest consumers of local water resources (Table 5). The most water-intensive crops, namely cereals and fiber crops, together account for more than 71% of the total water saving, a value obtained from applying the proper cropping pattern within the region. The cost of this strategy is, for sure, marginal in comparison with the other two strategies since it is concerned with the management of the current farming practices and does not need any improvements in technology. Furthermore, Playán and Mateos [44] measure much better economic return in the improvement of irrigation management than improving the irrigation infrastructures.
The socioeconomic effects of each water-saving strategies on the region’s economy, including gross output, value-added and employment compensation should be assessed since the region relies heavily on agriculture as its main source of income for decades. It is clear that any hasty decision would most likely result in social, economic, environmental, or political insecurities. Further studies are needed to pay more consideration and attention to these such important matters.

4. Discussion

Virtual water transfer refers to a scale-dependent measure with which water-scarce counties could relieve the pressure on their limited water supplies caused by overexploitation. It also means “water loss” for exporting regions, since the embedded water cannot be used in that region unless through re-exportation [45]. This study aimed at analyzing the sustainability of the current supply-oriented water management practices in South Khorasan, a region with water scarcity of around 206% [39], where more than 95% of its limited—hence precious—water resources are dedicated to producing water-intensive, low-value agricultural crops. Accordingly, previous studies suggested some policy measures, including water pricing, water right exchanges, improving water use efficiency, controlling illegal water abstractions [46]. However, such policy recommendations are difficult to promote since there are many other issues such as opportunity cost, social, economic, environmental, political, and even cultural considerations. The virtual water concept can only provide some insights into the way policymakers can enhance the efficiency of water consumption. Improving water-use efficiency, as with the first strategy in this study, concerns lack the necessary incentives, and this is likely due to high costs of providing modern, water-saving, agricultural technologies/machinery. In this study, we have demonstrated that a 10% increase in water utilization efficiency (or a 10% decrease in virtual water content) in agricultural practices would result in 9.96% reduction in water withdrawal, that is 115.23 Mm3. This percentage could play a critical role in such an arid region within a country whose policymakers aim at achieving complete food self-sufficiency through some policy frameworks [47]: Vision 2025 (adopted in January 2009), Broad Policies for Agriculture (adopted in July 2005), and the Fifth Five-Year National Economics, Socials, and Cultural Development Plan.
While improving water-use efficiency counts as an attractive, rational, and preliminary policy suggestion, it has been proven difficult to promote, particularly in Iran, which is currently under unprecedented, strict economic sanctions. In this situation, identifying the most efficient sectors within the economy of the region is of utmost importance. An input–output table allows us to do so and also enables us to assess how causing a change in final demand would affect the economy of a region. A volume of about 65.49 Mm3 (10% water reduction) can be saved by applying a 10% decrease in exports and a simultaneously 10% increase in imports of agricultural crops. The negative effects of this scenario have also been assessed and proved to be small, with a reduction of a mere 0.89% in value-added ($26 million). Figure 2 shows that the agriculture sector does not contribute to the region’s value-added much more than the other sectors in comparison with its water consumption. This is because it has the most direct and also indirect requirements from other sectors to satisfy one monetary unit of its output (Table 1). This scenario might also affect the local prices, the consumption pattern of residents, and employment. These issues are left for future studies.
A question to assess is whether improving the efficiency of water consumption (machinery, managerial, and/or agronomic advances) in agriculture could guarantee more sustainability in such an arid region regarding its limited water resources than reducing the agricultural practices and increasing the virtual water imports. This study is a first step to provide some information to respond to this question.

5. Conclusions

South Khorasan consumes more than 95% of its limited water supplies in food production, while it does not meet the sustainability criteria. This has exerted an enormous amount of pressure on groundwater aquifers as the only supply of water in the region, which in turn has resulted in many social, economic, and environmental issues in the past three decades. As a result, three water-saving strategies are proposed in this study to alleviate the water scarcity of the region using the input–output economic technique and virtual water concept. To do so, we have constructed the IO table of the region for the year of 2011, using a semi-survey-based approach, CHARM-RAS. The intersectoral transactions and the trade-offs derived from this method have the most consistency with the regional accounts. Moreover, unlike the other non-survey-based methods, the CHARM method is able to quantify the simultaneous importations and exportations (cross-hauling). This method also yields the most reliable data for both imports and exports, which are not released by the Statistical Center of Iran. This table allows us to calculate the water consumption of different economic sectors in the region and, subsequently, identify the key consumers of the local water resources. In agriculture, water consumption is also estimated using the virtual water concept, and the estimated figure is very similar to that of the IO model. Results show that agriculture is the largest consumer of water in South Khorasan, with a high direct and indirect water consumption coefficient. On the other side, despite very low direct water consumption coefficients, Public Administration, Business and Finance, Construction, and Industry have a large total water-use multipliers. This is due primarily to their requirements to other water-intensive sectors’ goods and services in their production process. According to the unsustainability of agricultural practices in South Khorasan [39], such estimation of the total water consumed in different economic sectors is of utmost importance in identifying the most productive sectors in which, per one physical unit of water, they have the most substantial economic output.
Water-use reduction associated with each strategy is also measured, and the results reveal that establishing proper cropping pattern has the greatest impact on improving water-use efficiency. The agriculture sector has the most significant share in total water footprint while its value-added is marginally higher than the Business and Finance and Public Administration sectors. This highlights the important role that cropping pattern plays in the water resource management of the region, which is overlooked by local authorities. Quantifying the cost of applying these strategies would provide an accurate picture of their applicability and suitability. It should be noted that none of these strategies are easy to implement, since apart from environmental, social, and economic consequences, policymakers should take into account other critical factors such as ethics, politics, and culture [48].
The strong desire to achieve complete self-sufficiency in food production among local and national authorities along with the population boom during the past three decades can further deteriorate the scarcity of the region. This would endanger food and water security in such a way that there would be an urgent need for costly water transfer projects to provide domestic water requirements only. Apart from the astronomical costs involved in these kinds of short-term, structural solutions, it would have serious environmental, social, and economic consequences. Necessary measures are needed to be taken to provide the food security of the region, purely from a sustainability point of view. Such measures may include reducing or even eliminating the cultivation of water-intensive crops (fiber crops, cereals, fruits and oilseeds), subsidizing the improvement of efficiency in irrigation, cooperating effectively in virtual water trade network with national or international water-abundant regions, reallocating limited water supplies to sectors with high value-added, employment compensation and less water-use intensity, better water pricing and posing strict restrictions on quantitative water consumption.
This is the first study that investigates the water-use intensity of different economic sectors within the economy of South Khorasan. Agricultural virtual water flows in the region is estimated in Qasemipour and Abbasi [29], but the regional IO tables are not able to estimate the intersectoral traded industrial commodities. For the virtual water flows in Iran to be mapped, multiregional IO tables are needed, which are now in preparation. Furthermore, additional uncertainties inherent in the input data and the estimation of IO tables, as well as water productivity of different kinds of crops are not considered in this study. These are issues that can be evaluated in future research.

Author Contributions

Conceptualization, E.Q., A.A. and F.T.; Data curation, E.Q.; Methodology, E.Q. and F.T.; Validation, A.A.; Writing—original draft, E.Q.; Writing—review & editing, A.A. and F.T. All authors have read and agreed to the published version of the manuscript.

Funding

This research received no external funding.

Acknowledgments

The authors appreciate the Agricultural Organization, the Regional Water Company of South Khorasan, and Maryam Talebi for their collaboration in data acquisition. We would also like to thank the editors and three anonymous reviewers for their constructive comments.

Conflicts of Interest

The authors declare no conflict of interest.

References

  1. Hoekstra, A.Y.; Mekonnen, M.M. The water footprint of humanity. Proc. Natl. Acad. Sci. USA 2012, 109, 3232–3237. [Google Scholar] [CrossRef] [Green Version]
  2. Mubako, S.; Lahiri, S.; Lant, C. Input-output analysis of virtual water transfers: Case study of California and Illinois. Ecol. Econ. 2013, 93, 230–238. [Google Scholar] [CrossRef]
  3. Chapagain, A.K.; Hoekstra, A.Y. Water footprint of nations. Volume 1: Main report. Value Water Res. Rep. Ser. 2004, 1, 1–80. [Google Scholar]
  4. Oki, T.; Kanae, S. Virtual water trade and world water resources. Water Sci. Technol. 2004, 49, 203–209. [Google Scholar] [CrossRef] [PubMed]
  5. Yang, H.; Wang, L.; Abbaspour, K.C.; Zehnder, A.J.B.B. Virtual water trade: An assessment of water use efficiency in the international food trade. Hydrol. Earth Syst. Sci. 2006, 10, 443–454. [Google Scholar] [CrossRef] [Green Version]
  6. Hoekstra, A.Y.; Chapagain, A.K. Water footprints of nations: Water use by people as a function of their consumption pattern. In Integrated Assessment of Water Resources and Global Change; Springer: Dordrecht, The Netherlands, 2007; pp. 35–48. [Google Scholar]
  7. Hoekstra, A.Y.; Hung, P.Q. Globalisation of water resources: International virtual water flows in relation to crop trade. Glob. Environ. Chang. 2005, 15, 45–56. [Google Scholar] [CrossRef]
  8. Feng, K.; Chapagain, A.; Suh, S.; Pfister, S.; Hubacek, K. Comparison of bottom-up and top-down approaches to calculating the water footprints of nations. Econ. Syst. Res. 2011, 23, 371–385. [Google Scholar] [CrossRef]
  9. Dietzenbacher, E.; Velázquez, E. Analysing Andalusian virtual water trade in an input—Output framework. Reg. Stud. 2007, 41, 185–196. [Google Scholar] [CrossRef] [Green Version]
  10. Dong, H.; Geng, Y.; Sarkis, J.; Fujita, T.; Okadera, T.; Xue, B. Regional water footprint evaluation in China: A case of Liaoning. Sci. Total Environ. 2013, 442, 215–224. [Google Scholar] [CrossRef]
  11. Zhang, H.; Ma, S.; Zhang, X.; Wang, Y. Analysis of Tianjin virtual water trade based on input-output model. In Proceedings of the 2010 International Conference on System Science and Engineering, Taipei, Taiwan, 1–3 July 2010; pp. 21–25. [Google Scholar]
  12. Zhang, Z.; Yang, H.; Shi, M. Analyses of water footprint of Beijing in an interregional input-output framework. Ecol. Econ. 2011, 70, 2494–2502. [Google Scholar] [CrossRef]
  13. Zhang, C.; Anadon, L.D. A multi-regional input-output analysis of domestic virtual water trade and provincial water footprint in China. Ecol. Econ. 2014, 100, 159–172. [Google Scholar] [CrossRef]
  14. Cazcarro, I.; Duarte, R.; Sánchez Chóliz, J. Multiregional input–output model for the evaluation of Spanish water flows. Environ. Sci. Technol. 2013, 47, 12275–12283. [Google Scholar] [CrossRef] [PubMed]
  15. Guo, S.; Shen, G.Q. Multiregional input-output model for china’s farm land and water use. Environ. Sci. Technol. 2015, 49, 403–414. [Google Scholar] [CrossRef] [PubMed]
  16. Lenzen, M.; Moran, D.; Bhaduri, A.; Kanemoto, K.; Bekchanov, M.; Geschke, A.; Foran, B. International trade of scarce water. Ecol. Econ. 2013, 94, 78–85. [Google Scholar] [CrossRef]
  17. Zhan-Ming, C.; Chen, G.Q. Virtual water accounting for the globalized world economy: National water footprint and international virtual water trade. Ecol. Indic. 2013, 28, 142–149. [Google Scholar]
  18. Yu, Y.; Hubacek, K.; Feng, K.; Guan, D. Assessing regional and global water footprints for the UK. Ecol. Econ. 2010, 69, 1140–1147. [Google Scholar] [CrossRef]
  19. White, D.J.; Hubacek, K.; Feng, K.; Sun, L.; Meng, B. The Water-Energy-Food Nexus in East Asia: A tele-connected value chain analysis using inter-regional input-output analysis. Appl. Energy 2018, 210, 550–567. [Google Scholar] [CrossRef] [Green Version]
  20. Ewing, B.R.; Hawkins, T.R.; Wiedmann, T.O.; Galli, A.; Ertug Ercin, A.; Weinzettel, J.; Steen-Olsen, K. Integrating ecological and water footprint accounting in a multi-regional input-output framework. Ecol. Indic. 2012, 23, 1–8. [Google Scholar] [CrossRef] [Green Version]
  21. Heckscher, E.F.; Ohlin, B.G. Heckscher-Ohlin Trade Theory; The MIT Press: Cambridge, MA, USA, 1991; ISBN 0262082012. [Google Scholar]
  22. Pfister, S.; Koehler, A.; Hellweg, S. Assessing the environmental impacts of freshwater consumption in LCA. Environ. Sci. Technol. 2009, 43, 4098–4104. [Google Scholar] [CrossRef] [Green Version]
  23. Guan, D.; Hubacek, K. Assessment of regional trade and virtual water flows in China. Ecol. Econ. 2007, 61, 159–170. [Google Scholar] [CrossRef] [Green Version]
  24. Kronenberg, T.; Többen, J. Regional Input-Output Modelling in Germany: The Case of North Rhine-Westphalia. MPRA Pap. 2011, 35494. [Google Scholar]
  25. Flegg, A.T.; Tohmo, T. Regional Input-Output Tables and the FLQ Formula: A Case Study of Finland. Reg. Stud. 2013, 47, 703–721. [Google Scholar] [CrossRef] [Green Version]
  26. Kronenberg, T. Construction of regional input-output tables using nonsurvey methods: The role of cross-hauling. Int. Reg. Sci. Rev. 2009, 32, 40–64. [Google Scholar] [CrossRef]
  27. Flegg, A.T.; Huang, Y.; Tohmo, T. Cross-Hauling and Regional Input-Output Tables: The Case of the Province of Hubei, China. Econ. Syst. Res. 2015, 27, 391–413. [Google Scholar] [CrossRef]
  28. Szabó, N. Methods for regionalizing input-output tables. Reg. Stat. 2015, 5, 44–65. [Google Scholar] [CrossRef]
  29. Qasemipour, E.; Abbasi, A. Virtual Water Flow and Water Footprint Assessment of an Arid Region: A Case Study of South Khorasan Province, Iran. Water 2019, 11, 1755. [Google Scholar] [CrossRef] [Green Version]
  30. Statistical Center of Iran. Available online: https://www.amar.org.ir/english (accessed on 31 July 2019).
  31. Miller, R.E.; Blair, P.D. Input-Output Analisys: Foundations and Extensions; Cambridge University Press: Cambridge, UK, 2009; Volume 1, ISBN 9788578110796. [Google Scholar]
  32. Flegg, A.T.; Webber, C.D.; Elliott, M.V. On the Appropriate Use of Location Quotients in Generating Regional Input–Output Tables. Reg. Stud. 1995, 29, 547–561. [Google Scholar] [CrossRef]
  33. Allan, J.A. Fortunately there are substitutes for water otherwise our hydro-political futures would be impossible. Priorities Water Resour. Alloc. Manag. 1993, 13, 26. [Google Scholar]
  34. Allan, J.A. Virtual water: A strategic resource global solutions to regional deficits. Ground Water 1998, 36, 545–546. [Google Scholar] [CrossRef]
  35. Food and Agriculture Organization of the United Nations. Available online: http://www.fao.org/land-water/en/ (accessed on 20 November 2019).
  36. UNSD—Statistical Classifications. Available online: https://unstats.un.org/unsd/classifications/ (accessed on 3 June 2019).
  37. Chapagain, A.K.; Hoekstra, A.Y.; Savenije, H.H.G.; Gautam, R. The water footprint of cotton consumption: An assessment of the impact of worldwide consumption of cotton products on the water resources in the cotton producing countries. Ecol. Econ. 2006, 60, 186–203. [Google Scholar] [CrossRef]
  38. Chapagain, A.K.; Hoekstra, A.Y. The water footprint of coffee and tea consumption in the Netherlands. Ecol. Econ. 2007, 64, 109–118. [Google Scholar] [CrossRef]
  39. Qasemipour, E.; Abbasi, A. Assessment of Agricultural Water Resources Sustainability in Arid Regions Using Virtual Water Concept: Case of South Khorasan Province, Iran. Water 2019, 11, 449. [Google Scholar] [CrossRef] [Green Version]
  40. Oweis, T.Y.; Hachum, A.Y. Improving water productivity in the dry areas of West Asia and North Africa. Water Product. Agric. Limits Oppor. Improv. 2003, 1, 179–198. [Google Scholar]
  41. Molden, D.; Oweis, T.Y.; Pasquale, S.; Kijne, J.W.; Hanjra, M.A.; Bindraban, P.S.; Bouman, B.A.M.; Cook, S.; Erenstein, O.; Farahani, H. Pathways for Increasing Agricultural Water Productivity; International Irrigation Management Institute: Colombo, Sri Lanka, 2007. [Google Scholar]
  42. Molden, D.; Oweis, T.; Steduto, P.; Bindraban, P.; Hanjra, M.A.; Kijne, J. Improving agricultural water productivity: Between optimism and caution. Agric. Water Manag. 2010, 97, 528–535. [Google Scholar] [CrossRef]
  43. Madani, K.; AghaKouchak, A.; Mirchi, A. Iran’s Socio-economic Drought: Challenges of a Water-Bankrupt Nation. Iran. Stud. 2016, 49, 997–1016. [Google Scholar] [CrossRef]
  44. Playán, E.; Mateos, L. Modernization and optimization of irrigation systems to increase water productivity. Agric. Water Manag. 2006, 80, 100–116. [Google Scholar] [CrossRef] [Green Version]
  45. Liu, J.; Sun, S.; Wu, P.; Wang, Y.; Zhao, X. Inter-county virtual water flows of the Hetao irrigation district, China: A new perspective for water scarcity. J. Arid Environ. 2015, 119, 31–40. [Google Scholar] [CrossRef]
  46. Garrido, A.; Llamas, M.R.; Varela-Ortega, C.; Novo, P.; Rodríguez-Casado, R.; Aldaya, M.M. Water Footprint and Virtual Water Trade in Spain; Springer-Verlag: New York, NY, USA, 2010. [Google Scholar]
  47. Karandish, F.; Hoekstra, A.Y. Informing national food and water security policy through water footprint assessment: The case of Iran. Water 2017, 9, 831. [Google Scholar] [CrossRef] [Green Version]
  48. Sivapalan, M.; Konar, M.; Srinivasan, V.; Chhatre, A.; Wutich, A.; Scott, C.A.; Wescoat, J.L.; Rodríguez-Iturbe, I. Socio-hydrology: Use-inspired water sustainability science for the Anthropocene. Earth’s Futur. 2014, 2, 225–230. [Google Scholar] [CrossRef] [Green Version]
Figure 1. Map of the study area.
Sustainability 12 00818 g001
Figure 2. (a) Comparison between agricultural water footprint and total water footprint, and (b) the contribution of each economic sector in water use and value-added.
Sustainability 12 00818 g002
Table 1. Technical coefficients (direct) and total requirement (direct + indirect) matrices (in parenthesis).
SectorsAgricultureIndustryAquacultureConstructionBusiness and FinanceEducationPublic AdministrationDomestic
Agriculture0.34 (1.54)0.13 (0.27)0.03 (0.13)0.02 (0.25)0.01 (0.09)0.00 (0.03)0.16 (0.58)0.01 (0.17)
Industry0.02 (0.07)0.18 (1.32)0.12 (0.3)0.35 (0.96)0.21 (0.34)0.00 (0.09)0.08 (0.45)0.05 (0.32)
Aquaculture0.00 (0.00)0.00 (0.00)0.22 (1.27)0.00 (0.00)0.00 (0.00)0.00 (0.00)0.00 (0.00)0.00 (0.00)
Construction0.01 (0.02)0.00 (0.02)0.00 (0.06)0.45 (1.86)0.01 (0.03)0.06 (0.14)0.03 (0.18)0.13 (0.35)
Business and Finance0.03 (0.07)0.22 (0.37)0.14 (0.33)0.18 (0.68)0.16 (1.29)0.03 (0.10)0.19 (0.65)0.02 (0.27)
Education0.00 (0.01)0.00 (0.00)0.24 (0.37)0.00 (0.02)0.00 (0.00)0.12 (1.13)0.12 (0.29)0.31 (0.44)
Public Administration0.00 (0.00)0.00 (0.00)0.00 (0.01)0.00 (0.01)0.00 (0.00)0.00 (0.00)0.49 (1.98)0.12 (0.27)
Domestic0.01 (0.01)0.00 (0.00)0.03 (0.04)0.02 (0.00)0.00 (0.00)0.00 (0.01)0.00 (0.02)0.11 (1.14)
Total0.40 (1.72)0.53 (1.98)0.78 (2.52)1.02 (3.82)0.40 (1.77)0.22 (1.50)1.09 (4.16)0.76 (2.96)
Table 2. International Standard Industrial Classification (ISIC) used in IO aggregation of this study [36].
ISIC CodeDescriptionSector Name in This Study
01–02Crop and animal production, hunting and related service activities: comprising the activities of growing of crops, raising and breeding of animals, and other plants, animals or animal products from a farm or their natural habitats. Fostery and logging: the production of roundwood for the forest-based manufacturing industries as well as the extraction and gathering of wild growing non-wood forest productsAgriculture
03Fishing and aquaculture: includes capture fishery and aquaculture, covering the use of fishery resources from marine, brackish or freshwater environments, with the goal of capturing or gathering fish, crustaceans, mollusks and other marine organisms and productsAquaculture
10–33Manufacturing: food products, beverages, tobacco products, textiles, wearing apparel, leather and related products, products of wood, cork, straw and plaiting materials, paper and paper products, printing and reproduction of recorded media, coke and refined petroleum products, chemicals and chemical products, basic pharmaceutical products and pharmaceutical preparations, rubber and plastics products, other non-metallic mineral products, basic metals, fabricated metal products, computer, electronic and optical products, electrical equipment, machinery and equipment n.e.c., motor vehicles, trailers and semi-trailers, other transport equipment, furniture, other manufacturing, repair and installation of machinery and equipmentIndustry
41Construction of buildings: includes general construction of buildings of all kinds. It includes new work, repair, additions and alterations, the erection of pre-fabricated buildings or structures on the site and also construction of temporary natureConstruction
45–47, 55–56Wholesale and retail trade and repair of motor vehicles and motorcycles: includes all activities related to motor vehicles and motorcycles. Wholesale trade: includes wholesale trade on own account or on a fee or contract basis related to domestic wholesale trade as well as international wholesale trade. Accommodation: includes the provision of short-stay accommodation for visitors and other travelers. Food and beverage service activities: includes providing complete meals or drinks fit for immediate consumptionBusiness and Finance
84Public administration and defence; compulsory social securityPublic Administration
85Pre-primary and primary education, secondary education, higher education, other education, educational support activitiesEducation
97–98Activities of households as employers of domestic personnel, Undifferentiated goods- and services-producing activities of private households for own use: includes the undifferentiated subsistence goods-producing and services-producing activities of householdsDomestic
Table 3. Water use in different sectors in South Khorasan.
SectorsValue-Added (106$/year) Direct   Water   Consumption   Coefficient   ω i   ( m 3 / 10 3 $ ) Total Water Consumption (Mm3/year) Final   Sec toral   Water   Multiplier   i ω i l ij   ( m 3 / 10 3 $ )
Agriculture4901333.441151.822056.23
Industry15952.9030.12426.77
Aquaculture8864.4211.031302.48
Construction1840.450.20388.76
Business and Finance4210.940.46145.62
Education1733.250.6645.29
Public Administration3560.620.15811.03
Domestic46112.337.73370.25
Total--1202.17-
Table 4. Water-use reduction due to a 10% improvement in water productivity (1st strategy).
CountiesIrrigated Area (ha/year)Water Use a (Mm3/year)Water-Saving (Mm3/year)WTA b (Percent Reduction)
Birjand230625.682.5091.84 (8.94)
Boshrooye16949204.3320.27582.45 (57.79)
Darmian269235.004.3183.32 (10.44)
Ferdows8106124.6012.33369.50 (36.56)
Khusf410959.185.8649.27 (4.88)
Nehbandan6167105.5210.4971.05 (7.06)
Qaen11699180.4417.65289.05 (28.28)
Sarayan8176145.4114.41355.08 (35.19)
Sarbishe5729101.6610.00177.56 (17.46)
Tabas510877.617.7324.74 (2.46)
Zirkuh422397.849.69172.77 (17.10)
Total752641157.28115.23206.06 (20.56) c
a The volume of water used in crop production is calculated by multiplying the virtual water content (m3/ton) of each crop with the physical unit (ton) of crops produced (this is very similar to the amount of water estimated using Input–Output model in Table 3). b Withdrawal-to-Availability ratio (in percent) before the improvement in water productivity. Withdrawal here refers to the amount of water used in crop production only. c This cell is the average of the entire counties, not the aggregation.
Table 5. Water withdrawal by each crop and their water-saving contribution in First Strategy.
Crop TypesIrrigated Area (ha/year)Water ConsumptionWater-Saving
Mm3/year%Mm3/year%
Cereals45,242581.7050.2626.3022.82
Legumes3362.650.230.120.10
Fiber crops10,332170.6714.757.756.73
Vegetables454850.424.362.291.99
Fruits14,338347.4130.0278.5668.18
Oilseeds4694.440.380.200.17
Total75,2641157.28100115.23100
Table 6. Water-saving associated with a 10% decrease in final demand (Second Strategy).
SectorsNew Final Demand (103$/year)Total Water Consumption (Mm3/year)Water-SavingValue-Added Reduction
Mm3/year (%)Million Rials (%)
Agriculture397,2851036.6465.30 (99.70)23.82 (91.20)
Industry156,15927.110.13 (0.20)0.00 (0.00)
Aquaculture81379.930.00 (0.00)0.25 (0.95)
Construction177,2970.180.04 (0.06)0.65 (2.49)
Business and Finance112,3880.420.01 (0.02)0.69 (2.65)
Education108,8210.590.00 (0.00)0.68 (2.62)
Public Administration100,7860.130.01 (0.02)0.00 (0.01)
Domestic42,7956.960.00 (0.00)0.02 (0.09)
Total-1081.9665.49 (100)26.12 (100)
Table 7. Water-saving associated with applying proper cropping pattern (Third Strategy).
Crop TypeCrop Production (ton/year)Water Productivity (kg/m3)Water Saving a
MinimumMaximumMm3/yearContribution(%)
Cereals164,4010.1960.383118.8334.10
Legumes3270.0490.1522.300.66
Fiber crops56,1370.1070.860131.2437.66
Vegetables107,3760.6552.23749.4714.20
Fruits31,3230.1610.26938.4411.03
Oilseeds3880.0490.4678.182.35
Total359,952--348.46100
a In case of transferring production from counties with lower water productivity to counties with higher water productivity.

