Article

Heterogeneity in Ecosystem Service Values: Linking Public Perceptions and Environmental Policies

1
Department of Animal & Plant Sciences, The University of Sheffield, Western Bank, Sheffield S10 2TN, UK
2
School of Ecological and Environmental Sciences, East China Normal University, Shanghai 200241, China
3
Safety and Environmental Assurance Centre, Unilever Colworth, Sharnbrook, Bedford MK44 1ET, UK
*
Author to whom correspondence should be addressed.
Present address: Department of Geography, University of Cambridge Conservation Research Institute, The David Attenborough Building, Pembroke Street, Cambridge CB2 3QZ, UK.
Present address: 6 Prestwick Road, Great Denham, Bedford MK40 4FH, UK.
Sustainability 2020, 12(3), 1217; https://doi.org/10.3390/su12031217
Submission received: 16 January 2020 / Revised: 4 February 2020 / Accepted: 6 February 2020 / Published: 7 February 2020
(This article belongs to the Section Social Ecology and Sustainability)

Abstract

:
One way of linking research and environmental policies is to increase public participation and identify ecosystem services valued by society, but the reasons influencing ecosystem values can vary. Our study investigates the reasons influencing ecosystem service values at the third largest freshwater lake in China, Lake Tai (Taihu). We interviewed 257 rural and 257 urban respondents in four cities and their respective rural regions surrounding the lake. Respondents were more willing to pay to protect a provisioning ecosystem service than a cultural ecosystem service, and those emotionally attached to the lake may value it more highly. There is also spatial heterogeneity in respondents’ ecosystem values. Rural communities ranked directly used ecosystem services higher than urban communities. The city that respondents lived in also significantly affected the amount they were willing to pay for ecosystem services. Identifying potential reasons behind ecosystem service values can provide insights into linking public perception and policy making, helping to form environmental policies that reflect societal values.

1. Introduction

Freshwater ecosystems provide many vital benefits to human well-being that are known as ecosystem services [1,2]. These include freshwater provision for drinking and irrigation; food provision through fisheries; and recreational activities such as angling and swimming. The five largest lakes in the world account for more than half of the globe’s surface freshwater, which is an irreplaceable ecosystem service [3]. Nevertheless, freshwater lakes in developing countries are under severe threats due to land-use changes, pollution, overfishing and invasive species [4]. For example, Lake Tai (Taihu) is the third largest Chinese freshwater lake and is an important source of drinking water for several mega-cities, including Shanghai. Nevertheless, the Taihu basin is one of the most industrialized and urbanized regions in China [5]. As a result, increased pollution has resulted in lake water quality deterioration and frequent toxic algal blooms. The issues faced by Lake Tai are common and comparable to other severely threatened lakes around the world, which is a serious global threat to the livelihoods of human society.
Improved environmental policies will better protect and restore vulnerable freshwater ecosystems. They should incorporate increased public participation from stakeholders [6]. This ensures policies are more in line with societal values, and thus have more societal support. Decision makers who do not fully comprehend the reasons behind ecosystem values may form ineffective environment policies [7]. Understanding the ecosystem values of the public can help to avoid future conflicts and mistakes [8,9].
Investigating public perceptions can identify how ecosystem services are valued, as well as the reasons behind ecosystem values. One popular method is contingent valuation, which is used for measuring non-market value goods in environmental studies. The method asks respondents directly for their willingness to pay (WTP) for non-market value goods using a hypothetical market [10]. Face-to-face contingent valuation studies have higher response rates and they can target communities that may be difficult to obtain information from using online or phone interviews. For example, rural populations in developing countries can be illiterate or have no access to phones. Although there have been debates over the effectiveness of contingent valuation, new research indicates that studies conducted with “good practice” protocols (e.g., appropriate questionnaire design; suitable payment vehicle; detailed descriptions of the services) can be reliable for investigating the value that respondents place on environmental goods [11]. We followed such protocols for effective study design.
There is less use of contingent valuation in developing countries, such as in China, due to cultural differences and different governance structures [12]. As of January 2020, a search for the term “contingent valuation” from China only returned 381 papers on the database Scopus. This is compared to 697 papers from the UK and 1719 papers from the United States. This is because incorporating public perceptions into Chinese environmental decision making has only been promoted recently, with the new term “ecological civilization” now gaining popularity [13]. Ecological civilization suggests a socio-cultural element to ecology and emphasizes the importance of linking humans and nature. There is now an increased need for Chinese ecosystem service valuation studies that investigate the public’s ecosystem values, which is valuable for setting out environmental policies that also reflect societal values.
When evaluating public perceptions, we must also understand the identity of stakeholders benefitting from ecosystem services [14]. Ecosystem values are likely to be heterogenous across sectors of society due to many factors. For example, a previous study by the authors revealed that rural residents interacted more frequently with their local river and valued it more highly than urban residents in the same geographical region [15]. Other studies have also demonstrated that urban communities have less interactions with nature, which can affect their willingness to protect nature [16,17,18]. Women are more likely to conduct pro-environmental behaviours (e.g., reducing water usage) than men, especially older women compared to older men [19]. It has also been suggested that higher levels of education are linked to pro-environmental attitudes [20]. Previous research show that a range of factors can influence ecosystem values, which is important to take into account.
Our study contributes to the wider body of research on the influence of socio-cultural factors on ecosystem service values, and that values are likely to be heterogenous across society. There is still a knowledge gap regarding the social dimensions of ecosystem services, especially the perceptions of local communities [7]. Understanding public perceptions can help to improve environmental policy making. To our knowledge, there are relatively few papers that incorporate a socio-cultural element into investigating freshwater ecosystem services in China. Most publications focus on land-use changes around freshwater ecosystems or water quality changes. Our study interviewed local communities that can be directly affected by changes to a large freshwater ecosystem, investigating the socio-cultural reasons behind ecosystem values using contingent valuation. Willingness to pay can provide insight into ecosystem values, but we acknowledge that contingent valuation methods are not the only way to ascertain values and have their drawbacks. It is easier for contingent valuation to assess instrumental values, compared to nature’s intrinsic value (i.e., the value nature has in itself) [21]. Furthermore, there is now a move beyond instrumental and intrinsic values to include relational values. This encompasses the connection between humans and nature [22].
We conducted face-to-face interviews with rural and urban communities associated with the four major cities surrounding Lake Tai. Our aim is to understand: (1) which freshwater ecosystem services are prioritized by local communities as of high importance to themselves; (2) what are the key factors influencing their willingness to pay for ecosystem services; and (3) whether there is heterogeneity in societal ecosystem values, such as between different city regions or between rural and urban communities.

2. Materials and Methods

2.1. Study Area

Lake Tai is the third largest freshwater lake in China, with a total surface area of 2250 km2. It is situated in Jiangsu province in Eastern China and is surrounded by four cities: Huzhou, Suzhou, Wuxi and Yixing. In addition, there are many surrounding rural villages. The lake is shallow, with a mean depth of 2 m and sits within the Taihu basin, which has a total area of 36,500 km2 [23]. The Taihu basin is one of the wealthiest regions in China, providing 12.5% of the gross national product whilst only occupying 0.4% of the national land area [24]. Lake Tai produces many important ecosystem services to the surrounding communities. Nevertheless, it suffers from multiple anthropogenic stressors that include rapid urbanization, land-use changes, increased agriculture and aquaculture that have led to severe water pollution.
Lake Tai is the major source of drinking water for the Yangtze River delta region [25] and the Taihu basin is important for agriculture and aquaculture [26]. The water quality of Lake Tai has deteriorated steadily since the 1980s, which is when rapid urbanization and wetland reclamation first started around the lake [27]. It is now one of the most polluted freshwater lakes in China, suffering from frequent outbreaks of algal blooms [27]. In 2007, a severe bloom of toxic algae resulted in water intakes being closed and millions of people in Wuxi having no access to clean tap water for five days. Local communities were forced to rely on bottled water, resulting in shortages and price increases in local bottled water. This serious eutrophication event led to large economic losses, which included the price of providing bottled water to communities and removing decomposing algae from the lake [27]. Therefore, Lake Tai makes an ideal case study to investigate large-scale spatial variation in public perceptions for a single ecosystem.

2.2. Questionnaire Survey

We conducted five hundred and fourteen face-to-face interviews using six interviewers in June 2015. The study was formally approved by the Department of Animal and Plant Sciences Ethics Committee at the University of Sheffield, UK. The questionnaire was developed in English (see Appendix) and then translated into Chinese.
After reviewing the literature for valuing freshwater ecosystem services and environmental contingent valuation studies in China, we developed a draft questionnaire. The first author has previously conducted a contingent valuation study on freshwater ecosystem services in China, and one of the co-authors (a professor at China East Normal University) has experience conducting ecosystem service valuations in the region. We obtained feedback on the questionnaire from Chinese research students who have conducted similar studies and modified the draft questionnaire. We conducted a pilot study using 50 respondents to identify any potential issues and whether all questions could be easily understood.
Interviewers consisted of four female and two male students (approximately 23 years old) from China East Normal University, who are native speakers of Mandarin Chinese and experienced in conducting ecosystem service valuation questionnaires in China. We conducted interviews over ten days, both in the mornings and afternoons, to account for any potential temporal variations.
Interviews were conducted across the four major cities surrounding Lake Tai (Suzhou, Wuxi, Yixing and Huzhou), and their bordering rural villages (10–30 km from city). At each city region, half of the respondents were from rural villages and the other half from urban areas. There was a total of 10 rural villages and 10 urban sites; and a minimum of 25 interviews were conducted at each site.
All study sites were randomly chosen using maps from the Chinese search engine, Baidu. Suzhou and Wuxi are larger cities than Huzhou and Yixing and therefore, more interviews were conducted at Suzhou and Wuxi. Rural villages within walking distance to Lake Tai were selected. In rural villages, respondents were contacted opportunistically in the communal village square. The interviewer approached every third person they encountered, whilst balancing between male and female respondents.
Based on prior knowledge of conducting questionnaires in the region, urban sites consisted of local parks that were frequented by the older community and local shopping malls that were frequented by the younger community. This ensured an even spread of ages in the urban respondents. The interviewer approached every third person that they encountered. Both female and male respondents were approached in equal proportions. The spatial distribution of study sites is shown in Figure 1.
All respondents were interviewed directly on a one-to-one basis in an informal manner. There were no refusals in rural villages, but refusal rates were higher at urban sites. They were interviewed individually to avoid the influence of others on the response. We obtained verbal consent and all respondents were assured of their anonymity. The questionnaire was composed of four sections:
(i)
Background demographic questions;
(ii)
Respondent’s interactions with and their attitudes towards Lake Tai;
(iii)
Respondent’s prioritisation and willingness to pay for ecosystem services;
(iv)
Respondent’s knowledge and attitudes towards environmental protection.
Section (ii) explores how frequently the respondent interacted with the lake and which freshwater ecosystem services they used. In section (iii), respondents were asked to rank six ecosystem services in order of importance to themselves. The six services were: food provision, freshwater provision, flood regulation, recreation, microclimate regulation and cultural heritage. We selected the ecosystem services based on the literature and previous knowledge of the study region. To avoid bias towards the first option, the services were read out in a randomized order for each interview.
The term “ecosystem services” was not mentioned in the interview as the public is unfamiliar with the term. Instead we described the ecosystem services in simple language, that would be accessible to rural and urban respondents. See below for ecosystem service descriptions:
  • Food provision: Lake Tai gives us food to eat (e.g., fish, crabs and prawns);
  • Freshwater provision: Lake Tai gives us freshwater for drinking;
  • Recreation: I use Lake Tai for leisure activities (e.g., fishing, walking by the lakeside);
  • Cultural heritage: Lake Tai is an important cultural site of important (e.g., Buddhist temples, historical sites);
  • Flood regulation: Lake Tai helps to control floods (e.g., prevents crop fields from getting flooded);
  • Microclimate regulation: Lake Tai provides cooling effects by the lakeside in the summer.
We used two hypothetical questions to investigate the respondent’s willingness to pay (WTP) for freshwater ecosystem services. The first question asked whether respondents would be willing to donate money towards a project to protect and improve the ecosystem service that they prioritized as the most important, which would be overseen by the Ministry of Environmental Protection (MEP). The MEP is a state council department, with considerable authority in environmental affairs. We used donation as the payment vehicle rather than the commonly used tax payment because a previous study in China found that this elicited less protest responses.
The second question asked whether respondents would be willing to donate money to a five-year project to improve the overall environmental quality of Lake Tai, which would be overseen by the Ministry of Environmental Protection (MEP). We further explained that this hypothetical project will result in: (i) improved water quality (i.e., less pollution and a lake that did not smell); (ii) more wildlife (animals and plants) in and around the lake.
Respondents that were willing to donate money were then asked what percentage of their annual income they were willing to donate towards the two hypothetical projects using a payment card method, where they could choose from six options: <1%, 1%, 5%, 10%, 20% and 30%. The percentages were decided based on the pilot study, as well as previous research suggesting that an optimal range of prices should consist of a high price that is rejected by most respondents (i.e., 30% of annual income) and a low price (i.e., <1% of annual income) that is widely accepted [28].
We asked for a percentage value of annual income because this study is not concerned with calculating an exact monetary value. Due to respondents having varying incomes, a relative measure of monetary value is more suitable than an absolute measure. Respondents were reminded of their budgetary constraints during the question. After the hypothetical questions, respondents were asked about the reasons for their answers and their confidence in their answers. These questions investigated whether the respondent had understood the hypothetical questions and aimed to improve the study quality.
Finally, section (vi) provides insight into the respondent’s environmental awareness of how anthropogenic activities may impact on the environmental quality and hence the delivery of ecosystem services.

2.3. Data Analysis

All statistical analyses were carried out in the open source statistical program, R 3.0.2 [29]. Chi-squared tests or Fisher’s exact tests were conducted on demographic variables. Using the factominer package [30], a multiple correspondence analysis (MCA) was performed to detect which factors in the questionnaire were associated with each other. The results were plotted graphically to display associations between variables. MCA is commonly used for the exploration of questionnaire data with large numbers of nominal categorical variables, revealing patterns in complex datasets [31]. Categorial variables that are more similar in distribution are plotted closer to each other on MCA plots.
As MCA is an exploratory technique, the data were further analysed in a two-step process. For the first step, we investigated the factors that influence the respondent’s willingness to pay to protect and improve their prioritized (i.e., most important) ecosystem service. A generalised linear model (GLM) with a binomial family error was used because the dependent variable (willing to pay or not) is dichotomous.
The maximal GLM model used to predict whether respondents were willing to pay or not was fitted first, which included the following predictors: place of inhabitance (rural or urban), city region they live in, prioritized (i.e., most important) ecosystem service, did the respondent visit the lake, whether the respondent fished in the lake, would the respondent miss the lake if it disappears, environmental knowledge, age, education level, gender, and annual income. The predictors were chosen based on the MCA results and expert knowledge. The dredge function from the MuMIN package was used to find the minimally adequate model using the Akaike’s information criterion (AIC) value, with a lower AIC value being selected.
For the second step, we only analysed data from respondents that were willing to pay. We investigated the factors that influenced the respondent’s willingness to pay amount (i.e., the % of annual income). As the dependent variable (i.e., % of annual income) is categorical but ordered, we used an ordinal logistic regression model available in the MASS package [32]. We investigated the following variables for their potential influence on the willingness to pay amount: city region respondent live in, place of inhabitance (rural or urban), prioritized (i.e., most important) ecosystem service, did the respondent visit the lake, whether the respondent fished in the lake, would the respondent miss the lake if it disappears, environmental knowledge, age, education level, gender, and annual income. The minimally adequate model was selected based on lower AIC values.

3. Results

3.1. Demographic Information

The education level of the 514 respondents ranged from lower secondary education to masters degree (Figure 2). Urban respondents had significantly higher education levels than rural respondents, with more urban respondents having a bachelor’s degree (Fisher’s exact test, p < 0.05).

3.2. Willingness to Pay for Ecosystem Services

Respondents were asked whether they were willing to pay to protect and improve their prioritised ecosystem service (WPT1) and whether they were willing to pay to improve the overall environmental quality of Lake Tai (WTP2). Using multiple correspondence analysis (MCA), we explored the relationship between different variables in the data. Figure 3 depicts the top fifteen variables in the questionnaire that contribute the most to the explained variances. The first two dimensions explained 46% of the variances in the data. Dimension 1 is categorised by WTP 1, WTP 2, the respondent’s prioritised (i.e., most important) ecosystem service and whether respondents will miss the lake if it disappears. Dimension 2 is categorised by whether the respondent fished in the lake, whether the respondents live in a rural or urban community and their prioritised (i.e., most important) ecosystem service.
Respondents that prioritised freshwater provision as the most important service and said that they will miss the lake if it disappears were more willing to pay to protect and improve their prioritised service (WTP1) and to improve the overall environmental quality of Lake Tai (WTP 2). In contrast, respondents that prioritised recreation as the most important service and said that they will not miss the lake if it disappears were less willing to pay for WTP1 and WTP2. Respondents that fished in the lake were more likely to live in a rural community and prioritise food provision and flood regulation as the most important services. Urban respondents were less likely to fish and more likely to prioritise cultural heritage as the most important.
Overall, more respondents were willing to pay to protect and improve their prioritized (i.e., most important) ecosystem service (i.e., 361 willing to pay) compared to the number willing to pay to improve the overall environmental quality of Lake Tai (i.e., 291 willing to pay). Respondents that were willing to pay to protect and improve their prioritized services were significantly more willing to pay to improve the overall environmental quality of Lake Tai (Chi-squared = 165.64, df = 1, p < 0.05).
The minimally adequate generalised linear model (GLM) for willingness to pay or not to protect and improve their prioritized ecosystem service only retained three variables out of a total of eleven variables in the maximal model. Namely, which ecosystem service the respondent prioritized as the most important, whether they will miss the lake if it disappears and the age of the respondent (Table 1). Only two variables significantly affected whether respondents were willing to pay or not. Respondents that said they will miss the lake if it disappears were significantly more willing to pay. In addition, older respondents were significantly less likely to pay.
The ordinal logistic model used to investigate the factors influencing willingness to pay amounts (i.e., as a % of annual income) indicated that older respondents were significantly more likely to pay a lower percentage of their annual income compared to younger respondents. In addition, respondents living in Suzhou were significantly more likely to pay a higher percentage of their annual income compared to other cities (Table 2). Most respondents were willing to pay 1% of their annual income to protect and improve ecosystem services (Figure 4).

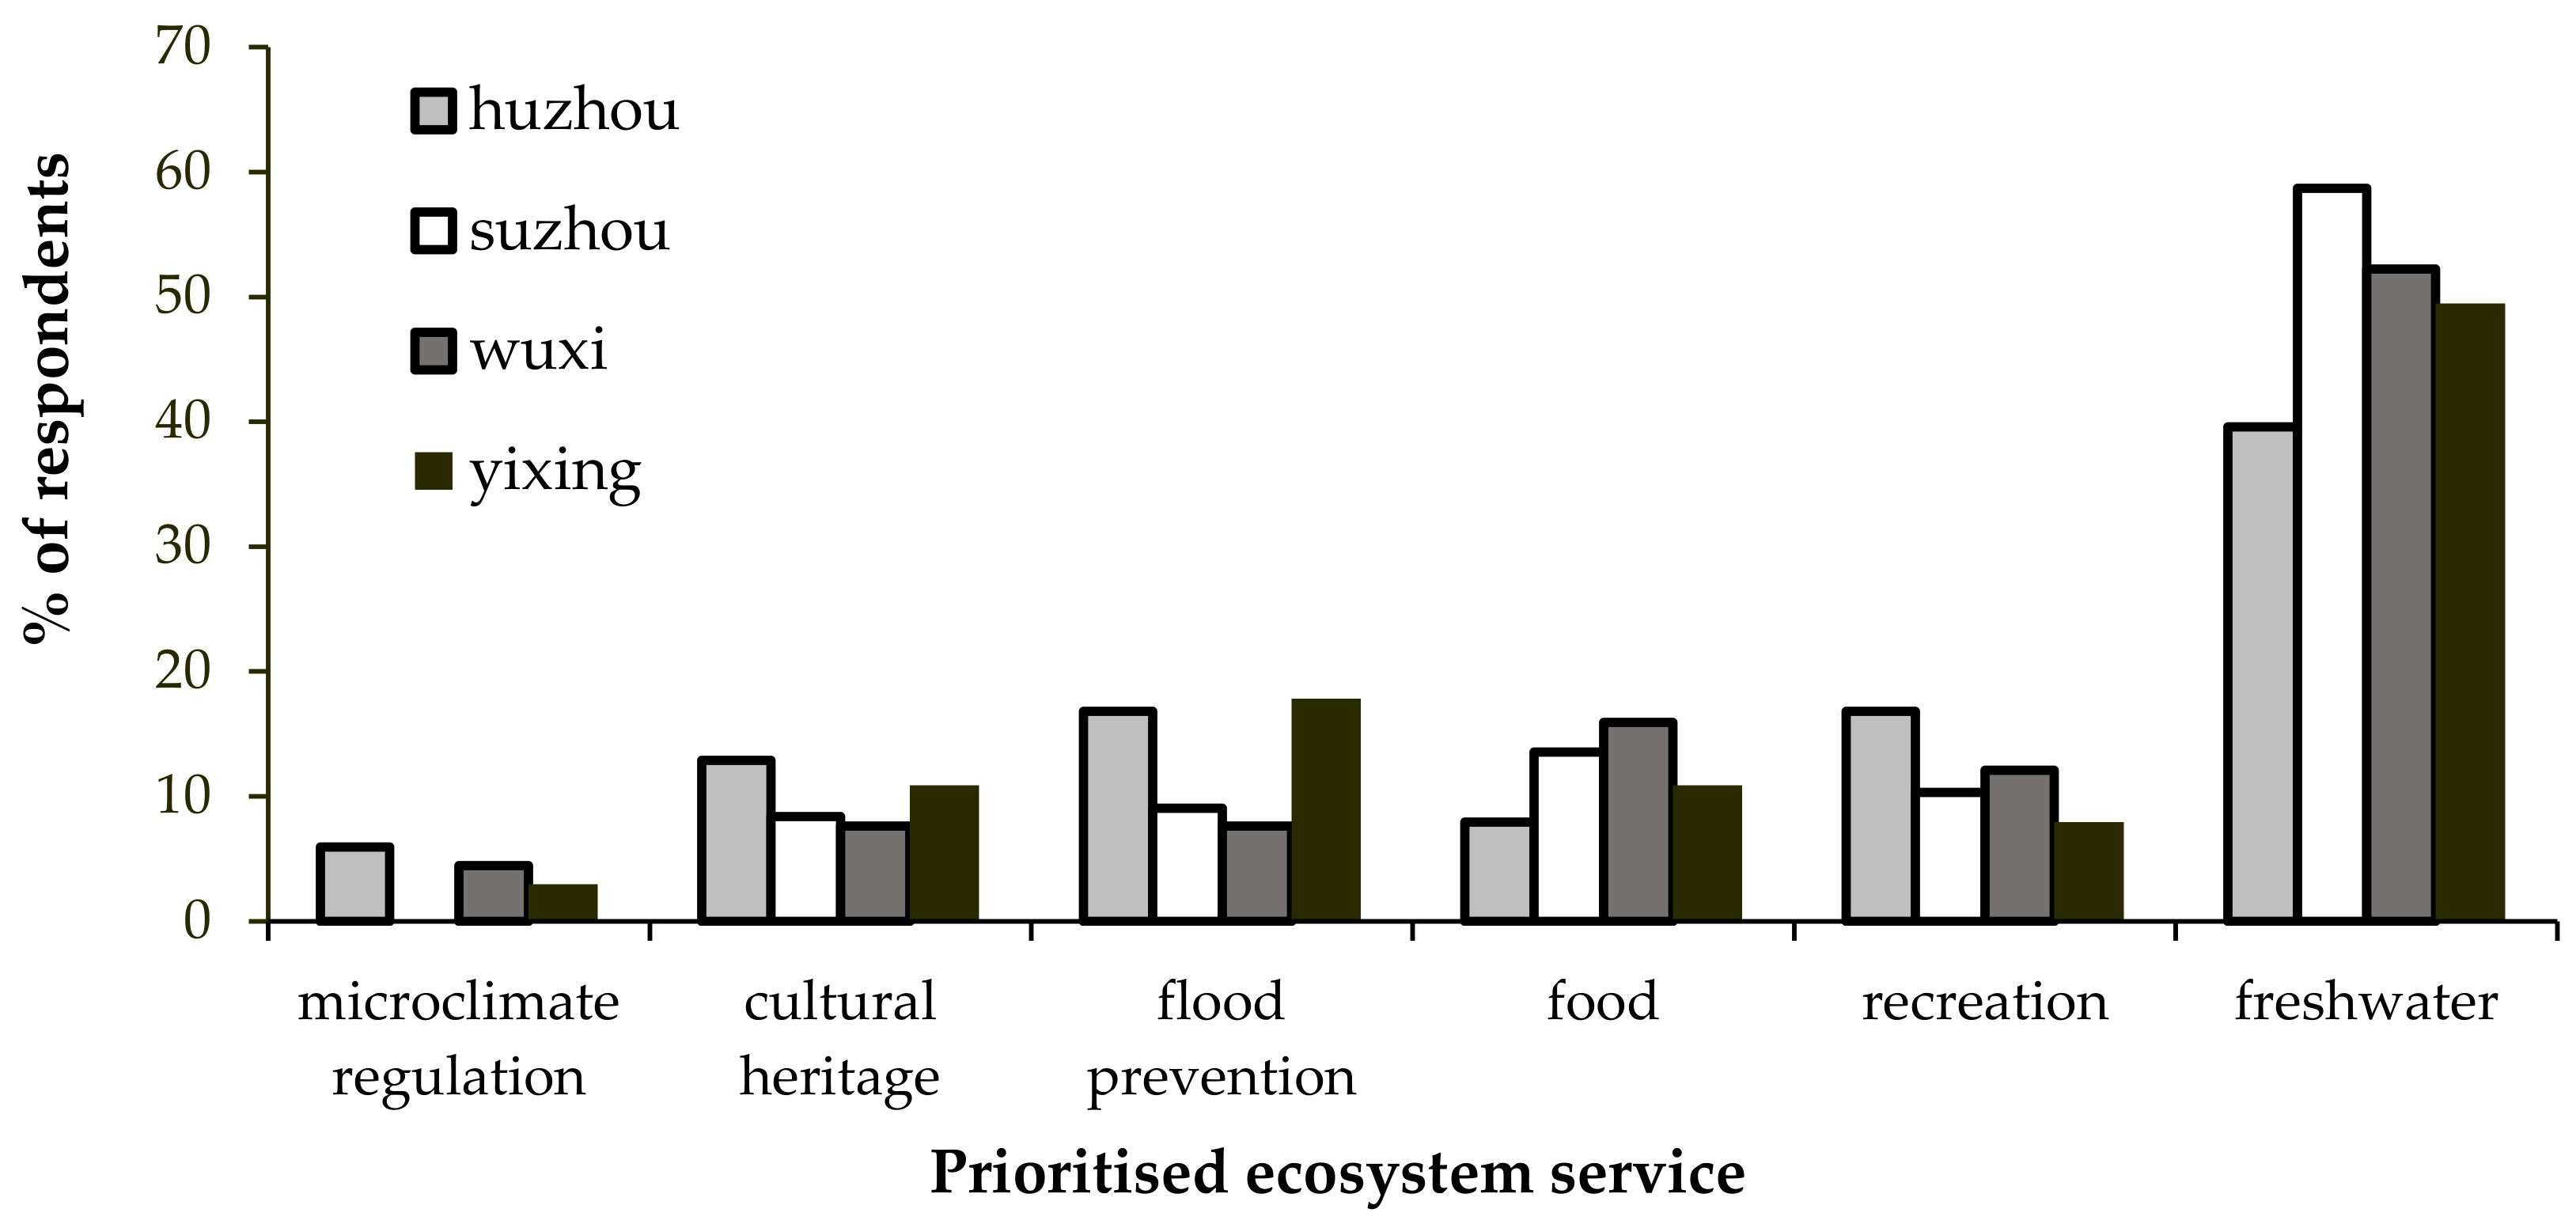
3.3. Use and Prioritized Ecosystem Services

In total, 89% of respondents have visited Lake Tai in the past. Between different city regions, the highest proportion of respondents that have visited the lake lived in Huzhou (96%). This was followed by Wuxi (92%), Yixing (87%) and Suzhou (82%). Fifty-five respondents fished in Lake Tai and most respondents that fished were either from Suzhou (40%) or from Wuxi (47%).
Most respondents prioritized freshwater provision as the most important ecosystem service to themselves (Figure 3). There were differences between the four cites for the other ecosystem services, but this was statistically insignificant. More respondents in Huzhou and Yixing prioritized flood prevention as the most important compared to respondents in Suzhou and Wuxi. In contrast, more respondents in Suzhou and Wuxi prioritized food provision as the most important than in Huzhou and Yixing (Figure 5).
Overall, 91% of rural respondents and 87% of urban respondents have visited the lake. Rural respondents lived significantly closer to (Chi-squared = 389.07, df = 8, p < 0.05) and visited Lake Tai more frequently (Chi-squared = 170.28, df = 5, p < 0.05) than urban respondents. In total, 40% of rural respondents visited the lake daily, whereas only 2% of urban respondents did. This may be because 80% of urban respondents lived more than 60 minutes walking distance to the lake.
A significantly higher percentage of rural respondents prioritized flood prevention and food provision than respondents in urban communities (Figure 4; Chi-squared = 29.26, df = 5, p < 0.05). Cultural heritage (e.g., historical sites and Buddhist temples) was more valued in urban communities (Figure 6).

4. Discussion

We have investigated the perceived ecosystem values of local communities surrounding a large freshwater lake in a developing country. The results indicate that across cities and between rural and urban communities, there is heterogeneity in ecosystem service values. Moreover, the willingness of respondents to pay to protect the lake and its ecosystem services depends on which ecosystem service they perceived as the most important, their emotional attachment to the lake and their age. Our study indicates that investigating the perceived value of ecosystem services without direct monetary valuation can be an effective method for incorporating public environmental values into environmental decision making.

4.1. Reasons behind Ecosystem Values

Respondents that prioritized freshwater provision as most important to themselves were more willing to pay to protect it than those that prioritized a cultural service (i.e., recreation). Freshwater is a basic need, whereas recreation is not essential for survival. If respondents can no longer carry out recreational activities in or nearby the lake, they can carry out recreational activities in parks. However, finding a substitute for freshwater is near impossible. This result is in accordance with Maslow’s theory of the hierarchy of needs, a theory stemming from psychology stating that individuals must fulfil their basic physiological needs (e.g., hunger, thirst) before they can think about fulfilling less material needs in the hierarchy [33]. Freshwater provision for drinking is a basic physiological need, so it ranks first and as most important on the hierarchy of needs.
Another factor that influences respondents’ willingness to pay was whether they will miss the lake if it disappears. We used “will you miss Lake Tai if it disappears” as a measure of the respondent’s emotional attachment to the lake. If respondents said that they will not miss the hypothetical disappearance, this suggested that they felt detached from the lake. Our results support previous studies showing that when a person has no emotional attachment to nature, then they will value nature less [34,35].
Older respondents were significantly less willing to pay to protect and improve their prioritized (i.e., most important) ecosystem services. Even if they were willing to pay, they paid a significantly lower percentage of their annual income compared to younger respondents. The effects of age on environmental attitudes in different studies have been inconsistent [36]. Nevertheless, our results support research indicating that younger members of the public have more biocentric views towards forests compared to older members [37].
All communities prioritized freshwater provision as the most important ecosystem service to themselves. Although this seems like an obvious result, the reason given by most respondents for choosing freshwater provision is more interesting. They all referred to the 2007 algal bloom event and described it as “a terrible disaster”. In 2007, there was a algal bloom outbreak in Lake Tai that polluted the drinking water of Wuxi city [38]. Millions of local communities had no access to tap water [38]. The news was broadcasted across national television and this raised awareness of the lake’s importance as a source of drinking water. The widely publicized event has been linked to communities around a nearby lake becoming more concerned about environmental changes [39]. This indicates that when an irreplaceable and vital ecosystem service (i.e., freshwater provision) becomes unavailable, communities are more likely to appreciate the importance of the ecosystem.

4.2. Heterogeneity in Ecosystem Values

Within respondents that were willing to pay to protect and improve their prioritized (i.e., most important) ecosystem services, respondents in Suzhou were willing to pay a significantly higher percentage of their income compared to other city regions. The potential reason is that Suzhou is the most economically developed of all four city regions, with a GDP of 1.86 trillion Yuan, compared to Wuxi (1.14 trillion Yuan) and Huzhou (111.2 billion Yuan).
Rural communities were more likely to value food provision (e.g., crabs, fish and prawns) and flood prevention whereas urban communities were more likely to value cultural heritage (e.g., historical sites and Buddhist temples). This is because rural communities are predominantly farmers that depend on ecosystem services for their livelihoods. They also lived closer to and interacted more frequently with the lake. Our results support previous research demonstrating that Chinese rural communities are more concerned with issues regarding agriculture [40].
A higher proportion of rural respondents prioritized flood prevention in Huzhou and Yixing compared to Suzhou and Wuxi. A possible reason provided by respondents was that their agricultural land near the lake had previously been flooded. Therefore, they knew that lake management was important for flood prevention. This indicates that previous experiences can affect a respondent’s ecosystem values [41,42].
Urban respondents had a significantly higher education level than rural respondents and they cared more about an abstract cultural service (i.e., cultural heritage). We defined cultural heritage as preserving the Buddhist temples and historical sites around Lake Tai. This result is in accordance with previous research showing that cultural services are prioritized more by urban communities [43]. As cultural services are intangible benefits, they are more likely to be recognized and valued by higher educated urban respondents.

4.3. Public Perception and Environmental Policies

Understanding the reasons behind the public’s ecosystem values could be an effective way of linking public perceptions to environmental policies. To improve environmental policy, we should develop specific protection goals based on ecosystem services and increase public participation in environmental decision-making. This requires increased collaboration between stakeholders, natural and social scientists, economists and policy makers [44,45]
During the formation of environmental policies, we need to carefully consider heterogeneity in the perceived value of ecosystem services in different communities. Based on our results, the main protection goal would be to concentrate on freshwater provisioning as it is highly prioritized by local communities. By protecting freshwater provision, we are also improving ecological processes that contribute to the provision of other ecosystem services. Nevertheless, more rural respondents prioritized flood prevention and food provision. If we take these priorities into account, then there are implications beyond water quality. For example, marginal vegetation and wetlands are important to provide those two services so habitat destruction around the lake should be reduced. A further area of investigation is the issue of whose ecosystem values should count when there is heterogeneity.
Environmental policy makers also need to understand why some respondents are unwilling to pay to protect and improve ecosystem services. The common response was that they felt environmental protection was the government’s responsibility [46]. This may be due to the top–down governance structure in China, resulting in the public expecting the government to sort out environmental problems. Chinese environmental governance has generally been top–down, but successful environmental policies should always consider the relationships between people and the environment [47]. By engaging the public before the formation of the environmental policies, policies are likely to be met with increased public support and compliance [48].

5. Conclusions

We have used a socio-cultural approach to reveal the potential reasons influencing which ecosystem services are valued by different communities, by using a large freshwater ecosystem suffering from multiple stressors. Our results indicate respondents that prioritized a provisional service over a cultural service were more willing to pay to protect it. Furthermore, respondents that are more emotionally connected to an ecosystem value it more highly. This suggests that increased promotion of human-nature connections may increase pro-environmental attitudes. By fully understanding the reasons behind ecosystem values, we can gain insights into forming effective environmental policies that truly reflect societal values.
Both environmental policies and ecosystem services research will benefit from increased interdisciplinary research that can connect the natural and the social sciences. Our study presents a potential solution to connect the two, using a Chinese lake comparable to other freshwater ecosystems globally that are also suffering from multiple anthropogenic stressors. By using socio-cultural data, our results complement ecological data on freshwater ecosystems and contribute towards the development of more holistic environmental policies.

Author Contributions

Conceptualization, Y.P. and L.M.; methodology, Y.P., L.M. and Y.C.; formal analysis, Y.P.; investigation, Y.P.; writing—original draft preparation, Y.P.; writing―review and editing, L.M., S.M. and Y.C. All authors have read and agreed to the published version of the manuscript.

Funding

This research was funded by a UK Natural Environment Research Council (NERC) CASE studentship with Unilever, grant number NE/L501682/1.

Acknowledgments

Many thanks for all my research assistants for conducting interviews and our driver for finding sites so efficiently.

Conflicts of Interest

The authors declare no conflict of interest. The funders had no role in the design of the study; in the collection, analyses, or interpretation of data; in the writing of the manuscript, or in the decision to publish the results.

References

  1. Costanza, R.; de Groot, R.; Sutton, P.; van der Ploeg, S.; Anderson, S.J.; Kubiszewski, I.; Farber, S.; Turner, R.K. Changes in the global value of ecosystem services. Glob. Environ. Chang. Policy Dimens. 2014, 26, 152–158. [Google Scholar] [CrossRef]
  2. Costanza, R.; dArge, R.; deGroot, R.; Farber, S.; Grasso, M.; Hannon, B.; Limburg, K.; Naeem, S.; Oneill, R.V.; Paruelo, J.; et al. The value of the world’s ecosystem services and natural capital. Nature 1997, 387, 253–260. [Google Scholar] [CrossRef]
  3. Sterner, R.W.; Keeler, B.; Polasky, S.; Poudel, R.; Rhude, K.; Rogers, M. Ecosystem services of Earth’s largest freshwater lakes. Ecosyst. Serv. 2020, 41. [Google Scholar] [CrossRef]
  4. Malaj, E.; von der Ohe, P.C.; Grote, M.; Kuhne, R.; Mondy, C.P.; Usseglio-Polatera, P.; Brack, W.; Schafer, R.B. Organic chemicals jeopardize the health of freshwater ecosystems on the continental scale. Proc. Natl. Acad. Sci. USA 2014, 111, 9549–9554. [Google Scholar] [CrossRef] [Green Version]
  5. Zhang, Y.; Yao, X.; Qin, B. A critical review of the development, current hotspots, and future directions of Lake Taihu research from the bibliometrics perspective. Environ. Sci. Pollut. Res. 2016, 23, 12811–12821. [Google Scholar] [CrossRef] [Green Version]
  6. Restall, B.; Conrad, E. A literature review of connectedness to nature and its potential for environmental management. J. Environ. Manag. 2015, 159, 264–278. [Google Scholar] [CrossRef] [Green Version]
  7. Asah, S.T.; Guerry, A.D.; Blahna, D.J.; Lawler, J.J. Perception, acquisition and use of ecosystem services: Human behavior, and ecosystem management and policy implications. Ecosyst. Serv. 2014, 10, 180–186. [Google Scholar] [CrossRef]
  8. Rydin, Y.; Pennington, M. Public Participation and Local Environmental Planning: The collective action problem and the potential of social capital. Local Environ. 2000, 5, 153–169. [Google Scholar] [CrossRef]
  9. Bidegain, I.; Cerda, C.; Catalán, E.; Tironi, A.; López-Santiago, C. Social preferences for ecosystem services in a biodiversity hotspot in South America. PLoS ONE 2019, 14, e0215715. [Google Scholar] [CrossRef]
  10. Hoyos, D.; Mariel, P.; Fernández-Macho, J. The influence of cultural identity on the WTP to protect natural resources: Some empirical evidence. Ecol. Econ. 2009, 68, 2372–2381. [Google Scholar] [CrossRef] [Green Version]
  11. Carson, R.T. Contingent valuation: A practical alternative when prices aren’t available. J. Econ. Perspect. 2012, 26, 27–42. [Google Scholar] [CrossRef] [Green Version]
  12. Durand-Morat, A.; Wailes, E.J.; Nayga, R.M. Challenges of Conducting Contingent Valuation Studies in Developing Countries. Am. J. Agric. Econ. 2016, 98, 597–609. [Google Scholar] [CrossRef]
  13. Zhang, X.; Wang, Y.; Qi, Y.; Wu, J.; Liao, W.; Shui, W.; Zhang, Y.; Deng, S.; Peng, H.; Yu, X.; et al. Evaluating the trends of China’s ecological civilization construction using a novel indicator system. J. Clean. Prod. 2016, 133, 910–923. [Google Scholar] [CrossRef]
  14. Suwarno, A.; Hein, L.; Sumarga, E. Who Benefits from Ecosystem Services? A Case Study for Central Kalimantan, Indonesia. Environ. Manag. 2016, 57, 331–344. [Google Scholar] [CrossRef] [PubMed] [Green Version]
  15. Pan, Y.; Marshall, S.; Maltby, L. Prioritising ecosystem services in Chinese rural and urban communities. Ecosyst. Serv. 2016. [Google Scholar] [CrossRef] [Green Version]
  16. Cox, D.T.C.; Hudson, H.L.; Shanahan, D.F.; Fuller, R.A.; Gaston, K.J. The rarity of direct experiences of nature in an urban population. Landsc. Urban Plan. 2017, 160, 79–84. [Google Scholar] [CrossRef] [Green Version]
  17. Soga, M.; Gaston, K.J.; Koyanagi, T.F.; Kurisu, K.; Hanaki, K. Urban residents’ perceptions of neighbourhood nature: Does the extinction of experience matter? Biol. Conserv. 2016, 203, 143–150. [Google Scholar] [CrossRef]
  18. Zhang, X.H.; Hu, H.; Zhang, R.; Deng, S.H. Interactions between China’s economy, energy and the air emissions and their policy implications. Renew. Sustain. Energy Rev. 2014, 38, 624–638. [Google Scholar] [CrossRef]
  19. Liobikienė, G.; Juknys, R. The role of values, environmental risk perception, awareness of consequences, and willingness to assume responsibility for environmentally-friendly behaviour: The Lithuanian case. J. Clean. Prod. 2016, 112, 3413–3422. [Google Scholar] [CrossRef]
  20. Casey, P.J.; Scott, K. Environmental concern and behaviour in an Australian sample within an ecocentric – anthropocentric framework. Aust. J. Psychol. 2006, 58, 57–67. [Google Scholar] [CrossRef]
  21. Klain, S.C.; Olmsted, P.; Chan, K.M.A.; Satterfield, T. Relational values resonate broadly and differently than intrinsic or instrumental values, or the New Ecological Paradigm. PLoS ONE 2017, 12. [Google Scholar] [CrossRef] [PubMed] [Green Version]
  22. Chan, K.M.A.; Satterfield, T.; Goldstein, J. Rethinking ecosystem services to better address and navigate cultural values. Ecol. Econ. 2012, 74, 8–18. [Google Scholar] [CrossRef] [Green Version]
  23. Reidsma, P.; Feng, S.; van Loon, M.; Luo, X.; Kang, C.; Lubbers, M.; Kanellopoulos, A.; Wolf, J.; van Ittersum, M.K.; Qu, F. Integrated assessment of agricultural land use policies on nutrient pollution and sustainable development in Taihu Basin, China. Environ. Sci. Policy 2012, 18, 66–76. [Google Scholar] [CrossRef]
  24. Zhang, H.; Wang, Q.; Li, G.Y.; Zhang, H.P.; Zhang, J. Losses of ecosystem service values in the Taihu Lake Basin from 1979 to 2010. Front. Earth Sci. 2017, 11, 310–320. [Google Scholar] [CrossRef]
  25. Wang, Y.; Xu, J.; Yu, X.; Lei, G. Fishing down or fishing up in Chinese freshwater lakes. Fish. Manag. Ecol. 2014, 21, 374–382. [Google Scholar] [CrossRef] [Green Version]
  26. Li, L.F.; Li, Y.H.; Biswas, D.K.; Nian, Y.G.; Jiang, G.M. Potential of constructed wetlands in treating the eutrophic water: Evidence from Taihu Lake of China. Bioresour. Technol. 2008, 99, 1656–1663. [Google Scholar] [CrossRef]
  27. Guo, L. Ecology - Doing battle with the green monster of Taihu Lake. Science 2007, 317, 1166. [Google Scholar] [CrossRef]
  28. Bateman, I.J.; Turner, R.K. Evaluation of the environment: The contingent valuation method. In Sustainable Environmental Economics and Management: Principles and Practice; Centre for Social and Economic Research on the Global Environment: Norwich, UK, 1992; pp. 120–191. [Google Scholar]
  29. R Core Team. A language and environment for statistical computing; R Foundation Statistical Computing: Vienna, Austria, 2019. [Google Scholar]
  30. Lê, S.; Josse, J.; Husson, F. FactoMineR: An R Package for Multivariate Analysis. J. Stat. Softw. 2008, 25, 1–18. [Google Scholar] [CrossRef] [Green Version]
  31. Abdi, H.; Valentin, D. Multiple correspondence analysis. In Multiple Correspondence Analysis For The Social Sciences; ResearchGate: Berlin, Germany, 2018; pp. 31–55. [Google Scholar]
  32. Venables, W.; Ripley, B. Modern Applied Statistics with S; Springer: New York, NY, USA, 2002. [Google Scholar]
  33. Kenrick, D.T.; Griskevicius, V.; Neuberg, S.L.; Schaller, M. Renovating the Pyramid of Needs: Contemporary Extensions Built Upon Ancient Foundations. Perspect. Psychol. Sci. 2010, 5, 292–314. [Google Scholar] [CrossRef] [Green Version]
  34. Lumber, R.; Richardson, M.; Sheffield, D. Beyond knowing nature: Contact, emotion, compassion, meaning, and beauty are pathways to nature connection. PLoS ONE 2017, 12, 24. [Google Scholar] [CrossRef]
  35. Tang, I.C.; Sullivan, W.C.; Chang, C.Y. Perceptual Evaluation of Natural Landscapes: The Role of the Individual Connection to Nature. Environ. Behav. 2015, 47, 595–617. [Google Scholar] [CrossRef] [Green Version]
  36. Wiernik, B.M.; Ones, D.S.; Dilchert, S. Age and environmental sustainability: A meta-analysis. J. Manag. Psychol. 2013, 28, 826–856. [Google Scholar] [CrossRef]
  37. Tarrant, M.A.; Cordell, H.K. Amenity values of public and private forests: Examining the value-attitude relationship. Environ. Manag. 2002, 30, 692–703. [Google Scholar] [CrossRef]
  38. Yang, M.; Yu, J.W.; Li, Z.L.; Guo, Z.H.; Burch, M.; Lin, T.F. Taihu Lake not to blame for Wuxi’s woes. Science 2008, 319, 158. [Google Scholar] [CrossRef]
  39. Huang, L.; Sun, K.; Ban, J.; Bi, J. Public Perception of Blue-Algae Bloom Risk in Hongze Lake of China. Environ. Manag. 2010, 45, 1065–1075. [Google Scholar] [CrossRef]
  40. Yu, X. Is environment ‘a city thing’ in China? Rural–urban differences in environmental attitudes. J. Environ. Psychol. 2014, 38, 39–48. [Google Scholar] [CrossRef]
  41. Güsewell, A.; Ruch, W. Are there multiple channels through which we connect with beauty and excellence? J. Posit. Psychol. 2012, 7, 516–529. [Google Scholar] [CrossRef]
  42. Tam, K.P. Concepts and measures related to connection to nature: Similarities and differences. J. Environ. Psychol. 2013, 34, 64–78. [Google Scholar] [CrossRef]
  43. Martin-Lopez, B.; Gomez-Baggethun, E.; Garcia-Llorente, M.; Montes, C. Trade-offs across value-domains in ecosystem services assessment. Ecol. Indic. 2014, 37, 220–228. [Google Scholar] [CrossRef]
  44. Galic, N.; Schmolke, A.; Forbes, V.; Baveco, H.; van den Brink, P.J. The role of ecological models in linking ecological risk assessment to ecosystem services in agroecosystems. Sci. Total Environ. 2012, 415, 93–100. [Google Scholar] [CrossRef] [Green Version]
  45. Rutgers, M.; van Wijnen, H.J.; Schouten, A.J.; Mulder, C.; Kuiten, A.M.P.; Brussaard, L.; Breure, A.M. A method to assess ecosystem services developed from soil attributes with stakeholders and data of four arable farms. Sci. Total Environ. 2012, 415, 39–48. [Google Scholar] [CrossRef]
  46. Harris, P.G. Environmental perspectives and behavior in China - Synopsis and bibliography. Environ. Behav. 2006, 38, 5–21. [Google Scholar] [CrossRef]
  47. Eden, S. Public participation in environmental policy: Considering scientific, counter-scientific and non-scientific contributions. Public Underst. Sci. 1996, 5, 183–204. [Google Scholar] [CrossRef]
  48. Owens, S. ‘Engaging the Public’: Information and Deliberation in Environmental Policy. Environ. Plan. A Econ. Sp. 2000, 32, 1141–1148. [Google Scholar] [CrossRef] [Green Version]
Figure 1. Locations of the four study cities around Lake Tai (Taihu) and the spatial distribution of the 20 study sites: rural villages (white dots) and urban sites (black dots).
Sustainability 12 01217 g001
Figure 2. Gender ratios in (a) rural and urban communities and (b) in different city regions. The distribution of education levels in (c) rural and urban communities and (d) in different city regions.
Sustainability 12 01217 g002
Figure 3. A multiple correspondence analysis (MCA) plot depicting the top fifteen variables that contribute the most to the explained variances in the questionnaire data. Grey dotted circles represent the two opposing clusters on Dimension 1: respondents willing to pay or unwilling to pay.
Sustainability 12 01217 g003
Figure 4. The percentage of the respondent’s annual salary that they were willing to pay to protect and improve their prioritised ecosystem service (i.e., the most important service to themselves) (black bars) and to improve the overall environmental quality of Lake Tai (grey bars).
Sustainability 12 01217 g004
Figure 5. The prioritised (i.e., most important) ecosystem services for Lake Tai across the four major cities surrounding the lake: Huzhou (light grey), Suzhou (white), Wuxi (dark grey) and Yixing (black). Food represents the provision of edible aquatic species (e.g., fish, crabs); freshwater represents water used for drinking or irrigation.
Sustainability 12 01217 g005
Figure 6. The prioritised (i.e., most important) ecosystem services for Lake Tai between rural (grey bars) and urban (black bars) communities surrounding the lake. Food represents the provision of edible aquatic species (e.g., fish, crabs); freshwater represents water used for drinking or irrigation.
Sustainability 12 01217 g006
Table 1. The minimally adequate generalised linear model (GLM) to explain whether respondents were willing to pay or not to protect and improve their prioritised ecosystem service. The intercept represents respondents that will not miss the river if it disappears and respondents that prioritised microclimate regulation.
EstimateStandard Errort Valuep Value
Intercept0.220.660.330.74
Will you miss the lake if it disappears? (yes)1.050.333.20<0.001
Prioritised service (culture)0.720.661.090.28
Prioritised service (flood prevention)0.210.600.350.73
Prioritised service (food)−0.150.59−0.260.80
Prioritised service (recreation)−0.610.60−1.020.31
Prioritised service (water)0.690.551.250.21
Age of respondent−0.010.01−2.120.03
Table 2. The minimally adequate ordinal logistic regression model to explain the amount respondents were willing to pay to protect and improve their prioritised ecosystem service.
ValueStandard Errort Value
City (Suzhou)0.940.283.31
City (Wuxi)0.190.280.68
City (Yixing)−0.060.30−0.22
Age−0.020.01−3.44

