4.1. No Effect of Grazing System on FPCM Production and Solids
The mean level of FPCM production was 20.8 kg cow day
−1 in 2016 and 21.2 kg cow day
−1 in 2017 and was not affected by grazing system. Also, there was no significant effect of grazing system on milk CF and CP content and on liveweight change and BCS (
Table 4). This lack of difference in FPCM between grazing systems is in line with results from Pulido and Leaver [
15], who compared a rotational and continuous grazing system at two levels of milk production and found no significant effect of grazing system. Similarly, Arriaga-Jordan and Holmes [
16], in an experiment with cows milked three times daily and yielding over 30 kg day
−1, showed no difference in milk production between the two systems. Pulido and Leaver [
15] showed that reducing the sward height from 7–9 to 5–7 cm, had a negative effect on the liveweight gain of cows under continuous grazing. However, in the current study the sward height for KR was 3–5 cm, which is considerably lower than conventional continuous grazing systems, but there was no significant difference in liveweight gain with the SG group.
For both systems, the amount of concentrate fed was the same, but the level of supplementation with silage was higher for SG, compared to KR in 2016 (4.3 and 3.5 kg DM cow
−1 day
−1 respectively). This was related to a higher number of days spent inside for the SG groups (24 days in total), due to low load bearing capacity as a result of excessive rainfall in late June and early July 2016, and during a period of low grass growth towards the end of September (see also [
5]). In 2017, the SG groups also spent 22 days less in pasture, of which 6 days were due to low load bearing capacity and the remainder in order to build up grass supply to the desired pre-grazing biomass. In 2017, the silage supplementation rate was only slightly higher for SG compared to KR (2.6 and 2.5 kg DM cow
−1 day
−1, respectively). However, the amount of silage produced during the trial, was also higher for SG compared to KR (
Table 5). In order to account for these differences and allow for a fair comparison of milk production at the system level, the FPCM was corrected for this silage balance (See
Section 2.7 for details). In 2016, the FPCM
Cor was slightly but non-significantly higher for KR compared to SG. In contrast, in 2017, the FPCM
Cor was 7% lower for KR compared to SG, but again the difference was non-significant. Therefore, in contrast with our hypothesis, there was no significant effect of grazing system on the FPCM yield, despite a significantly higher grass production under SG compared to KR. Furthermore, we found no indication that the two breeds were differentially affected by grazing system.
In this paper we used the calculated energy requirements (VEMReq) and supply in the form of concentrate and silage to calculate the proportion of FPCM derived from grazed grass and the intake of grazed grass. This method is not as reliable as direct measurement of grass intake using alkane techniques; however, it was the best available method. These calculations showed that the intake of grazed grass and the FPCM production from grazed grass was slightly higher for KR compared to SG in 2016, whereas the opposite was true in 2017. On average, the estimated herbage intake during grazing in 2016 and 2017 was 5.5 to 7.0 kg DM cow−1 day−1. While these intake rates are much lower than the potential herbage DM intake during grazing, grazed grass contributed substantially (35–40%) to the energy supply for milk production. This shows that even at farms with a relatively low area available for grazing (i.e., 7.5 LU ha−1 grazing area), grass can still form an important contribution to milk production.
When the intake of grazed grass using this method was compared to the grass production available for grazing (so excluding silage production), in 2016, the % utilisation (intake GG/production GG) was above the theoretical maximum of 100% for KR and close to 100% for SG, whereas in 2017, the utilisation was slightly higher for SG compare to KR and on average 92%.
The relatively high utilisation of KR compared to SG during 2016 may be related to the low grazing losses due to fouled areas and senescence in KR compared to SG. There is very little standing biomass at KR and the risk of herbage losses are much lower. Additionally, in 2016, the SG cows had to remain indoors for a number of days with high amounts of rainfall, whereas the KR herds could graze throughout the season. This may have been related to the dense sward associated with KR, resulting in a higher load bearing capacity [
5]. Additionally, the nutritional value of the KR herbage is generally higher than for SG [
5], resulting in a better conversion to milk.
However, the grass utilisation in excess of 100% for KR in 2016, suggests, that there is also a different mechanism at play. The calculation of the amount of grazed grass is dependent on a correct estimation of the VEM content of the grazed grass. This VEM content was likely to be underestimated in KR in 2016, due to inadequate sampling [
5]. Therefore, in the current paper, we used the herbage VEM levels of SG for both systems. However, it would appear that this VEM level was an underestimation of the actual KR VEM level, which resulted in an overestimation of herbage intake for KR in 2016.
Generally speaking, in a year with sub-optimal conditions for grass growth, such as 2016, the difference between KR and SG was negligible, and KR had a small advantage related to the higher load bearing capacity during wet periods. However, in 2017, when grass growth conditions were generally good, SG resulted in a slightly higher FPCM production per ha.
4.2. Limited Effect of CP Level in Concentrate on Milk Production
For the calculation dietary CP content and CP intake, we assumed that the silage intake was the same for the HP and LP groups (silage intake was recorded at the grazing system level only) and that differences between the HP and LP groups were the result of difference in CP content in concentrate and potentially intake of grazed grass.
In contrast with our hypothesis, during 2016, the FPCM production was lower for the low compared to the high CP level. The difference between HP and LP was mainly apparent at the start of the grazing season until the end of July. In contrast, during 2017, there was no effect of CP level on FPCM yield (in line with our hypothesis). In 2016, the average CP content of the total intake was lower compared to 2017 (156 and 180 g kg
−1 DM, respectively). This was due to lower grass intake (5.7 vs. 6.6 kg DM cow
−1 day
−1) which was related to the lower grass growth in 2016, and lower CP content of the grazed grass (192 and 242 g CP kg
−1 DM in 2016 and 2017, respectively [
5]). As a result, the CP content of the total ration for the LP systems remained below 150 g kg
−1 DM until the end of July, after which the herbage CP content and thus the ration CP content increased. We found no indication that the two breeds were differentially affected by CP level. A number of other studies have shown that decreasing the dietary N intake through reduced concentrate N content only has a minor effect on milk yields [
17,
18].
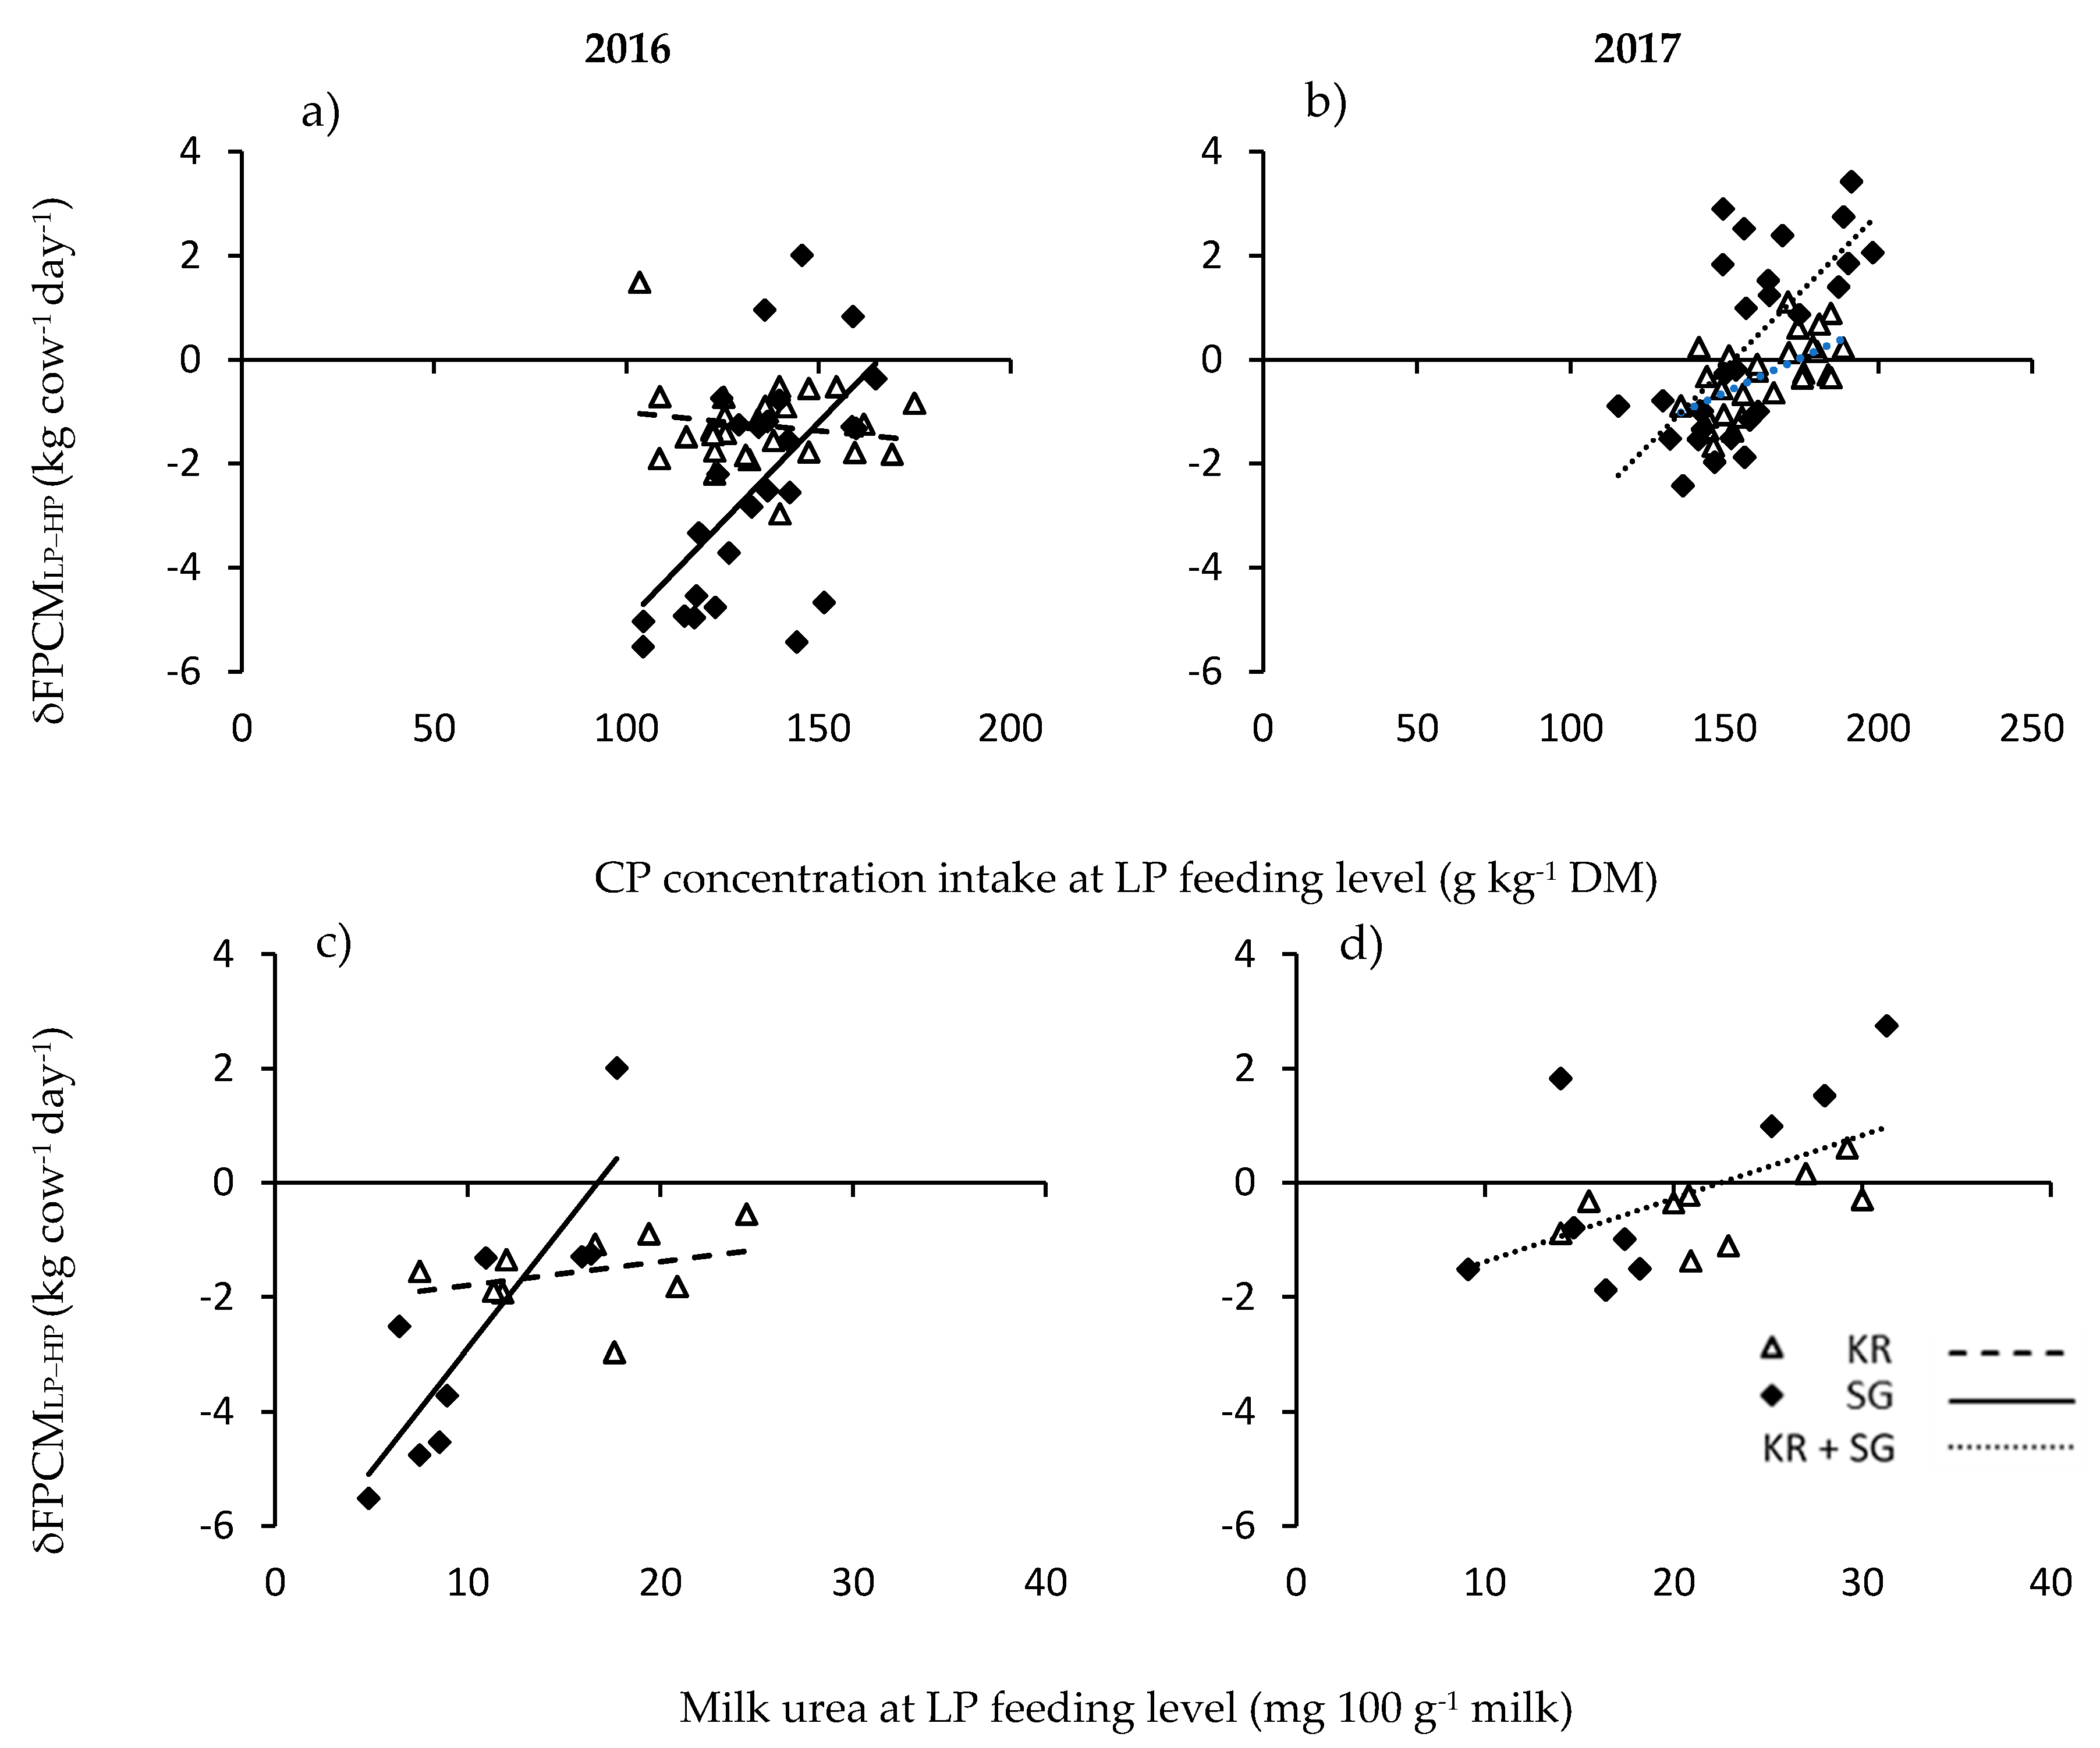
In order to increase our insight in the mechanism behind the reduction in FPCM in the current study, we performed a regression analyses between the weekly difference in FPCM yield between LP and HP (δFPCM
LP-HP) and the CP content of the intake at the LP level (g CP kg
−1 DM). This analysis showed a positive correlation between the CP content and δFPCM
LP-HP for the SG system in 2016 and both systems in 2017 (
Figure 2a,b). Closer inspection showed that the intersection with the x-axis (the point at which there was no difference in FPCM production between LP and HP) was at 150–160 g CP kg
−1 DM, which is very close to the theoretical minimum CP requirement of 150 g CP kg
−1 DM to avoid impaired ruminal digestion [
7,
8]. However, for KR in 2016, there was no significant correlation between the CP content of intake and delta FPCM. This may be related to the underestimation of the CP content of ingested KR herbage in 2016 because of the sampling technique as discussed by with Hoekstra et al., [
5] and above.
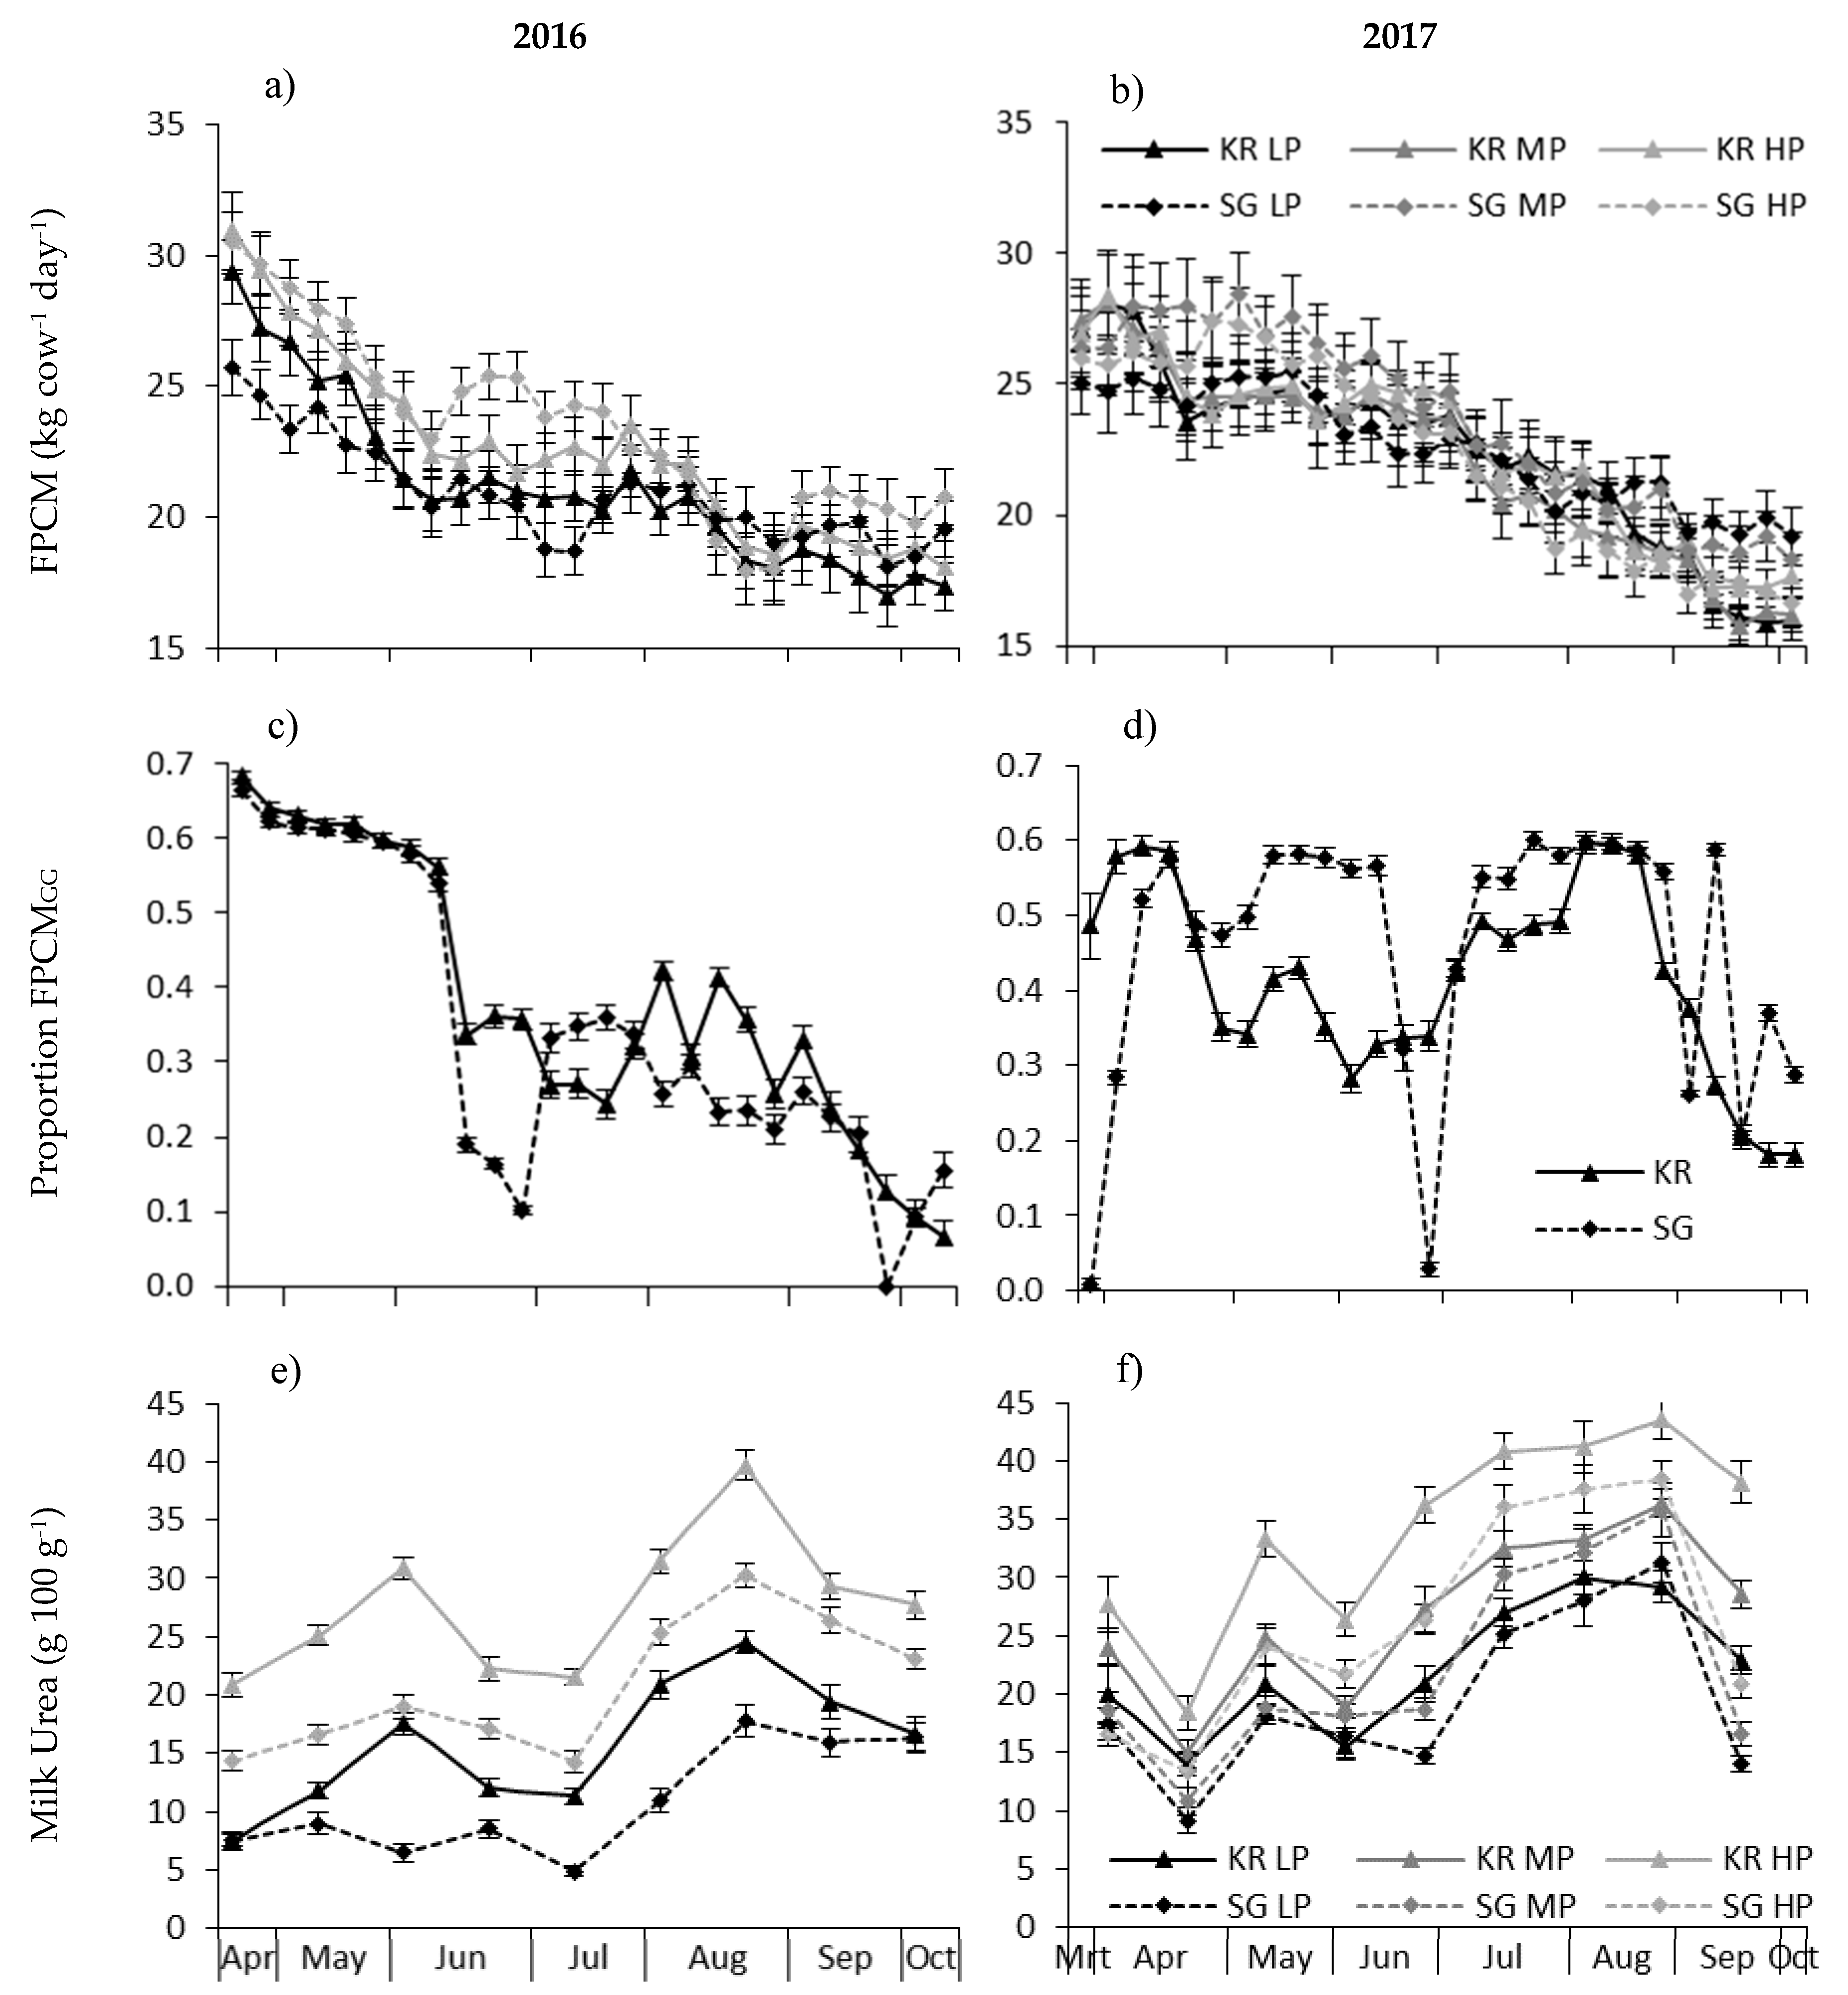
Similarly, δFPCM
LP-HP was positively correlated to the milk urea levels, which remained below 10 mg 100 g
−1 milk for SG-LP until the end of July, whereas the milk urea level was significantly higher for KR-LP. In this case the intersection with the x-axis was 17 and 22 mg urea 100 g
−1 milk in 2016 and 2017, respectively. This is in line with [
19], who suggested a milk urea level of 18 mg 100 g
−1 milk as a benchmark for optimal bulk milk urea concentration.
Therefore, in contrast with our hypothesis, there was a negative impact of feeding LP concentrate on FPCM yield in 2016. This could be related to the lower than expected herbage production and CP contents in 2016. The intake and CP content of grazed grass is not routinely monitored at Dutch dairy farms, however, by monitoring milk urea levels at a regular basis, a lack of CP in the ration can be identified and the risk of a yield penalty can be minimised, while still reducing the risk of N losses (see also below).
4.3. N Use Efficiency and Loss
N use efficiency (N output/N input) was not significantly affected by grazing system and was on average 30% in 2016 and 25% in 2017. In general, it is much harder to optimise N use efficiency in grazing systems compared to stable fed diets, due to the unpredictability of herbage intake and quality during grazing [
20]. Research has shown that herbage management measures such as N fertiliser application rate and the length of regrowth period can affect the herbage N content and thus the N use efficiency [
21,
22]. However, even though the herbage management was very different for the two grazing systems (herbage regrowth period ranged from 1 day for KR to on average 20 days for SG), this did not significantly affect the N use efficiency in the current study. The N intake of grazed grass may have been underestimated in the current study (particularly during 2016), due to difficulties of taking a representative sample of the short KR grass. This would be supported by the higher milk urea levels under KR compared to SG (
Figure 1), which could indicate a lower N use efficiency.
In line with our hypothesis, there was a strong effect of CP level on N efficiency, which ranged from 22% for HP in 2017 to 33% for LP in 2016. These results are in line with [
17,
18], who also showed an increase in the N use efficiency in response to reduced concentrate N intake. Whereas in 2016, this increased efficiency had a negative effect on N-output in the form of milk production, this was not the case in 2017. As discussed above, the results indicate that as long as the CP content of the overall ration stays above 150 g kg
−1 DM, the N-efficiency can be improved without negatively affecting production levels. The reduction in concentrate CP intake resulted in a reduction of N loss of 34% in 2016 and 27% in 2017. Both the N use efficiency and N loss were strongly correlated to the milk urea content. Milk urea content has been directly linked to ammonia emissions, and Duinkerken et al. [
23] showed that ammonia emission increased exponentially with increasing milk urea concentration: at a level of 20 mg urea per 100 g milk, ammonia emission increased 2.5% when milk urea concentration increased by 1 mg 100 g
−1, whereas the increase in ammonia emission was 3.5% at a milk urea level of 30 mg per 100 g milk. Jonker et al. [
24] have suggested that milk urea N (MUN) may be used as a management tool to improve dairy herd nutrition and monitor the nutritional status of lactating dairy cows. Elevated MUN indicates that excess CP has been fed to the dairy cow for her given level of production [
25,
26] and identifies excess nutrient loading to water resources [
24] and ammonia volatilisation [
23]. Therefore, optimising the use of MUN on dairy farms, also during the grazing season, could reduce N losses to the environment while maintaining productivity.

 and
and 

