1. Introduction
The transport sector is one of the main consumers of energy in the world. However, renewables penetrated only 3.3 percent of the transportation global market in 2016 [
1]. The diffusive nature of transport use in modern society and its high dependence on fossil fuels has direct consequences for the use of resources and the environmental impact of the sector [
2,
3]. As a result, the reduction of the energy use and emissions associated with the provision of transport services is, according to [
2], one of the most challenging areas of energy policy.
Renewable energy utilization is an alternative to address this issue, including the possibility of achieving a greener and more sustainable transport energy supply [
2]. In Brazil, ethanol from sugarcane is an important biofuel used by passenger cars, accounting for about 50% of fuel consumption by light vehicles.
Recognizing the potential of biofuels, both for energy security and for mitigating Greenhouse Gas (GHG) emissions, the National Policy of Biofuels-RenovaBio Program was launched in Brazil in 2017 [
4]. This public policy encourages the production and use of biofuels in the country, seeking to contribute to the achievement of the greenhouse gases (GHG) emissions reduction targets established in the Paris Agreement [
4]. The program can be favored by a pipeline system that is being implemented and should provide a cheaper logistics alternative with less GHG emissions [
5].
However, the bioethanol logistics supply chain is highly dependent on fossil fuel; tractors and machines used in agricultural management, such as tillage, planting, and sugarcane harvesting, trucks transporting sugarcane from the field to the mill, and trucks distributing bioethanol from mills to their point of distribution (in this paper, the export port) all use diesel as fuel.
Usually, related studies ultimately perform generic quantifications of GHG from a supply chain (by adopting average parameters), disregarding, for example, the specifics of the production region. Another simplification commonly found in the international literature is the excluding of the stage of transportation from the plant to the final destination from the emissions calculations [
6,
7].
Studies have focused on the contribution of transportation to GHG emissions in the life cycle or carbon footprint of products and commodities, owing to the importance of the sector for fossil fuel consumption and, consequently, for GHG emissions. Particularly for agricultural products, the more accurate modeling of emissions should consider the systems approach connecting transportation and production [
6], since production location or characteristics can determine the final emissions from the supply chain.
This study aims to quantify the CO2 emissions from diesel combustion in the stages of the ethanol supply chain, from the field to the export port. The combination of (a) the assessment of the impact of the region of origin on the total emissions from the ethanol supply chain (by analyzing five different sugarcane-producing regions of São Paulo state) and (b) the inclusion of all stages of the ethanol supply chain—from machine operations in the field, from trucks transporting sugarcane to the mill, and from bioethanol distribution to the port—is the main contribution of the manuscript. Furthermore, this study aims to assess whether using alternative modes of ethanol transportation can reduce emissions from the different logistics corridors analyzed.
Our main contribution is that CO2 emissions in the agricultural management stage from diesel consumption, measured in terms of kg CO2 per ton of ethanol, are more relevant than the ones that come from the transportation stages. In this way, the better management of diesel consumption during the production process could contribute to greener production patterns and the environmental competitiveness level of the bioethanol producer.
Given this high dependence on fossil fuel in all stages of ethanol production, measuring diesel consumption and their respective CO2 emissions is the first step toward a more sustainable production and distribution. Specifically, it contributes to reducing the environmental impact from this supply chain and to the transition towards low-carbon and green economies.
Sustainable development initiatives not only identify opportunities to reduce carbon emissions, but also decrease energy consumption and improve operational efficiency [
8]. In this context, the indicators found in the study are particularly important in supporting private actions and public policies related to mitigating emissions in the ethanol supply chain. Additionally, they could provide an important lesson for countries in the development process of bioethanol production from sugarcane in a large-scale, such as India and some African countries [
9,
10]. With over four decades of experience in the bioethanol industry and market development, Brazil is a potential source of expertise across the entire bioethanol production chain [
10].
2. Literature Review
Environmental sustainability has gradually become of vital importance in academia, companies, and government due to new regulations, customer expectations, and market pressures on green product purchasing [
11]. According to [
12], the environmental sustainability of the supply chain can be reflected by its use of resources and GHG emissions along the supply chain. The knowledge of carbon emission is of great significance both for company managers and for the government environmental assessment toward a low-carbon strategy. However, it requires measuring the spatial variation of carbon along the production process, providing the information for identifying the main sources of carbon emission [
12].
Several papers have addressed the issue of the transport sector and GHG emissions, under different types of approaches and scopes. Several methods, tools, and databases are available to calculate the emissions of freight transportation. However, according to Auvinen et al. [
7], study findings are often not comparable or lack sufficient transparency. The next steps for ongoing initiatives to move toward global methodological harmonization have been suggested to enable comparing carbon footprint-related calculations across complex supply chains [
7,
13]. The methods and tools for calculating CO
2 emissions along the supply chain fail to analyze all transportation stages of the chain. CO
2 emissions calculation standards exist, but they overlook transportation requirements and specifics [
7].
One kind of approach to logistics activities is the analysis of energy consumption and the respective CO
2 emissions from transport or the supply chains. Using a generic methodology, Ref. [
14] compares the energy consumption and CO
2 emissions from the supply chains of different products in three different countries (Belgium, France, and the United Kingdom). Investigating the energy flow, GHG emissions, and cost of a small-scale rice-straw-based heat generation system, Ref. [
15] used a downdraft furnace and a dryer simulator setup.
Recently, the interest in local food supply chains is increasing, and the food miles indicator has been used with growing frequency to express the environmental impacts related to carbon emissions. With this approach, it is possible to estimate the carbon emission per unit of production over the transport chain, taking into account the amount transported, the vehicles/trucks used for transport, the transport mode, and the transport efficiency [
16].
Some studies quantify the carbon emissions by switching transport mode, especially from truck to intermodal transportation, such as highway, waterway, and pipeline [
17,
18,
19]. Ref. [
17] considered switching from truck to intermodal transportation and observed a large variance in the carbon emissions according to specific origin–destination pairs, which is consistent with our findings. Ref. [
18] analyzed possible combinations of the highway, water, and pipeline modes, and highlighted advantages in terms of the minimization of GHG by using intermodal logistics to distribute Brazilian bioethanol.
In a broader type of approach, transportation is included in the quantification of emissions from the life cycle assessment (LCA) perspective of specific products and commodities [
20]. In general, these studies do not highlight the relevant results from the transportation perspective and many assumptions are made that aim to simplify the quantification process. For example, the same transportation distance is assumed for the entire national territory, variations in the production region of agricultural products have been overlooked, and different transport modes or infrastructures have not been considered [
6]. However, the emissions (or carbon footprint) from production variy when relocating production areas or altering the mode of transportation [
6,
17,
21]. Agricultural practices and soil properties can vary widely by location, influencing the frequency of tillage, the machine hours used, and consequently, the rates of fuel consumption. Variations in technology and the classes and capacities of farm machinery also influence fuel consumption. Those authors suggest linking transport and production, aiming to accurately model the emissions of a supply chain.
Specifically considering the supply chain of ethanol, some studies have addressed the issue associated with the transport of feedstock to individual ethanol plants. However, neither energy consumption nor GHG emissions were considered [
22,
23,
24]. Various studies on GHG emissions from sugarcane-based ethanol have been developed in the last three decades. However, the rapid growth of the cane sector in Brazil, associated with technology development and new cane varieties and productivity, are changing important parameters in this evaluation [
25]. Ref. [
26] adopted a ‘‘seed-to-factory gate’’ approach, which comprehends the sugarcane production and processing leading to fuel ethanol at the mill gate. Those authors showed the high impact of cane productivity and ethanol yield variation on GHG emissions, since those important parameters present a large range of variation among mills. Ref. [
20] draws up a first approach life cycle inventory (LCI) procedure to evaluate the amounts of CO
2 emissions in three Brazilian automotive fuels’ life cycles—gasoline, ethanol, and natural gas—considering their final use in passenger car urban traffic. Ref. [
18] analyzed possible combinations of the highway, water, and pipeline modes, and highlighted advantages in terms of the minimization of GHG by using intermodal logistics to distribute Brazilian bioethanol.
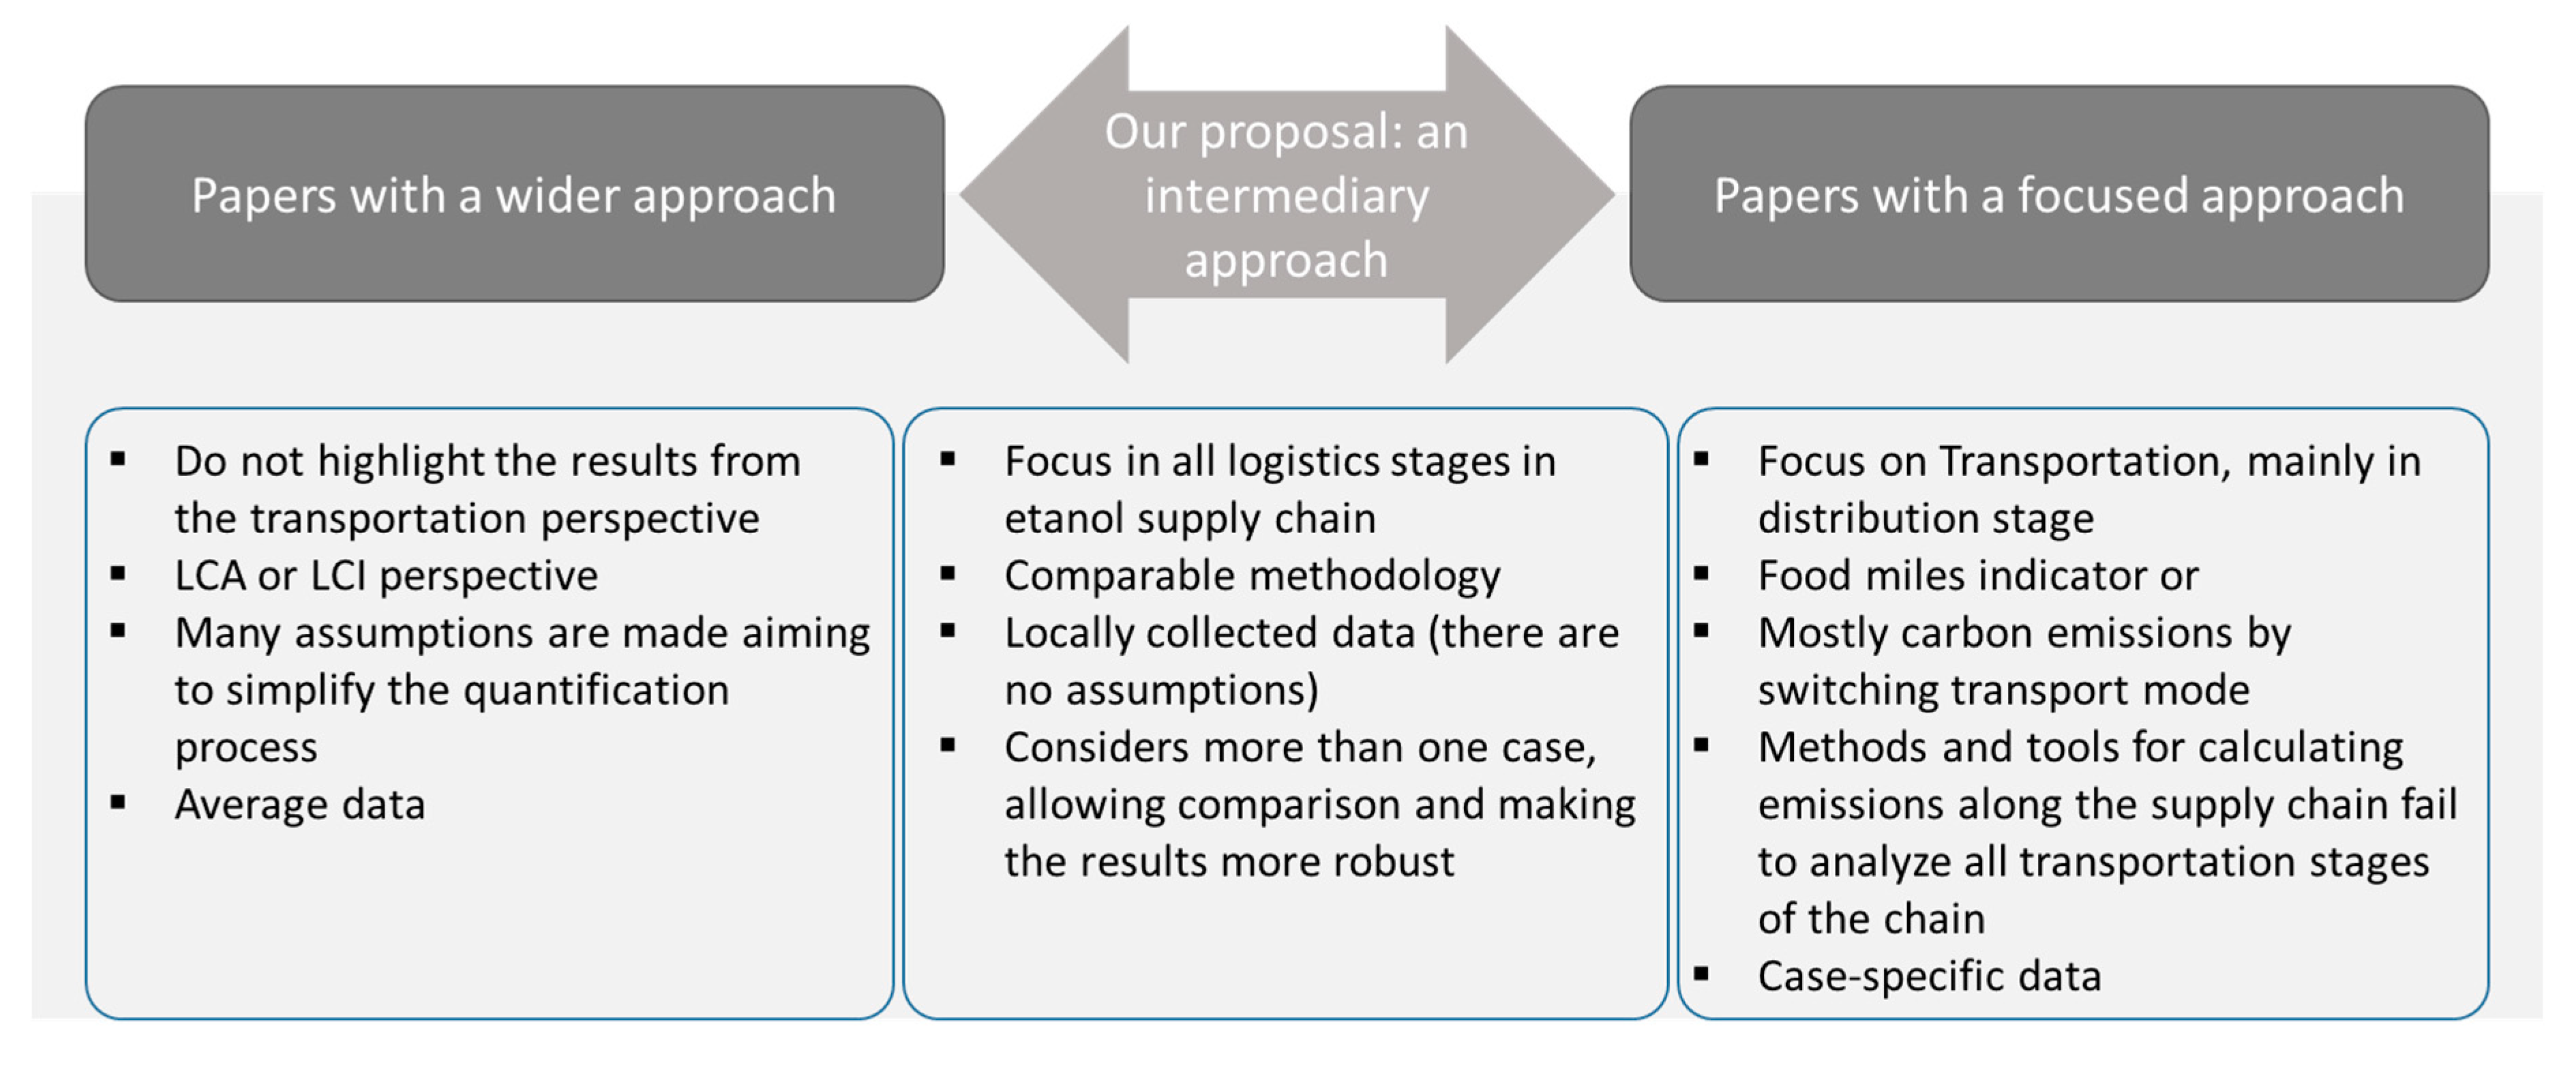
There are no studies focusing on detailing and comparing the emissions from all transportation activities that are mainly seeking to subsidize actions and policies aimed at mitigating those stages. In this context,
Figure 1 summarizes the characteristics of the studies on this issue, highlighting the contributions of our paper.
Thus, this study seeks to fill this gap, emphasizing emissions from all logistic activities that consume fossil fuel in all stages in the ethanol supply chain, such as the use of tractors in the field, the transport of cane from the field to the mill, and the distribution of ethanol from the mill to a single destination (the port) to allow a better comparison. We consider the analysis from five different stage perspectives, making comparisons, and make the results more robust, such as including no assumptions regarding the carbon emissions from soil and mill operations. Finally, this paper identifies the most important steps that deserve more attention from the private and public agents involved to make the ethanol chain cleaner and less fossil fuel-intensive.
3. Materials and Methods
Assessing carbon emissions from a supply chain requires defining the scope and limits of the study system, mapping the activities involved, identifying the necessary key data, collecting primary and secondary data, and, finally, calculating the fuel-based or distance-based emissions [
8]. The content of the following sections is very similar to the structure proposed by Ref. [
8].
3.1. Scope
This study focuses on the quantification of CO
2 emissions solely from the diesel consumption of logistics operations in the bioethanol supply chain, expressed in terms of kilograms of CO
2 from diesel combustion per ton of ethanol produced (kg CO
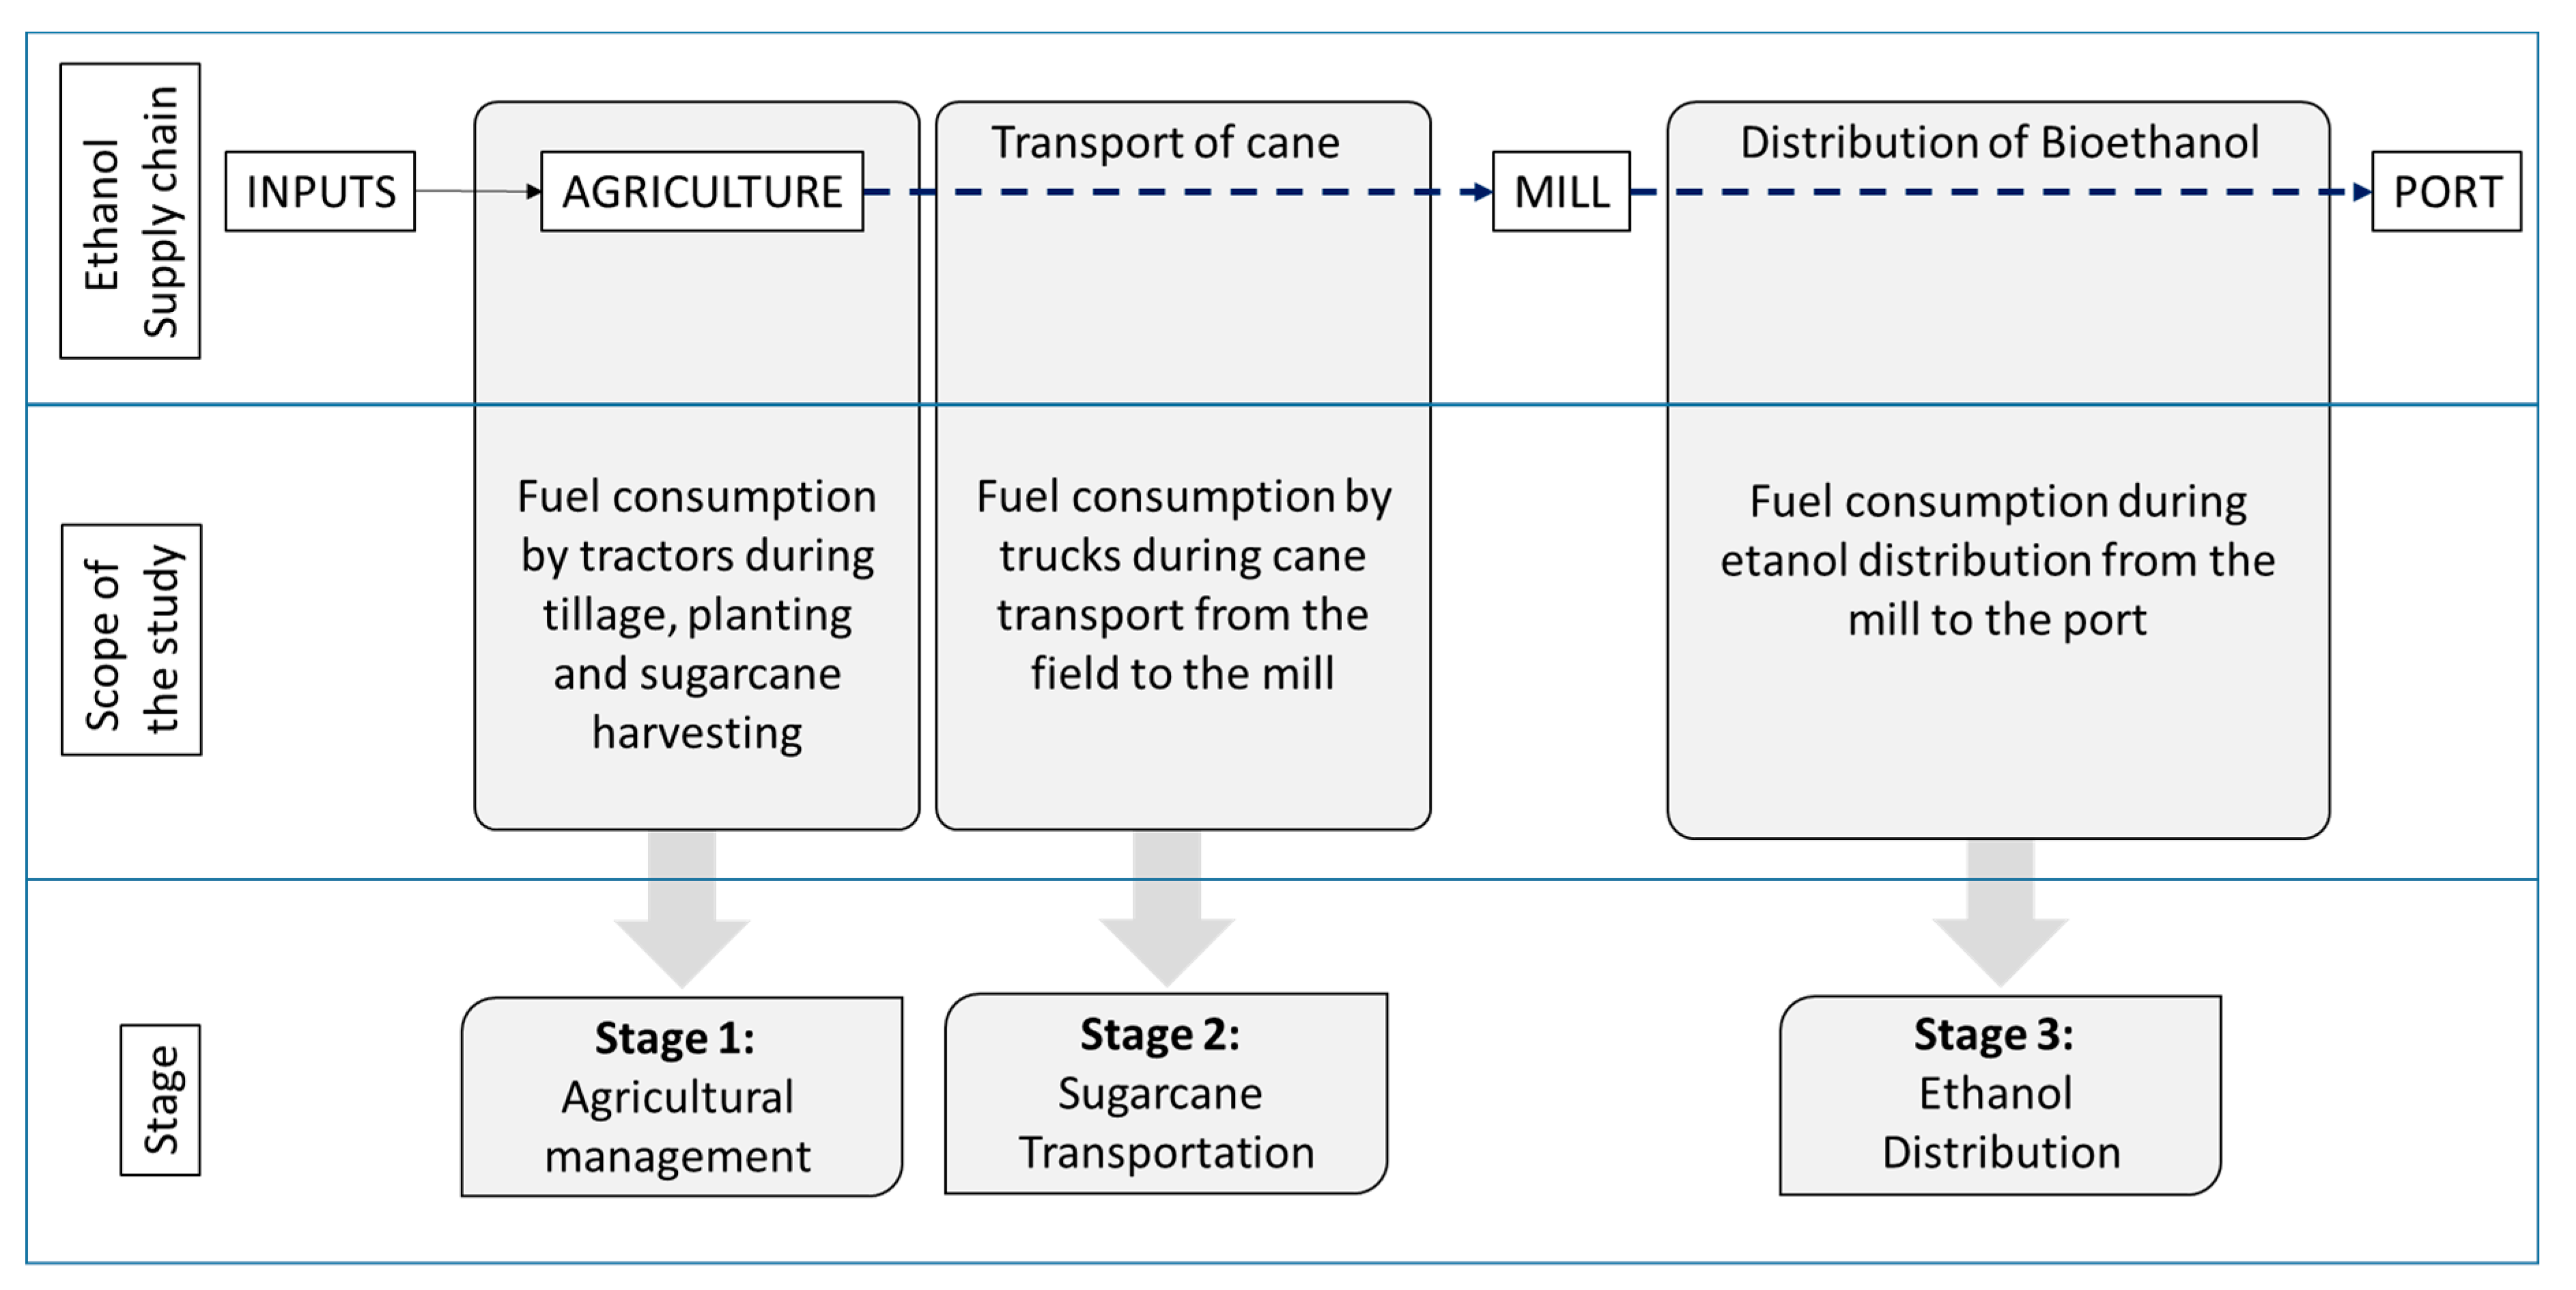
2/t ethanol). Emissions from other sources, such as the emissions from soil management and fertilizer application, for example, do not contribute to the analysis, since they are highly related to soil characteristics of a region. Similarly, other emissions sources (such as mill operations, which are dependent on technology, maintenance, and so on) were disregarded. Therefore, it is not an inventory of emissions nor a life cycle of greenhouse gas emission. The logistics stages selected to calculate CO
2 emissions from diesel consumption during the ethanol supply chain logistics are shown in
Figure 2.
The selection of a single destination (as in [
18]) makes a comparison of different alternatives easier. The choice of the port of Santos is made because the port of Santos is the main export hub of Brazilian ethanol.
Since the study focuses on quantifying emissions from diesel combustion in logistics stages, the scope of the study does not include the quantification of CO2 emissions from:
Farms and industrial processes, and from the respective inputs other than diesel used in tractors and trucks (similar to the approach adopted by [
14]);
Ethanol transshipment operations between the different modes of transportation—once Brazilian transshipment points use electric pumps, the resulting emissions can be assumed to be insignificant [
27];
Construction, infrastructure use, and maintenance and loading and unloading operations in container terminals and warehouses;
Maritime transport between Brazil and the ethanol destination country, and the end-use in vehicles.
Carbon emissions in the field are related to fuel consumption from tractors and machines during agricultural management, such as tillage, planting, and sugarcane harvesting. Stage 1 (“Agricultural management”) CO
2 emissions are calculated as a function of the fuel consumption of sugarcane planters and harvesters, and depend on the yield (expressed as t/ha) according to Equation (1).
where
E1
i is the Stage 1 emissions (kg carbon dioxide equivalent (CO
2e)/t ethanol),
FCi is the diesel consumption of planters and harvesters (l/ha),
EF is the diesel emission factor (kg CO
2e/l),
Yi is the yield of the different sugarcane-producing regions (t/ha), and the index
i specifies the set of origins.
Stage 2 (“Sugarcane transportation”) CO
2 emissions are calculated as a function of the distance traveled by truck to transport the sugarcane from the field to the mill (Equation (2)). Fuel consumption data, which are expressed in units of l/ton-km, vary with the average load carried and depend on the type of vehicle used.
where
E2
i is the Stage 2 emissions (kg CO
2e/t ethanol),
Di is the distance traveled (km),
FC is the fuel (diesel) consumption (l/t.km),
EF is the emission factor (kg CO
2e/l), and the index
i corresponds to the set of origins.
Finally, Stage 3 (“Ethanol transportation” from the mill to the port) CO
2 emissions are calculated as a function of the distances traveled by road or intermodal alternatives (road–rail or road–pipeline), according to Equation (3).
where
E3
i is the Stage 3 emissions (kg CO
2e/t ethanol),
Dij is the distance traveled (km),
FC is the fuel (diesel) consumption (l/t.km),
EF is the emission factor (kg CO
2e/l), the index
i specifies the set of origins, and the index
j specifies the set of modes of transportation (road, rail, pipeline).
Equations (1)–(3) are based on the bottom-up methodology for quantifying CO
2 emissions from fuel combustion in transport according to the 2006 IPCC Guidelines for National Greenhouse Gas Inventories [
28]. The necessary adjustments to the equations to meet the study objectives were made.
Many organizations suggest/apply methods, tools, and databases for the calculation of CO
2 emissions along supply chains, but almost all of them do not cover the entire transportation chain. In general, standards for the CO
2 emissions of products and production do not take that particular requirements of transportation into consideration [
13,
29,
30].
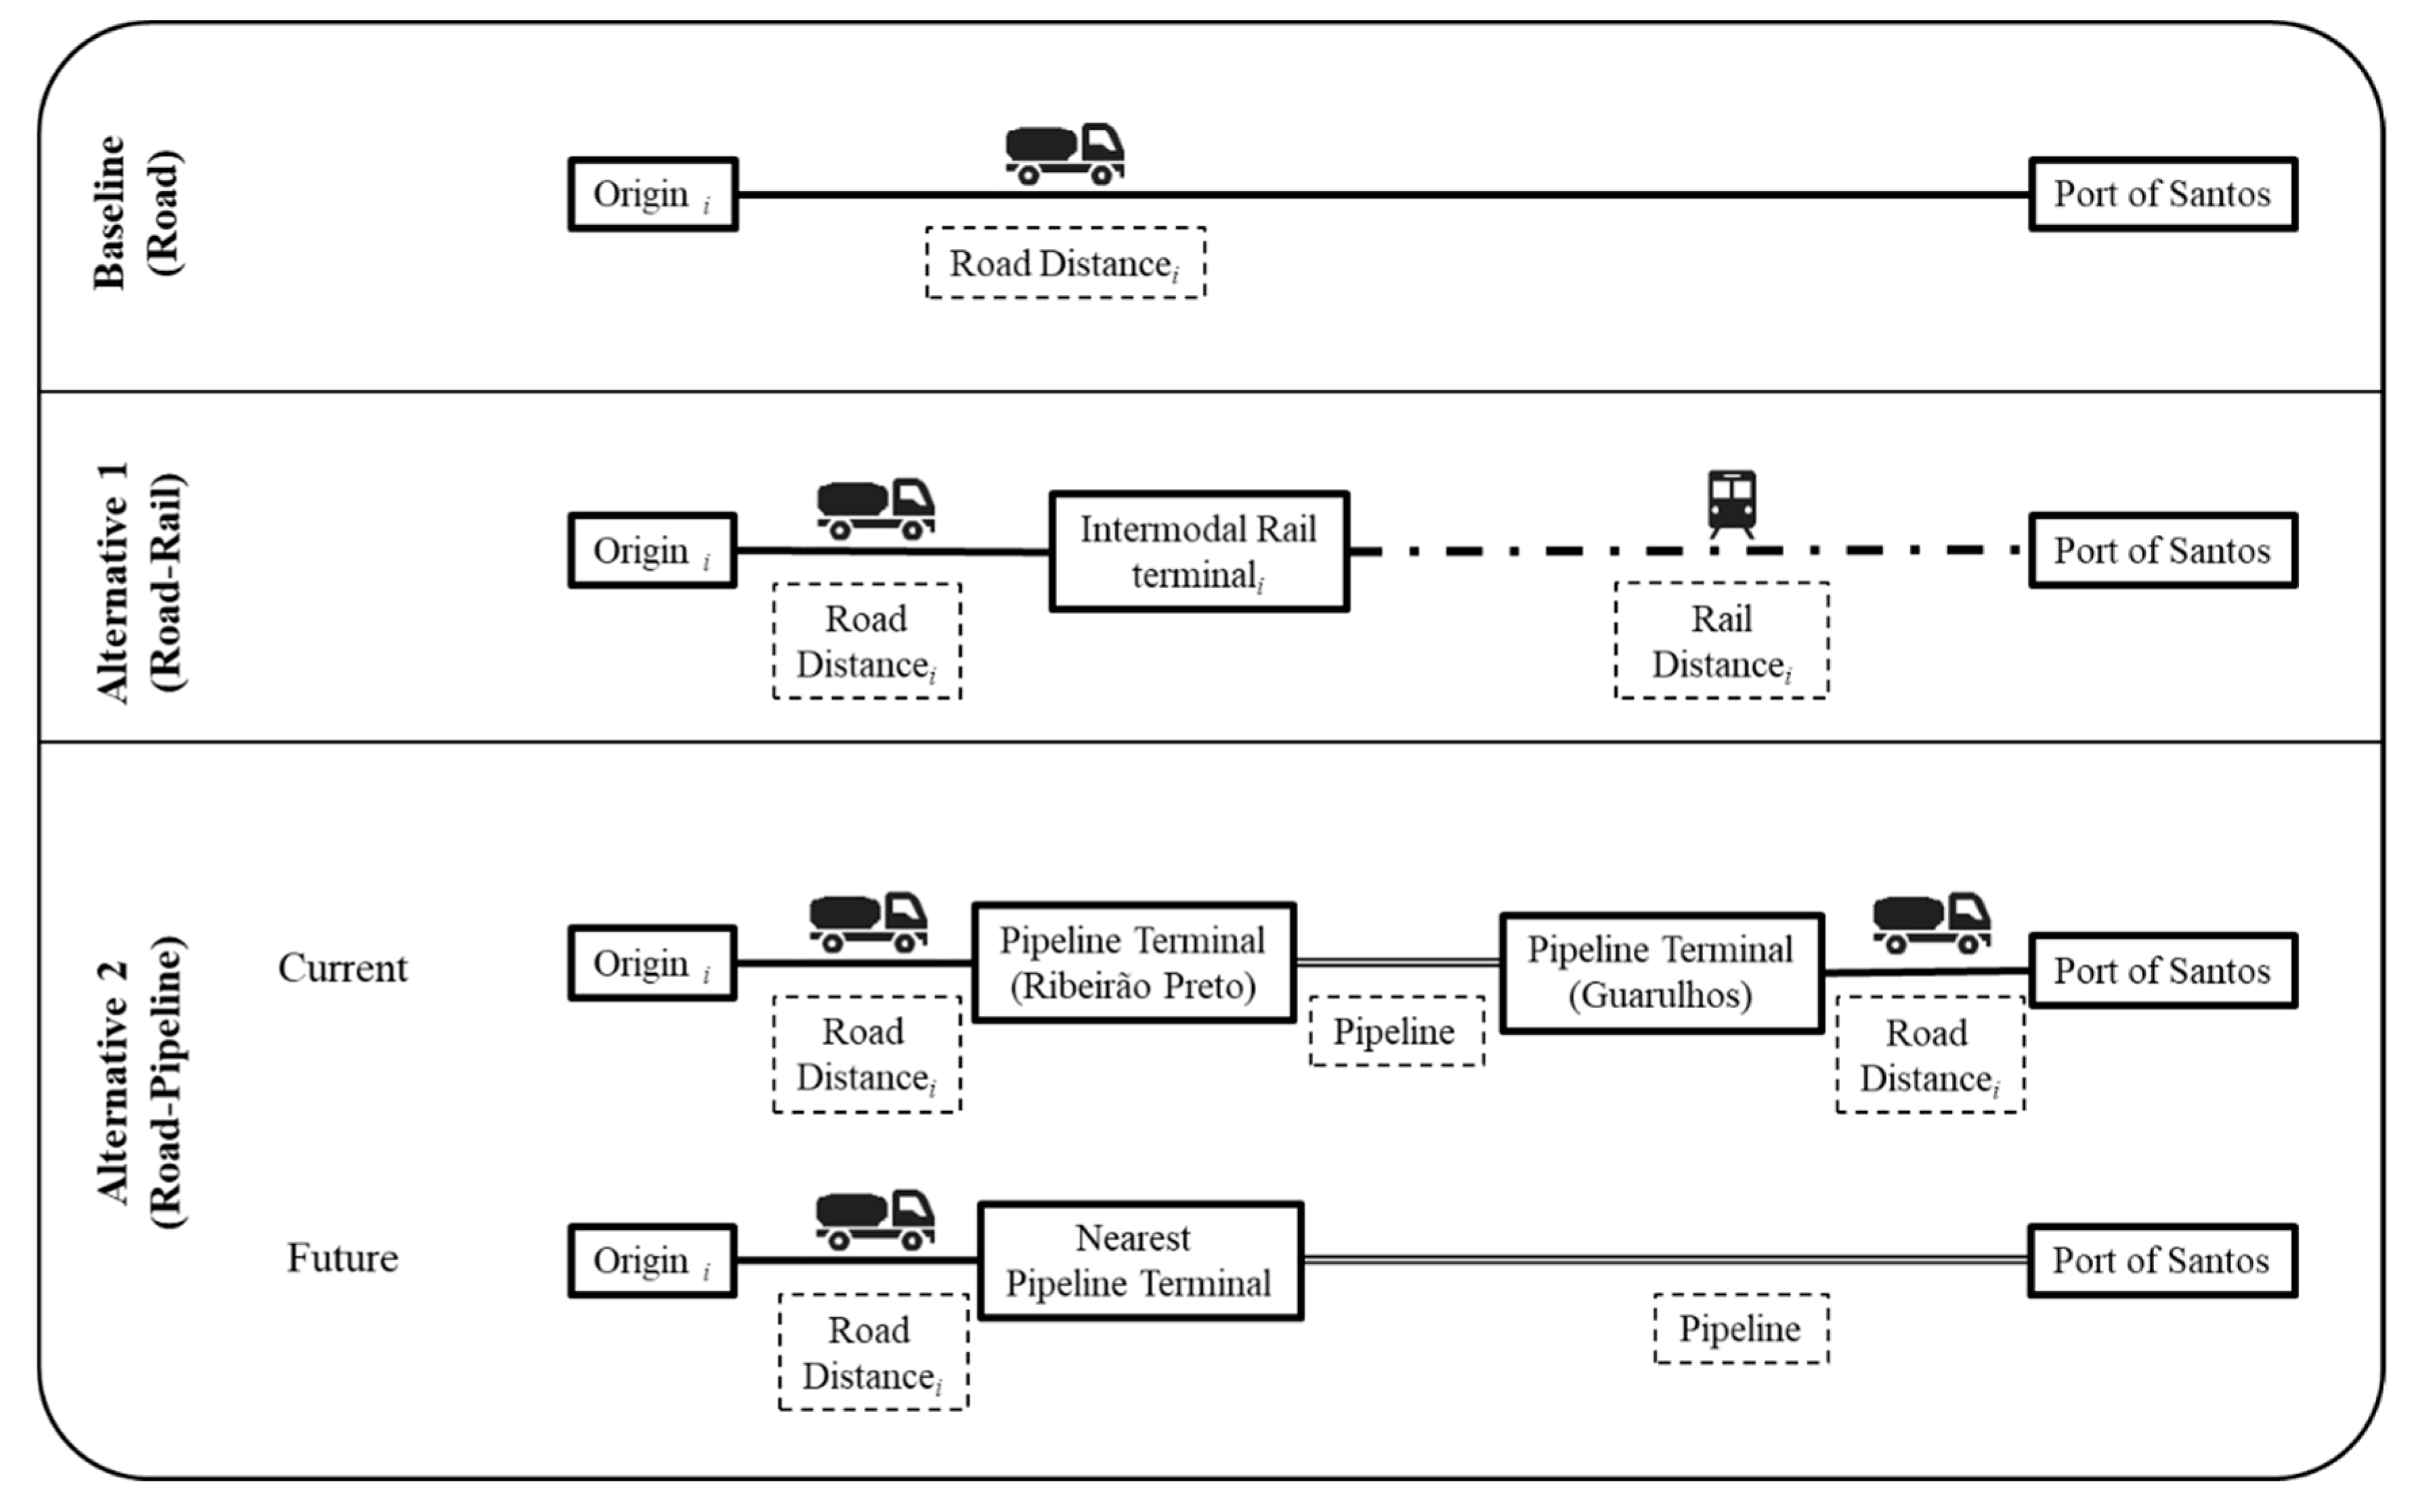
Emissions from diesel consumption during ethanol transportation from the mill to the port are measured considering three alternative scenarios. Emissions from road transportation, which is the most commonly used mode in Brazil, are initially calculated. This is considered the “Baseline scenario” in this study. The possibilities of intermodal transportation are considered alternative scenarios for assessing the reduction potential relative to the baseline scenario. “Intermodal alternative scenario 1” considers the road–rail option for each origin. Conversely, “Intermodal alternative scenario 2” refers to the use of pipelines (in the first case, considering the pipeline already existing, and in the second case, adding the planned stretch, which should reach the port of Santos).
Figure 3 shows the flows analyzed in each scenario and all respective modalities of transportation.
Similarly to [
6], domestic rail and truck are assumed to have a 100% empty backhaul (i.e., all vehicles return empty from the destination to the point of origin). This is a realistic assumption, since the vehicles transporting ethanol are specific, and cannot transport other types of cargo.
3.2. Case Description
Brazil is the largest producer of bioethanol from sugarcane in the world. The country harvested approximately 643 million tons of sugarcane, produced approximately 35 million cubic meters of ethanol, and exported almost 2 million liters of ethanol in the 2019–2020 crop year [
31]. The state of São Paulo accounted for approximately 53% of ethanol produced and 93.5% of ethanol exported in that same crop year [
31]. There is a solid external market, where the main importers were the United States (66%), Jamaica (10%), South Korea (5%), El Salvador (4%), Holland (3%) and Costa Rica (3%). The consumption of ethanol by passenger cars in Brazil had exponentially increased since the introduction of flex-fuel technology, in 2003. Besides that, ethanol is also mixed with gasoline (in a proportion of 27% since 2015) [
31].
The analysis of CO
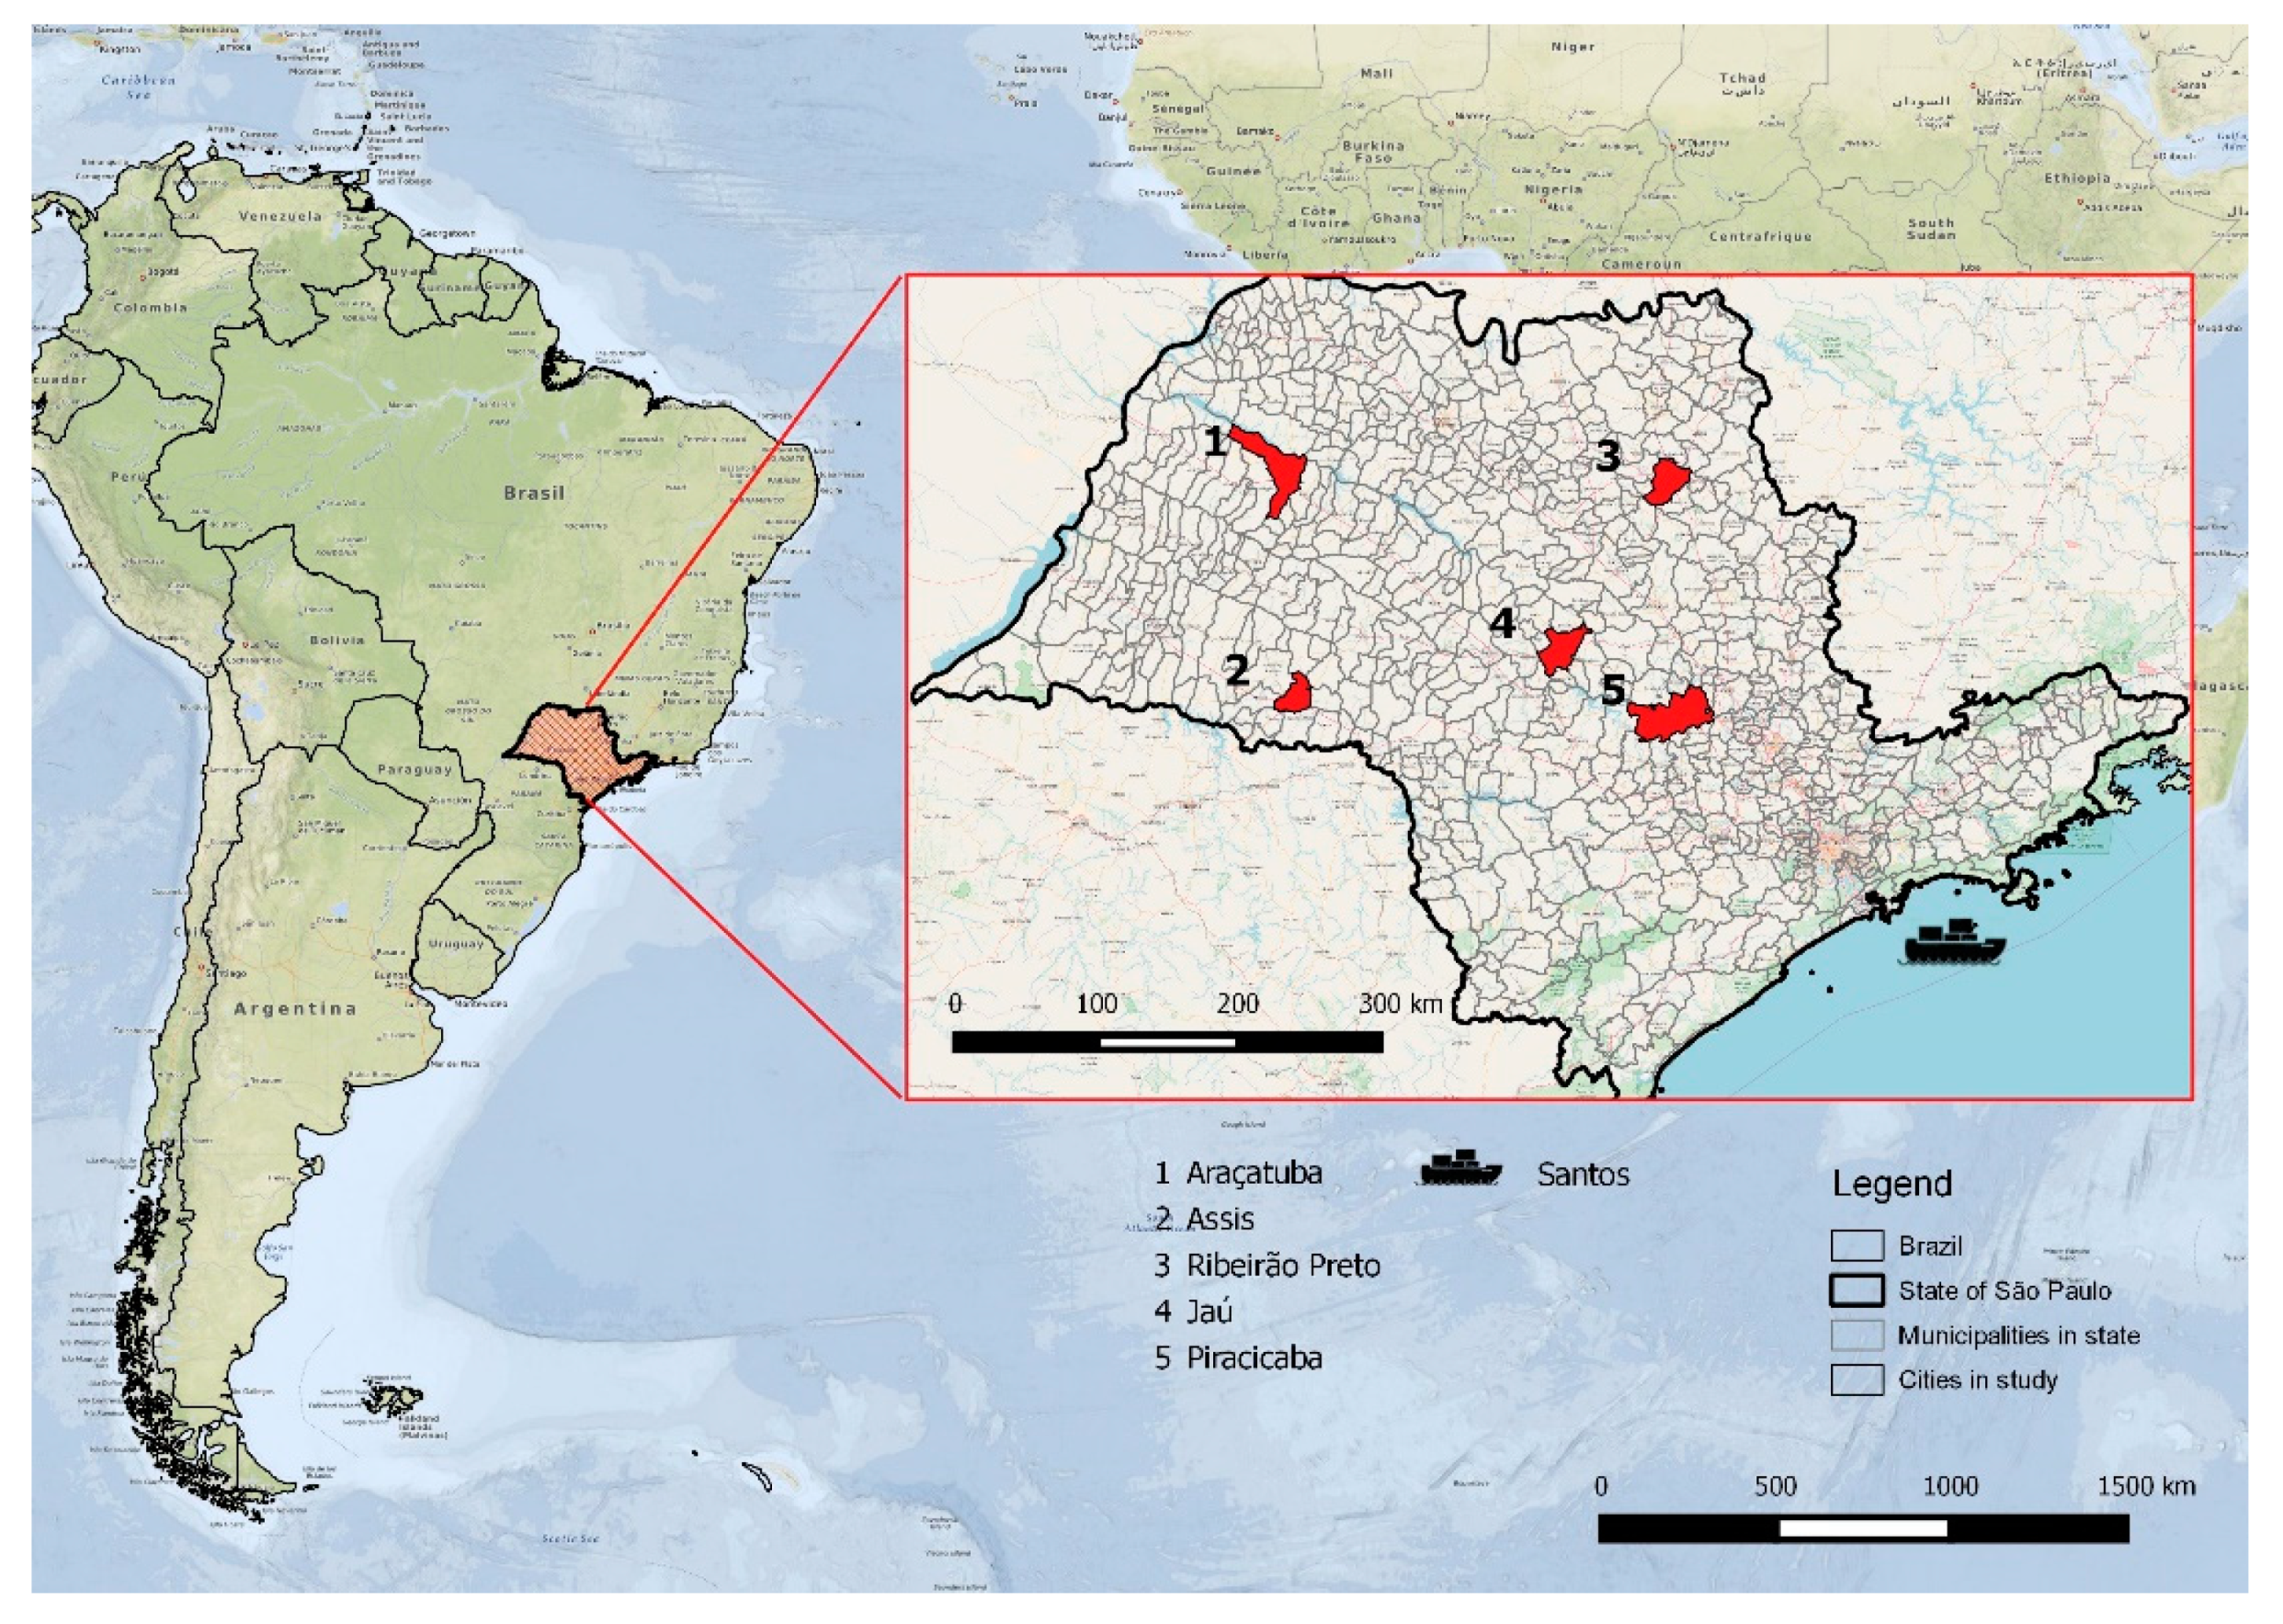
2 emissions in the three logistics stages was applied to five different origins, which are key sugarcane-producing regions of the state of São Paulo, identified in red in
Figure 4. These regions were chosen given their importance in the national production of cane and the availability of data from an intentional sample. The destination is the port of Santos, the main ethanol export port, accounting for approximately 82% of the total volume exported.
3.3. Input Parameters
Variations in CO2 emissions as a function of the sugarcane-producing region were modeled based on a set of primary and secondary data and some assumptions.
To calculate the “Stage 1” emissions, data regarding diesel consumption in “Agricultural management” and the yield of the five study regions are presented in
Table 1. In Brazil, 1 ton of cane produces between 85 and 90 L of ethanol [
32]. We assumed the conversion factor of 85 L/ton [
33].
The distances traveled by truck to transport sugarcane from the field to the mill (Stage 2) vary between regions, ranging from 16 to 17 km (according to the primary data collected). Among others, the most common type of vehicle used in this transportation is the so-called “Romeo-and-Juliet”, a nine-axle turnpike double. The average load carried by this type of vehicle is approximately 58 t, and the average diesel consumption is assumed to be 16 mL/(t.km) [
32].
Stage 3 emissions consider ethanol transportation from the five sugarcane-producing regions to the port of Santos. The distances traveled are a function of the mode of transportation (only road, road–rail, or road–pipeline) available in each origin–destination pair. Road distances were assessed using the website Google Maps, and the rail distances were assessed based on information provided by Rumo-ALL [
35] and by Ferrovia Centro-Atlântica [
36].
Each origin represents a set of the main producing cities of that region. Accordingly, distances are calculated as the average distance between this set of municipalities and the destination (directly to the port or, alternatively, to an intermodal rail or pipeline terminal).
Table 2 outlines the average distances between each region of origin/sugarcane ethanol mill (represented by a set of municipalities) and the port of Santos, corresponding to the mode of transportation in each study scenario. In the baseline scenario (most commonly found in Brazil), only the road option is considered. In this case, ethanol is primarily transported by seven-axle bi-train vehicles able to haul two tanks containing 22,000 L of ethanol each, and with an average diesel consumption of 2.10 km/L.
Because ethanol rail transportation is not commonly used for exporting ethanol, this modal option corresponds to “Alternative scenario 1”. In this case, road sections interconnecting the mill and the nearest intermodal rail terminal must still be used. For the selection of the railway terminal, the criterion of the existence of a minimum infrastructure for the transshipment of ethanol, such as a distribution terminal in the municipality, for example, was adopted. This does not mean, however, that there is already a complete infrastructure available for the rail transport of ethanol. Eventually, investment in infrastructure would be necessary to enable rail transshipment in the municipality selected.
The use of pipelines to transport ethanol is a recent occurrence in Brazil. The first phase of the ethanol pipeline infrastructure began operations in 2013. Currently, pipelines are used to distribute ethanol in the domestic market. Due to the potential for ethanol export logistics, pipeline transportation corresponds to “Alternative scenario 2”.
In this scenario, two possibilities are considered:
- (i)
“Current”: corresponds to using the already existing and operating pipeline network. In this case, ethanol is transported in three sections: (a) a road stretch from each of the five ethanol-producing regions to the pipeline terminal in Ribeirão Preto; (b) transportation in the pipeline system (Ribeirão Preto-Guarulhos); and (c) road transportation from the pipeline terminal of Guarulhos to the port of Santos;
- (ii)
“Future”: corresponds to the expected pipeline expansion to the port of Santos in the coming years. In this case, the final road stretch is replaced by the pipeline, which would reach the port. This scenario also considers the distance from the pipeline terminal to the nearest distribution terminal of ethanol (such as Paulínia).
The emission factors considered in the calculations (
Table 3) reflect the Brazilian standards for diesel composition and vehicles (both road and rail). In general, emission factors for diesel should not exhibit substantial short-term changes.
There is no direct fuel consumption during pipeline transportation, as the system is operated by electric pumps. Thus, in this study, CO
2 emissions from pipeline transportation were measured considering the emission factor of 0.0039 kgCO
2/m³.km, which is based on the emission factor of electric power generation in Brazil and the energy consumption of the pipeline pumps [
5].
4. Results
The findings confirm that the levels of CO
2 emission from the ethanol supply chain vary by ethanol-producing region, as a function of the different levels of fuel consumption in the logistics stages analyzed.
Table 4 and
Figure 5 show the CO
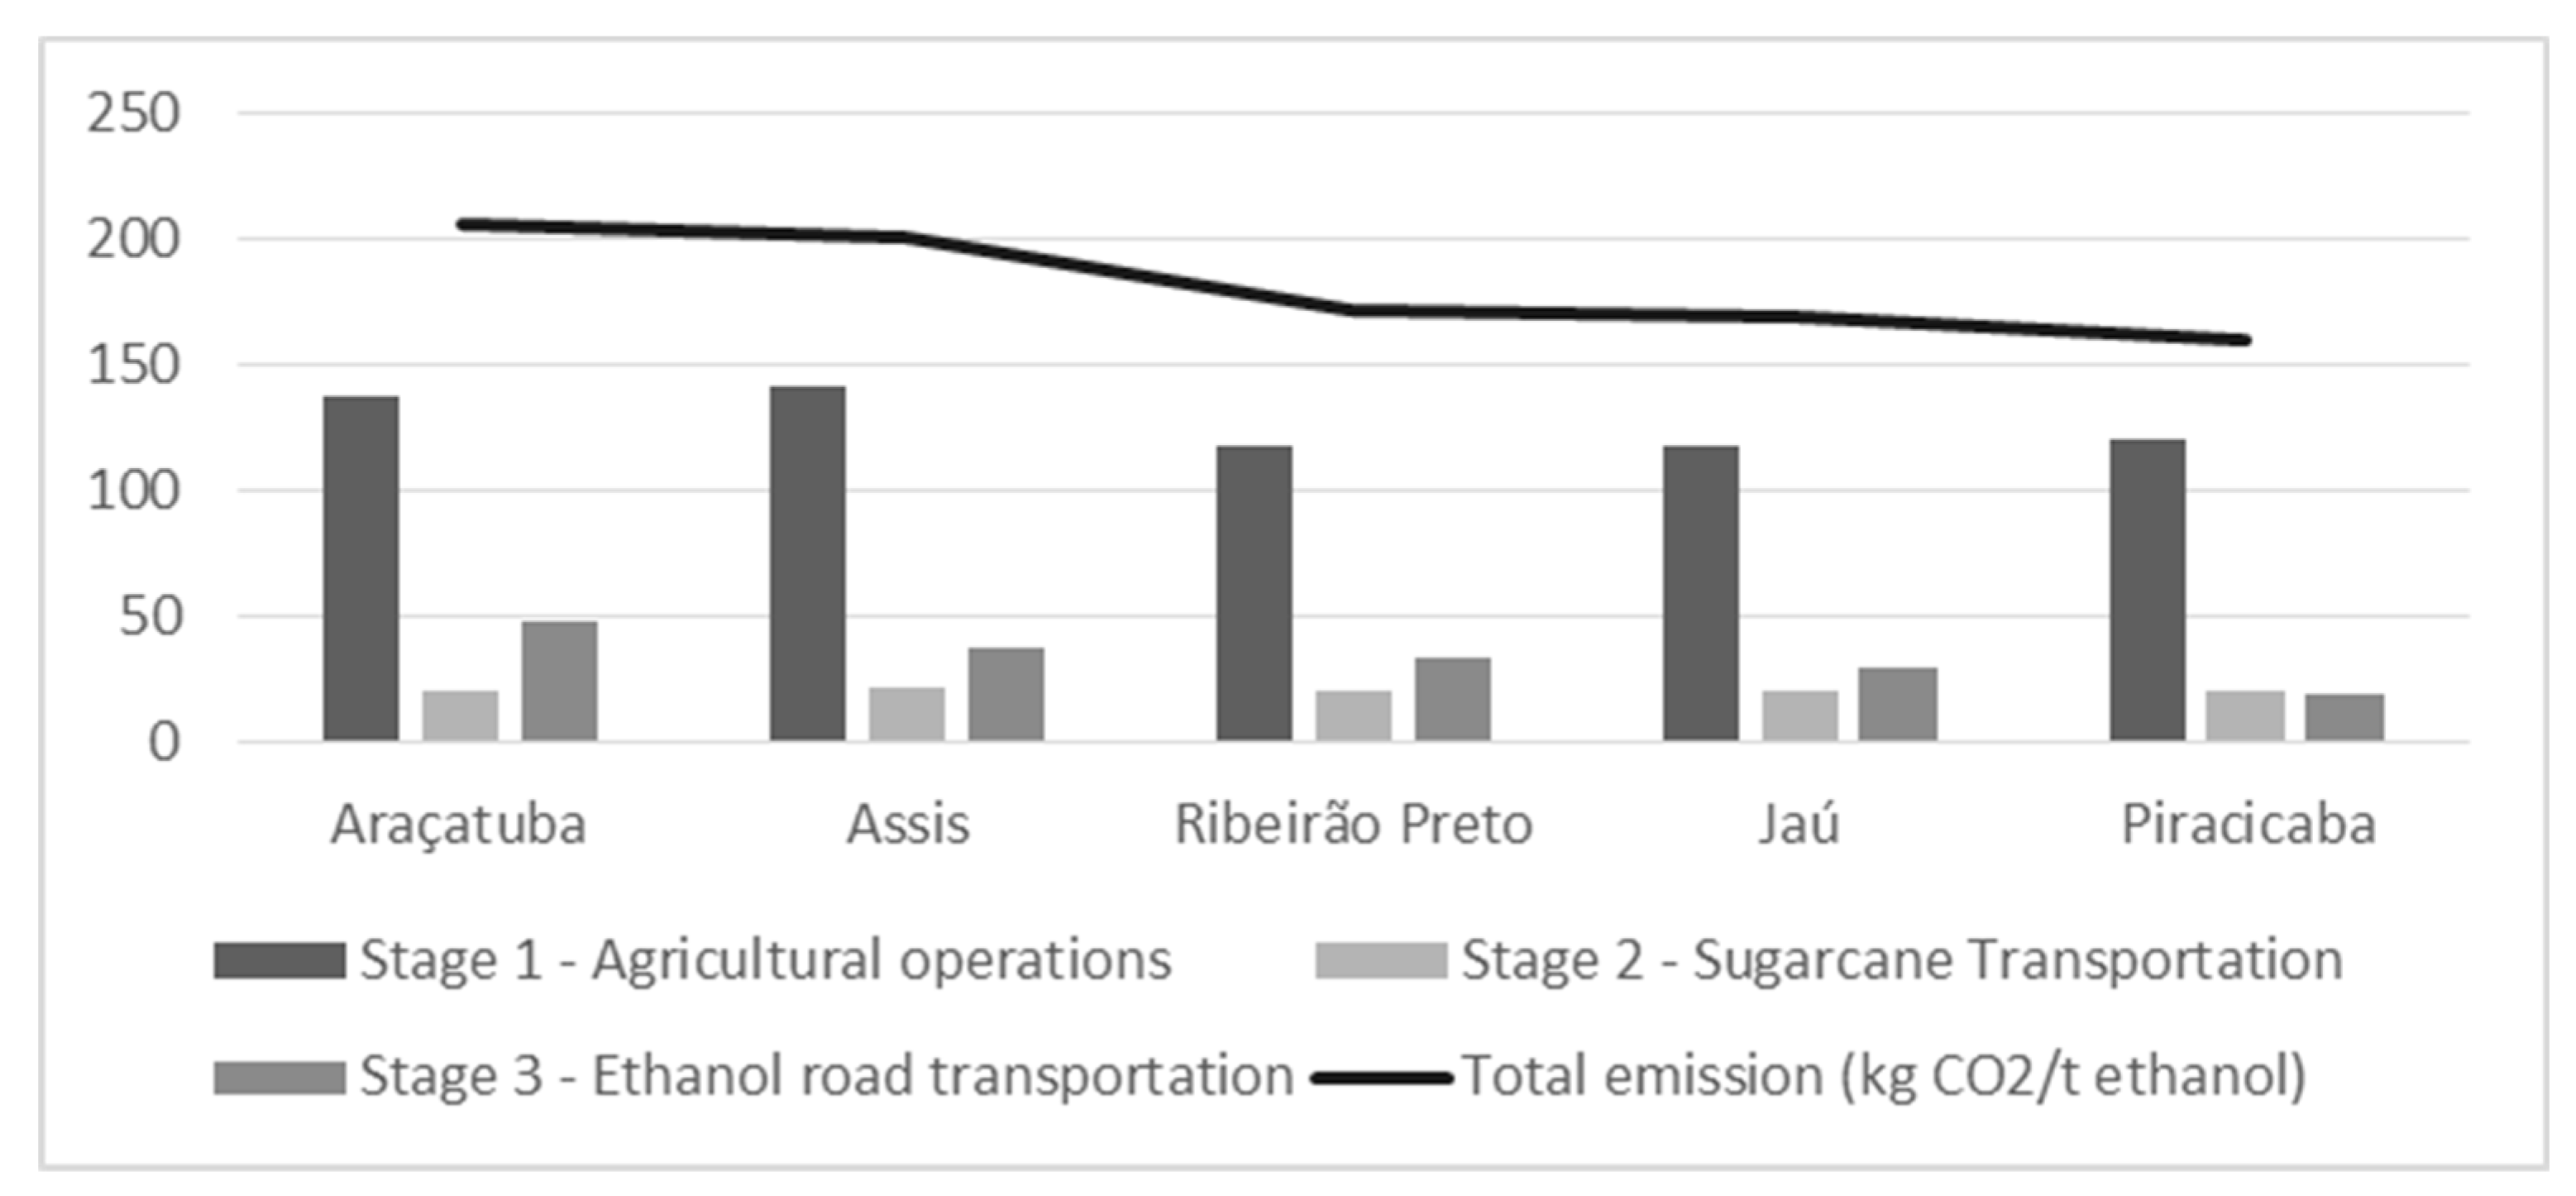
2 emissions from fuel consumption in the three ethanol logistics stages for the five export corridors analyzed, quantified using Equations (1)–(3), respectively. Considering the “Baseline scenario” (only road transportation), the total carbon emissions of the three logistics stages analyzed range from 159 to 205 kg CO
2/t ethanol (nearly 30% higher), as shown in the last line (“Total”) in
Table 4.
Fuel consumption during machine and truck operations in the field (“Stage 1–Agricultural management”) accounts for most of the emissions from the logistics stages analyzed in the study region. On average, agricultural management operations emit approximately 127 kg CO2/t ethanol, accounting for 70% of total CO2 emissions from biofuel logistics. The region with the lowest emission levels in stage 1 is Ribeirão Preto, with approximately 117 kg CO2/t ethanol. Conversely, the ethanol-producing region of Assis has the highest emission levels according to the calculations, approximately 142 kg CO2/t ethanol. The following factors are some of the determinants of this difference in emissions from the field: natural factors (including terrain and soil characteristics), type of production system adopted (number of rows, for example) and characteristics of the machines and trucks used (including age, state of conservation and yield), among others.
The logistics Stage 2 has the lowest emissions owing to the shorter distances involving sugarcane transportation from the farm to the mill. The average emissions at this stage are approximately 20 kg CO2/t ethanol, and account for approximately 11% of total emissions. Furthermore, no significant differences in emission levels are detected between the study regions: the average dispersion is merely 0.5 kg CO2/t ethanol. This occurs because the average distance between the production sites and the mill is very small in all cases analyzed. In general, the sugarcane-hauling truck travels 16.4 km on average, with a 1 km deviation. Because sugarcane has a high volume and low weight, using this type of transportation over long distances is not economically viable. Therefore, sugarcane-producing regions are relatively close to sugarcane ethanol mills.
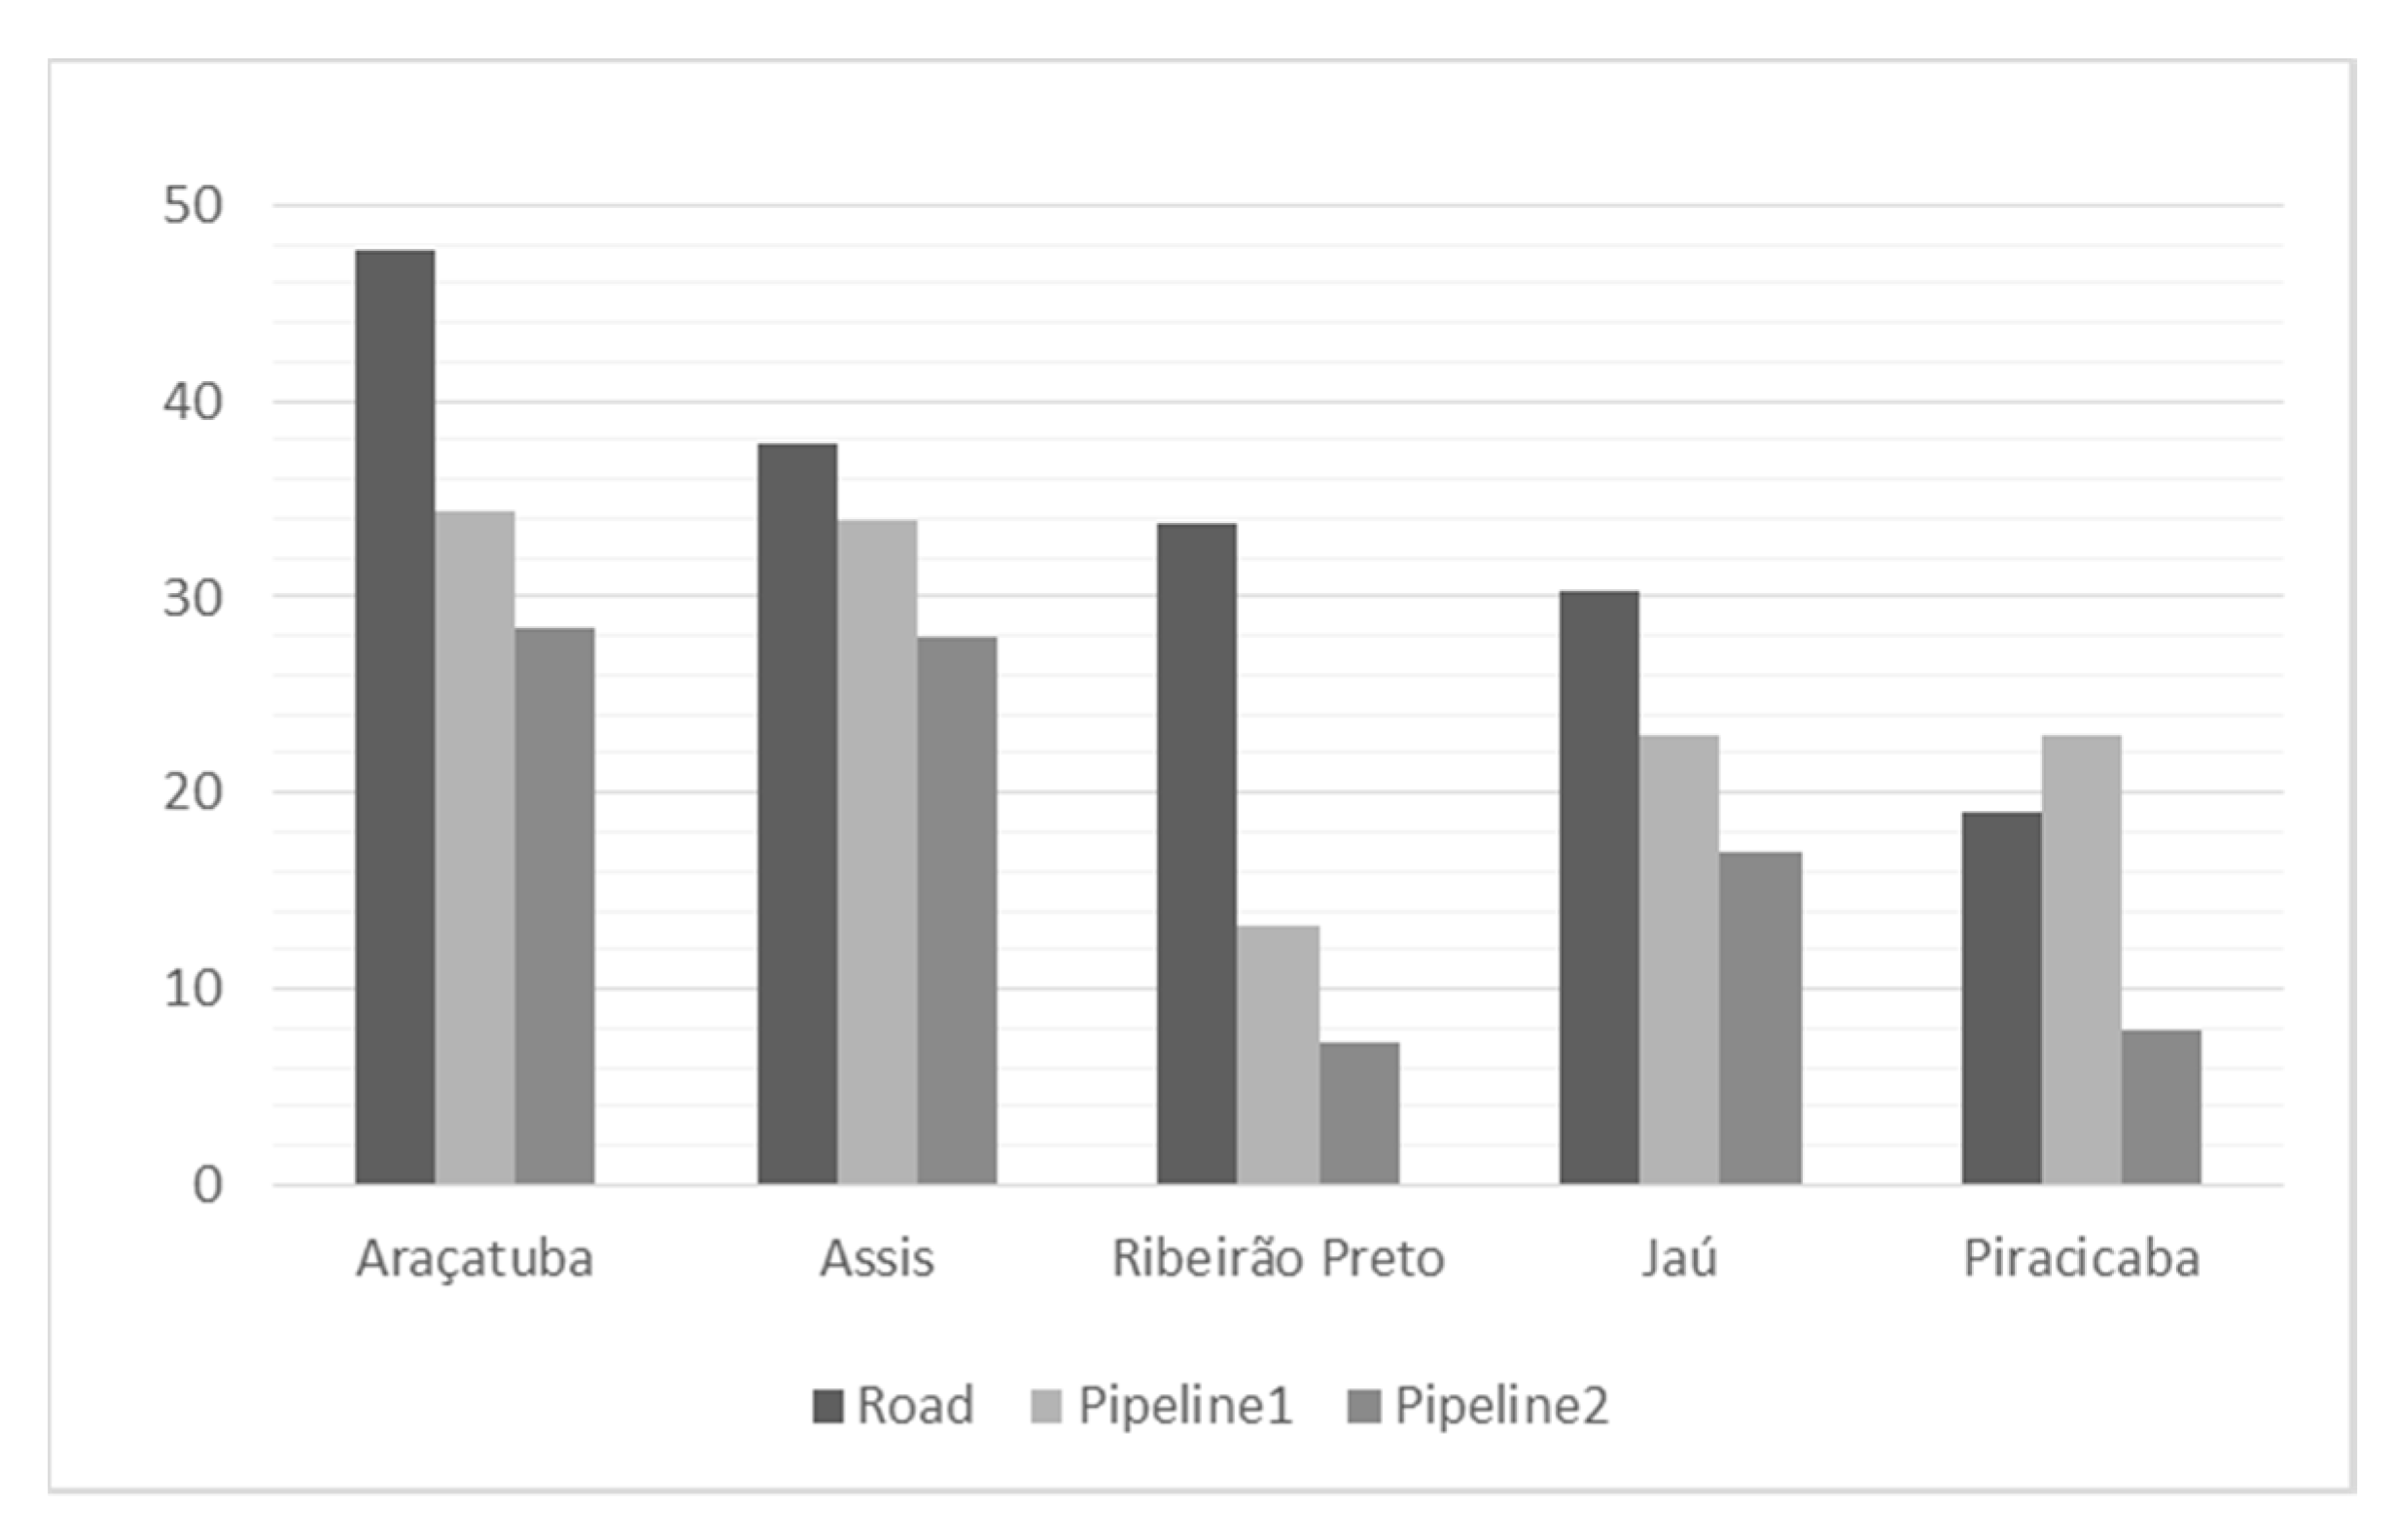
Conversely, Stage 3 (ethanol road transportation between the mill and the port) accounts for an average emission of 33 kg CO2/t ethanol, or 19% of the supply chain emissions. The fact that this stage has a greater dispersion among the corridors analyzed, resulting from different distances between the regions of origin and the port of Santos (10.5 kg CO2/t ethanol standard deviation), stands out. Therefore, although agricultural management emissions are more representative, ethanol transportation emissions ultimately determine the final ranking of corridors by total emissions.
Accordingly, the efficient management of emissions from the ethanol supply chain would indicate the region of Piracicaba as a more interesting origin for exporting ethanol, whereas regions farther to the northwest of the state, such as Araçatuba and Assis, should, in principle, prioritize ethanol distribution to the domestic market.
4.1. Scenarios of Mitigation of CO2 Emissions from Ethanol Transportation
As indicated in the methodological structure (
Section 2), two possible scenarios of the mitigation of CO
2 emissions from ethanol transportation were assessed: intermodal alternative 1 (considering the rail option) and intermodal alternative 2 (considering the pipeline option, both current and future). The findings are described below.
4.1.1. Emissions from the Road–Rail Alternative for Ethanol Transportation
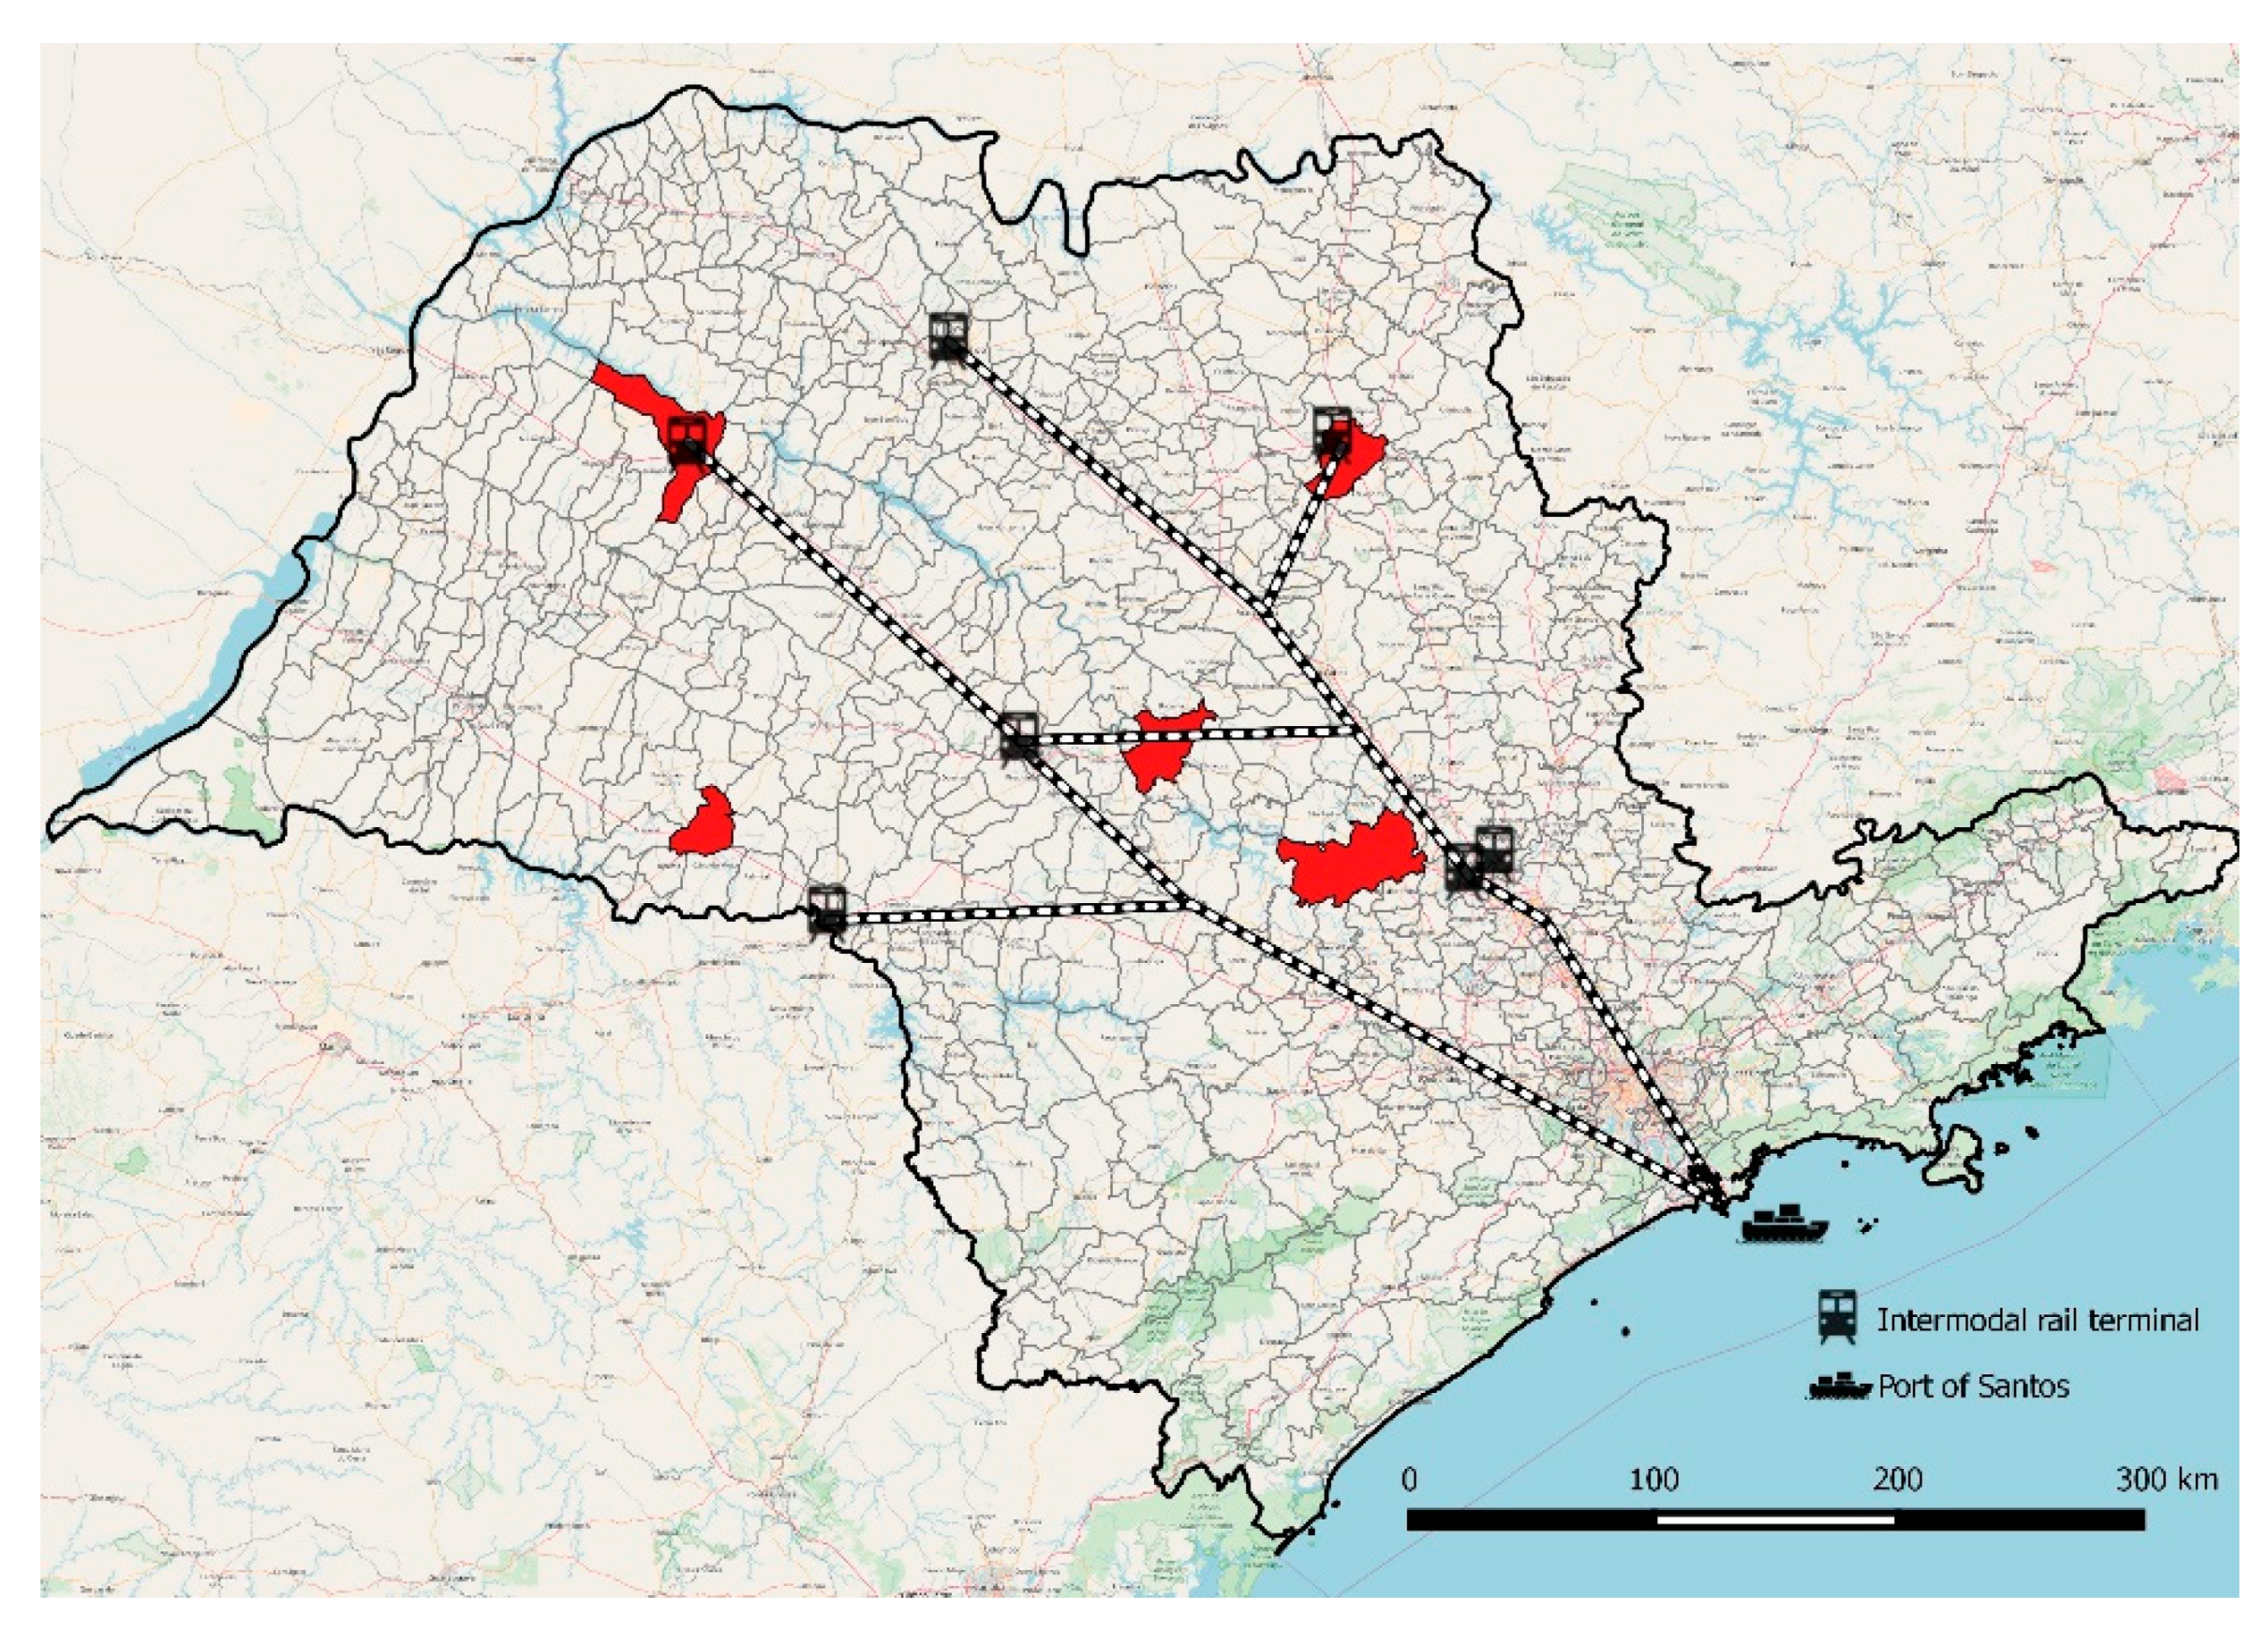
The analysis of the road–rail option for exporting ethanol (
Figure 6) indicates that the potential benefit derived from intermodal transportation in terms of mitigating emissions differs in each region of origin, and is highest in the regions farthest to the intermodal rail terminal.
The results from this scenario indicate there is a positive and direct correlation between route distance and the benefit of intermodal transportation compared to the road option, which corroborates the literature’s findings [
17,
18]. Even though all distances traveled between the origins and the port of Santos are greater in the road–rail alternative than the distances in the baseline scenario (road only), the use of railway reduces CO
2 emissions in all cases.
Furthermore, the farther the ethanol-producing region from the port of Santos, the greater the benefit in terms of reducing emissions would be when using the road–rail option.
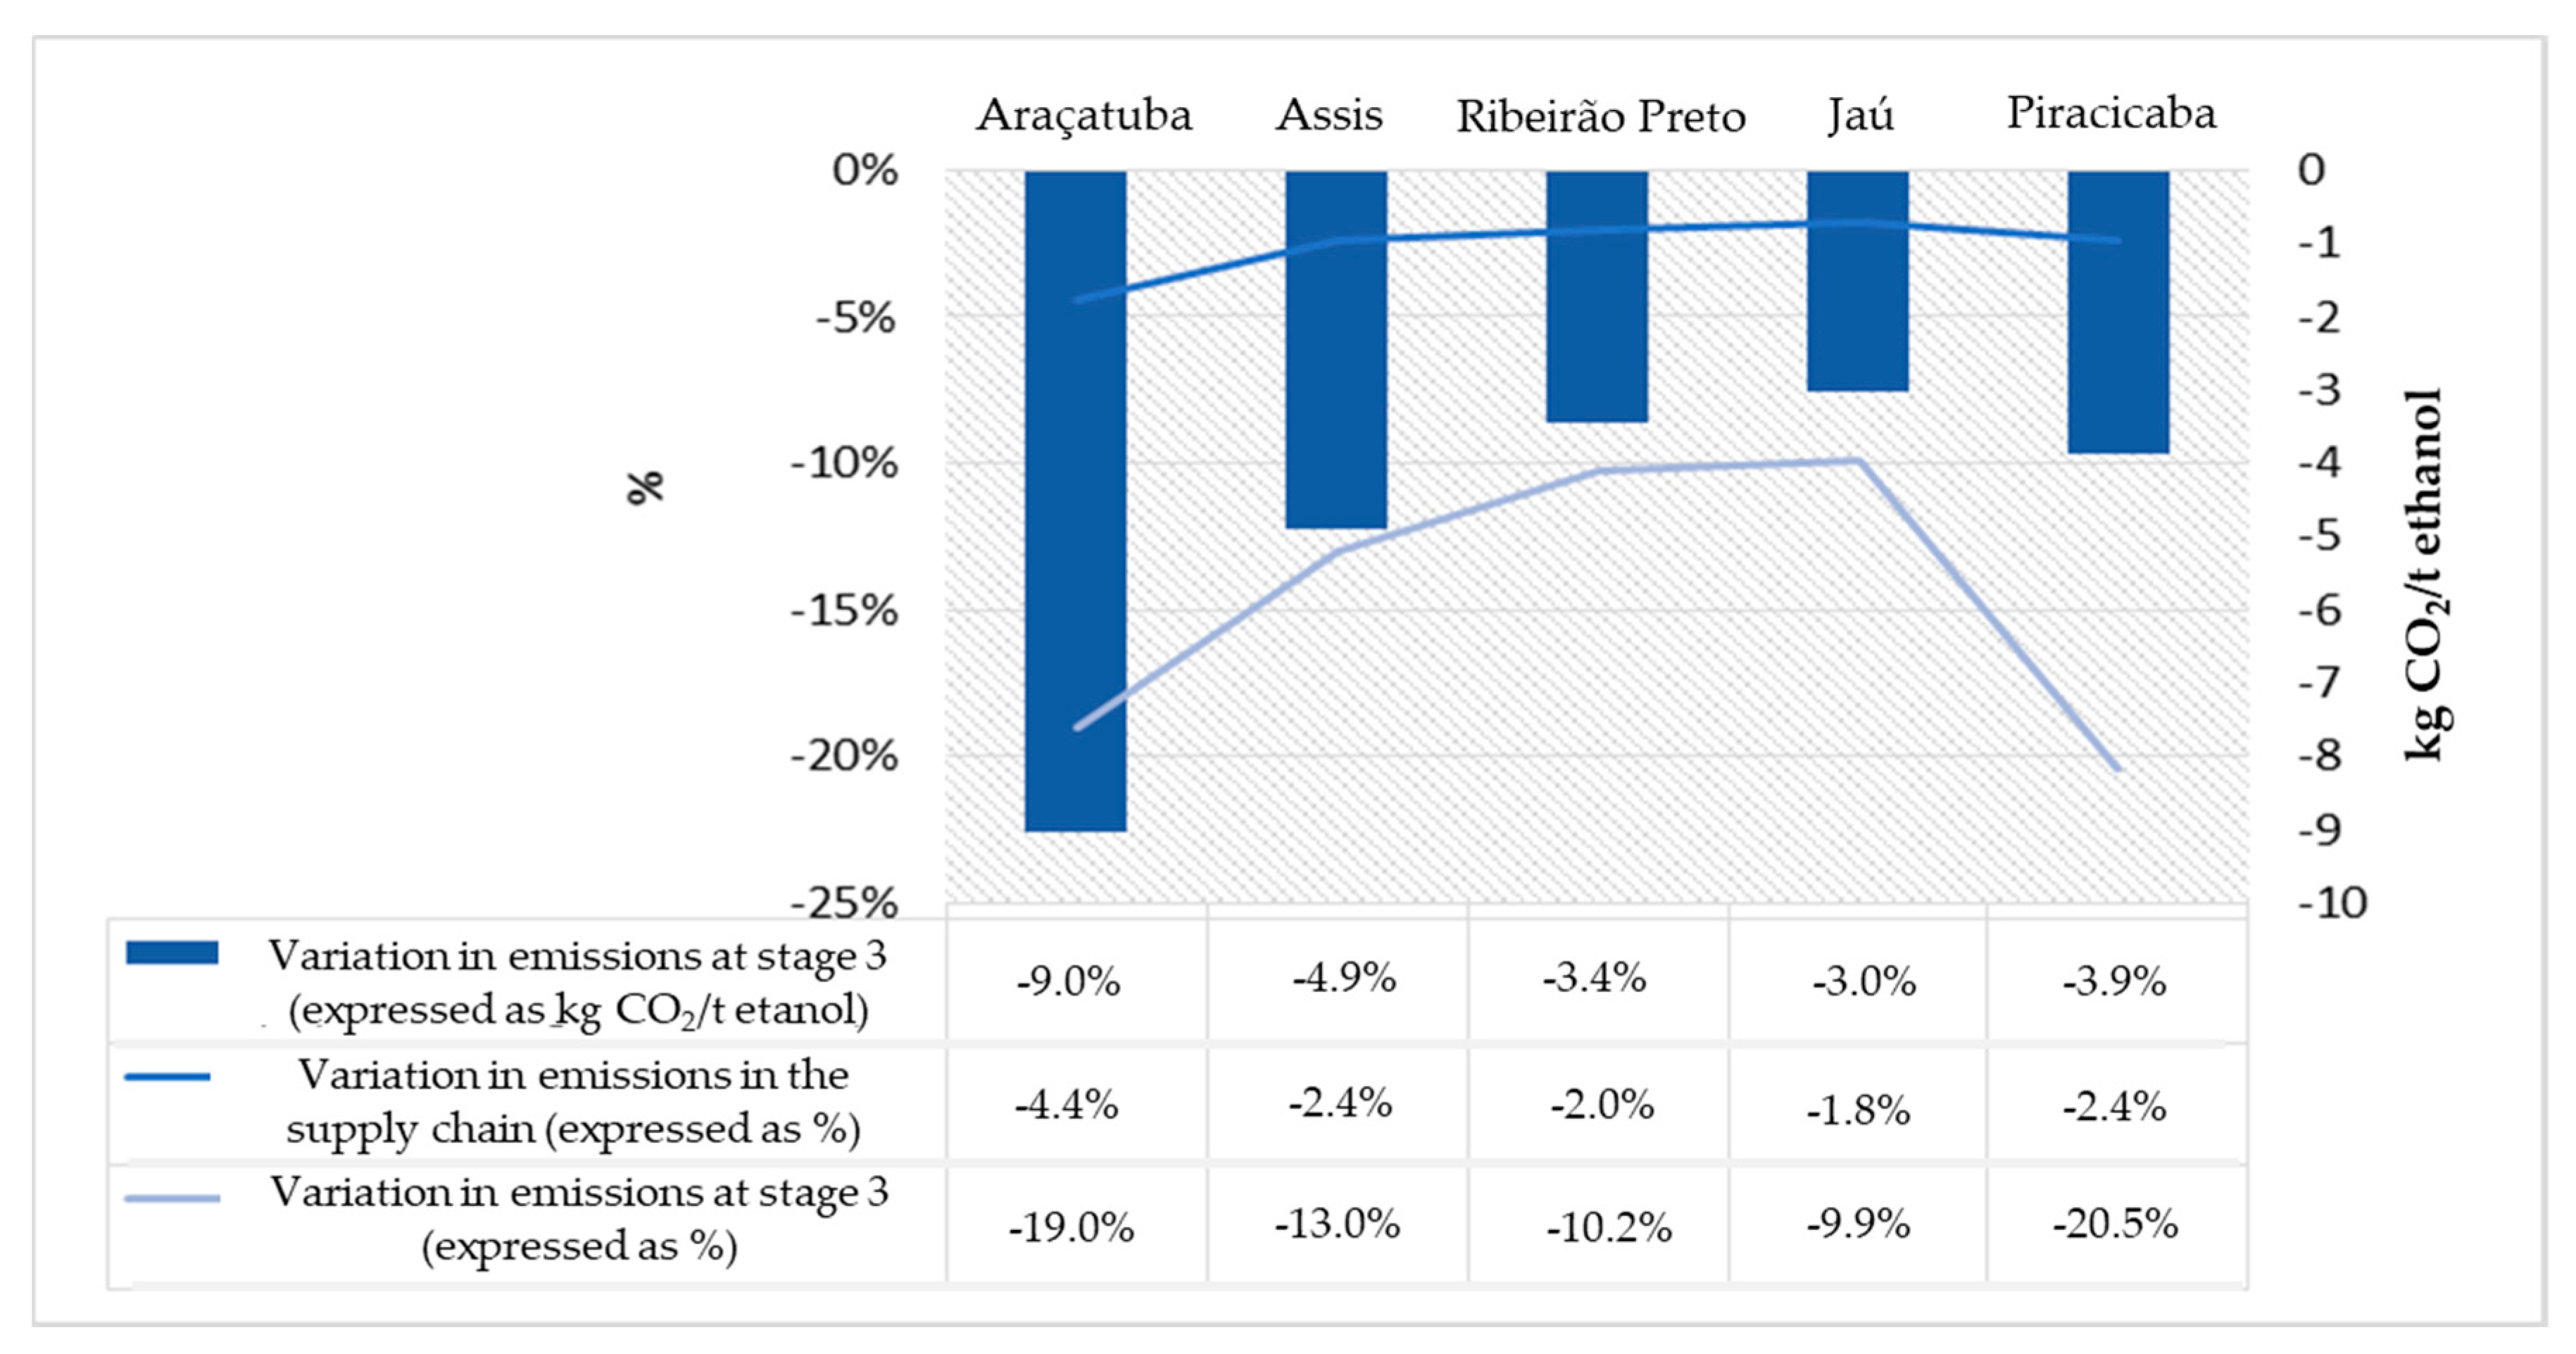
Araçatuba is the farthest ethanol-producing region from the port of Santos. The intermodal road–rail transportation for export may reduce emissions by 9 kg CO2/t ethanol. This corresponds to a 4.4% reduction from the supply chain emissions as a whole, and a 19% mitigation when considering only the emissions at stage 3 (ethanol distribution). Thus, the intermodal corridor for ethanol transportation from this region to the port of Santos can be considered an interesting alternative from the standpoint of emissions.
Figure 7 shows the results for the road–rail option for each region of origin in the baseline scenario (exclusively road transportation), indicating that the benefits of road–rail intermodal transportation should be assessed on a case-by-case basis. The absolute values are shown in
Table 5.
The high potential of percentage mitigation from the Piracicaba region at stage 3 is explained by the similarity in the road and intermodal distances involved. Differently from the other cases, in this region, the intermodality would not imply a significant increase in distances, and the benefits from rail are relatively more evident.
4.1.2. Emissions from the Road–Pipeline Alternative for Ethanol Transportation
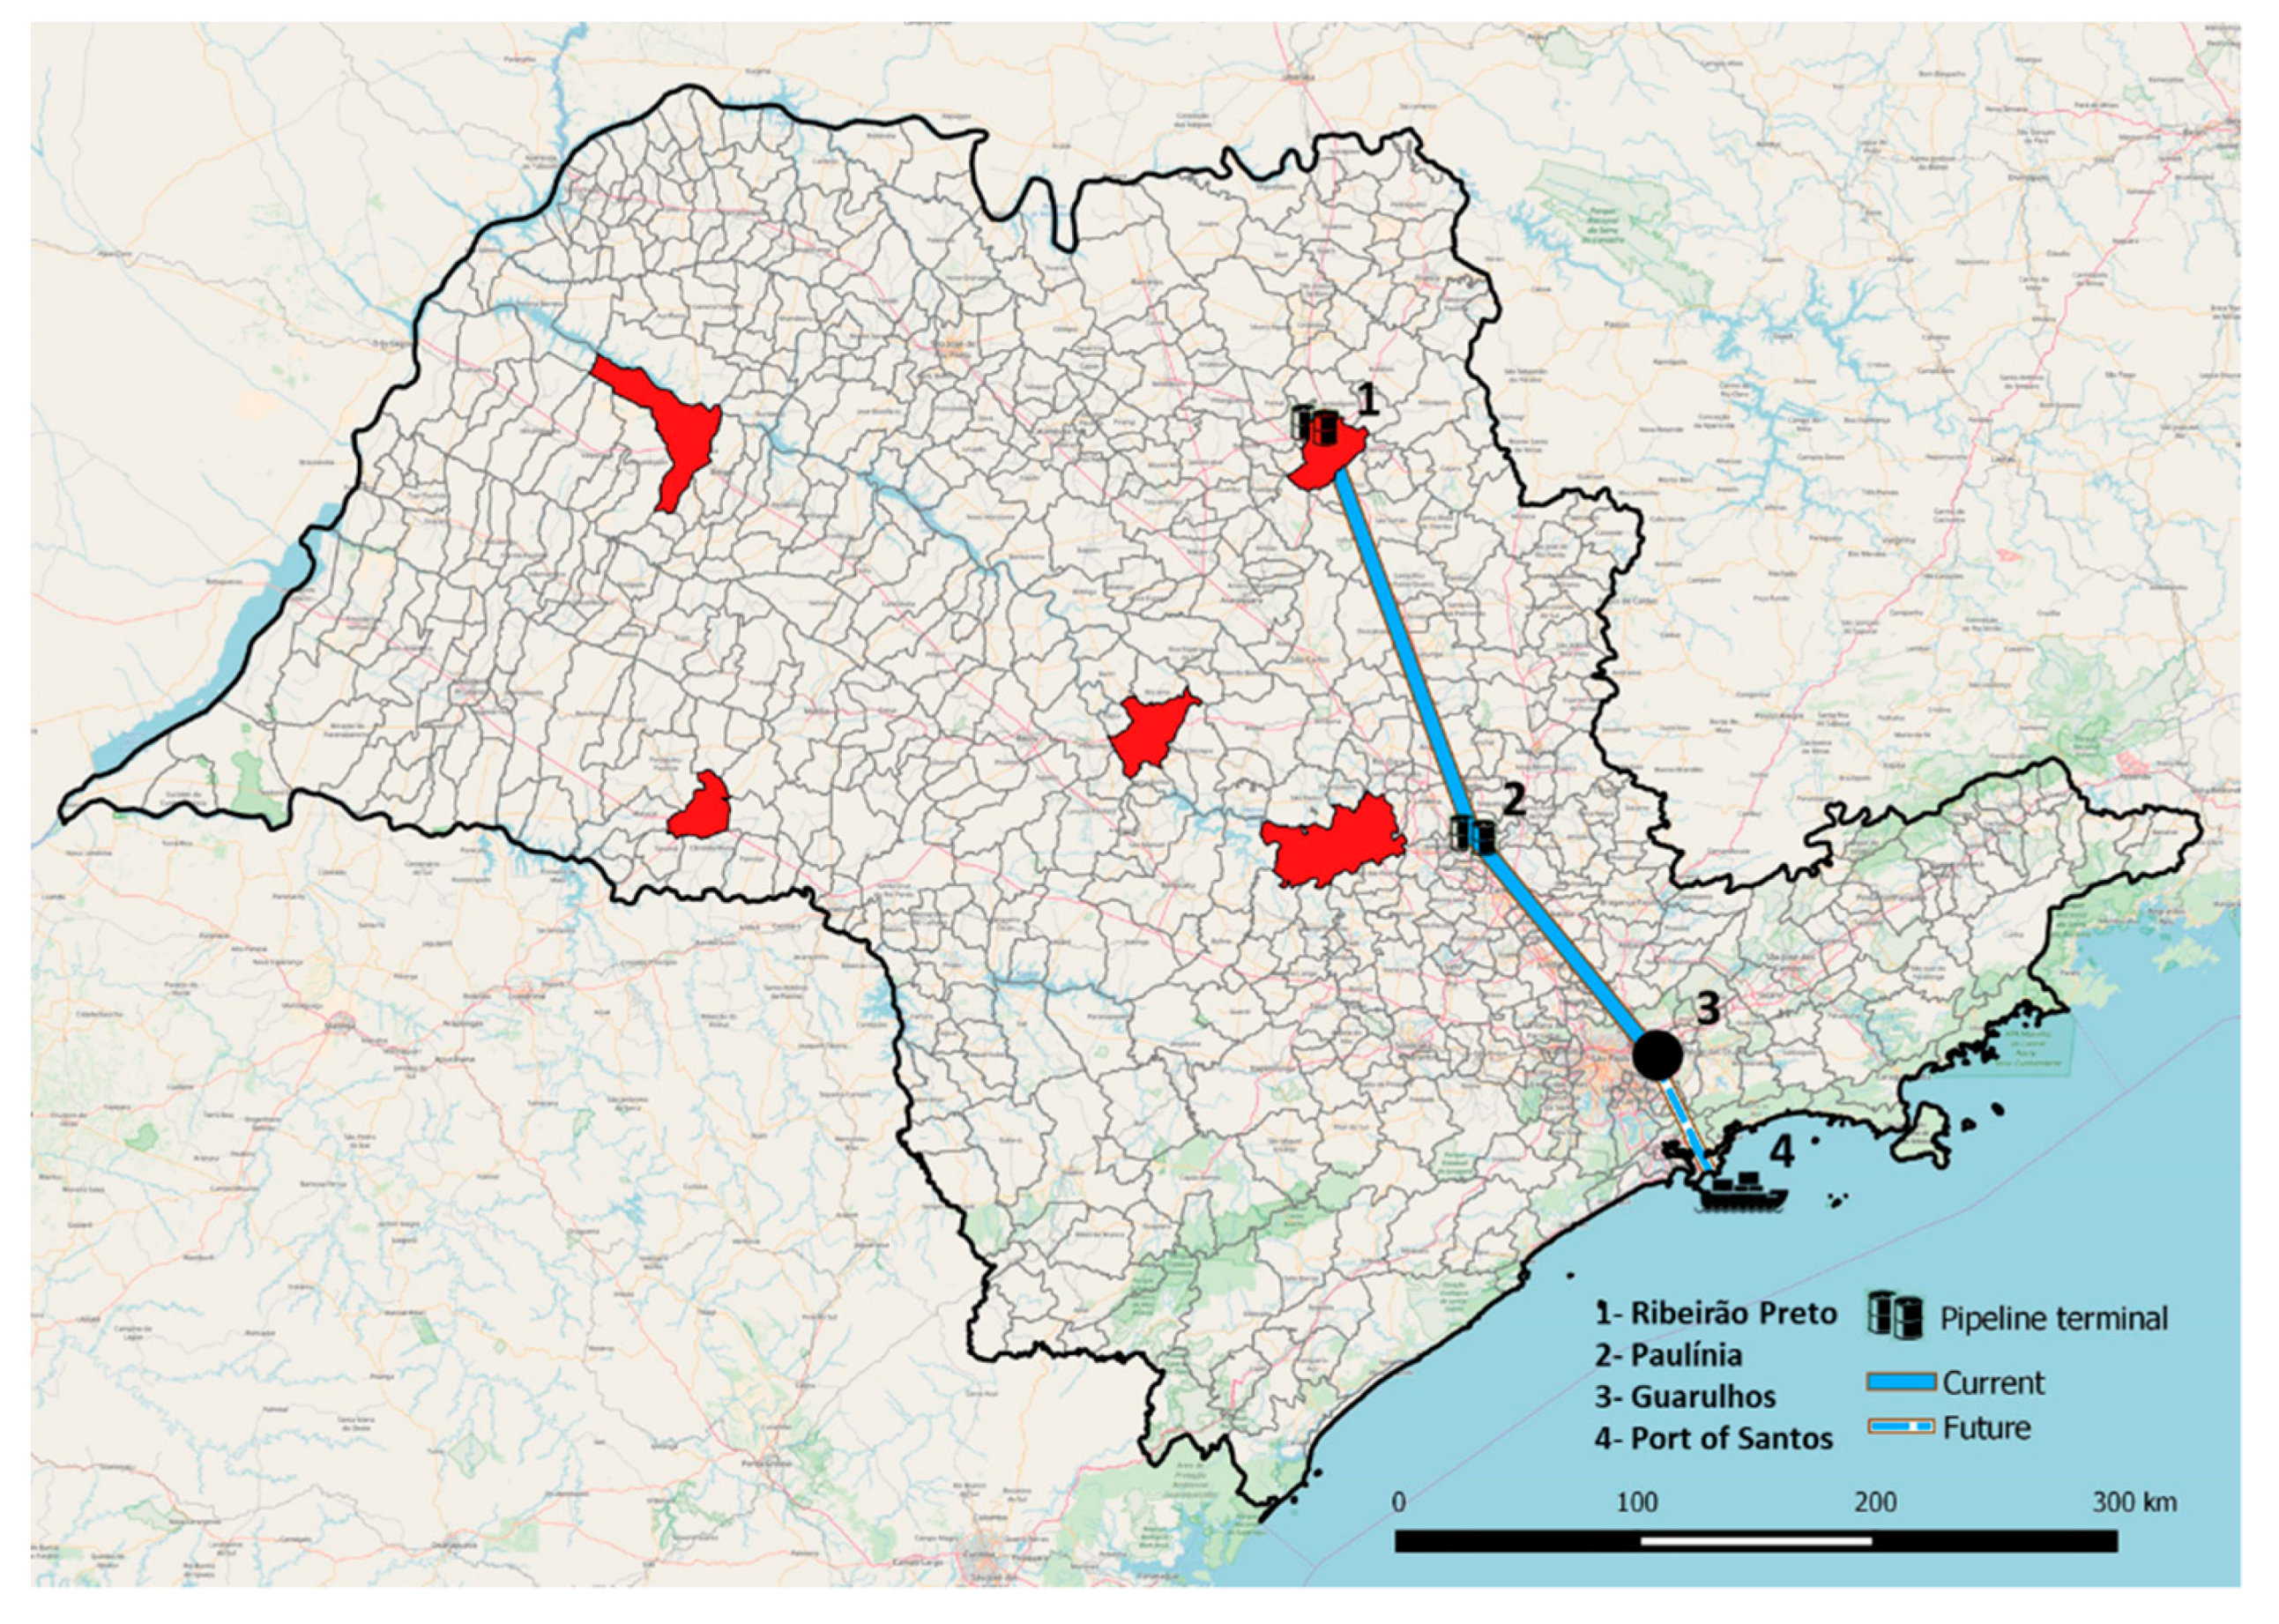
The pipeline-based intermodal logistics system for ethanol is new in Brazil, and has operated only since 2013, interconnecting all Central–South ethanol-producing regions to the main consumer markets in the states of São Paulo and Rio de Janeiro. The pipeline network is still under construction and will exceed 1300 km of pipelines when completed, reaching the port of Santos. Thus, currently, the pipeline is used mainly for ethanol distribution in the Brazilian consumer market, and the route connecting the pipeline terminals of Ribeirão Preto (origin terminal) and Paulínia (destination terminal) are the most commonly used (points 1 and 2, respectively, in
Figure 8).
Ethanol would be distributed for export through pipelines using the stretch between Ribeirão Preto and Guarulhos. The municipality of Guarulhos is approximately 98 km from Santos. Thus, the existing (“Current”) intermodal solution involves a road leg to the pipeline terminal in Ribeirão Preto, a pipeline leg to Guarulhos, and another road leg to Santos (as shown in
Figure 3 and
Figure 8).
In the “Future” pipeline scenario, two changes are assumed: (a) the pipeline network reaches the port of Santos; and (b) the pipeline terminal of origin is now allowed to be the nearest terminal to the production region. In this case, the ethanol is transported by road only in the initial stretch, until reaching the nearest pipeline terminal (in Ribeirão Preto or Paulínia). From there, the ethanol is transported by pipeline to Santos.
The findings indicate that the potential benefits of using the pipeline in terms of mitigating carbon emissions from ethanol transportation also depend heavily on the ethanol-producing region (
Figure 9). For example, the results clearly demonstrate the advantage of using the pipeline in the region of Ribeirão Preto, which would lead to 61% and 79% reductions in the ethanol transportation stages of the “Current” and “Future” scenarios, respectively. Conversely, in the region of Piracicaba, which initially benefited from rail transportation, using the current pipeline network may increase the emissions associated with this logistics stage. In this case, the road distances in the scenarios including the pipeline are longer than those of the baseline scenario. However, in the future scenario, where Paulínia would be a pipeline terminal of origin, and the pipeline network reaches Santos, the use of a pipeline becomes highly useful for reducing emissions (about 59% when compared to the baseline scenario).
4.1.3. Combined Scenario Analysis
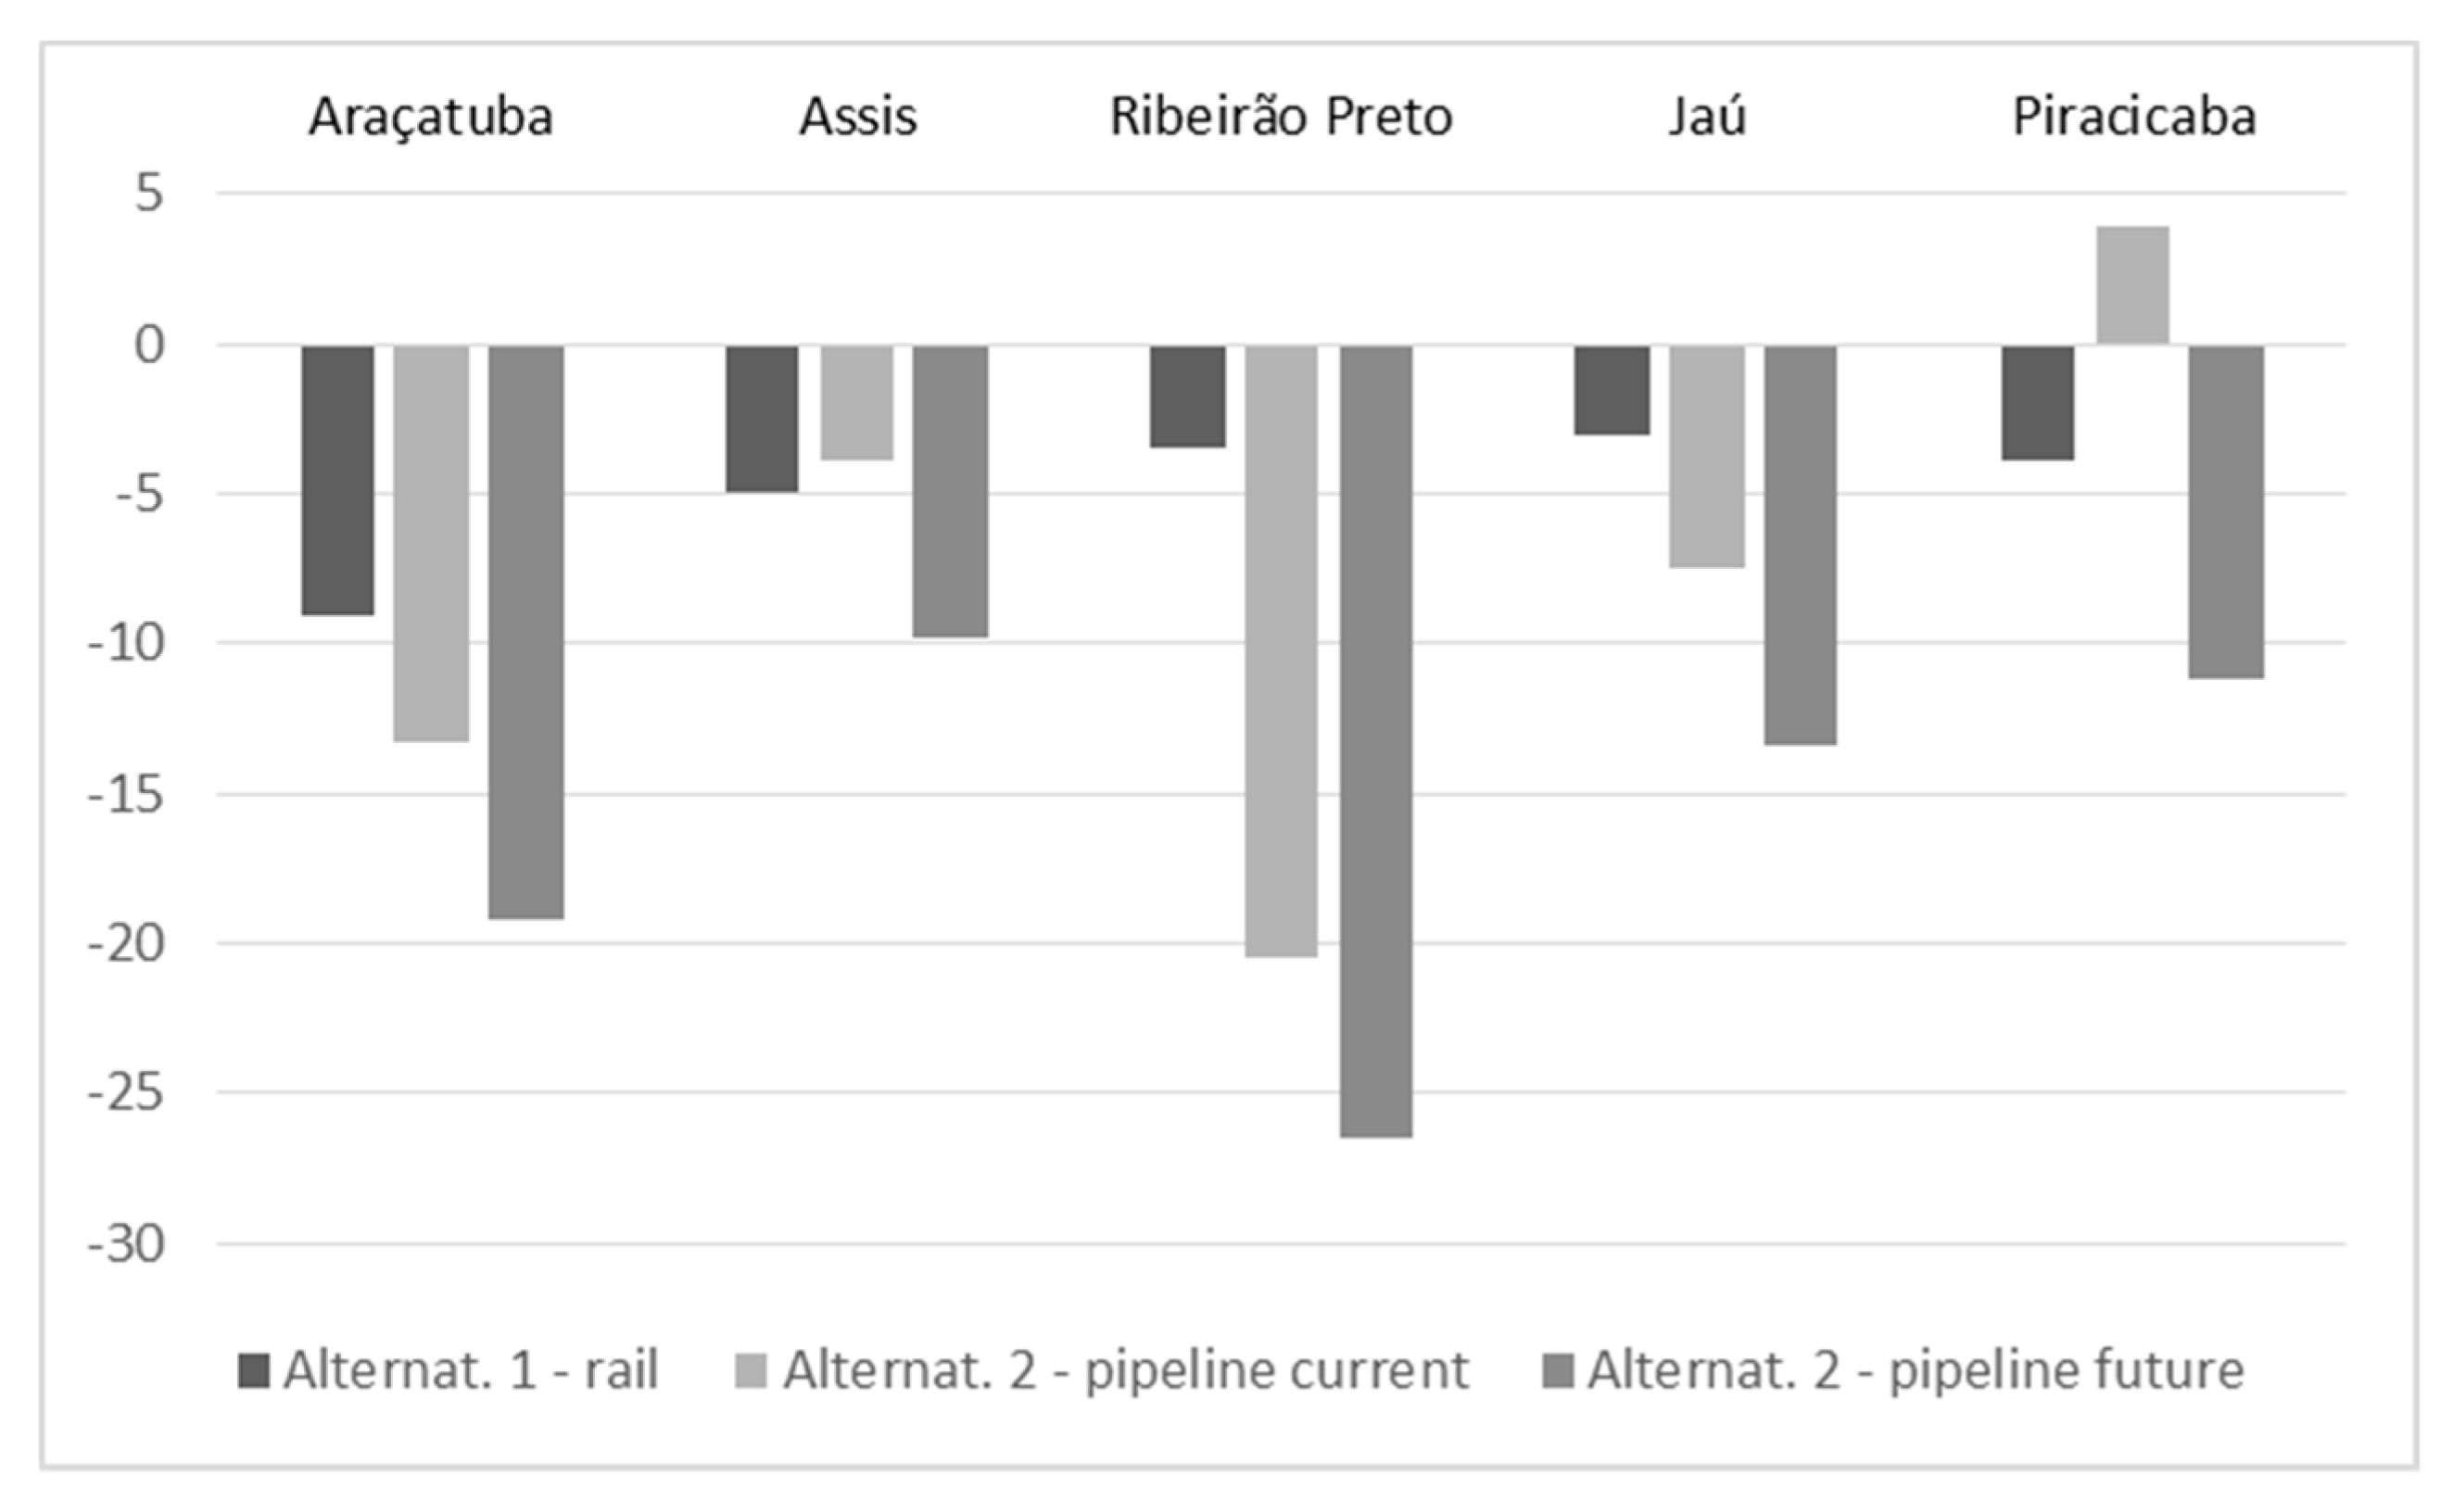
The combined analysis, considering all study scenarios, demonstrates even more clearly that the impacts on CO
2 emissions of using alternative modes of transportation depend on the region of origin analyzed (
Figure 10).
The rail alternative has an approximate mitigation potential ranging from 5 to 9 kg CO
2/t ethanol in the regions of Assis and Araçatuba, respectively. Jaú is the region where the mitigation potential is the lowest, at about 3 kg CO
2/t ethanol. The average of abatement from the ethanol supply chain in all regions and all stages analyzed is about 2.6%. From stage 3, that is, ethanol transportation, the average abatement is about 14.5% (
Table 6).
The use of the current pipeline for export purposes is the second-best scenario for reducing emissions. It would mitigate 20.5 kg CO
2/t ethanol from the Ribeirão Preto region and 13.3 kg CO
2/t ethanol from Araçatuba.However, the best alternative to mitigate emissions would be a future pipeline scenario, expanding the pipeline network to the port of Santos. When operating, this alternative can reduce emissions in all corridors analyzed. Expanding the pipeline network has the potential to reduce supply chain emissions by an average of 9%, and emissions from the ethanol transportation stage by an average of 49.5%, when considering all regions analyzed. Thus, in absolute terms, the average mitigation potential is approximately 16 kg CO
2/t ethanol, reaching 26.5 kg CO
2/t ethanol in the region of Ribeirão Preto, compared with the baseline emissions (
Table 6).
5. Discussion
This study quantified the CO2 emissions from diesel combustion in the stages of the ethanol supply chain, from the field to the export port. Specifically, we considered the following stages of the Brazilian ethanol supply chain: agricultural management (Stage 1), sugarcane transportation from the field to the mill (Stage 2), and biofuel transportation from the mill to the destination (Stage 3). In stage 3, we included some alternative multimodal scenarios, considering the use of the railway and pipelines. Emissions are expressed in terms of kilograms of CO2 from diesel combustion per ton of ethanol produced (kg CO2/t ethanol).
The results highlight the importance of the agricultural management stage, such as tilling, planting, and harvesting operations, to the CO2 emissions of the bioethanol distribution chain. These operations account for approximately 70% of total diesel emissions and usually vary from region to region owing to different terrains, soil characteristics, adopted production systems, and the conditions of the machines and trucks used in the field. Strategies to be adopted by producers to increase the energy efficiency of the production process, such as optimizing the fleet of trucks and tractors in the field or introducing precision agriculture technologies, for example, can contribute significantly to reducing emissions at this stage. This is a significant result and represents an important contribution of the work, since tractor emissions in agricultural management are commonly unknown or are disregarded in emissions analyses. So, this issue should still be more deeply explored and emphasized in future studies.
Conversely, the stage of sugarcane transportation to the mill accounts for only about 11% of supply chain emissions, and varies little between the regions of origin. This is explained by the short distances traveled by a truck to transport sugarcane from the field to the mill (ranging from 16 to 17 km in average).
The stage of ethanol transportation per se (considering the baseline scenario, road transportation) accounts for nearly 20% of emissions from the biofuel supply chain. However, due to the large variance between the regions of origin, this logistics stage ultimately determines which corridors are more energetically efficient as a whole and, therefore, emit less CO2. Lower levels of CO2 emissions in ethanol transportation (stage 3) may compensate for an eventual logistical inefficiency in the agricultural stage (stage 1) in a given region of production. This basically results from the distances between each region of origin and destination (port of Santos). Therefore, the proximity between the region of production and the consumer market is an important factor for the reduction of emissions from the supply chain. The efficient management of emissions from the ethanol supply chain would indicate which regions of origin are less carbon-intensive logistics corridors for exporting ethanol.
Additionally, the existence of alternatives to road transportation, such as rail and pipeline transportation, is ultimately important for mitigating emissions from fuel consumption in logistics corridors for exporting ethanol, thus corroborating the literature’s findings. In this context, the analyzed scenarios of the mitigation of CO2 emissions from ethanol transportation are quite realistic for Brazil, and could effectively contribute to the results of the Renovabio Program. Basically, all scenarios contribute to reducing CO2 emissions, but their impacts in terms of the mitigation of emissions differ according to the region of origin. Therefore, the evaluation of investments in intermodal rail or pipeline terminals should consider those potential benefits, aiming to effectively contribute to mitigating CO2 emissions from the ethanol supply chain. Since the potential benefit to be derived from mitigating emissions from these modes of transportation differs in each corridor analyzed, the analysis must be done on a case-by-case basis, and it cannot be generalized.
Finally, it is important to mention that as new transport infrastructures are implemented and used to export bioethanol, the relative importance of agricultural management for the CO2 emissions of the distribution chain becomes even greater.
6. Conclusions
The study quantified CO2 emissions from all logistic activities that consume fossil fuel in all stages in the ethanol supply chain, such as the use of tractors in the field, the transport of cane from the field to the mill, and the distribution of ethanol from the mill to the port. From this perspective, the CO2 emissions found in each stage can be compared, supporting decision making aiming to mitigate emissions during the logistics activities associated with ethanol, since the paper identifies the most important steps that deserve attention from private and public agents involved in order to make the ethanol chain cleaner and less fossil fuel intensive.
Our motivation was the lack of studies focusing on detailing and comparing emissions from all transportation activities, particularly emissions from diesel combustion by tractors during field management. In fact, the study points out that CO2 emissions in the agricultural management stage from diesel consumption, measured in terms of kg CO2 per ton of ethanol, are more relevant than those that come from the transportation stages. In this way, the better management of diesel consumption during the production process could contribute to greener production patterns and the environmental competitiveness level of the bioethanol producer.
Another contribution of the manuscript is the regionalized analysis of CO2 emissions, considering all the logistics stages involved in the production and export of ethanol. Specifically for Brazilian ethanol, there are no studies considering the specificities of the production process and the different localities of origin of the product. Emission calculations are commonly generalized, and the results are considered representative for the country as a whole. This article shows that such a generalization cannot be made, since factors from logistics operations both in the field and outside of the field determine different levels of emission in the supply chain. Since different regions of origin have different levels of emission, it would be possible to better allocate the production between the Brazilian and international consumer markets, aiming to optimize the total emissions of the ethanol sector as a whole.
Related to the numerical results obtained, the emission indicators in the different stages of the logistics chain are consistently quantified, based on a methodology that allows comparison between the results obtained in the different stages. The results are particularly relevant in supporting private actions and public policies related to mitigating emissions in the bioethanol logistics stages. The positive aspect in the case of the transportation sector is that, in general, opportunities to reduce CO2 emissions are directly aligned with increased operational efficiency by reducing fleet fuel consumption. Thus, economic and environmental benefits are simultaneously obtained, while infrastructure and productivity in transport are improved.
Finally, the results could offer an important lesson to countries in the development process of bioethanol production on a large scale. India and some African countries are examples of emerging regions in the production of bioethanol, mainly from sugarcane, and can incorporate many benefits for their own supply chains when considering the indicators and relationships evidenced in this work.


