Abstract
This research analyses the differences in impact assessment results depending on the choice of a certain software-database combination. Six packaging systems were modelled in three software-database combinations (GaBi database in GaBi software, ecoinvent 3.6 database in openLCA, Environmental Footprint database in openLCA). The chosen Life Cycle Impact Assessment (LCIA) method is EF 2.0. Differences and errors in the implementation of the LCIA method are a possible source of deviations. We compared the published characterisation factors with the factors implemented in the software-database combinations. While results for the climate change category are similar between the different databases, this is not the case for the other impact categories. In most cases, the use of the ecoinvent 3.6 database leads to higher results compared to GaBi. This is partly due to the fact, that ecoinvent datasets often include more background processes than the corresponding GaBi datasets. We found striking discrepancies in LCIA implementation, including the lack of regionalisation for water use in ecoinvent. A meaningful communication of LCIA results requires an excellent knowledge of the analysed product system, as well as of database quality issues and LCIA methodology. We fully acknowledge the constant efforts of database providers to improve their databases.
1. Introduction
1.1. Background
Packaging plays a central role in our economy. Despite its importance, it has come under scrutiny due to its contribution to the ever increasing amounts of solid waste [1]. Growing public pressure is leading to major efforts to reduce the negative environmental impact of packaging. To understand these impacts, Life Cycle Assessments (LCA) are carried out. The results of packaging LCAs can have far-reaching consequences. For example, an LCA carried out by the German Federal Environment Agency [2] served as the basis for the introduction of the return deposit system for disposable beverage packaging in Germany. Since composite beverage cartons had particularly low environmental impacts in this study, they were exempted from the mandatory deposit [3]. Several companies use LCA as a basis for decision-making [4]. Due to the high relevance, the question arises as to how reliable and comparable the results are in general. This paper deals with the question of how the choice of a certain Life Cycle Inventory (LCI) database influences LCA results for packaging.
1.2. LCA Tools
Commercially available LCA tools consist of several elements. Life Cycle Inventory databases contain datasets that characterise different processes. Each process consists of input flows (e.g., resources) and output flows (e.g., emissions). In addition, each dataset should include sufficient documentation [5]. These databases are tightly integrated with an application software, which allows for user-friendly access to the datasets. Users can combine datasets to complex models. LCA tools include various Life Cycle Impact Assessment (LCIA) methods facilitating the calculation of environmental impacts. An LCIA method is essentially a list of characterisation factors for the input/output flows. These factors translate inventory results (e.g., emissions) into environmental impact results. Taken together, an LCA tool consists of three distinct elements:
- Embedded LCI database
- Application software
- LCIA methods
The LCI database and the LCIA methods have to be seamlessly integrated with the software. Moreover, the characterisation factors of the LCIA methods must be mapped to the flows of the datasets. In this work, we refer to these tools as software-database combinations.
1.3. Relevant Influencing Factors for LCA Results
Several factors influence the reliability of the results. In addition to the quality of the primary data and the definition of the system boundaries, methodological aspects also have a major influence on the results. Various allocation methods lead to very different results [6]. Moreover, there are often different LCIA methods for the same impact category. For example, there are different metrics for the category of climate change, which differ with regard to the time period under consideration (20, 100, or 500 years), or with regard to the indicator (increase in radiative forcing or increase in temperature) [7].
The choice of secondary data also has a major influence [8]. Various providers offer secondary data in the form of LCI databases. There are different approaches to process modelling. Different system boundaries, assumptions, and the spatial and temporal validity of the datasets lead to different results depending on which database is used. Among the most widely used LCI databases are the ecoinvent database [9] and the GaBi database [10].
1.4. Literature Review
A number of researchers have reported large differences in results for the same product depending on the software-database combination used.
Kalverkamp et al. [8] modelled the life cycles of an electric car and a car with a combustion engine using both GaBi and the ecoinvent database. LCIA was carried out using the “ReCiPe” method. While the differences for the categories climate change, fossil resources, particulate matter, and acidification were relatively low, there were large variations for other categories (e.g., ozone depletion and water consumption). However, no clear trend could be shown, since in some cases the ecoinvent results were higher than the GaBi results, and vice versa. The authors recommend modelling the product systems with different databases for important decisions.
Emami et al. [11] carried out an LCA for different buildings. They modelled the systems with both GaBi and ecoinvent databases. While the climate change results were comparable, the results for other impact categories varied greatly, with the GaBi results almost always substantially lower than with the ecoinvent results. As a possible cause, the authors discuss the so-called cut-off error, which is caused by the fact that it is impossible to map all precursor processes. A system boundary must be drawn somewhere, and this differs from database to database.
Herrmann et al. [12] compared the results for different agricultural products modelled both with GaBi and ecoinvent. Here too, very large differences were found. This is due on the one hand to the life cycle inventory, and on the other hand to the implementation of the impact assessment method in the software. The discrepancies are so great that they could lead to the fact that—depending on the database used—different conclusions could be drawn from life cycle assessments of the same product.
Ciroth [13] carried out a comparative analysis of a light bulb. He used GaBi and ecoinvent, both integrated in the software openLCA. Here, GaBi often showed higher results than ecoinvent. The author attributes the variations to three causes: (i) differences in the Life Cycle Inventory, (ii) that the selected dataset does not adequately represent the system under investigation, and (iii) poor implementation of the impact assessment method.
Speck et al. [14] have shown that even if the same database is used and the same Life Cycle Impact Assessment (LCIA) method is applied, different results are obtained if different LCA software is used. The reason for this is the different implementation of the LCIA methods in the respective software.
Taken together, the published findings suggest that LCIA results other than climate change differ largely depending on the used software-database combination. Reasons are manifold, and communication of LCIA results without profound understanding of the database structure and the used LCIA method is highly problematic.
1.5. Efforts towards Standardisation
Although ISO 14040/44 [15] standardise the conduct of LCA, there is a certain methodological diversity. Various calculation methods lead to different results for the same product. Therefore, a comparison between products is only permissible if the LCAs were calculated using the same calculation method and the same database. The fundamental problem has been known for a long time. As a result, the European Commission launched the initiative for the development of the Product Environmental Footprint (PEF), which aims at standardisation [16,17]. The desired standardisation includes not only the LCIA methods and the End-of-Life (EoL) allocation formula, but also the datasets. Comparability can only be achieved if the same database is always used. Therefore, the European Commission released a database containing secondary data recommended for PEF studies. This database, henceforth called EF database, is available for openLCA [18] and GaBi software.
1.6. Aim and Research Question
This paper is the first study to systematically investigate how the choice of a certain database influences the LCA results of packaging. Due to the great interest from industry, this question is of high relevance. In addition, we investigated whether the selected LCIA method has been correctly implemented, and what influence an incorrect implementation of the LCIA method has.
In this study, the environmental impacts of different packaging systems over the entire life cycle are assessed with three software-database combinations.
It is not the aim of this study to create as accurate models of packaging systems as possible. It is also not the aim to compare different packaging systems, nor does it deal with uncertainty of the results. The results refer to the most recent databases in July 2020. At the time of publication, improved versions of the used databases have been released. Therefore, the authors recommend focussing on general conclusions rather than on specific numbers, which become—sooner or later—outdated.
2. Materials and Methods
This section is divided into three sub-sections. First, the systems under investigation are presented, including the assumptions regarding transport and disposal. Then the databases, software, and LCIA methods used are described. Finally, the calculation method, i.e., allocations, system boundaries, functional unit, and selection of the most relevant impact categories are presented. Moreover, we introduce an approach to analyse the reasons for the observed differences.
2.1. Investigated Systems
Different packaging systems are analysed over the entire life cycle. The aim is to model average European packaging that is as close to real-life conditions as possible. The information on mass and composition of the packaging is based on Dinkel et al. [19], except for the plastic bag and the corrugated cardboard box. In these cases, assumptions had to be made. The sources of the assumed recycled contents and recycling rates are given in the table caption (Table 1). These are simplified systems as the focus is on comparing the different databases, therefore packaging aids such as closures, labels, or secondary packaging were not considered.

Table 1.
Properties of the analysed packaging systems.
In addition to the packaging systems, the process “Electrical energy (consumption mix)” is also compared in detail.
The following assumptions for the transport scenario refer to the Product Environmental Footprint Category Rules (PEFCR) Guidance document [17] and apply to all packaging systems examined:
- 230 km truck
- 280 km railway
- 360 km ship
For thermal and electrical energy, the average European consumption mix was assumed in each case. The recycling rates are given in the descriptions of the individual packaging systems. For non-recycled packaging waste, it is assumed that 50% is thermally recovered and 50% is landfilled [20].
2.2. Databases, Software, and LCIA Methods
The calculations were carried out using GaBi, ecoinvent 3.6, and the Environmental Footprint (EF) database published by openLCA [24]. For modelling, the software GaBi was used for the GaBi database, and the software openLCA for the ecoinvent and EF database. The impact assessment was carried out using the EF 2.0 method proposed in the PEFCR guidance document [17,25]. This is a set of recommended methods for evaluating 16 different impact categories. The name of this method differs slightly in the different databases. Table 2 provides an overview:

Table 2.
Software-database combinations and naming of the Life Cycle Impact Assessment (LCIA) method EF 2.0. ILCD stands for International Reference Life Cycle Data System.
2.3. Method of Calculation
2.3.1. System Boundaries
The present analysis refers to the entire life cycle of packaging and includes raw material production, processing, transport, and disposal. The most current inventory data was used, and waste statistics refer to the latest years. The aim is to present a plausible European scenario for the period from 2015 to 2020.
2.3.2. Allocation
The End-of-Life allocation was carried out using the Circular Footprint Formula (CFF) as far as possible. This method is recommended by the European Commission [17] and allows for a fair calculation of credits for the use of recycled material and for recyclability at the end of life. Some datasets, such as the GaBi packaging glass dataset or the ecoinvent steel dataset, already contain a certain recycled content. Consequently, the life cycle of certain packaging systems had to be modelled according to the preset allocation method. As shown in Table 3, it was not possible to consistently apply the Circular Footprint Formula in all cases. This important limitation is discussed in more detail in section four.

Table 3.
Applied allocation procedures.
2.3.3. Impact Assessment Method
The 16 environmental impact categories as recommended in the PEF guidance [17] are calculated. The methodology refers to version EF 2.0. Although at the time of this study, a more recent version (EF 3.0) already existed, since this impact category method set was only available for GaBi, version EF 2.0 was used for consistency reasons. The names of the impact categories differ slightly between the various databases, so the nomenclature of the PEFCR guidance document [17] is uniformly used in this study.
2.3.4. Normalisation and Weighting
To select the most important impact categories, we carried out a normalisation and weighting of the results with the factors recommended by the European Commission [25]. For every model (e.g., PET bottle in GaBi, corrugated box in ecoinvent, etc.), the three most important impact categories were determined.
2.3.5. Presentation of the Results
Since the aim of this paper is to show the relative differences in the results, they are presented in percentages, with the Gabi results being arbitrarily set as 100%. The most important impact categories are presented. Since not only the absolute results differ in different databases, but also the ranking of the most important categories, more than three impact categories are usually presented. For example, if the GaBi calculation shows climate change, fossil resources, and water use as the three most important categories, and the ecoinvent calculation shows climate change, fossil resources, and respiratory diseases, then four impact categories are shown, namely climate change, fossil resources, respiratory diseases, and water use.
2.3.6. Analysis of Differences
If the results differ by greater than 50%, the most important contributing flows are examined in more detail. Due to the high relevance of the impact category “climate change,” deviations greater than 20% are analysed. This involves analysing which processes lead to the respective emissions and how these processes differ between the various databases.
In addition, an analysis of the impact assessment method was carried out. Since Speck et al. [27] have pointed out that one and the same impact assessment method can be implemented differently and in some cases incorrectly in different software-database combinations, the characterisation factors of the most important flows of the individual impact categories [28] were systematically compared. For this purpose, the characterisation factors in the individual software-database combinations are compared with the original factors provided by the European Commission for the EF 2.0 method [25]. The most important flows are defined as those flows which together account for at least 80% of the environmental impact. Any deviations are described in Section 3.3.
3. Results
In this section, we present the relative differences between the results, and discuss possible reasons. Furthermore, deviations of the characterisation factors—as implemented in the analysed software-database combinations—from the official EF 2.0 characterisation factors are also discussed.
3.1. Differences in the Results
3.1.1. PET Bottle
In the EF database, an aggregated dataset for bottle production was used. This dataset covers the PET granulate production and the bottle processing. In GaBi and ecoinvent, datasets for PET granulate were used, and bottle manufacturing was modelled separately. Figure 1 shows the variations in the results for the PET bottle.
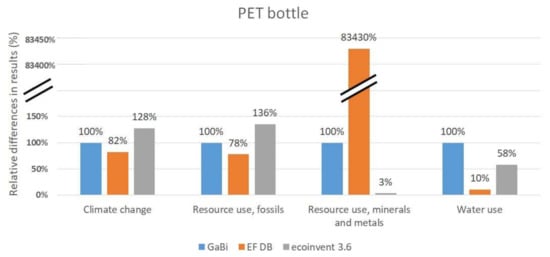
Figure 1.
Relative differences in results for the main impact categories for the polyethylene terephthalate (PET) bottle.
Climate change: The datasets for the raw material “PET, bottle grade” are in all three databases based on the PET ecoprofile [29]. While the results for the raw material in GaBi and in the EF database are very similar to the original ecoprofile, this is not the case for ecoinvent 3.6, where greenhouse gas emissions are substantially higher. The fact that the overall results for the EF database is lower than for GaBi is partly due to assumptions concerning energy consumption during processing. Furthermore, the production of bottles is an energy-intensive process. Therefore, environmental impacts for electrical energy (see Section 3.1.7) also lead to a higher result for ecoinvent 3.6.
Resource use, minerals, and metals: The strikingly high results are due to the fact that the EF dataset for PET bottles assumes substantially higher antimony consumption compared to the other databases. The low result for ecoinvent 3.6 is caused by the lack of characterisation factors for antimony and other elements in the impact assessment method (see also Section 3.3).
Water use: Remarkable low results for the EF database are caused by the fact that with ecoinvent 3.6 and GaBi, considerably more process water is consumed in the processing of the plastic than for the EF database.
3.1.2. Plastic Bag
The following graph (Figure 2) shows the differences in the results for the LDPE plastic bag.
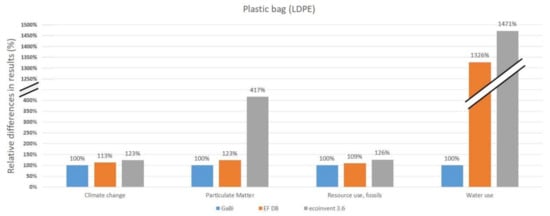
Figure 2.
Relative differences in results for the main impact categories for the low density polyethylene (LDPE) plastic bag.
Climate change: The higher results in ecoinvent 3.6 stem from higher CO2 emissions for the extrusion process.
Particulate matter: The higher values in ecoinvent 3.6 mainly arise from discrepancies in the upstream chain. For ethylene production using steam cracking, ecoinvent 3.6 assumes considerably higher emissions of SO2 and PM2.5.
Water use: Higher results for EF database are primarily due to water losses during the extraction of cooling water from rivers. In the GaBi database, there are anomalous negative results in this impact category for LDPE production.
3.1.3. Glass Bottle (Disposable, 0.5 L)
The GaBi dataset is an aggregated process, including production, transport, and disposal of container glass. As not all assumptions for this process are transparent, it was not possible to model the exact same system with the ecoinvent 3.6 or EF database. Figure 3 shows the differences in the results for the disposable glass bottle.
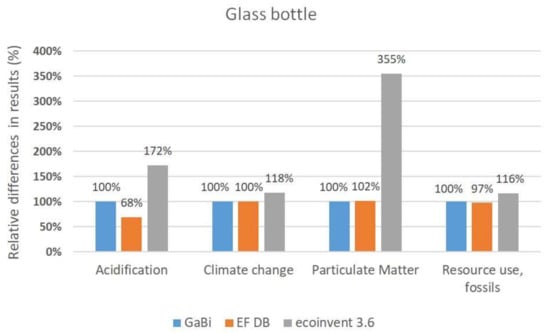
Figure 3.
Relative differences in results for the main impact categories.
Acidification and Particulate matter: Substantially higher NOx and PM2.5 emissions in the ecoinvent 3.6 datasets for glass production lead to higher results for the impact categories acidification and particulate matter.
3.1.4. Aluminium Can (0.5 L)
Can making was modelled according to da Silva et al. [30]. Figure 4 shows the differences in the results for the aluminium can.
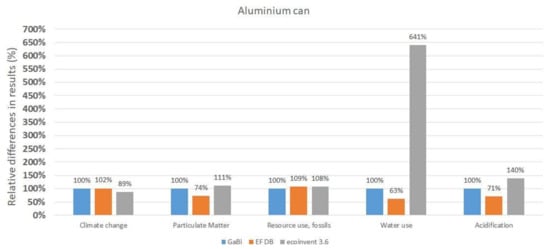
Figure 4.
Relative differences in results for the main impact categories.
Water use: Substantially higher results for ecoinvent 3.6 are due to the fact that a great deal of water is used in aluminium processing. Norway plays a major role in the European aluminium industry. In the ecoinvent impact assessment method “ILCD 2.0 2018,” there are no regionalised characterisation factors for water; therefore, the global characterisation factor of 42.85 m3 world-equivalents/m3 is used. As the characterisation factor for water from Norway is lower (0.634 m3 world—equivalents/m3) than the global one, the GaBi result is also much lower. That means that the amount of consumed water is similar in GaBi and in ecoinvent; however, this value is multiplied with an unrealistically high characterization factor in ecoinvent.
3.1.5. Tinplate Can (0.5 L)
In the case of the tinplate can, different allocation procedures contribute to deviations in the impact results (see Section 2.3.2). Figure 5 shows the differences in the results for the tinplate can.
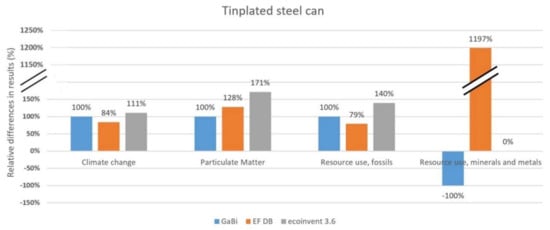
Figure 5.
Relative differences in results for the main impact categories.
Particulate matter: The higher results for ecoinvent 3.6 arise from the upstream chain of steel production. High emissions from coal mining are assumed here. These emissions stem from the coal that is burned for energy generation near the mine.
Resource use, minerals, and metals: The negative value for GaBi is due to the fact that the credit calculated with the “Value of scrap” dataset is higher than the value for resource consumption in steel production. While the credit for iron is expectedly lower than the iron consumed in production, the credit for silver, chromium, lead, magnesium, silicone, and zinc is higher than the resources consumed in production. The high value for EF database comes from copper consumption. The low value for ecoinvent can be partly explained by the lack of characterisation factors (see Section 3.3.2).
3.1.6. Corrugated Box
Figure 6 shows the differences in the results for the corrugated box.
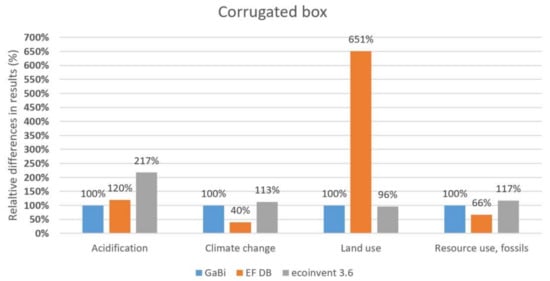
Figure 6.
Relative differences in results for the main impact categories.
Climate change: All corrugated datasets in the three databases are based on the FEFCO study [23]. The low value for climate change in the EF database is therefore all the more noticeable. This dataset contains an unusual negative flow for biogenic methane.
Acidification: The ecoinvent 3.6 results are substantially higher due to higher SO2 and NOx emissions during the production of kraftliner (linerboard).
Land use: High values for the EF database compared to GaBi are due to the fact that a higher land consumption is assumed (e.g., land occupation “forest used”: 1.4 m2 *a for EF database; 0.264 m2 *a for GaBi). In addition, GaBi uses regionalised flows, whereas EF database comprises global flows with high characterisation factors.
3.1.7. Electricity, EU Consumption Mix
Figure 7 shows the differences in the results for electricity.
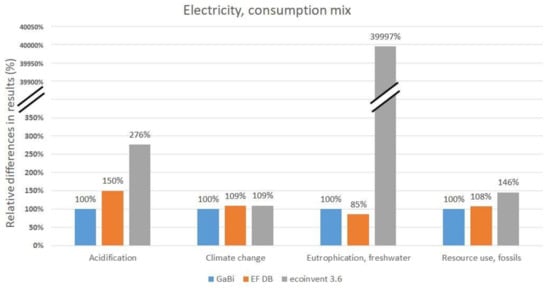
Figure 7.
Relative differences in results for the main impact categories.
Acidification: Substantially higher SO2 emissions from coal-fired power plant compared to the other databases lead to higher acidification results for ecoinvent 3.6.
Freshwater eutrophication: The strikingly high result for ecoinvent 3.6 is due to the treatment of coal mining overburden, as this involves the release of phosphates into the groundwater [31].
3.2. Further Differences in Impact Category Results
An analysis of the results for all impact categories for the seven systems investigated (six packaging systems and electrical energy) has shown that for the following impact categories the ecoinvent 3.6 results are always higher than the GaBi results:
- Acidification
- Eutrophication, freshwater
- Human toxicity, cancer
- Ionising radiation, human health
- Ozone depletion
- Photochemical ozone formation, human health
- Resource use, fossil
Results for the sixteen PEF impact categories were calculated for each product system. On average, almost 14 (exactly 13.86) impact category results from ecoinvent are higher than the corresponding results for GaBi per product system.
3.3. Differences in the Characterisation Factors
The characterisation factors of the most important flows were compared with the original EF 2.0 method [25]. In addition, the extent to which regionalisation is present in the characterisation factors and whether this regionalisation is implemented in the different software packages was verified.
3.3.1. Regionalisation
Table 4 gives an overview of all impact categories for which regionalised characterisation factors exist in the original and shows the implementation in the different software packages.

Table 4.
Regionalisation of characterisation factors. n.a. = not available; ok = as implemented in the original.
In GaBi, there are both regionalised flows and regionalised characterisation factors for water and land use. In the impact assessment method for the EF database, there are regionalised characterisation factors for acidification, eutrophication, and land use; however, the database lacks the regionalised flows. The method “ILCD 2.0 2018” does not include any regionalised characterisation factors.
None of the analysed software-database combinations provides regionalised flows for acidification and terrestrial eutrophication. This is remarkable due to the potentially large discrepancies in results. For acidification the characterisation factor for “Sulfur dioxide—Greece” is 0.012, while the factor for “Sulfur dioxide—Sweden” is 1.993. Soil sensitivity to acidification differs largely between regions, and should therefore be considered in impact assessment [32].
3.3.2. Characterisation Factors
Any differences between the characterisation factors are described here. The issue of regionalisation will not be dealt with separately.
- Climate change: The characterisation factor for fossil methane is 36.8 in the original EF2.0 method. In “ILCD 2.0 2018” it is 36.75.
- Ecotoxicity: In GaBi and in the ecoinvent method “ILCD 2.0 2018,” the characterisation factors for “estradiol to water” are missing. The reason for the lacking estradiol characterisation factor in GaBi is the lack of contributing processes in the database. In ecoinvent, the characterisation factor for cyfluthrin is also absent.
- Resource use, minerals, and metals: In the ecoinvent method “ILCD 2.0 2018,” the characterisation factors for germanium and antimony are missing. However, this error was redressed by ecoinvent with the release of version 3.7.
4. Discussion
4.1. Main Findings
The present analysis discloses large differences between the analysed software-database combinations. While the results for climate change are generally quite similar, this is not the case for other impact categories. It is noticeable that the results for ecoinvent are in most cases substantially higher than for GaBi. Results for the EF database in openLCA are occasionally higher and occasionally lower than for GaBi. The reason is that EF database is based on data from various providers, including Sphera (formerly thinkstep) and ecoinvent. Variations are caused by differing system boundaries and on occasion by insufficient implementation of the assessment method into the examined software-database combinations.
4.2. Possible Reasons for the Higher Values in Ecoinvent
It is noticeable that the results of the impact assessments from ecoinvent 3.6 are commonly higher than GaBi results. For example, an evaluation of the generation of 1 kWh of electricity from nuclear energy (Germany) shows that the result for “ionising radiation” in ecoinvent is twice as high as in GaBi. The high value at ecoinvent is mainly due to the dumping of overburden from the mining of uranium ore. Similarly, the rather high values for freshwater eutrophication in coal-fired power plants are due to the dumping of coal tailings. Since the GaBi datasets are aggregated datasets, it could not be determined whether these processes are contained in GaBi at all. A comparison of transport processes also shows higher results for ecoinvent in the category climate change. The documentation of the datasets clearly shows that ecoinvent also includes road maintenance and vehicle wear, which is not the case with GaBi. Only the direct emissions of the vehicle and burdens from fuel production are included here.
From this, we conclude that in some cases, different system boundaries lead to higher results. In many cases, the ecoinvent datasets contain considerably more background processes (e.g., wear and tear of infrastructure, maintenance work, etc.) than GaBi.
One reason for the higher values in the water use category is the use of the global characterisation factor for water, which leads to inflated results if the water was consumed in regions without water shortage.
However, since no complete analysis of all GaBi and ecoinvent datasets has been carried out, generalisations should be treated with caution.
4.3. Quality Issues
Despite the constant improvements and updates, errors were found in all three databases. These errors exist on the level of the Life Cycle Inventory and in the implementation of the LCIA methods. For example, the negative flow for biogenic methane in the EF dataset for corrugated board leads to dramatically lower values in climate change compared to GaBi or ecoinvent 3.6. The lack of characterisation factors for elements such as antimony in ecoinvent leads to very low values in the impact category “resources, minerals, and metals.” The lack of regionalisation of flows and characterisation factors severely limits the significance of the results for land use, water use, acidification, and terrestrial eutrophication.
4.4. Different Allocations
The End-of-Life allocation method cannot always be freely chosen by the LCA practitioner. It also depends on the database used. This is particularly important when aggregated datasets are available and materials with recycled content are considered. For example, in GaBi, the steel sheet dataset was calculated using the worldsteel allocation method, but the glass dataset was calculated using the cut-off method.
4.5. Limitations
For several reasons, full comparability is difficult to achieve. For example, it was not always possible to use the same allocation method because some raw material datasets (steel, glass, paper) already contain a certain amount of recycled material. Consequently, the same allocation method has to be applied for the disposal of packaging. Numerous authors have pointed out that various allocation methods produce large differences in the results [6].
Such a study can only be a snapshot. At the time of publication, for example, a more recent version of ecoinvent was published (3.7). Updated datasets on electricity mix, metals, paper, and recycling were released. Furthermore, the missing characterisation factors for “resource use, minerals, and metals” were added. The method was renamed from “ILCD 2.0 2018” to “EF 2.0” [33]. The GaBi database and software is also regularly updated and improved. Despite these important limitations, some general conclusions can be drawn from this study.
5. Conclusions
The results of this study clearly show that a meaningful evaluation and interpretation of results requires a solid background knowledge. This expert knowledge should include both an understanding of the system under study and the LCIA methods used. Despite the constant improvements, there are still errors in the databases. Incorrect flows, wrong or absent characterisation factors can lead to erroneous conclusions.
These findings also have consequences for the selection of the main impact categories. If these are selected using purely quantitative methods such as normalisation and weighting, there is a risk that the importance of some impact categories may be under or overestimated.
Climate change is always included in the most important categories, but often also particulate matter and acidification. Water and land use are important categories, but implementation of the method is still inadequate in some cases. The impact categories “resource use, fossils” and “resource use, mineral, and metals” are problematic for several reasons. The consumption of fossil resources correlates strongly with greenhouse gas emissions [34], so this indicator does not provide any additional information. The impact category “resource use, minerals, and metals” is also associated with large uncertainties [35]. This is shown by the large discrepancies in the results for this impact category for the PET bottle and the tinplate can. Moreover, it is questionable whether depletion of fossils, minerals, or metals is an environmental concern at all [36].
One of the most important tasks of an LCA practitioner is to be able to assess the quality of the data and the relevance of the impact categories. Overall, our findings suggest that for a meaningful packaging life cycle assessment, good quality of secondary data and reliability of the LCIA methods are absolute prerequisites. Our findings underline the importance of modelling product systems with different databases for important decisions, as recommended by Kalverkamp et al. [8].
Author Contributions
The manuscript of this paper was mainly prepared by, E.P.; consulted for reviewing, providing comments, and editing the manuscript, B.W. and M.T. All authors have read and agreed to the published version of the manuscript.
Funding
This research received no external funding.
Acknowledgments
Mary Grace Wallis provided linguistic editing of the manuscript.
Conflicts of Interest
The authors declare no conflict of interest.
References
- Kaza, S.; Yao, L.; Bhada-Tata, P.; Van Woerden, F. What a waste 2.0. In A Global Snapshot of Solid Waste Management to 2050; World Bank Group: Washington, DC, USA, 2018; ISBN 978-1-4648-1329-0. [Google Scholar]
- Schonert, M.; Motz, G.; Meckel, H.; Detzel, A.; Giegrich, J.; Ostermayer, A.; Schorb, A.; Schmitz, S. Ökobilanz für Getränkeverpackungen II; Umweltbundesamt: Berlin, Germany, 2002. [Google Scholar]
- Detzel, A.; Kauertz, B.; Grahl, B.; Heinisch, J. Prüfung und Aktualisierung der Ökobilanzen für Getränkeverpackungen. 2016. Available online: https://www.umweltbundesamt.de/publikationen/pruefung-aktualisierung-der-oekobilanzen-fuer (accessed on 22 October 2020).
- Piekarski, C.; Da Luz, L.M.; Lidiana, Z. Life Cycle Assessment as Entrepreneurial Tool for Business Management and Green Innovations. J. Technol. Manag. Innov. 2013, 8, 44–53. [Google Scholar] [CrossRef]
- De Saxcé, M.; Perwuelz, A.; Rabenasolo, B. Development, documentation of Life Cycle Inventories (LCI) and LCA databases organisation. In Proceedings of the International Workshop on Green Supply Chain GSCrq, Arras, France, 21 June 2012. [Google Scholar]
- Nicholson, A.L.; Olivetti, E.A.; Gregory, J.R.; Field, F.R.; Kirchain, R.E. End-of-life LCA allocation methods: Open loop recycling impacts on robustness of material selection decisions. In Proceedings of the 2009 IEEE International Symposium on Sustainable Systems and Technology (ISSST), Phoenix, AZ, USA, 18–20 May 2009; Allenby, B., Matthews, S., Masanet, E., Horvath, A., Eds.; IEEE – Institute of Electrical and Electronics Engineers: New York, NY, USA, 2009; pp. 1–6. [Google Scholar]
- Peters, G.P.; Aamaas, B.; Berntsen, T.; Fuglestvedt, J.S. The integrated global temperature change potential (iGTP) and relationships between emission metrics. Environ. Res. Lett. 2011, 6, 44021. [Google Scholar] [CrossRef]
- Kalverkamp, M.; Helmers, E.; Pehlken, A. Impacts of life cycle inventory databases on life cycle assessments: A review by means of a drivetrain case study. J. Clean. Prod. 2020, 269, 121329. [Google Scholar] [CrossRef]
- Ecoinvent Association. Ecoinvent Database 3.6, Cut-Off. Available online: www.ecoinvent.org (accessed on 13 October 2020).
- Sphera Solutions. GaBi Database. Available online: http://www.gabi-software.com (accessed on 13 October 2020).
- Emami, N.; Heinonen, J.; Marteinsson, B.; Säynäjoki, A.; Junnonen, J.-M.; Laine, J.; Junnila, S. A Life Cycle Assessment of Two Residential Buildings Using Two Different LCA Database-Software Combinations: Recognizing Uniformities and Inconsistencies. Buildings 2019, 9, 20. [Google Scholar] [CrossRef]
- Herrmann, I.T.; Moltesen, A. Does it matter which Life Cycle Assessment (LCA) tool you choose?—A comparative assessment of SimaPro and GaBi. J. Clean. Prod. 2015, 86, 163–169. [Google Scholar] [CrossRef]
- Ciroth, A. Using databases from different data providers in parallel for a case study on light bulbs. In Proceedings of the LCA XIV International Conference, San Francisco, CA, USA, 8 October 2014. [Google Scholar]
- Speck, R.; Selke, S.; Auras, R.; Fitzsimmons, J. Life Cycle Assessment Software: Selection Can Impact Results. J. Ind. Ecol. 2016, 20, 18–28. [Google Scholar] [CrossRef]
- ISO. Environmental Management—Life Cycle Assessment—Requirements and Guidelines; International Organization for Standardization: Geneva, Switzerland, 2006; ISO 14044:2006. [Google Scholar]
- European Commission. Commission recommendation of 9 April 2013 on the use of common methods to measure and communicate the life cycle environmental performance of products and organisations. In Official Journal of the European Union; European Commission: Brussels, Belgium, 2013. [Google Scholar]
- European Commission. PEFCR guidance document. In Guidance for the Development of Product Environmental Footprint Category Rules (PEFCRs), version 6.3; European Commission: Brussels, Belgium, 2018. [Google Scholar]
- Green Delta. Openlca 1.9; Green Delta: Berlin, Germany, 2019. [Google Scholar]
- Dinkel, F.; Kägi, T. Ökobilanz Getränkeverpackung. 2014. Available online: https://carbotech.ch/cms/wp-content/uploads/Carbotech-LCA-Getraenkeverpackung-2014.pdf (accessed on 22 October 2020).
- European Commission. Results and Deliverables of the Environmental Footprint Pilot Phase. Available online: https://ec.europa.eu/environment/eussd/smgp/PEFCR_OEFSR_en.htm (accessed on 12 October 2020).
- FEVE—The European Container Glass Federation. Recycled Content and Glass Packaging. 2019. Available online: https://feve.org/wp-content/uploads/2019/07/Recycled-Content-FEVE-Position-June-2019.pdf (accessed on 22 October 2020).
- APEAL. The Recycled Content of Steel for Packaging; APEAL: Brussels, Belgium, 2020. [Google Scholar]
- The European Federation of Corrugated Board Manufacturers. European Database for Corrugated Board Life Cycle Studies. 2015. Available online: https://www.fefco.org/lca (accessed on 22 October 2020).
- Recanati, F.; Ciroth, A. Environmental Footprint Secondary Data for openLCA. 2019. Available online: https://nexus.openlca.org/database/Environmental%20Footprints (accessed on 22 October 2020).
- European Commission. Environmental Footprint Reference Packages. Available online: https://eplca.jrc.ec.europa.eu/LCDN/developerEF.xhtml (accessed on 12 October 2020).
- World Steel Association. Life Cycle Inventory Methodology Report. 2017. Available online: https://www.worldsteel.org/en/dam/jcr:6eefabf4-f562-4868-b919-f232280fd8b9/LCI+methodology+report_2017_vfinal.pdf (accessed on 22 October 2020).
- Speck, R.; Selke, S.; Auras, R.; Fitzsimmons, J. Choice of Life Cycle Assessment Software Can Impact Packaging System Decisions. Packag. Technol. Sci. 2015, 28, 579–588. [Google Scholar] [CrossRef]
- Crenna, E.; Secchi, M.; Benini, L.; Sala, S. Global environmental impacts: Data sources and methodological choices for calculating normalization factors for LCA. Int. J. Life Cycle Assess. 2019, 24, 1851–1877. [Google Scholar] [CrossRef]
- Committee of PET Manufacturers in Europe. Polyethylene terephthalate (PET) (bottle grade). In An Eco-Profile and Environmental Product Declaration of the PET Manufacturers in Europe; Committee of PET Manufacturers in Europe: Brussels, Belgium, 2017. [Google Scholar]
- Da Silva, N.; d’Souza, N.; Binder, M. Life Cycle Impact Assessment of Aluminium Beverage Cans. 2010. Available online: https://www.aluminum.org/sites/default/files/FINAL_CAN_LCA_REPORT.pdf (accessed on 22 October 2020).
- Doka, G. Life Cycle Inventory of the Disposal of Lignite Spoil, Coal Spoil and Coal Tailings. 2009. Available online: https://www.doka.ch/DokaCoalTailings.pdf (accessed on 18 May 2020).
- Bulle, C.; Margni, M.; Patouillard, L.; Boulay, A.-M.; Bourgault, G.; De Bruille, V.; Cao, V.; Hauschild, M.; Henderson, A.; Humbert, S.; et al. IMPACT World+: A globally regionalized life cycle impact assessment method. Int. J. Life Cycle Assess 2019, 24, 1653–1674. [Google Scholar] [CrossRef]
- Moreno Ruiz, E.; Valsasina, L.; Wernet, G.; Bourgault, G. Documentation of Changes Implemented in the Ecoinvent Database v3.7. 2020. Available online: https://www.ecoinvent.org/files/change_report_v3_7_20200918_.pdf (accessed on 22 October 2020).
- Janssen, M.; Svanström, M.; Arvidsson, R. Cross-correlation between impact categories in LCAs of forest biomass-based products. In Proceedings of the 9th Biennial Conference of the International Society for Industrial Ecology (ISIE), Göteborg, Sweden, 25–29 June 2017. [Google Scholar]
- Van Oers, L.; Guinée, J.B.; Heijungs, R. Abiotic resource depletion potentials (ADPs) for elements revisited—updating ultimate reserve estimates and introducing time series for production data. Int. J. Life Cycle Assess 2020, 25, 294–308. [Google Scholar] [CrossRef]
- Drielsma, J.A.; Russell-Vaccari, A.J.; Drnek, T.; Brady, T.; Weihed, P.; Mistry, M.; Simbor, L.P. Mineral resources in life cycle impact assessment—defining the path forward. Int. J. Life Cycle Assess 2016, 21, 85–105. [Google Scholar] [CrossRef]
Publisher’s Note: MDPI stays neutral with regard to jurisdictional claims in published maps and institutional affiliations. |
© 2020 by the authors. Licensee MDPI, Basel, Switzerland. This article is an open access article distributed under the terms and conditions of the Creative Commons Attribution (CC BY) license (http://creativecommons.org/licenses/by/4.0/).