Article

Users’ Adoption of Sustainable Cloud Computing Solutions

by
Małgorzata Pańkowska
*,
Krzysztof Pyszny
and
Artur Strzelecki
Department of Informatics, University of Economics in Katowice, 40-287 Katowice, Poland
*
Author to whom correspondence should be addressed.
Sustainability 2020, 12(23), 9930; https://doi.org/10.3390/su12239930
Submission received: 11 October 2020 / Revised: 22 November 2020 / Accepted: 25 November 2020 / Published: 27 November 2020
(This article belongs to the Special Issue ICT Adoption for Sustainability)

Abstract

:
The paper is dedicated to factors influencing users’ adoption of sustainable cloud computing solutions. The article covers the important characteristics related to cloud computing. It also discusses how sustainable cloud computing is important for sustainability. The current state of their security and potential threats waiting for users is reviewed. The purpose of this study is to investigate the influence of perceived usefulness, security, availability, and satisfaction on users’ adoption of sustainable cloud computing solutions. The study tested and used the adapted Technology Acceptance Model (TAM) model in the context of cloud computing solutions. The partial least square method of structural equation modeling is employed to test the proposed research model. The study utilizes an online survey to obtain data from 252 cloud computing solutions users. The data set was analyzed using SmartPLS 3 software. Results showed that the best predictor of users’ perceived usefulness and system & service quality is perceived availability, followed by perceived security. Both perceived usefulness and system & service quality predict users’ attitude and intention to use of cloud computing solutions. The findings improve understanding regarding the adoption of cloud computing solutions, and this work is, therefore, of particular interest to the IT departments and cloud computing vendors.

1. Introduction

According to the National Institute of Standards and Technology (NIST), cloud computing is a mean that allows ubiquitous, convenient on-demand access to a network of shared fields of configurable computer resources (such as networks, servers, data warehouses, applications, and services) that can be quickly provided and delivered with minimal involvement of the service provider [1]. The idea of a centralized computing service dates back to the 1960s. Computing services were provided through shared server networks used by multiple users at the same time. The server sharing mechanism used the available resources efficiently, ensuring acceptable performance for users. Unfortunately, scaling capabilities and rising hardware costs were their main disadvantages [2]. The solution to this problem was the virtualization of server environments. The first provider of services in the cloud was CompuServe, established in 1969 in the United States. It provided customers with a small disk space where they could store files of any format.
Virtualization consists of creating a version image: server, operating system, disk, and network resources, for later use on multiple virtual machines at the same time. The primary purpose of virtualization is to optimize workloads by transforming calculations to make them more scalable, economical, and efficient. Hypervisor/Virtualizer is a program supporting virtual machines, which enables them to work in a virtual environment [3].
As the study aims to investigate selected factors’ impact on adoption of cloud computing, the rest of the paper is composed as follows. The next section includes a short overview of literature on Technology Acceptance Model (TAM) application as well as on cloud computing adoption. Further, we present the research methodology and provide hypotheses and model, which is statistically verified. The methodology of analysis (partial least squares structural equation modeling (PLS-SEM) and Technology Acceptance Model (TAM)) is presented and hypotheses are drawn. In Section 3, results of the questionnaire as well as PLS-SEM analysis are given and provide discussion about them. In Section 4, the authors discuss the results of the research and its practical implications, contributions, and limitations. Finally, in Section 5, the overall conclusions drawn from the work and the key findings are presented.

2. Research Background Research Questions

2.1. The Motivation of TAM Application for Cloud Computing (CC) Adoption Evaluation

Nowadays, the Internet is emerging as the cheapest global communication infrastructure. It is argued to be the largest digital information highway and digital library. The flexibility of searching, easiness of access to digital products, and volume of data bring reduction of paper usage. The Internet is considered as an open and inexpensive platform for personal and professional applying, as well as a social environment supporting connectivity, integration, cooperation, and collaboration of business units [4]. Cloud computing (CC) is one among a number of concepts resulting from information communication technology (ICT) and in particular from the Internet development. CC is an ICT service distribution paradigm that included delivering hosted services over the Internet, based on a pay-as-you-go approach. It provides radical changes in business processes in organizations. The decision to implement CC solution has many reasons:
  • Reduction in costs associated with delivering ICT services, reducing costs of hardware and software, and in general reduction of the total cost of ownership;
  • Economics of scale;
  • Reduction in management responsibilities for ICT services and resources;
  • Increase of business agility and scalability to meet the needs of rapidly changing business environment;
  • Control and optimization of resource allocation;
  • Application of metrics to determine the usage for billing purposes, monitoring, controlling, and reporting;
  • Providing measures for disaster recovery and business continuity.
The CC adoption strategy requires a change of thinking about ICT and considering it as a service recognition and adoption process [5]. The service-centered view of ICT stipulates recognition of customer capabilities and expected by them benefits, development of service-oriented competencies, knowledge, skills, and involvement of customers in value delivering process, and monitoring service outcomes to improve customer collaboration. Doug Thomson [6] suggests that a cloud strategy emphasizes three specific characteristics, i.e., awareness, experience, and value. The CC awareness aims to generate recognition that particular service providers have an appropriate cloud-computing offer. Therefore, they organize advertising and marketing campaigns aimed at a potential customer’s decision makers. The experience characteristics of CC market should invite client organizations to experience cloud technology and to understand the technology, security, scalability, and skilled expert staff in action. The value characteristics should establish relationships among customers and ICT vendors, understand the business requirements, and demonstrate market leading capability in a way that is targeted to meet the business organization’s needs. The value of ICT concerns two fundamental questions, i.e., sustainability in ICT and sustainability by ICT [7].
In general, sustainable development is the practice of meeting the needs of society today without compromising the ability of future generation to meet their own needs. The term “sustainability,” in its environmental usage, refers to the potential longevity of vital human ecological support systems, such as the planet’s climatic system, agriculture systems, industry, and human communities in general and the various systems on which they depend. Models of governance for sustainability need to concentrate more on change than stability, meaning that existing rules, customs, practices, and rights are seen more as the subject matter of governance to be influenced, than as the main business of governance. The challenges of governance for sustainability lie in four broad and changeable areas, i.e., innovation, reconciliation, creativity, and adaptability [8]. Understanding sustainability requires the simultaneous effort of balancing economic, social, and environmental goals for a business unit. As such, sustainability is a metaphor for describing social responsibility, corporate citizenship, and ethical business conduct. CC implementation projects include also sustainability issues consideration. The ICT project sponsors are to be interested in the potential impact of the proposed work and project results’ dissemination adequacy to ensure optimal use of the project results, means and methods to strengthen technology, effective planning, and exploitation of results and dissemination of knowledge within and outside the project community. Questions to be considered are following:
  • What is the potential strategic impact of the proposed CC implementation action?
  • Does the proposal identify a community that will benefit from the results?
  • Do the user organizations commit to further use, if the user experience is gained?
Sustainability can also be interpreted as the continuation of the benefits provision after assistance from a donor has been completed [9]. The focus is on sustaining the flow of benefits in the future. Therefore, managing sustainability is a process aimed at maximizing the flow of sustainable benefits. It is a process that must be monitored, reviewed, and updated as circumstances change and new lessons are learnt from experience. Hilty and Aebischer [7] explains that sustainability in ICT is making information and communication technology themselves more durable and eco-friendly. People need to consider the environmental impact of software, semiconductors, end-user devices, servers, data centers, and the global Internet as a whole, examining the footprint of ongoing operations, as well as the material life cycles. Sustainability by ICT is using technology to encourage sustainable practices in society as a whole. So, the ICT is expected to change supply chain management, the smart cities and green urban design, and reshape household energy consumptions patterns.
Cloud computing is considered as a practice of designing, manufacturing, using, and disposing of computers, servers, and associated systems efficiently and effectively with minimal impact on the environment [10]. CC opens the door to a world of ICT service-orientation, but the services are expected to be designed for environment sustainability and energy efficiency. Therefore, providers of CC products and services focus on causal relationships between software and hardware:
  • Power consumption: How much power consumption by the hardware does the software cause during its execution—not only in local end-user devices, but also in network components, servers, and other devices involved in the process?
  • Hardware load: How much of the available hardware capacity is used by the software product?
  • Hardware management: Can software influence the operating states of hardware, especially by using power-saving modes?
  • Useful life of hardware: Can software products influence on the decommissioning of hardware products?
  • User perception: What are the user’s perception and experiences with the CC service? Do users think that CC product is durable? What is the user’s perception of the ecological value of the CC products? Does the cloud computing have other hardware dependencies when upgraded? Are the cloud services equally serviceable and accessible to different users?
The essential advantage of CC is that it involves end users in the creation of innovative value proposition generation as well as in the process of reengineering of the contemporary solutions.
There are many papers on technology acceptance models and methods, e.g., Technology Acceptance Model (TAM) [11], Technology Acceptance Model 2 (TAM2) [12], the Unified Theory of Acceptance and Use of Technology (UTAUT) [13], Diffusion of Innovations Model (DIM), or the Status Quo Bias (SQB) theory explanations. The SQB theory is to explain why individuals prefer to maintain their current status, situation, or technology rather than to switch to new actions [14].
Status quo bias (SQB) attributed to loss aversion depends directly on the framing of gains and losses. Loss aversion was defined by Kahneman and Tversky (1984), who argue that individuals weigh losses heavier than gains in making decisions [15]. The SQB theory is also consistent with cognitive misperception known as anchoring. Samuelson and Zeckhauser explain it and argue that, in a decision-making, the probabilistic forecasts lead to a particular decision. In repeatable decision process, continuance of status quo can be explained as a preference to justify commitments to a previous course of actions [14].
TAM was an early framework that identified two factors determining the user’s decision to use the new technology: perceived usability and ease of use. Lee and Coughlin (2015) confirmed that TAM should include many factors, e.g., value, usability, affordability, accessibility, technical support, social support, emotion, independence, experience and confidence, and availability [16]. TAM2, which is a certain extension of TAM, includes beyond measures typical for TAM (i.e., perceived usefulness, perceived ease of use, intention to use, and usage behavior), also the following measures: experience, voluntariness, subjective norm, image, job relevance, output quality, and result demonstrability [12]. In comparison with TAM and TAM2, the TAM3 model is the next extension of considered variables. Therefore, additional factors that are expected to be included, are as follows: computer self-efficacy, perception of external control, computer anxiety, computer playfulness, perceived enjoyment, and objective usability [17].
The UTAUT model is a management tool for assessment of the likelihood of success for new technology implementations. Therefore, managers can understand the drivers of acceptance to support proactive designing, adoption, and technology system usage [18]. The DIM model emphasizes the importance of usability of product or service. This model is particularly applied to the case of the diffusion of new telecommunications technologies [19].
Most technology acceptance models were developed for organizational and consumer electronics context. The systematic literature review (SLR) was done to reveal domain of TAM model applications. Therefore, research question was formulated as follows:
RQ1: Can the TAM model be applied for CC adoption evaluation?
The survey included publications in repository Scopus, published in 2009–2020. The searching strings covered the words “Technology Acceptance Model” AND “Cloud Computing”. Eventually, 124 publications were selected. Table 1 includes twelve publications, which were cited by more than 50 readers. The TAM questionnaires’ recipients are presented in Figure 1. Questions in the survey concern mainly acceptance of new ICT; however, none of researchers emphasized sustainability. There is still a chance to undertake research on users’ recognition of sustainable issues.
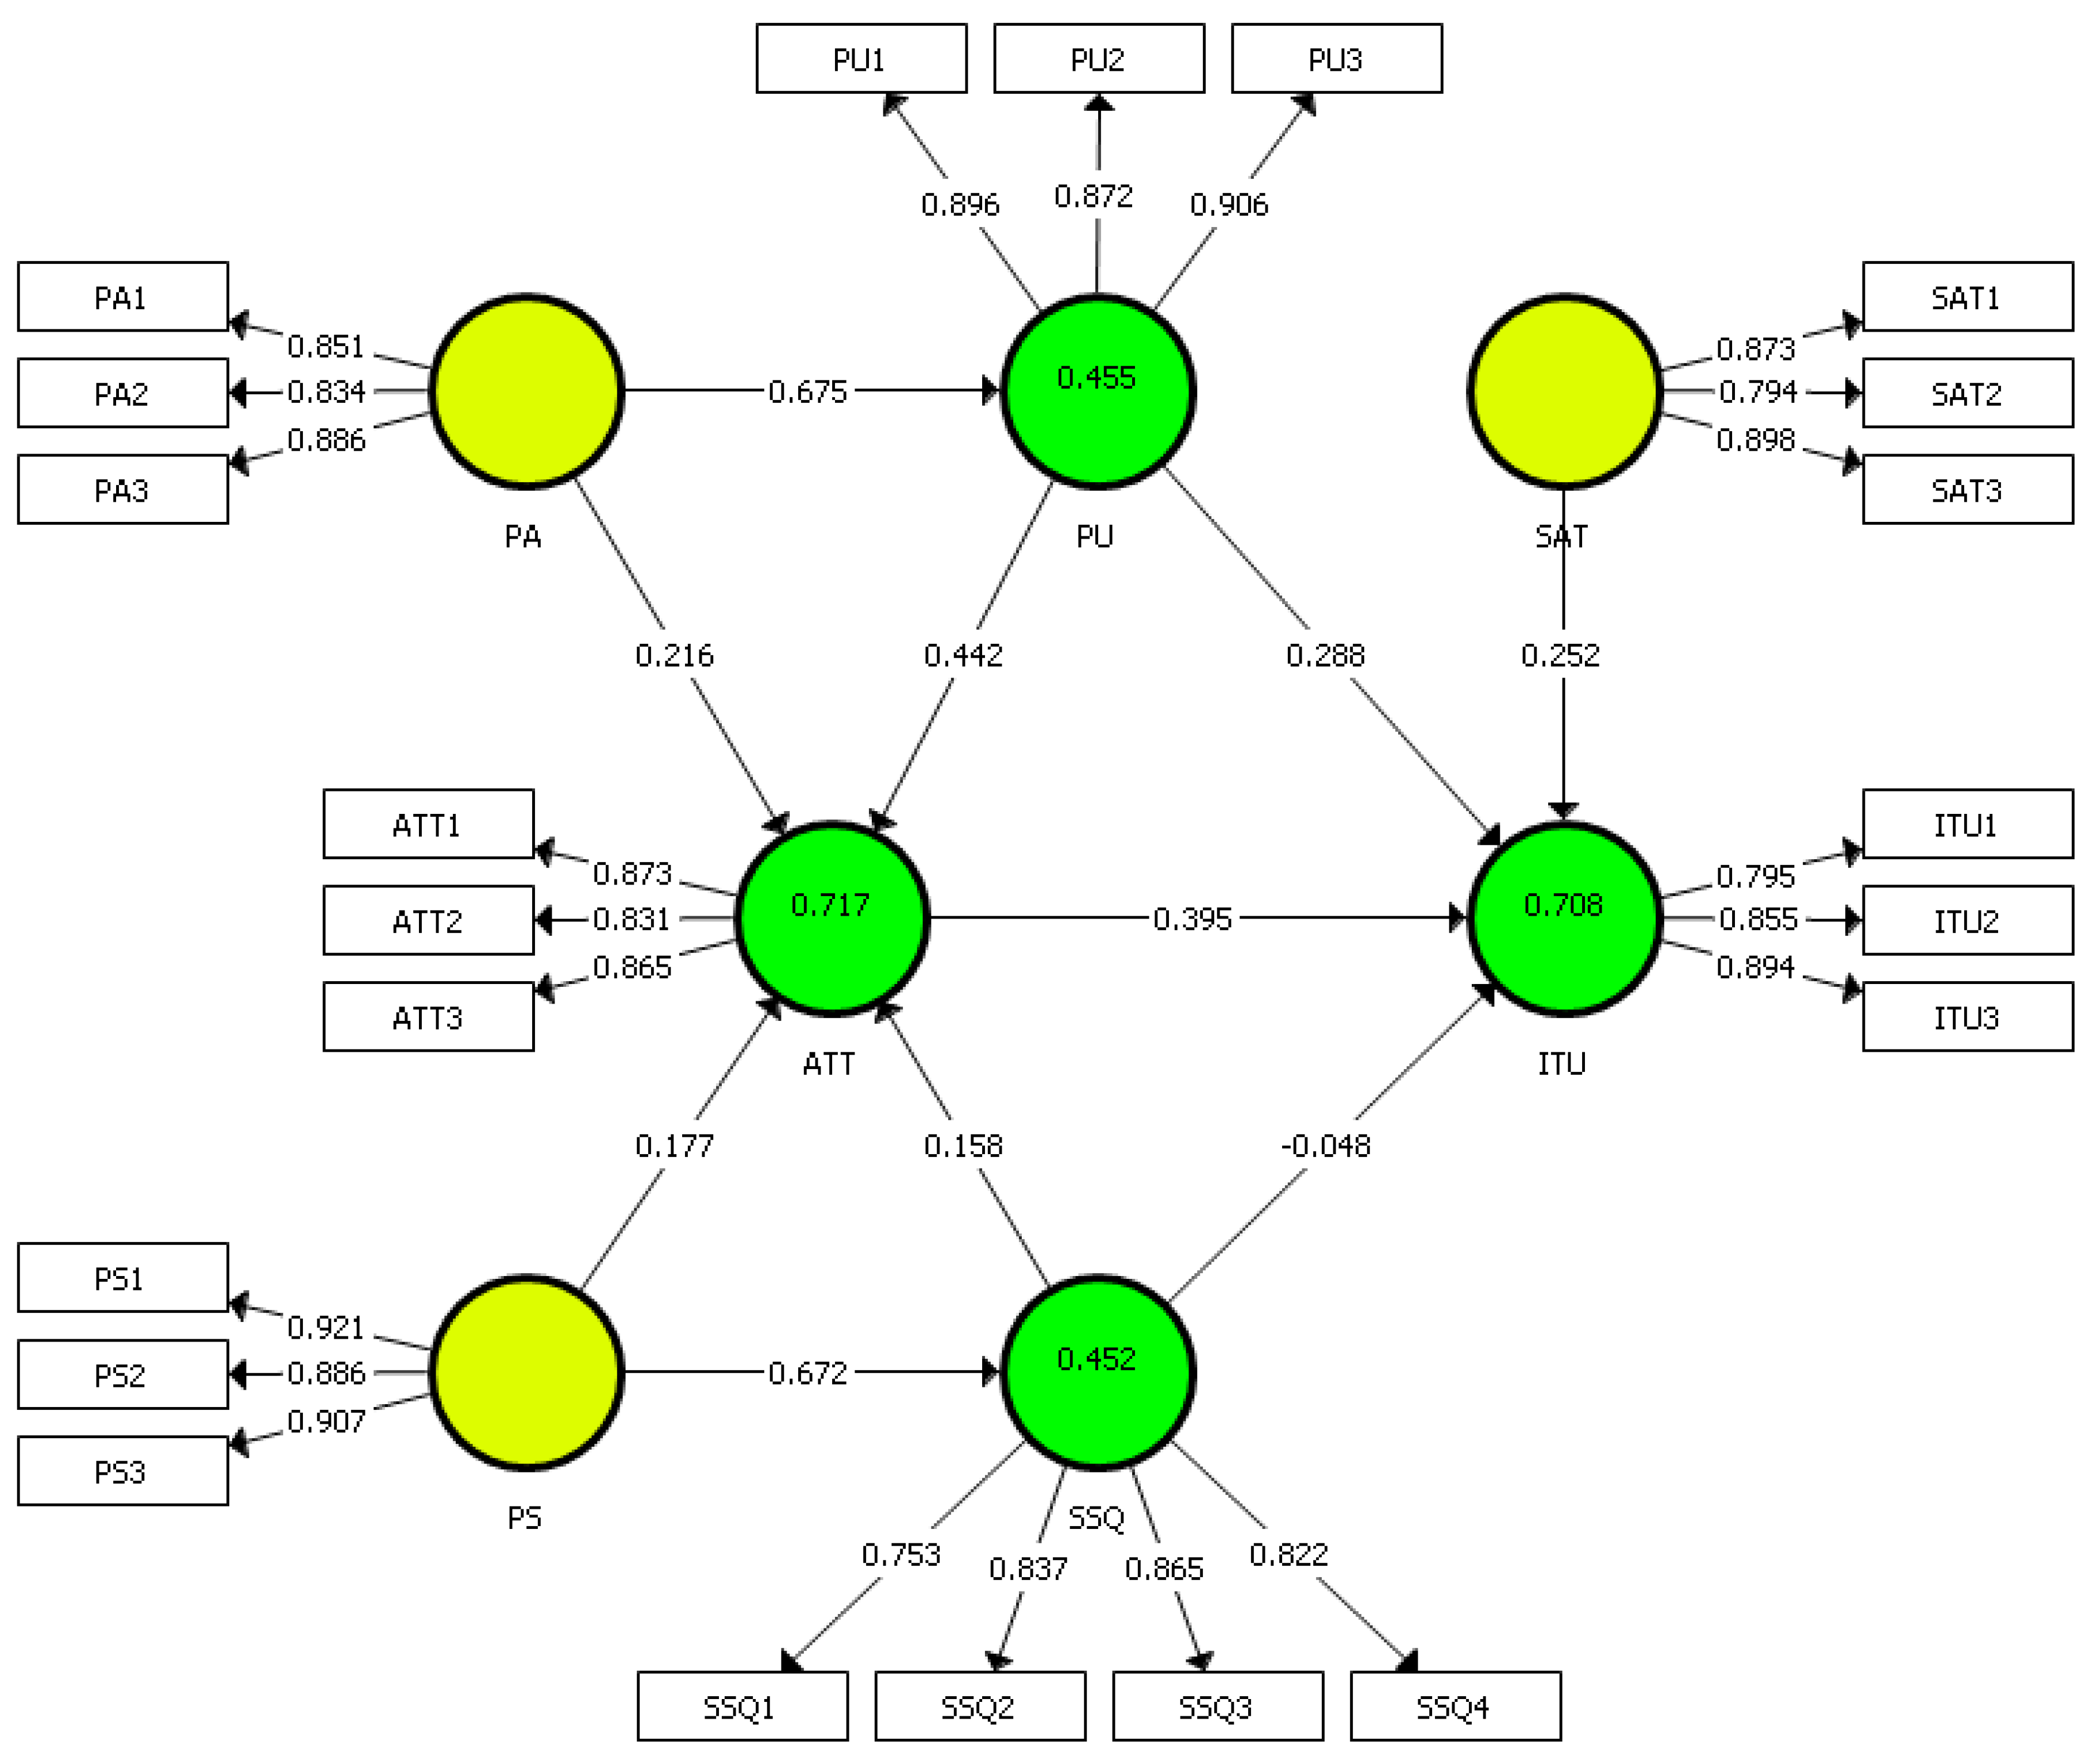
In the literature, the structural equation modeling (SEM) technique concerns many different phenomena (Figure 2). Selection of measures depends on prespecified research goals and relations among variables (Figure 3).
In our theoretical contribution, we advance previous studies in the following areas. Comparing to Le and Cao [33], they used only five latent variables, and only four were validated after model measurement. They did not use external variables, and their sampling method was not executed to the specialist in the field but friends. Our model contains seven latent variables, and we directed our study to professionals in the cloud computing fields. We believe that this improvement will produce more reliable results. Similar applies to advancing previous work of Alotabibi [34]. The author used external variables closely related to the TAM model and invited study participants from an unknown event. Our study advances it by using external variables closer related to cloud computing like usability, availability, service & system quality, and security. The work of Singh and Mansotra [39] contains a very complex model of 32 hypotheses. Still, they did not provide any information on the data source, neither sample size nor sampling method. We have constructed a model that connects TAM concepts with CC in our work, and we simplify its understanding. We also rely on professionals in the field.

2.2. Cloud Computing

Cloud types allow different levels of service configuration at both hardware and software levels. They are characterized by different purposes, which makes them differently priced by suppliers. There are recognized CC types: Infrastructure as a Service (IaaS); Platform as a Service (PaaS), and Software as a Service (SaaS) [41].
Hosting types allow customers to choose the way they want to deliver the service, which is tailored to the existing IT infrastructure, subscription and maintenance costs, and company privacy policy. They directly affect data security, and the way calculations are performed, and data is stored. We differentiate between these hosting types: private cloud. public cloud, hybrid cloud, and social cloud [42].
The characteristics of the cloud are the main element distinguishing cloud solutions from their offline counterparts as well as other network services. On-demand access is about enabling the recipient to quickly and easily configure cloud resources, such as computing power, network, or disk space, at any time. The user does not need to know about the physical hardware [43]. Scaling is possible with virtual machines (VM). As customer demand increases or the number of users increases, new resources are automatically allocated [44]. When a user reduces the computing power requirement, resources are released and assigned to other users. The whole process is supervised by Hypervisor and load balancer software, which oversees and predicts the potential load on VMs. Mobility is provided via the Internet. Users can access resources anytime and anywhere and from any device [45]. It allows users to continue working on any device with Internet access. Grouping of resources consists of combining resources to share and synchronize them automatically. Examples of resources that can be grouped are servers, virtual machines, disk space, networks, CPU units, and RAM [46]. Synchronization allows multiple users to work together and access the most current versions of files. Measurability of the service is ensured by constant monitoring of resource usage by users. Data is collected, reported, and made available to calculate the cost of the service [47]. Information is provided to customers, which enables them to choose an appropriate service tailored to the current demand.
The advantages of the cloud are the main elements that determine its popularity. Computer software and licenses for many users can generate huge costs for the customer. Cloud computing is a much cheaper solution available in various subscriptions, prepayment, or one-time purchase models. Apart from that, the price of infrastructure development is lower and is fully supplied by the provider [48]. The customers do not have to maintain IT departments that deal with maintaining the infrastructure.
Cloud makes hardware resources available immediately, without any additional investment from the user. It allows IT costs (hardware investments) to be converted into operating costs (cloud subscription). It makes it much easier for new companies without IT support to enter the market. Expansion of the hardware infrastructure is standardized to the extent that adding computing power is not a problem [49]. Suppliers have ready-made packages in their offer, from which customers can build their solutions. The packages consist of various hardware and software configurations. Modules are added immediately, and it also generates lower costs than creating step-by-step configurations by selecting each component separately [50]. This form of service extension is possible through virtualization.
Using the cloud, users can continue working regardless of place, time, or device. Broad access to data and the ability to work in co-operative mode significantly increases productivity [51]. Cloud provides users with business continuity and data security during a failure. There is no problem with traditional server solutions, where expensive RAID arrays need to be configured to provide a copy of data [52]. The entire process of installation, configuration, and upgrade of the system and the default applications is done on the vendor’s side, which provides customers with access to the latest solutions immediately, through a ready interface such as a web browser [53].
Data security is a crucial component of all computer systems. In the case of the cloud, creating sufficient protection is a significant challenge for suppliers, as this technology combines most of the existing IT solutions. Cloud computing security is more complicated because it requires controlling the entire environment on two levels: physical and virtual machines. If a physical server is attacked, all virtual machines that use it will be compromised, and vice versa: an attacked virtual machine may infect the servers it uses. Providers prevent attacks by isolating instances of VMs from each other, introducing multi-stage user verification, and leaving administration and software issues to their clients [54].
The main threats associated with the use of cloud computing are external attacks on infrastructure, spying on clients’ VMs by providers, and attacks between users, which include attacks on VMs and side-channel attacks [55]. Infrastructure can be attacked through network nodes, after intercepting, in which an attacker can modify the query results displayed, carry out DoS attacks, or access sensitive user data [56].
Clients perform operations on virtual machines, which means that many users use the same hardware. It creates the risk of data leakage or access to data by unauthorized persons [57]. The calculations are performed in any place that currently has sufficient resources, which makes it significantly challenging to secure the performed calculations. For example, if a user decides to simulate a weather forecast, a significant increase in computing power demand will be detected, forcing the environment to allocate free resources with the fastest access time (within a purchased package), regardless of their physical location. It is complicated to find later the drives and processors that were involved in this calculation. Data stored in the cloud is defragmented across the entire disk space and has many unnecessary copies that are not needed to ensure data continuity. It makes it difficult to locate sensitive data in the cloud and secure it accordingly. Many environments hold data without proper encryption to speed up the services provided [58].
The problem of cloud computing lies in its layered architecture, which is reflected in the presented cloud types. A cloud computing type consists of a combination of multiple layers of objects (virtual machines, APIs, services, and applications) where the functionality and security of higher layers depend on lower layers. The consequence of such an architecture is that the entire structure is exposed when a single object is compromised. It makes it difficult to manage security policies and access rights [59]. Cloud computing is continuously evolving, with the risk of new security gaps.

3. Focal Theories, Conceptual Framework, and Hypotheses Development

The paper proposes the model that aims to identify key variables, for both users and providers, that encourage the use of the cloud. The inspiration for looking for non-technical factors influencing the use of technology was the technology acceptance model (TAM) theory describing possible reasons for the acceptance of solutions and technologies by users.
Structural equation modeling (SEM) is defined as a set of procedures and statistical tools to measure causal relationships in empirical research. The SEM method allows for simultaneous consideration of relationships between independent and dependent and measurable (observable) and unobservable (hidden) variables [60]. We have used component-based SEM. It regards latent variables as weighted composites of observed variables in multivariate statistics such as canonical correlation analysis and principal component analysis. SEM modeling is divided into two main types: covariance-based modeling (CB-SEM) and partial least squares modeling (PLS-SEM) [61]. PLS-SEM is used in this study and it represents composite-based SEM method. PLS-SEM has gained increasing dissemination in current applications in scientific work [62].
The TAM is a theory proposed by Fred Davis [63] that assumes that the use of a system can be explained or predicted by user motivations directly influenced by external factors such as the characteristics and capabilities of the system [64].

3.1. Hypotheses Development

The following constructs supported by TAM theory were proposed or were used in models with similar themes to create the proposed SEM model.
Perceived usefulness (PU) of technologies is one of the most important elements in the Technology Acceptance Model (TAM). The PU is understood as the degree to which a user of a particular system believes that it would improve his/her work or study performance as compared to alternative methods of carrying out this user’s tasks [65,66]. Perceived usefulness influenced the decision of a user on whether to accept or reject the particular technology. In accordance with the original TAM [63], user’s PU influences his/her Attitude Towards Using and Intention to Use technology. It determines the extent to which users believe that using services in the cloud improves their performance at work and will have a positive impact on their attitude and willingness to use such services again [22]. Proposed hypotheses are:
Hypothesis (H1).
Perceived usefulness will have a positive impact on the intention to use.
Hypothesis (H2).
Perceived usefulness will have a positive impact on the attitude.
The perceived availability of cloud computing solutions can be another important factor affecting users’ adoption on cloud computing. Availability has been one of the biggest challenges for providers, and many services can be used to improve the availability of a service [67]. Cloud services provide users with access to a virtual reality where they can communicate and exchange information and data. It determines the extent to which users feel connected to the network and its resources, which builds a sense of co-presence and cooperation between them [22]. Proposed hypotheses are:
Hypothesis (H3).
Perceived availability will have a positive impact on perceived usefulness.
Hypothesis (H4).
Perceived availability will have a positive impact on the attitude.
Service & system quality (SSQ) is the perceived performance level of a particular system and its services. System and service quality refers to the perceived level of the general performance of a particular system and its service [68]. Research has revealed positive relationships between quality of service and system and user perceptions of that service and system. For example, DeLone and McLean (1992) [68] demonstrated that the service and system quality primarily determine users’ behavioral intentions to use a particular information service and system. Cloud computing is both a system and a service, so this design will have a significant impact on users’ willingness to use and attitude [69]. Proposed hypotheses are:
Hypothesis (H5).
Service & system quality will have a positive impact on attitude.
Hypothesis (H6).
Service & system quality will have a positive impact on the intention to use.
Perceived security (PS) is the degree to which users believe in the security of a service. Users’ perception of security protection is a cognitive process that would affect emotional and behavioral intentions. When users recognize high level of security protections, security control mechanisms and/or procedures of their cloud computing solutions, it confirms their expectation that the service is stable to use [70]. It can have a significant psychological impact on the way users perceive cloud solutions and on the level of acceptance of these solutions [69]. Proposed hypotheses are:
Hypothesis (H7).
Perceived security will have a positive impact on services and system quality.
Hypothesis (H8).
Perceived security will have a positive impact on the attitude.
Attitude (ATT)—the intention of an individual is to engage in specific behaviors defined by his/her subjective norms and attitudes. The survey conducted in [71] showed that Attitude Towards Using (ATT) had not affected the Intention to Use (among 122 college students). It is explained by the difference in technologies and user population. It is also suggested that a positive perception of the usefulness of technology is more important than the attitude towards applying this technology. The relationship between attitude and intention has been emphasized in the TAM theory and is included in the model [23]. The proposed hypothesis is:
Hypothesis (H9).
Attitude will have a positive impact on the intention to use.
Satisfaction (SAT)—User satisfaction with a particular service or system is positively related to the desire to use the service [23]. The proposed hypothesis is:
Hypothesis (H10).
Satisfaction will have a positive impact on intention to use.
The model is shown in Figure 4. It describes the direction of the relationship, the effect of which will be calculated later.

3.2. Conceptual Framework

The data set was prepared to check the quality and to perform the estimation. Then, it was determined whether the types of variables are reflective or formative. The hypotheses were tested, and relations between them were checked [72]. The presented model consists only of reflective items connected to the variables.
For each reflective item, the loading should be checked. The condition for a variable to be acceptable is that it has a loading above 0.7, which means that the construct explains 50% of the data variance. The average variance extracted (AVE) value should be above 0.5 [72].
Reliability is verified by three indicators: Cronbach’s alpha, reliability ρA (rho_A), and composite reliability ρc. Each reliability indicators are considered good in the range of 0.7 to 0.95. A score above 0.95 means that the data are identical. The reliability ρA factor should have a value between the Cronbach alpha and the composite reliability ρc [72].
Then, with the Fornell-Lacker criterion, discriminant validity is assessed. It makes it possible to determine whether the constructs’ measures are similar to each other. Based on the correlations from the model, the AVE of each of the latent constructs should be higher than the highest squared correlation with any other latent variable [73]. If that is the case, discriminant validity is established on the construct level. Discriminant validity assessment in PLS-SEM involves analyzing Henseler et al.’s (2015) [74] heterotrait-monotrait ratio (HTMT) of correlations. The suggested threshold is a value of 0.90, when the path model included constructs that are conceptually very similar. Our model presents this concept. The heterotrait-monotrait ratio of correlations is a new criterion to assess the discriminant validity in variance-based structural equation modeling, which is superior compared with the Fornell-Larcker criterion and (partial) cross-loadings.
After examining the quality of the variables, the model should be estimated. If the variables in the model are significant, the following should be checked: R2 determination factor and path coefficient. R2 is between 0 and 1. A result above 0.75 is considered significant. If a result is between 0.5 and 0.75 is moderately significant, all results below 0.5 are at a low level of insignificancy [75]. Coefficient ƒ2 means the size of the effect. Values below 0.15 mean small effect, the range from 0.15 to 0.35 means medium effect, while everything above 0.35 has a large effect [61].
The choice of cloud computing is influenced by many factors not related to the technical aspect of the technology itself. According to the TAM theory, psychological factors, the image of the provider, and the general opinion about the service are important when it comes to choosing a cloud computing solution [64]. Security is a priority among many clients of cloud solutions, and the level of trust in the provider may prevail in the choice of the solution. The transparency of the offer affects whether the customer will notice the potential applications of particular cloud solutions [22]. Table 2 presents a list of questions with acronyms and a set of latent variables.
The respondents were supposed to express their degree of agreement or disagreement with the statements by marking the answers on the seven-grade Likert scale. This way of formulating the answers was justified by the subsequent ease of application of the study results in the SEM model, which is based on numerical values.
The following factors can drive sample size in a structural equation model design [61]: significance level, statistical power, minimum coefficient of determination (R2 values) used in the model, and a maximum number of arrows pointing at a latent variable. In our study, we determine a significance level of 5%, a statistical power of 80%, and we would like to discover R2 values of at least 0.10. Our model has a maximum number of arrows pointing at a latent variable as 4. The minimum sample size for this setting is 137 [76].

4. Results

4.1. Research Methodology

A survey was conducted using Google Forms. We have prepared a questionnaire containing items defined in Table 2. In introducing the study, we explained our research goals and stressed that it is entirely anonymous. We used the nonprobability sampling method, and we published our questionnaire on 27 January 2020. As a convenient sampling method, we asked members of the Facebook Group called “Cloud in Poland” to participate in the study. We directed our study to professionals in cloud computing. The questionnaire was opened for one month, and we closed it at the end of February 2020. The results are presented in Table 3.
Most of the respondents were men—69%. The largest number of respondents in both groups lived in cities up to 250,000 inhabitants. Most of the respondents work full-time—60%; most of them are in the 25–44 age range—70%. The influence of education on professional status is similar both in the group of women and men. Higher education dominates among people working full-time and with cloud computing.

4.2. Data Analysis

SmartPLS3 ((SmartPLS GmbH, Bönningstedt, Germany)) was used to calculate the model [77]. In the first run, the model was calculated with the centroidal PLS algorithm. The number of iterations was set to 300 and the stop criterion to 10−X with selected 7. Then, the model was calculated with the Bootstrap algorithm, in which the number of samples was set to 5000 for the full version with bias-corrected and accelerated in two-tailed distribution. The study began by examining the relevance of indicators for reflective variables. The results are presented in Table 4.
The scores presented in Table 4 show the results for the reflective variables. According to the methodology, all variables are good. Both the results for the variable loadings and the reliability and AVE coefficients exceed the minimum threshold. The composite reliability meets the condition >0.7. Cronbach’s alpha is also within the specified range from 0.7 to 0.9. The reliability ρA is between Cronbach’s Alpha and the composite reliability for all latent variables. All the constructs differ significantly because the Fornell-Larcker criterion and HTMT test are assessed (Table 5 and Table 6) [73].
Figure 5 shows the final version of the model after calculating the PLS algorithm. The strongest relationship is between perceived availability and perceived usefulness, and between perceived security and service & system quality. The weakest relations occur between services & system quality and attitude, and between perceived security and users’ attitude. The remaining relationships remain at an average level. The only effect of service & system quality on the intention to use is not significant. Table 7 presents detailed results for model estimation.
The ƒ2 effect size for paths PU → ITU, PA → ATT, PS → ATT, SSQ → ATT, SAT → ITU, and ATT → ITU is small and does not exceed 0.15. The medium effect size (between 0.15 and 0.35) is found for the path PU → ATT. The PA → PU and PS → SSQ paths have a large effect size value of ƒ2. For all, except one, the p value of path coefficients meets the condition <0.05 and is therefore considered relevant for the model. Nine out of ten hypotheses have been verified and considered relevant.
The determination factor R2 for latent variables indicates moderate to a strong fit of the model. R of the variable PU at 0.445 means that the model explains 45.5% variance of the variable. The same applies to the variable SSQ. The model explains 45.2% of the variance. The model also explains the 70.8% variance of the intention to use and 71.7% variance of attitude.

5. Discussion

The SEM model has been successfully verified using SmartPLS3. The results of the tests indicate that the proposed designs have a significant and real impact on the intention to use cloud services. Particular attention should be paid to two latent variables: perceived availability and perceived security. These two variables have a strong, direct, and positive impact on perceived usefulness (0.675) and service & system quality (0.672), respectively. Availability and security are, therefore, the foundations for shaping users’ desire to use cloud computing. They should be a priority for service providers and be continuously developed.
Perceived usefulness has a significant positive impact on users’ attitudes (0.442) and a direct positive impact on the intention to use at an average level (0.288). Users’ attitude has an average impact on their intention to use the service (0.395). Perhaps, changing the path from SAT → ITU, which has a low positive impact (0.252), to the SAT → ATT path, would give better path coefficient results, as well as strengthen the impact of user attitudes on the intention to use. The paths between perceived security and attitude, and service & system quality and attitude, have a low positive impact (not exceeding 0.177). Only one of the hypotheses has not been confirmed. No significant effect was found between SSQ and ITU. The reason for this result is probably that CC users expect high system and service quality. Popular CC solutions belong to well-known technology companies like Google, Microsoft, Amazon, and others. Users are used to high-quality service; that is why this does not influence the CC’s intention to use.
A literature review has been carried out to present the basic concepts related to cloud computing. It allowed systematizing knowledge related to adoption of the sustainable cloud computing solutions. In the basic scope, the working, potential benefits, and risks associated with the use of cloud solutions were characterized.
In the practical part of the work, non-technical factors that may influence the choice of cloud solutions by users were analyzed. For this purpose, the hypotheses presented in the TAM theory were used, which made it possible to create a set of latent variables, which, after verification, were used in the SEM model. The research adapted the work of Park and Kim [22]. A broader concept was presented than in referenced work because it did not focus solely on the study of mobile solutions. The research subject consisted of users living in a different region, having different experiences in using the cloud.
The results of the SEM analysis can be used to understand user needs better. Security and service availability are key elements that users pay attention to. Cloud providers should focus on developing these two aspects.
This study has some limitations. First, the study was narrowed to users who use CC solutions in professional activities. Perhaps, results could be different when the study would cover different types of the user, e.g., occasional CC user or user using only a few CC services like e.g., virtual drive. Second, there are some non-observable factors influencing the user’s choice of adopting CC solutions, e.g., brand recognition, convenience, or imposed solution.
Cloud computing is the future of the IT industry, so it should be continuously researched and developed. The presented information brings closer characteristics, types, forms of hosting, and security of cloud computing. It is the foundation for understanding cloud computing. The changes taking place in the way cloud services are provided make it challenging to identify specific solutions based on features such as a model or form of hosting. In the future, these boundaries will be transformed with the technological progress of the cloud.
SEM methodology has enabled cloud computing to be viewed from a user’s perspective, more accurately than using existing research methods. The results of the study are a determinant of the relevant infrastructure factors, from the viewpoint of the user. It allows for better adjustment of services by providers as well as setting targets for further research on the market for cloud solutions. The impact of other factors on the intention to use a cloud, such as multiplatform, continuity of service, reliability, and substitutability, should also be examined. Another sequence of connections between constructs may provide better explanations of structure in the model.
Solutions available on the market allow implementing any system and application at a low cost. It is the main factor that proves the popularity of the cloud. The security of such solutions remains a contentious issue, as the growing number of users is associated with an increasing infrastructure threat. It may be the cause of many future data leaks caused by human factors. Continuous security development supported by artificial intelligence should ensure a reasonable level of security from the provider. The confidentiality of data stored in third-party VMs creates the risk that unauthorized persons may read it. This is not facilitated by the fact that cloud servers are located in many different countries with different legal systems. Security and confidentiality of data will be the main challenges to be solved by service providers. Perhaps blockchain technology will enable these problems to be addressed.
The findings of this study are argued to be useful for customers, practitioners, and policy makers, who are involved in utilizing and promoting the adoption of cloud computing among organizations. ICT adoption for sustainable development should be based on careful analysis of potential customers’ preferences. Therefore, the evaluation of their willingness to implement the CC solution is necessary. In the future, further research works are to be continued. Researchers are expected to focus particularly on customers’ recognition of cloud computing as green ICT because of its capabilities of energy efficiency increase and greenhouse gas reduction.

6. Conclusions

The study aimed at identifying factors influencing the intention to use cloud computing solutions. It proposed an extended TAM model tailored to fit the context of cloud computing. Based on regression analysis, the results herein support the proposed model, as nine out of the ten hypotheses were confirmed. The results have shown that perceived availability, perceived security, perceived usability, and service & system quality positively impacted the attitude towards using. Besides this, perceived usability satisfaction and attitude towards using had a positive impact on the intention to use, as service & system quality was shown as having no effect on the intention to use. The research results have provided reliable information for providers of cloud computing solutions to make business decisions. Additionally, this study contributes to the research on the behavioral intention of using information technology based on TAM. Therefore, this study has provided user acceptance hints for cloud computing practitioners while also opening up several new directions for further research.

Author Contributions

Conceptualization, K.P.; methodology, A.S.; software, A.S.; validation, K.P. and A.S.; formal analysis, M.P.; investigation, K.P.; resources, A.S.; data curation, K.P.; writing—original draft preparation, K.P.; writing—review and editing, A.S.; visualization, K.P.; supervision, M.P.; project administration, A.S.; funding acquisition, M.P. All authors have read and agreed to the published version of the manuscript.

Funding

This research received no external funding

Conflicts of Interest

The authors declare no conflict of interest.

References

  1. Mell, P.M.; Grance, T. The NIST definition of cloud computing. NIST Spec. Publ. 2011, 800, 1–7. [Google Scholar] [CrossRef]
  2. Gorelik, E. Cloud Computing Models; Massachusetts Institute of Technology: Cambridge, MA, USA, 2013. [Google Scholar]
  3. Malhotra, L.; Agarwal, D.; Jaiswal, A. Virtualization in cloud computing. J. Inf. Technol. Softw. Eng. 2014, 4, 1–3. [Google Scholar] [CrossRef] [Green Version]
  4. Raj, P.; Periasamy, M. The convergence of enterprise architecture (EA) and cloud computing. In Cloud Computing for Enterprise Architectures; Springer: London, UK, 2011; pp. 61–87. [Google Scholar]
  5. Castro-Leon, E.; Harmon, R. Cloud as a Service; Apress: Berkeley, CA, USA, 2016; ISBN 978-1-4842-0104-6. [Google Scholar]
  6. Thomson, J.D. Cloud computing and the emerging market. In Cloud Computing for Enterprise Architectures; Springer: London, UK, 2011; pp. 249–261. [Google Scholar]
  7. Hilty, L.M.; Aebischer, B. ICT for sustainability: An emerging research field. In ICT Innovations for Sustainability; Camarinha-Matos, L.M., Afsarmanesh, H., Ortiz, A., Eds.; Springer: Cham, Switzerland, 2015; pp. 3–36. [Google Scholar]
  8. Benn, S.; Dunphy, D. New forms of governance: Changing relationships between corporates, government and community. In Corporate Governance and Sustainability; Routledge: New York, NY, USA, 2007; pp. 9–35. ISBN 9780203390122. [Google Scholar]
  9. Beckett, R.C. Perceptions of Value That Sustain Collaborative Networks. In Collaborative Networks and Their Breeding Environments; Camarinha-Matos, L.M., Afsarmanesh, H., Ortiz, A., Eds.; Springer: New York, NY, USA, 2005; pp. 329–336. [Google Scholar]
  10. Murugesan, S. Harnessing green IT: Principles and practices. IT Prof. 2008, 10, 24–33. [Google Scholar] [CrossRef]
  11. Davis, F.D. Perceived usefulness, perceived ease of use, and user acceptance of information technology. MIS Q. 1989, 13, 319. [Google Scholar] [CrossRef] [Green Version]
  12. Venkatesh, V.; Davis, F.D. A theoretical extension of the technology acceptance model: Four longitudinal field studies. Manag. Sci. 2000, 46, 186–204. [Google Scholar] [CrossRef] [Green Version]
  13. Venkatesh, V.; Morris, M.G.; Davis, F.D. User acceptance of information technology: Toward a unified view. MIS Q. 2003, 27, 425. [Google Scholar] [CrossRef] [Green Version]
  14. Samuelson, W.; Zeckhauser, R. Status quo bias in decision making. J. Risk Uncertain. 1988, 1, 7–59. [Google Scholar] [CrossRef]
  15. Kahneman, D.; Tversky, A. Choices, values, and frames. Am. Psychol. 1984, 39, 341–350. [Google Scholar] [CrossRef]
  16. Lee, C.; Coughlin, J.F. Perspective: Older adults’ adoption of technology: An integrated approach to identifying determinants and barriers. J. Prod. Innov. Manag. 2015, 32, 747–759. [Google Scholar] [CrossRef]
  17. Lai, P. The literature review of technology adoption models and theories for the novelty technology. J. Inf. Syst. Technol. Manag. 2017, 14, 21–38. [Google Scholar] [CrossRef] [Green Version]
  18. Cao, Q.; Niu, X. Integrating context-awareness and UTAUT to explain Alipay user adoption. Int. J. Ind. Ergon. 2019, 69, 9–13. [Google Scholar] [CrossRef]
  19. Li, C.; Zhou, M.; Liu, X.; Wang, T. Usability study of electronic sphygmomanometers based on perceived ease of use and affordance. In Human Aspects of IT for the Aged Population. Design for the Elderly and Technology Acceptance; Zhou, J., Salvendy, G., Eds.; Springer: Cham, Switzerland, 2019; pp. 421–430. [Google Scholar]
  20. Arpaci, I. Understanding and predicting students’ intention to use mobile cloud storage services. Comput. Hum. Behav. 2016, 58, 150–157. [Google Scholar] [CrossRef]
  21. Behrend, T.S.; Wiebe, E.N.; London, J.E.; Johnson, E.C. Cloud computing adoption and usage in community colleges. Behav. Inf. Technol. 2011, 30, 231–240. [Google Scholar] [CrossRef]
  22. Park, E.; Kim, K.J. An integrated adoption model of mobile cloud services: Exploration of key determinants and extension of technology acceptance model. Telemat. Inform. 2014, 31, 376–385. [Google Scholar] [CrossRef]
  23. Sabi, H.M.; Uzoka, F.M.E.; Langmia, K.; Njeh, F.N. Conceptualizing a model for adoption of cloud computing in education. Int. J. Inf. Manag. 2016, 36, 183–191. [Google Scholar] [CrossRef]
  24. Sharma, S.K.; Al-Badi, A.H.; Govindaluri, S.M.; Al-Kharusi, M.H. Predicting motivators of cloud computing adoption: A developing country perspective. Comput. Hum. Behav. 2016, 62, 61–69. [Google Scholar] [CrossRef]
  25. Shiau, W.L.; Chau, P.Y. Understanding behavioral intention to use a cloud computing classroom: A multiple model comparison approach. Inf. Manag. 2016, 53, 355–365. [Google Scholar] [CrossRef]
  26. Shin, D.H. User centric cloud service model in public sectors: Policy implications of cloud services. Gov. Inf. Q. 2013, 30, 194–203. [Google Scholar] [CrossRef] [Green Version]
  27. Wu, W.; Lan, L.W.; Lee, Y. Factors hindering acceptance of using cloud services in university: A case study. Electron. Libr. 2013, 31, 84–98. [Google Scholar] [CrossRef] [Green Version]
  28. Burda, D.; Teuteberg, F. The role of trust and risk perceptions in cloud archiving—Results from an empirical study. J. High. Technol. Manag. Res. 2014, 25, 172–187. [Google Scholar] [CrossRef]
  29. Jou, M.; Wang, J. Observations of achievement and motivation in using cloud computing driven CAD: Comparison of college students with high school and vocational high school backgrounds. Comput. Hum. Behav. 2013, 29, 364–369. [Google Scholar] [CrossRef]
  30. Opitz, N.; Langkau, T.F.; Schmidt, N.H.; Kolbe, L.M. Technology Acceptance of Cloud Computing: Empirical Evidence from German IT Departments. In Proceedings of the 45th Hawaii International Conference on System Sciences, Maui, HI, USA, 4–7 January 2012; IEEE: Washington DC, USA, 2012; pp. 1593–1602. [Google Scholar]
  31. Shin, D.H. Beyond user experience of cloud service: Implication for value sensitive approach. Telemat. Inform. 2015, 32, 33–44. [Google Scholar] [CrossRef]
  32. Lai, Y.H. The social network analysis on the behavioral intention to use cloud sphygmomanometer. Health Technol. 2019, 10, 787–794. [Google Scholar] [CrossRef]
  33. Le, O.T.T.; Cao, Q.M. Examining the technology acceptance model using cloud-based accounting software of Vietnamese enterprises. Manag. Sci. Lett. 2020, 2781–2788. [Google Scholar] [CrossRef]
  34. Alotaibi, M.B. Exploring users’ attitudes and intentions toward the adoption of cloud computing in Saudi Arabia: An empirical investigation. J. Comput. Sci. 2014, 10, 2315–2329. [Google Scholar] [CrossRef] [Green Version]
  35. Ku, W.T.; Hsieh, P.J. Investigating users’ intention to use personal health management services: An empirical study in Taiwan. In Human Aspects of IT for the Aged Population. Design for the Elderly and Technology Acceptance; Zhou, J., Salvendy, G., Eds.; Springer: Cham, Switzerland, 2019; pp. 228–237. [Google Scholar]
  36. Tiwari, A.; Sharma, R.M.; Garg, R. Emerging ontology formulation of optimized internet of things (IOT) services with cloud computing. In Soft Computing: Theories and Applications; Pant, M., Sharma, T.K., Verma, O.P., Singla, R., Sikander, A., Eds.; Springer: Singapore, 2020; pp. 31–52. [Google Scholar]
  37. Wibowo, S.; Mubarak, S. Exploring Stakeholders Perceived Risk and Trust Towards their Intention to Adopt Cloud Computing: A Theoretical Framework. In Proceedings of the PACIS 2020, Dubai, UAE, 20–24 June 2020; pp. 1–8. [Google Scholar]
  38. Achilleos, A.P.; Kritikos, K.; Rossini, A.; Kapitsaki, G.M.; Domaschka, J.; Orzechowski, M.; Seybold, D.; Griesinger, F.; Nikolov, N.; Romero, D.; et al. The cloud application modelling and execution language. J. Cloud Comput. 2019, 8, 20. [Google Scholar] [CrossRef]
  39. Singh, J.; Mansotra, V. Towards Development of an Integrated Cloud-Computing Adoption Framework—A Case of Indian School Education System. Int. J. Innov. Technol. Manag. 2019, 16, 1950016. [Google Scholar] [CrossRef]
  40. Ercolani, G. Cloud Computing SaaS Assessment (CCSaaSA): Measuring and evaluating Cloud Services end-user perceptions. In Proceedings of the 7th European Conference on IS Management and Evaluation—ECIME 2013, Gdańsk, Poland, 12–13 September 2013; pp. 205–214. [Google Scholar]
  41. Xiao, Z.; Chen, J. Cloud computing security issues and countermeasures. In International Journal of Computer Networks; Springer: Cham, Switzerland, 2015; Volume 5, pp. 731–737. ISBN 9783319111032. [Google Scholar]
  42. Diaby, T.; Rad, B.B. Cloud computing: A review of the concepts and deployment models. Int. J. Inf. Technol. Comput. Sci. 2017, 9, 50–58. [Google Scholar] [CrossRef] [Green Version]
  43. Jeuk, S. A Tenant-Aware Identification Scheme for Cloud Computing; University College London: London, UK, 2019. [Google Scholar]
  44. Olive, C. Cloud Computing Characteristics are Key; General Physics Corporation: Elkridge, MD, USA, 2012. [Google Scholar]
  45. Cloud computing characteristics and services A brief review. Int. J. Comput. Sci. Eng. 2019, 7, 421–426. [CrossRef]
  46. Rashid, A.; Chaturvedi, A. A study on resource pooling, allocation and virtualization tools used for cloud computing. Int. J. Comput. Appl. 2017, 168, 7–11. [Google Scholar] [CrossRef]
  47. Noor, T.H. Usage and Technology Acceptance of Cloud Computing in Saudi Arabian Universities. Int. J. Softw. Eng. Appl. 2016, 10, 65–76. [Google Scholar] [CrossRef] [Green Version]
  48. Apostu, A.; Puican, F.; Ularu, G.; Suciu, G.; Todoran, G. Study on advantages and disadvantages of Cloud Computing—The advantages of Telemetry Applications in the Cloud. In Proceedings of the Recent Advances in Applied Computer Science and Digital Services; University Politechnica of Bucharest: Bucharest, Romania, 2013; pp. 118–123. [Google Scholar]
  49. Avram, M. Advantages and challenges of adopting cloud computing from an enterprise perspective. Procedia Technol. 2014, 12, 529–534. [Google Scholar] [CrossRef] [Green Version]
  50. Zhang, Q.; Cheng, L.; Boutaba, R. Cloud computing: State-of-the-art and research challenges. J. Internet Serv. Appl. 2010, 1, 7–18. [Google Scholar] [CrossRef] [Green Version]
  51. Miller, M. Cloud Computing Pros and Cons for End Users. Available online: http://wahyudi.staff.umy.ac.id/files/2010/05/co517.doc (accessed on 11 November 2020).
  52. Corrado, E.; Moulaison, H.L. Getting Started with Cloud Computing: A LITA Guide; Tennant, R., Ed.; Neal-Schuman Publishers: New York, NY, USA, 2004; ISBN 9781555707491. [Google Scholar]
  53. Pal, S.; Pattnaik, P.K. Efficient architectural framework for cloud computing. Int. J. Cloud Comput. Serv. Sci. 2012, 1. [Google Scholar] [CrossRef]
  54. Subramanian, N.; Jeyaraj, A. Recent security challenges in cloud computing. Comput. Electr. Eng. 2018, 71, 28–42. [Google Scholar] [CrossRef]
  55. Islam, T.; Manivannan, D.; Zeadally, S. A classification and characterization of security threats in cloud computing. Int. J. Next-Gener. Comput. 2016, 7, 268–285. [Google Scholar]
  56. Zhou, W.; Marczak, W.R.; Tao, T.; Zhang, Z.; Sherr, M.; Loo, B.T.; Lee, I. Towards Secure Cloud Data Management; University of Pennsylvania: Philadelphia PA, USA, 2010; Volume 1. [Google Scholar]
  57. Hilley, D. Cloud Computing: A Taxonomy of Platform and Infrastructure-Level Offerings; Georgia Institute of Technology: Atlanta, GA, USA, 2009. [Google Scholar]
  58. Inukollu, V.N.; Arsi, S.; Ravuri, S.R. Security issues associated with big data in cloud computing. Int. J. Netw. Secur. Appl. 2014, 6, 45–56. [Google Scholar] [CrossRef]
  59. Morsy, A.M.; Grundy, J.; Müller, I. An Analysis of the Cloud Computing Security Problem. In Proceedings of the APSEC 2010 Cloud Workshop, Sydney, Australia, 30 November 2010; pp. 1–6. [Google Scholar]
  60. Pietrzak, M.B.; Żurek, M. Ład społeczny w powiatach—Analiza przy użyciu modelowania równań strukturalnych SEM. Warm. Kwart. Nauk. Nauk. Społeczne 2012, 4, 189–200. [Google Scholar]
  61. Hair, J.F.; Hult, G.T.M.; Ringle, C.; Sarstedt, M. A Primer on Partial Least Squares Structural Equation Modeling (PLS-SEM), 2nd ed.; SAGE Publications, Inc.: Thousand Oaks, CA, USA, 2017; ISBN 9781483377445. [Google Scholar]
  62. Hair, J.F.; Hult, G.T.M.; Ringle, C.M.; Sarstedt, M.; Thiele, K.O. Mirror, mirror on the wall: A comparative evaluation of composite-based structural equation modeling methods. J. Acad. Mark. Sci. 2017, 45, 616–632. [Google Scholar] [CrossRef]
  63. Davis, F.D. A Technology Acceptance Model for Empirically Testing New End-User Information Systems: Theory and Results; Massachusetts Institute of Technology: Cambridge, MA, USA, 1986. [Google Scholar]
  64. Chuttur, M. Overview of the technology acceptance model: Origins, developments and future directions. sprouts work. Pap. Inf. Syst. 2009, 9, 1–23. [Google Scholar]
  65. Rizun, M.; Strzelecki, A. Students’ acceptance of the COVID-19 impact on shifting higher education to distance learning in Poland. Int. J. Environ. Res. Public Heath 2020, 17, 6468. [Google Scholar] [CrossRef] [PubMed]
  66. Abdullah, F.; Ward, R.; Ahmed, E. Investigating the influence of the most commonly used external variables of TAM on students’ Perceived Ease of Use (PEOU) and Perceived Usefulness (PU) of e-portfolios. Comput. Hum. Behav. 2016, 63, 75–90. [Google Scholar] [CrossRef]
  67. Endo, P.T.; Rodrigues, M.; Gonçalves, G.E.; Kelner, J.; Sadok, D.H.; Curescu, C. High availability in clouds: Systematic review and research challenges. J. Cloud Comput. 2016, 5, 16. [Google Scholar] [CrossRef] [Green Version]
  68. Delone, W.H.; McLean, E. Information systems success: The quest for the dependent variable. Inf. Syst. Res. 1992, 3, 60–95. [Google Scholar] [CrossRef]
  69. Hasan, L.M.; Zgair, L.A.; Ngotoye, A.A.; Hussain, H.N.; Najmuldeen, C. A review of the factors that influence the adoption of cloud computing by small and medium enterprises. Sch. J. Econ. Bus. Manag. 2015, 2, 842–848. [Google Scholar]
  70. Lim, S.H.; Kim, D.J.; Hur, Y.; Park, K. An empirical study of the impacts of perceived security and knowledge on continuous intention to use mobile fintech payment services. Int. J. Hum. Comput. Interact. 2019, 35, 886–898. [Google Scholar] [CrossRef]
  71. Masrom, M. Technology acceptance model and E-learning. In Proceedings of the 12th International Conference on Education, Brunei, Darussalam, 21–24 May 2007; pp. 1–10. [Google Scholar]
  72. Sarstedt, M.; Ringle, C.M.; Hair, J.F. Partial least squares structural equation modeling. In Handbook of Market Research; Springer International Publishing: Cham, Switzerland, 2017; pp. 1–40. ISBN 978-1-4522-1744-4. [Google Scholar]
  73. Fornell, C.; Larcker, D.F. Evaluating structural model with unobserved variables and measurement errors. J. Mark. Res. 1981, 18, 39–50. [Google Scholar] [CrossRef]
  74. Henseler, J.; Ringle, C.M.; Sarstedt, M. A new criterion for assessing discriminant validity in variance-based structural equation modeling. J. Acad. Mark. Sci. 2015, 43, 115–135. [Google Scholar] [CrossRef] [Green Version]
  75. Ali, F.; Rasoolimanesh, S.M.; Sarstedt, M.; Ringle, C.M.; Ryu, K. An assessment of the use of partial least squares structural equation modeling (PLS-SEM) in hospitality research. Int. J. Contemp. Hosp. Manag. 2018, 30, 514–538. [Google Scholar] [CrossRef] [Green Version]
  76. Kock, N. Minimum Sample Size Estimation in PLS-SEM: An Application in Tourism and Hospitality Research. In Applying Partial Least Squares in Tourism and Hospitality Research; Emerald Publishing Limited: Bingley, UK, 2018; pp. 1–16. ISBN 9781787566996. [Google Scholar]
  77. Ringle, C.M.; Wende, S.; Becker, J.M. SmartPLS 3. Bönningstedt: SmartPLS. 2015. Available online: http://www.smartpls.com (accessed on 11 October 2020).
Figure 1. TAM questionnaire’s recipients.
Sustainability 12 09930 g001
Figure 2. TAM Modification by adding new factors [32,33,34,35].
Sustainability 12 09930 g002
Figure 3. TAM Combining with other models [36,37,38,39,40].
Sustainability 12 09930 g003
Figure 4. Model showing the factors influence on the cloud solutions choice.
Sustainability 12 09930 g004
Figure 5. The model with estimated coefficients.
Sustainability 12 09930 g005
Table 1. Highly cited publications in repository Scopus.
NoReferenceFindingsNumber of Citations
1Arpaci (2016) [20]Attempts to build an improved research framework based on the TAM in order to identify factors that affect students’ attitudes toward and intentions in using mobile cloud storage services.90
2Behrend, Wiebe, London, & Johnson (2011) [21]Examine factors that lead to technology adoption in a higher education setting. They offer recommendations for community college administrators and others who seek a way to incorporate cloud computing.152
3Park & Kim (2014) [22]Identify and investigate number of cognitive factors that contribute to shaping user perceptions of and attitude toward mobile cloud computing services by integrating these factors with the TAM.128
4Sabi, Uzoka, Langmia, & Njeh (2016) [23]Propose a model that takes into account contextual, economic, and technological influences in the perception and adoption of cloud computing at universities in sub-Saharan Africa.117
5Sharma, Al-Badi, Govindaluri, & Al-Kharusi (2016) [24]Attempt to develop a hybrid model to predict motivators influencing the adoption of cloud computing services by ICT professionals. Data were collected from 101 IT professionals and analyzed using multiple linear regression (MLR) and neural network (NN) modeling. 81
6Shiau & Chau (2016) [25]Tested, compared, and unified well-known theories, namely service quality (SQ), self-efficacy (SE), the motivational model (MM), the technology acceptance model (TAM), the theory of reasoned action or theory of planned behavior (TRA/TPB), and innovation diffusion theory (IDT), in the context of cloud computing classrooms.104
7Shin (2013) [26]Examines the acceptance of cloud computing services in government agencies. The study expanded upon the TAM by incorporating contextual factors such as availability, access, security, and reliability.67
8Wu et al. (2013) [27]Authors propose an evaluation framework that incorporates the DEMATEL theory with TAM model. The evaluation procedures were tested on a university after implementation of the internal cloud service.45
9Burda & Teuteberg (2014) [28]Authors explain end-user adoption of cloud storage as a means of personal archiving. In the TAM model, the incorporate users’ perceptions of risk, trust, reputation, user satisfaction, and intention to use cloud storage.39
10Jou & Wang (2013) [29]Authors analyze learning attitudes and academic performances driven by cloud computing technologies application. Technology Acceptance Model (TAM) was used to measure academic performance. The results indicated no significant differences in the cognitive domain between the high school students and vocational school learners.36
11Opitz et al. (2012) [30]Authors have done research in a group of CIOs (Chief Information Officer) and IT managers. They have found that factors such as image, job relevance and perceived usefulness are important for cloud computing acceptance.31
12Shin (2015) [31]Author argues that user intentions and behaviors are largely influenced by the cloud services values, i.e., availability, access, security, and reliability. These values are significant determinants of usefulness and ease of use in cloud computing.31
Table 2. Items in the survey.
Latent VariablesItems
Perceived usabilityPU1I think cloud computing services are useful in my work
PU2Using cloud computing services increases my productivity
PU3Using cloud computing improves my work efficiency and my effectiveness
Perceived availabilityPA1Cloud computing allows me to access data and information anytime and anywhere
PA2I can access services at any time through any device with a browser
PA3I feel comfortable because I can freely use cloud resources as I need
Service & system qualitySSQ1Devices with access to the cloud provide more services
SSQ2I have not encountered any restrictions when using the cloud
SSQ3I didn’t encounter any problems when using the cloud
SSQ4Cloud computing devices fully meet my needs
Perceived securityPS1I’m sure the data stored in the cloud is private
PS2I believe that no one can view my information or data stored in the cloud without my consent.
PS3I believe my information or data in the cloud will not be manipulated or altered
AttitudeATT1I have a positive attitude towards cloud computing services
ATT2I believe that the use of cloud computing services is a good solution
ATT3I believe that access to cloud services is more desirable than other services
SatisfactionSAT1I am generally satisfied with cloud computing services
SAT2The cloud computing services I currently use, meet my expectations
SAT3I would recommend cloud computing services to other users
Intention to useITU1I will likely continue to use cloud computing services
ITU2I intend to make the most use of cloud computing services
ITU3I will continue to use cloud computing services if I have access to them
Table 3. Structure of the respondents.
GendernPercentage
Men17569
Women7731
Age
<1841
18–243313
25–348233
35–449337
45–543012
55–6473
65+31
Education
Basic52
Basic vocational3614
Secondary6526
Higher14658
Professional status
Student3715
Employed full-time15260
Employed part-time5221
Not employed114
Place of residence
The village177
City up to 50 k249
City up to 100 k4819
City up to 250 k10843
City > 250 k5522
Vendor (multiple choice)
Microsoft Azure5916
Amazon Web Services12032
Google Cloud12835
IBM Cloud4111
Oracle Cloud246
Table 4. PLS-SEM assessment results of measurement models.
Latent VariableIndicatorsConvergent ValidityInternal Consistency Reliability
LoadingsIndicator ReliabilityAVEComposite Reliability ρcReliability ρA (rho_A)Cronbach’s Alpha
>0.70>0.50>0.50>0.70>0.700.70–0.95
ATTATT10.8730.7620.7340.8920.8190.818
ATT20.8310.691
ATT30.8650.748
ITUITU10.7950.6320.7210.8850.8120.805
ITU20.8550.731
ITU30.8940.799
PAPA10.8510.7240.7350.8920.8220.819
PA20.8340.696
PA30.8860.785
PSPS10.9210.8480.8190.9310.8970.889
PS20.8860.785
PS30.9070.823
PUPU10.8960.8030.7950.9210.8720.871
PU20.8720.760
PU30.9060.821
SATSAT10.8730.7620.7340.8920.8270.817
SAT20.7940.630
SAT30.8980.806
SSQSSQ10.7530.5670.6730.8910.8380.837
SSQ20.8370.701
SSQ30.8650.748
SSQ40.8220.676
Table 5. Fornell-Larcker criterion.
ATTITUPAPSPUSATSSQ
ATT0.857
ITU0.7980.849
PA0.6950.6780.857
PS0.6390.5280.4790.905
PU0.7840.7740.6750.570.892
SAT0.8320.7820.720.5890.8150.856
SSQ0.6760.5680.6080.6720.6040.6970.82
Table 6. HTMT values.
ATTITUPAPSPUSATSSQ
ATT
ITU0.884
PA0.8470.833
PS0.7410.6080.557
PU0.8990.9000.7980.641
SAT0.8870.8560.8760.6860.863
SSQ0.8160.6880.7350.7760.7090.849
Table 7. Path coefficient of the structural model and significance testing results.
PathPath CoefficientConfidence Interval [2.5; 97.5]%T-Statisticsf2 Effect SizeSignificant (p < 0.05)
ATT → ITU0.3950.271; 0.5196.2070.139Yes
PA → ATT0.2160.11; 0.3313.840.079Yes
PA → PU0.6750.541; 0.76911.8510.837Yes
PS → ATT0.1770.053; 0.2892.9840.056Yes
PS → SSQ0.6720.563; 0.75214.1180.825Yes
PU → ATT0.4420.315; 0.5537.1930.314Yes
PU → ITU0.2880.154; 0.4214.1880.085Yes
SAT → ITU0.2520.098; 0.4023.2430.048Yes
SSQ → ATT0.1580.04; 0.3042.3080.038Yes
SSQ → ITU−0.048−0.146; 0.0660.8860.004No
Publisher’s Note: MDPI stays neutral with regard to jurisdictional claims in published maps and institutional affiliations.

