Attachment to Material Goods and Subjective Well-Being: Evidence from Life Satisfaction in Rural Areas in Vietnam

Abstract
1. Introduction
2. Materials and Methods
2.1. Conceptual Model
2.2. Empirical Strategy
2.3. Data
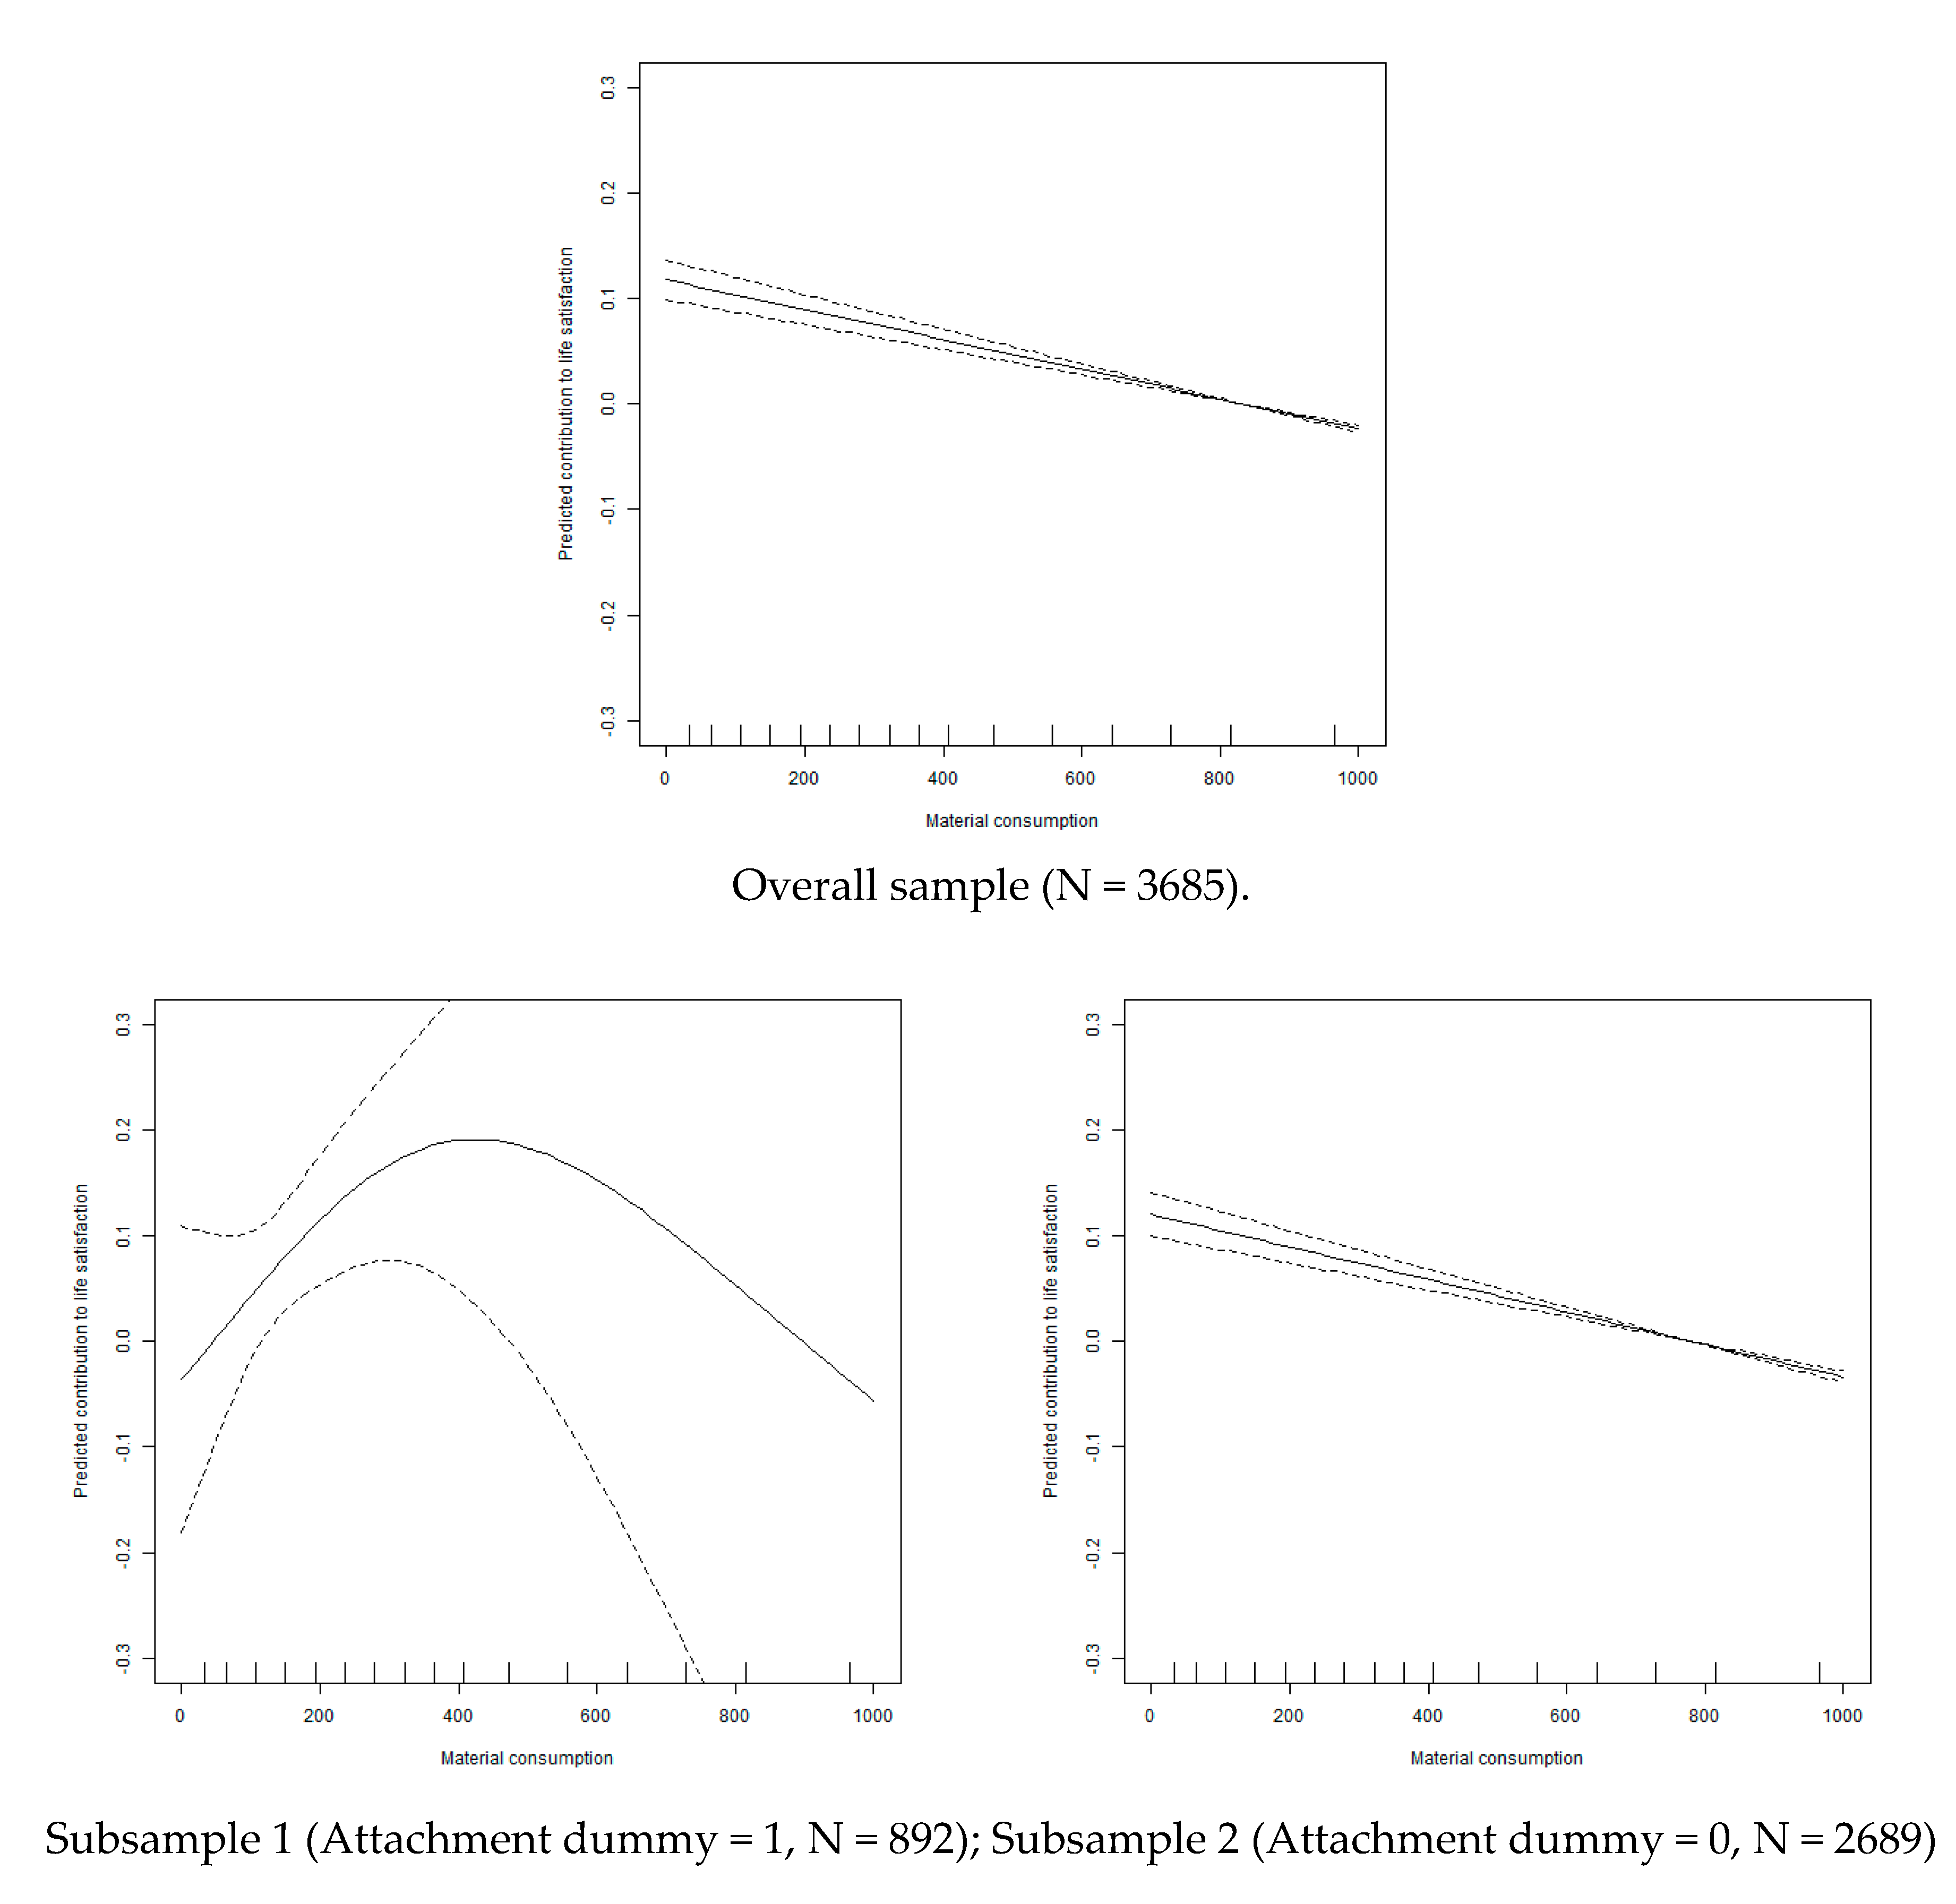
3. Results
4. Discussion
Author Contributions
Funding
Acknowledgments
Conflicts of Interest
Appendix A
References
- Geissdoerfer, M.; Savaget, P.; Bocken, N.M.P.; Hultink, E.J. Circular Economy Sustainability Paradigm. J. Clean. Prod. 2019, 143, 757–768. [Google Scholar] [CrossRef]
- Korhonen, J.; Honkasalo, A.; Seppälä, J. Circular Economy: The Concept and its Limitations. Ecol. Econ. 2018, 143, 37–46. [Google Scholar] [CrossRef]
- Kirchherr, J.; Reike, D.; Hekkert, M. Conceptualizing the circular economy: An analysis of 114 definitions. Resour. Conserv. Recycl. 2017, 127, 221–232. [Google Scholar] [CrossRef]
- Bowlby, J. A Secure Base: Clinical Applications of Attachment Theory; Routledge: Abingdon, UK, 1988. [Google Scholar]
- Giuliani, M.V. Theory of Attachment and Place Attachment. In Psychological Theories for Environmental Issues; Bonnes, M., Lee, T., Bonaiuto, M., Eds.; Ashgate: Farnham, UK, 2003; pp. 137–170. [Google Scholar]
- Hidalgo, M.C.; Hernández, B. Place attachment: Conceptual and empirical questions. J. Environ. Psychol. 2001, 21, 273–281. [Google Scholar] [CrossRef]
- Gerson, K.; Stueve, A.; Fischer, C.S. Attachment to Place. In Networks and Places: Social Relations in the Urban Setting; Fischer, C.S., Jackson, R.M., Stueve, C.A., Gerson, K., Jones, L.M., Baldassare, M., Eds.; The Free Press: Wong Chuk Hang, Hong Kong, 1977; pp. 139–161. [Google Scholar]
- Kleine, S.S.; Baker, S.M. An integrative review of material possession attachment. Acad. Mark. Sci. Rev. 2004, 1, 1–39. [Google Scholar]
- Kahneman, D.; Knetsch, J.L.; Thaler, R.H. Experimental tests of the endowment effect and the Coase theorem. J. Political Econ. 1990, 98, 1325–1348. [Google Scholar] [CrossRef]
- Thaler, R. Toward a positive theory of consumer choice. J. Econ. Behav. Organ. 1980, 1, 39–60. [Google Scholar] [CrossRef]
- Kahneman, D.; Knetsch, J.L.; Thaler, R.H. The Endowment Effect, Loss Aversion, and Status Quo Bias. J. Econ. Perspect. 1991, 5, 193–206. [Google Scholar] [CrossRef]
- Knetsch, J.L. The Endowment Effect and Evidence of Nonreversible Indifference Curves. Am. Econ. Rev. 1989, 79, 1277–1284. [Google Scholar]
- Knetsch, J.L.; Sinden, J.A. The Persistence of Evaluation Disparities. Q. J. Econ. 1987, 102, 691–696. [Google Scholar] [CrossRef]
- Mugge, R.; Schoormans, J.P.L.; Schifferstein, H.N.J. Product Attachment: Design Strategies to Stimulate the Emotional Bonding to Products. In Product Experience; Schifferstein, H.N.J., Hekke, P., Eds.; Elsevier: Amsterdam, The Netherlands, 2008; pp. 425–440. [Google Scholar]
- Schifferstein, H.N.J.; Zwartkruis-Pelgrim, E.P.H. Consumer-Product Attachment: Measurement and Design Implications. Int. J. Des. 2008, 2, 1–13. [Google Scholar]
- Dommer, S.L.; Winterich, K.P. Disposing of the self: The role of attachment in the disposition process. Curr. Opin. Psychol. 2020, 39, 43–47. [Google Scholar] [CrossRef] [PubMed]
- Ting, H.; Thaichon, P.; Chuah, F.; Tan, S.R. Consumer Behavior and Disposition Decisions: The Why and How of Smartphone Disposition. J. Retail. Consum. Serv. 2019, 51, 212–220. [Google Scholar] [CrossRef]
- Andreoni, J. Impure Altruism and Donations to Public Goods: A Theory of Warm-Glow Giving. Econ. J. 1990, 100, 464–477. [Google Scholar] [CrossRef]
- Cherepanov, V.; Feddersen, T.; Sandroni, A. Revealed Preferences and Aspirations in Warm Glow Theory. Econ. Theory 2013, 54, 501–535. [Google Scholar] [CrossRef]
- Menges, R.; Schroeder, C.; Traub, S. Altruism, Warm Glow and the Willingness-to-Donate for Green Electricity: An Artefactual Field Experiment. Environ. Resour. Econ. 2005, 31, 431–458. [Google Scholar] [CrossRef]
- Taufik, D.; Bolderdijk, J.W.; Steg, L. Acting Green Elicits a Literal Warm Glow. Nat. Clim. Chang. 2015, 5, 37–40. [Google Scholar] [CrossRef]
- Morelli, S.A.; Lieberman, M.D.; Zaki, J. The Emerging Study of Positive Empathy. Soc. Personal. Psychol. Compass 2015, 9, 57–68. [Google Scholar] [CrossRef]
- Maathai, W. Unbowed: A memoir; Anchor: New York, NY, USA, 2007. [Google Scholar]
- Sirola, N.; Sutinen, U.M.; Närvänen, E.; Mesiranta, N.; Mattila, M. Mottainai!-A practice theoretical analysis of Japanese consumers’ food waste reduction. Sustainability 2019, 11, 6645. [Google Scholar] [CrossRef]
- Clark, A.E.; Frijters, P.; Shields, M.A. Relative income, happiness, and utility: An explanation for the Easterlin paradox and other puzzles. J. Econ. Lit. 2008, 46, 95–144. [Google Scholar] [CrossRef]
- Diener, E. Subjective Well-Being. Psychol. Bull. 1984, 95, 542–575. [Google Scholar] [CrossRef] [PubMed]
- Diener, E.; Sandvik, E.; Seidlitz, L.; Diener, M. The relationship between income and subjective well-being: Relative or absolute? Soc. Indic. Res. 1993, 28, 195–223. [Google Scholar] [CrossRef]
- Easterlin, R.A. Does Economic Growth Improve the Human Lot? Some Empirical Evidence. In Nations and Households in Economic Growth: Essays in Honor of Moses Abramovitz; David, P.A., Reder, M.W., Eds.; Academic Press: New York, NY, USA, 1974; pp. 89–215. [Google Scholar]
- Diener, E.; Diener, M.; Diener, C. Factors Predicting the Subjective Well-Being of Nations. J. Personal. Soc. Psychol. 1995, 69, 851–864. [Google Scholar] [CrossRef]
- Myers, D.G.; Diener, E. The Pursuit of Happiness. Sci. Am. 1996, 274, 54–56. [Google Scholar] [CrossRef] [PubMed]
- Argyle, M. Causes and Correlates of Happiness. In Well-Being: The Foundations of Hedonic Psychology; Kahneman, D., Diener, E., Schwarz, N., Eds.; Russell Sage Foundation: New York, NY, USA, 1999; pp. 353–373. [Google Scholar]
- Easterlin, R.A. Will raising the incomes of all increase the happiness of all? J. Econ. Vehavior Organ. 1995, 27, 35–47. [Google Scholar] [CrossRef]
- Easterlin, R.A. Feeding the illusion of growth and happiness: A reply to Hagerty and Veenhoven. Soc. Indic. Res. 2005, 74, 429–443. [Google Scholar] [CrossRef]
- Cheng, Z.; Wang, H.; Smyth, R. Happiness and job satisfaction in urban China: A comparative study of two generations of migrants and urban locals. J. Econ. Vehavior Organ. 2014, 51, 2160–2184. [Google Scholar] [CrossRef]
- Stevenson, B.; Wolfers, J. Subjective well-being and income: Is there any evidence of satiation? Am. Econ. Rev. 2013, 103, 598–604. [Google Scholar] [CrossRef]
- Stevenson, B.; Wolfers, J. Economic Growth and Subjective Well-Being: Reassessing the Easterlin Paradox. NBER Work. Paper Ser. 2008, 14282, 1–28. [Google Scholar]
- Ferrer-i-Carbonell, A. Income and well-being: An empirical analysis of the comparison income effect. J. Public Econ. 2005, 89, 997–1019. [Google Scholar] [CrossRef]
- Dolan, P.; Peasgood, T.; White, M. Do we really know what makes us happy? A review of the economic literature on the factors associated with subjective well-being. J. Econ. Psychol. 2008, 29, 94–122. [Google Scholar] [CrossRef]
- Rickardsson, J.; Mellander, C. Absolute vs Relative Income and Life Satisfaction. CESIS Electron. Work. Pap. Ser. 2017, 451, 1–29. [Google Scholar]
- Foye, C.; Clapham, D.; Gabrieli, T. Home-ownership as a social norm and positional good: Subjective wellbeing evidence from panel data. Urban Stud. 2018, 55, 1290–1312. [Google Scholar] [CrossRef]
- Donati, P. Relational Sociology: A New Paradigm for the Social Sciences; Routledge: London, UK, 2010. [Google Scholar]
- Gokdemir, O. Consumption, savings and life satisfaction: The Turkish case. Int. Rev. Econ. 2015, 62, 183–196. [Google Scholar] [CrossRef]
- DeLeire, T.; Kalil, A. Does consumption buy happiness? Evidence from the United States. Int. Rev. Econ. 2010, 57, 163–176. [Google Scholar] [CrossRef]
- Zhang, J.; Xiong, Y. Effects of multifaceted consumption on happiness in life: A case study in Japan based on an integrated approach. Int. Rev. Econ. 2015, 62, 143–162. [Google Scholar] [CrossRef]
- Dumludag, D. Consumption and life satisfaction at different levels of economic development. Int. Rev. Econ. 2015, 62, 163–182. [Google Scholar] [CrossRef]
- Pandelaere, M. Materialism and well-being: The role of consumption. Curr. Opin. Psychol. 2016, 10, 33–38. [Google Scholar] [CrossRef]
- Levitt, S.D.; List, J.A. What do laboratory experiments measuring social preferences reveal about the real world? J. Econ. Perspect. 2007, 21, 153–174. [Google Scholar] [CrossRef]
- Tsurumi, T.; Yamaguchi, R.; Kagohashi, K.; Managi, S. Are cognitive, affective, and eudaimonic dimensions of subjective well-being differently related to consumption? Evidence from Japan. J. Happiness Stud. 2020. [Google Scholar] [CrossRef]
- Hastie, T.J.; Tibshirani, R.J. Generalized Additive Models; CRC Press: Boca Raton, FL, USA, 1990; Volume 43. [Google Scholar]
- Tsurumi, T.; Yamaguchi, R.; Kagohashi, K.; Managi, S. The role of social capital in improving subjective well-being through consumption: Evidence from rural and urban Vietnam. Under review.
- Banerjee, A.V.; Duflo, E. The economic lives of the poor. J. Econ. Perspect. 2007, 21, 141–168. [Google Scholar] [CrossRef]
- Roychowdhury, P. Visible inequality, status competition, and conspicuous consumption: Evidence from rural India. Oxf. Econ. Pap. 2016, 69, 36–54. [Google Scholar] [CrossRef]
- Bloch, F.; Rao, V.; Desai, S. Wedding celebrations as conspicuous consumption signaling social status in rural India. J. Hum. Resour. 2004, 39, 675–695. [Google Scholar] [CrossRef]
- Linssen, R.; Van Kempen, L.; Kraaykamp, G. Subjective well-being in rural India: The curse of conspicuous consumption. Soc. Indic. Res. 2011, 101, 57–72. [Google Scholar] [CrossRef]
- Bjørnskov, C. The happy few: Cross-country evidence on social capital and life satisfaction. Kyklos 2003, 56, 3–16. [Google Scholar]
- Dopierała, R. Minimalism—A New Mode of Consumption? Przegląd Socjol. 2017, 66, 67–83. [Google Scholar]
- Kondō, M. The Life-Changing Magic of Tidying up: The Japanese Art of Decluttering and Organizing; Ten Speed Press: Berkeley, CA, USA, 2014. [Google Scholar]
- Winterich, K.P.; Reczek, R.W.; Irwin, J.R. Keeping the memory but not the possession: Memory preservation mitigates identity loss from product disposition. J. Mark. 2017, 81, 104–120. [Google Scholar] [CrossRef]
- Donnelly, G.E.; Lamberton, C.; Reczek, R.W.; Norton, M.I. Social recycling transforms unwanted goods into happiness. J. Assoc. Consum. Res. 2017, 2, 48–63. [Google Scholar] [CrossRef]
- Albinsson, P.A.; Perera, B.Y. Alternative Marketplaces in the 21st Century: Building Community through Sharing Events. J. Consum. Behav. 2012, 11, 303–315. [Google Scholar] [CrossRef]
- Belk, R. Sharing. J. Consum. Res. 2010, 36, 715–734. [Google Scholar] [CrossRef]
- Botsman, R.; Rogers, R. Beyond Zipcar: Collaborative Consumption. Harv. Bus. Rev. 2010, 88, 30. [Google Scholar]
- Felson, M.; Spaeth, J.L. Community Structure and Collaborative Consumption: A Routine Activity Approach. Am. Behav. Sci. 1978, 21, 614–624. [Google Scholar] [CrossRef]
- Möhlmann, M. Collaborative consumption: Determinants of satisfaction and the likelihood of using a sharing economy option again. J. Consum. Behav. 2015, 14, 193–207. [Google Scholar] [CrossRef]
- Steffen, W.; Richardson, K.; Rockström, J.; Cornell, S.E.; Fetzer, I.; Bennett, E.M.; Biggs, R.; Carpenter, S.R.; De Vries, W.; De Wit, C.A.; et al. Planetary boundaries: Guiding human development on a changing planet. Science 2015, 347. [Google Scholar] [CrossRef] [PubMed]


| Thieu Hoa | Darsal | |
|---|---|---|
| Population | 6508 | 4485 (over 18 years old) |
| Per capita income (US$) | 1075 | 1753 |
| Area (km2) | 7.47 | 84.76 |
| Survey Question | Notes | |
|---|---|---|
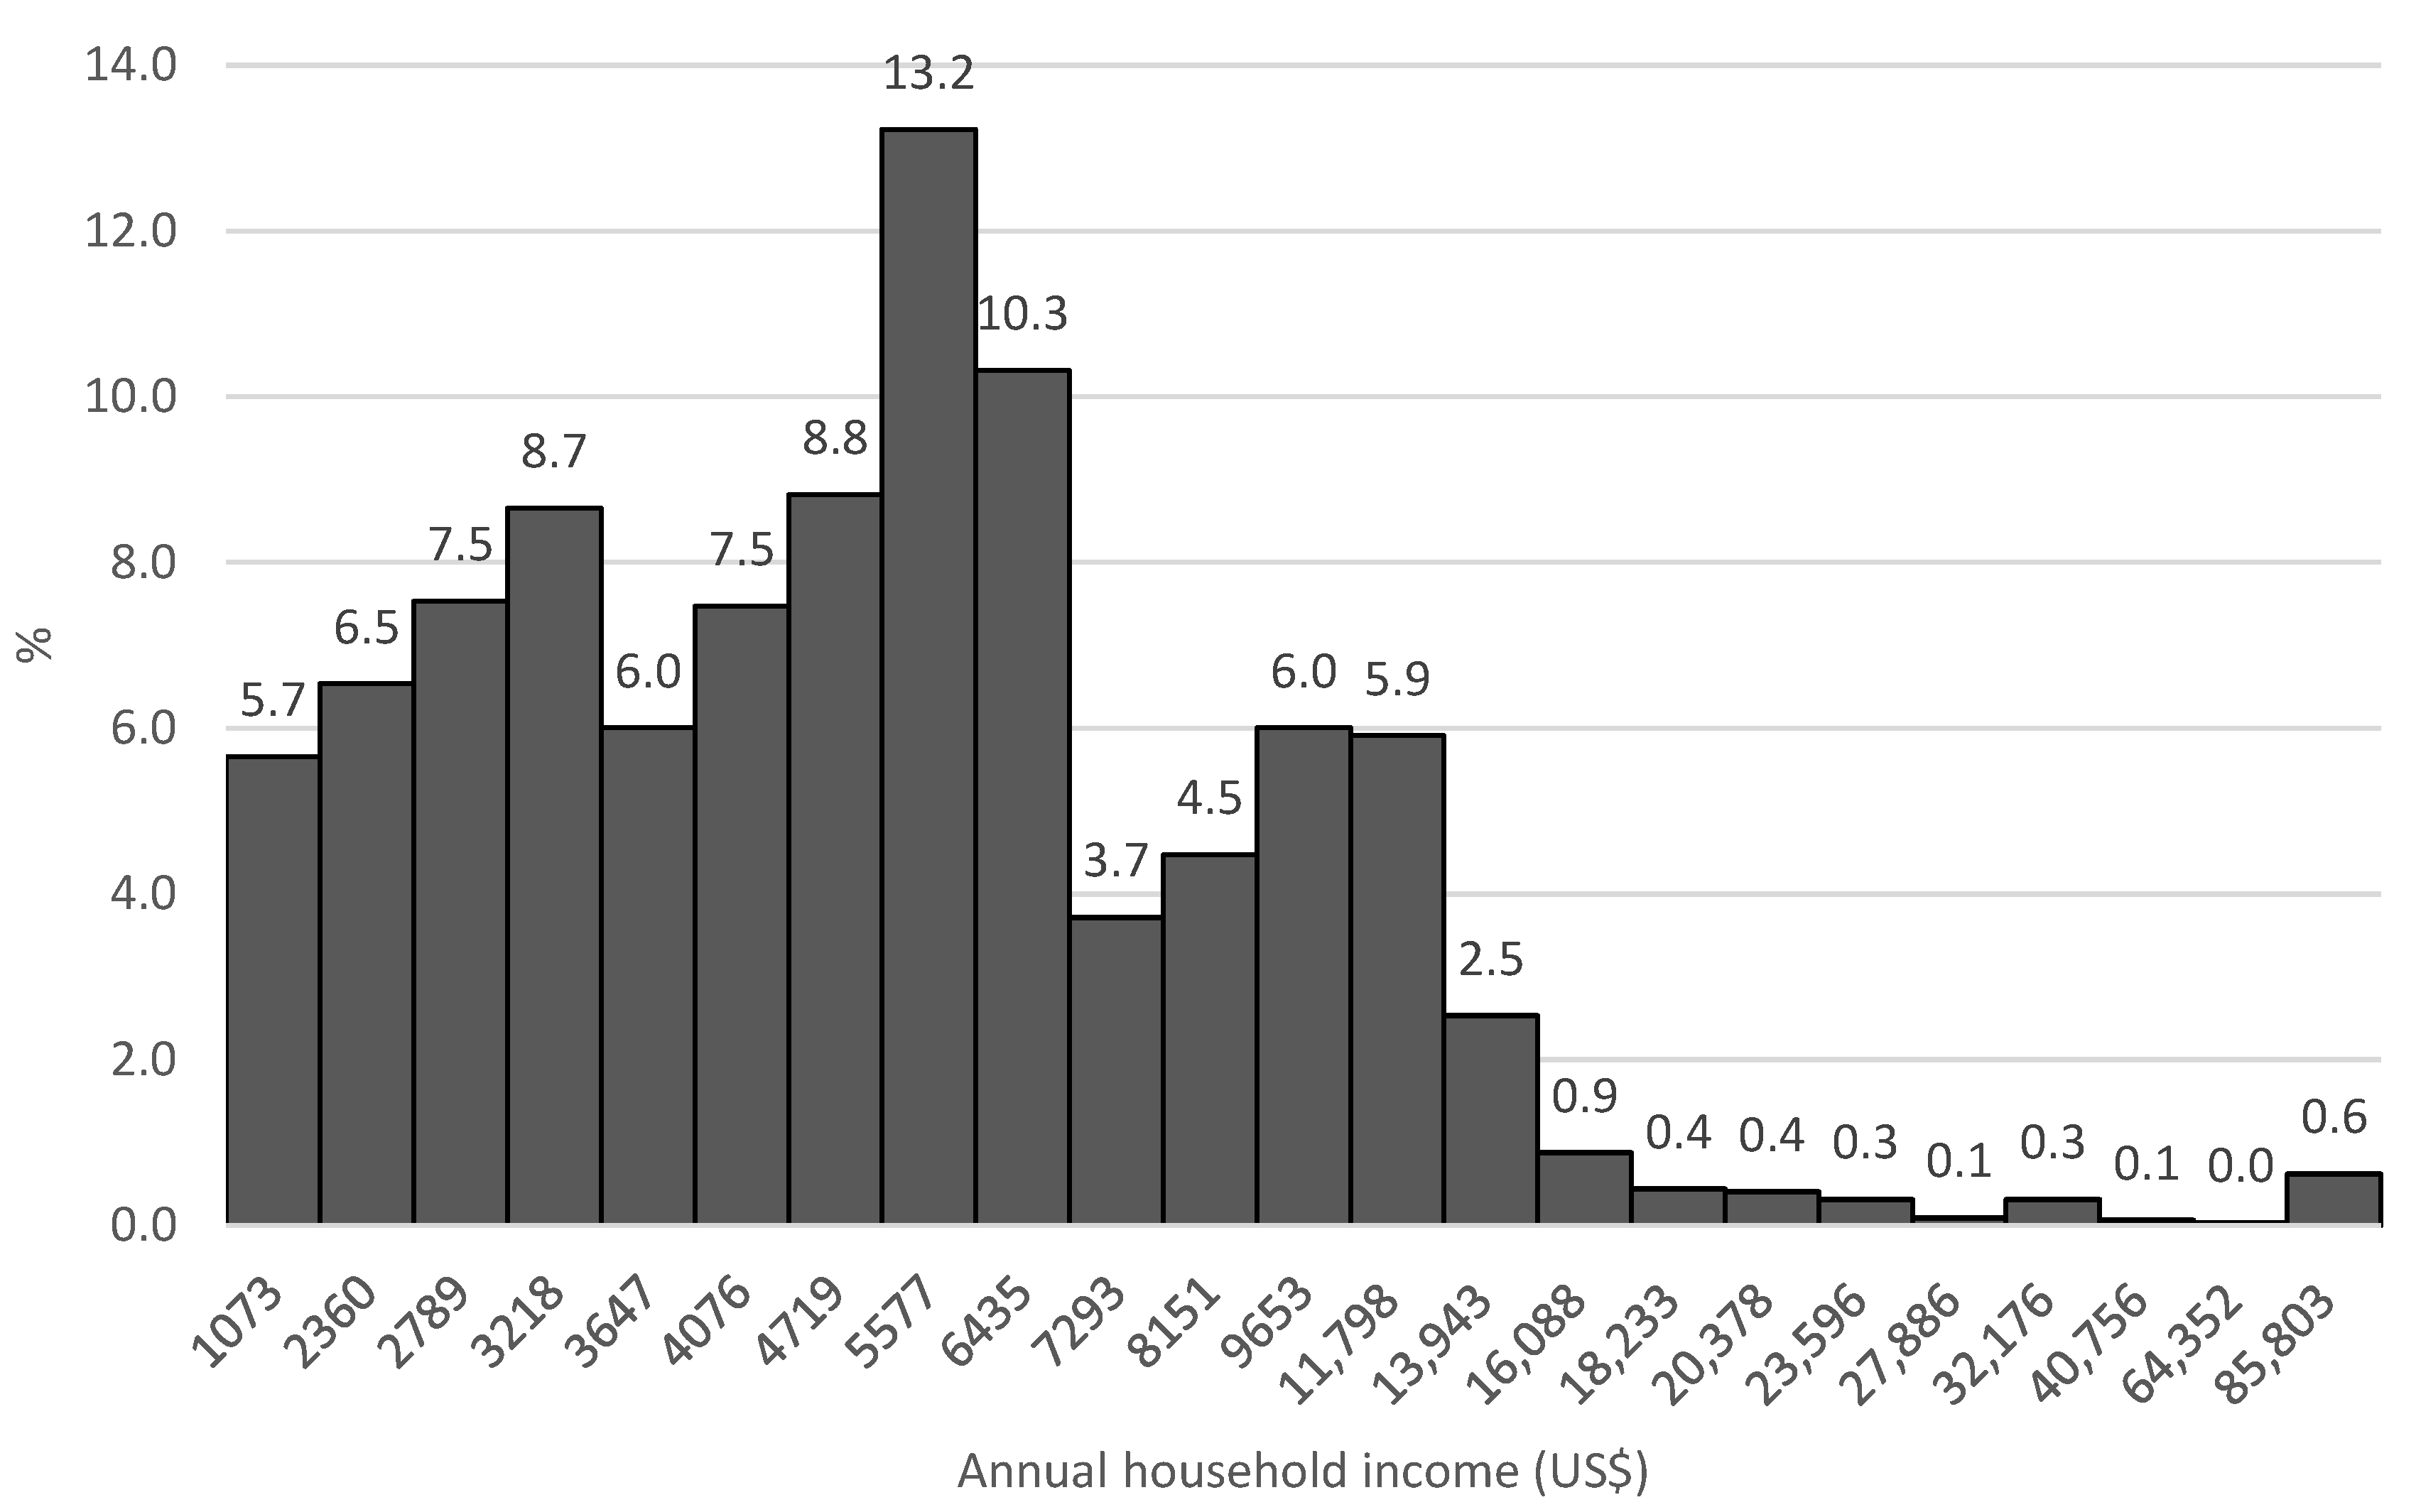
| Household Income: Unit (US$) | Please tell us your yearly household income. | |
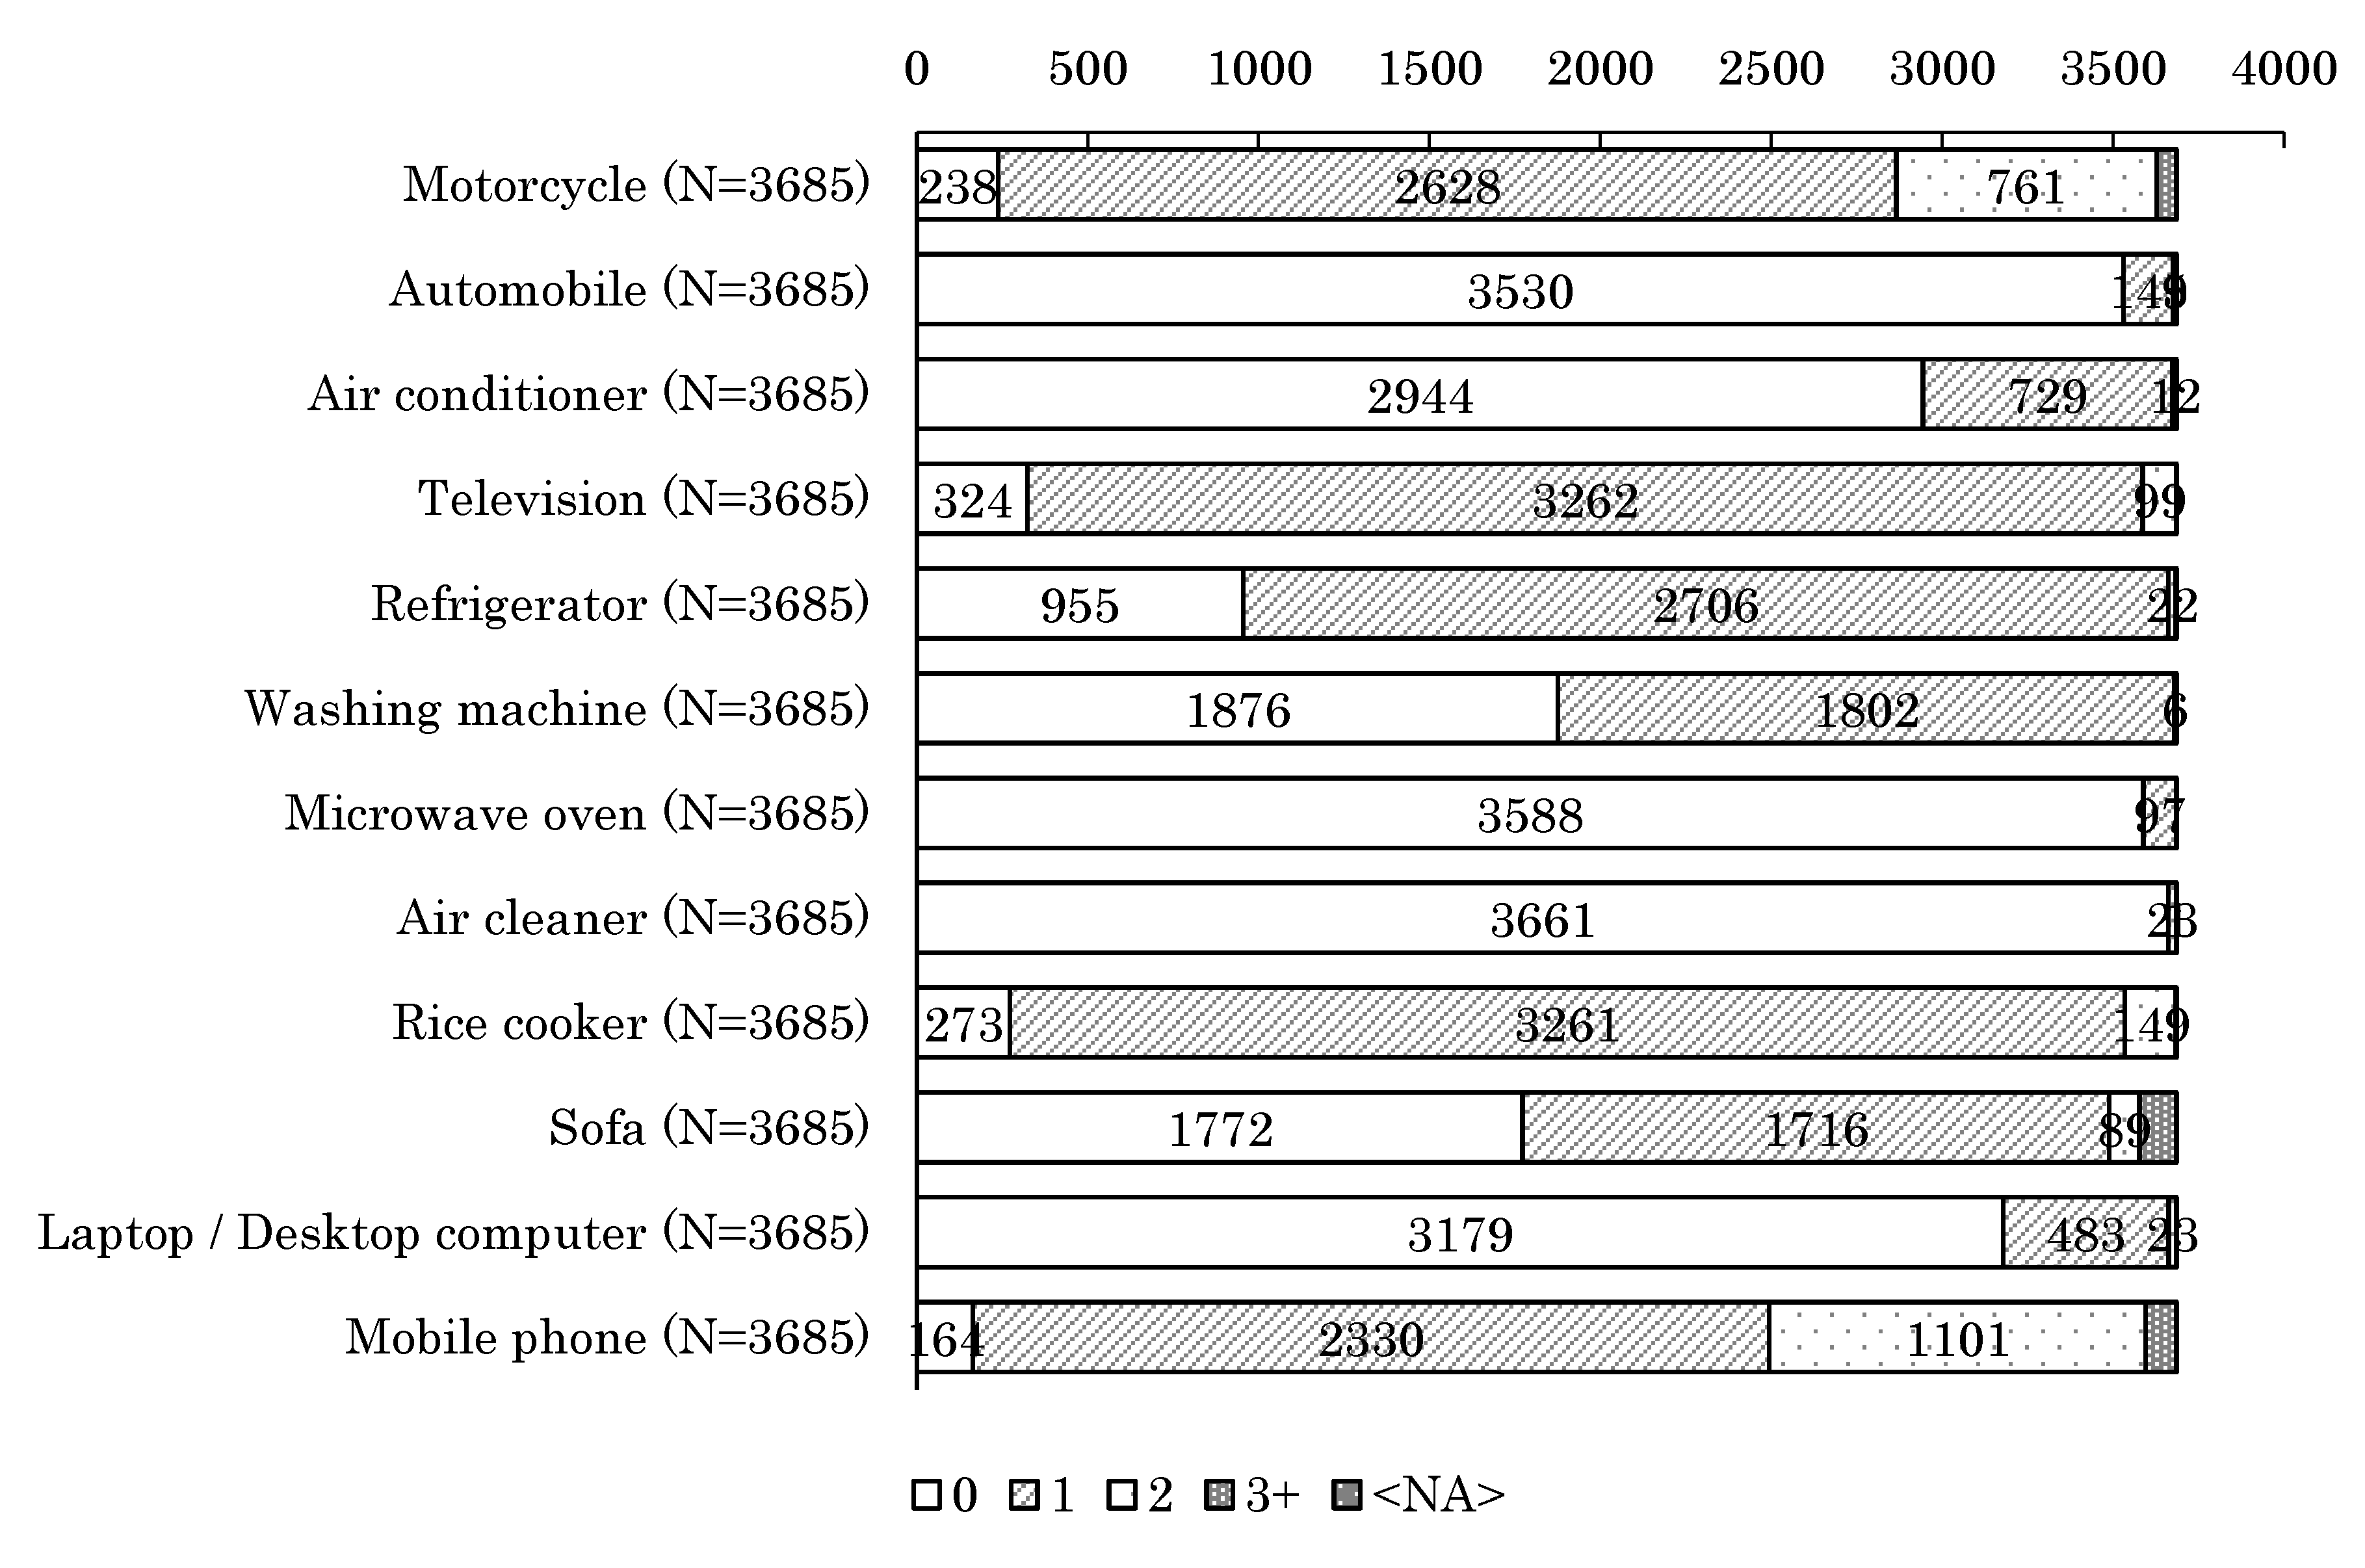
| Household material possessions | How many of the following goods does your household have?
| |
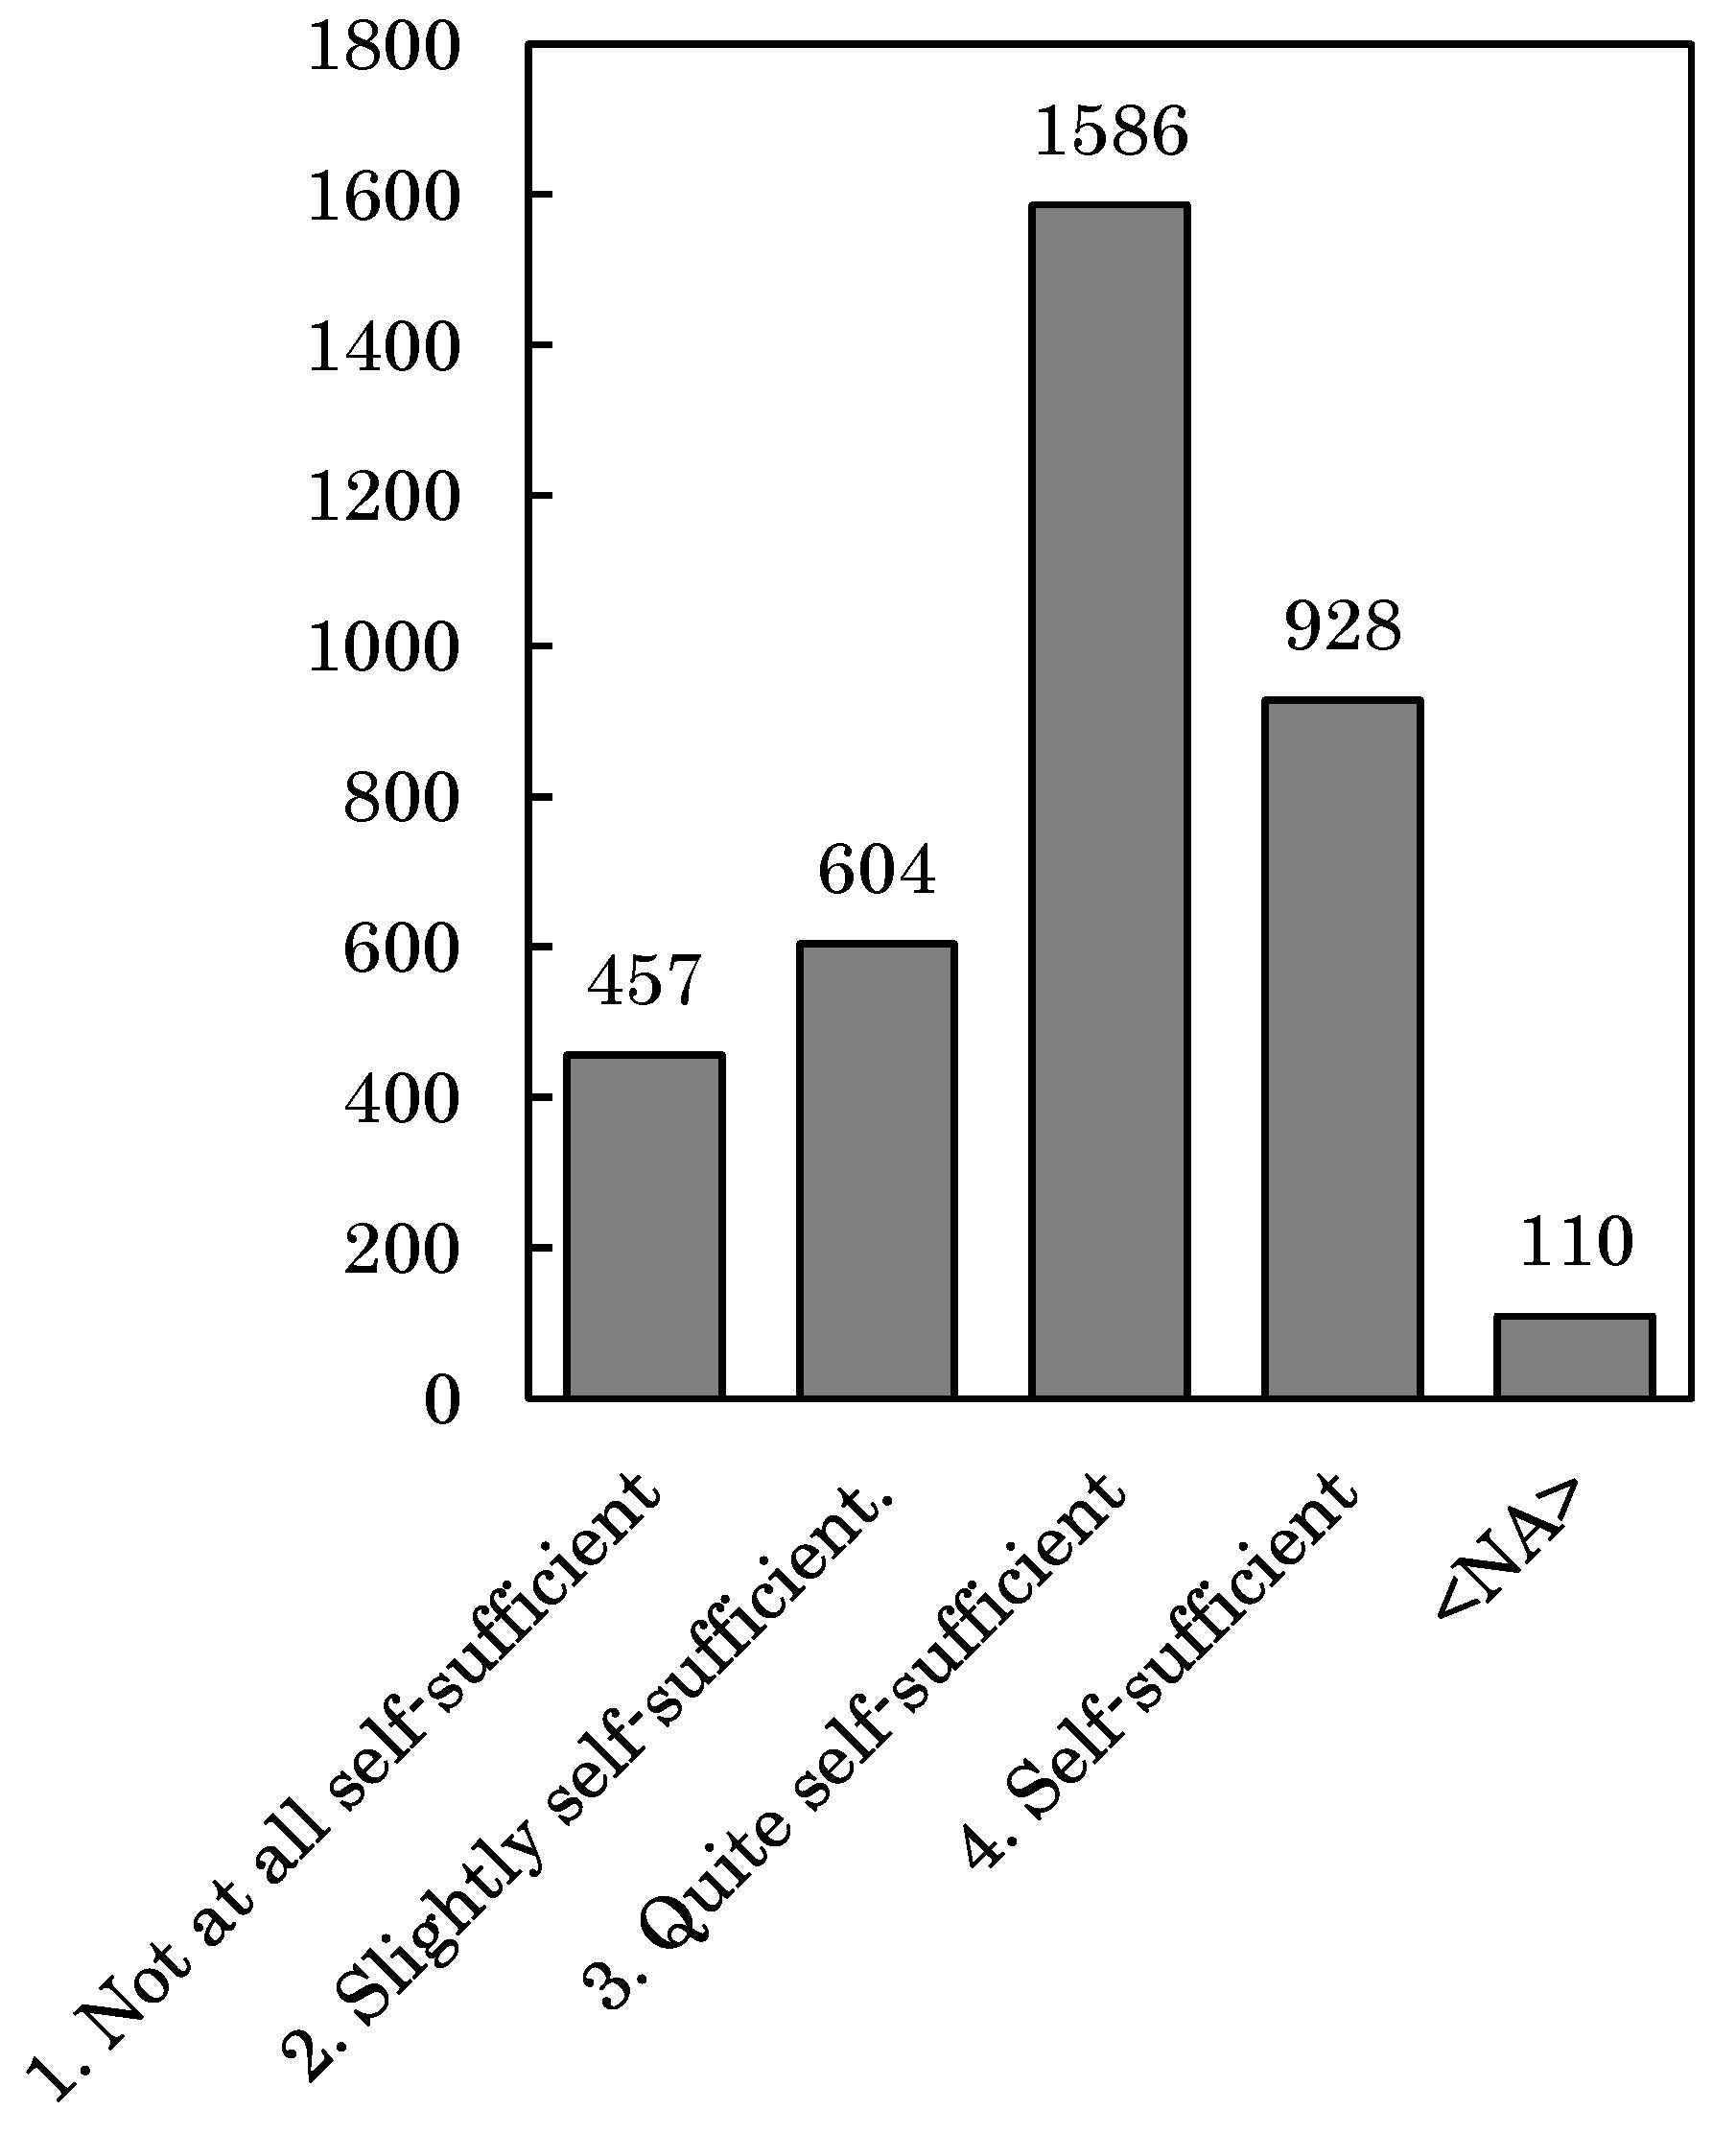
| Self-sufficiency | Please tell us your household’s degree of food self-sufficiency. |
|
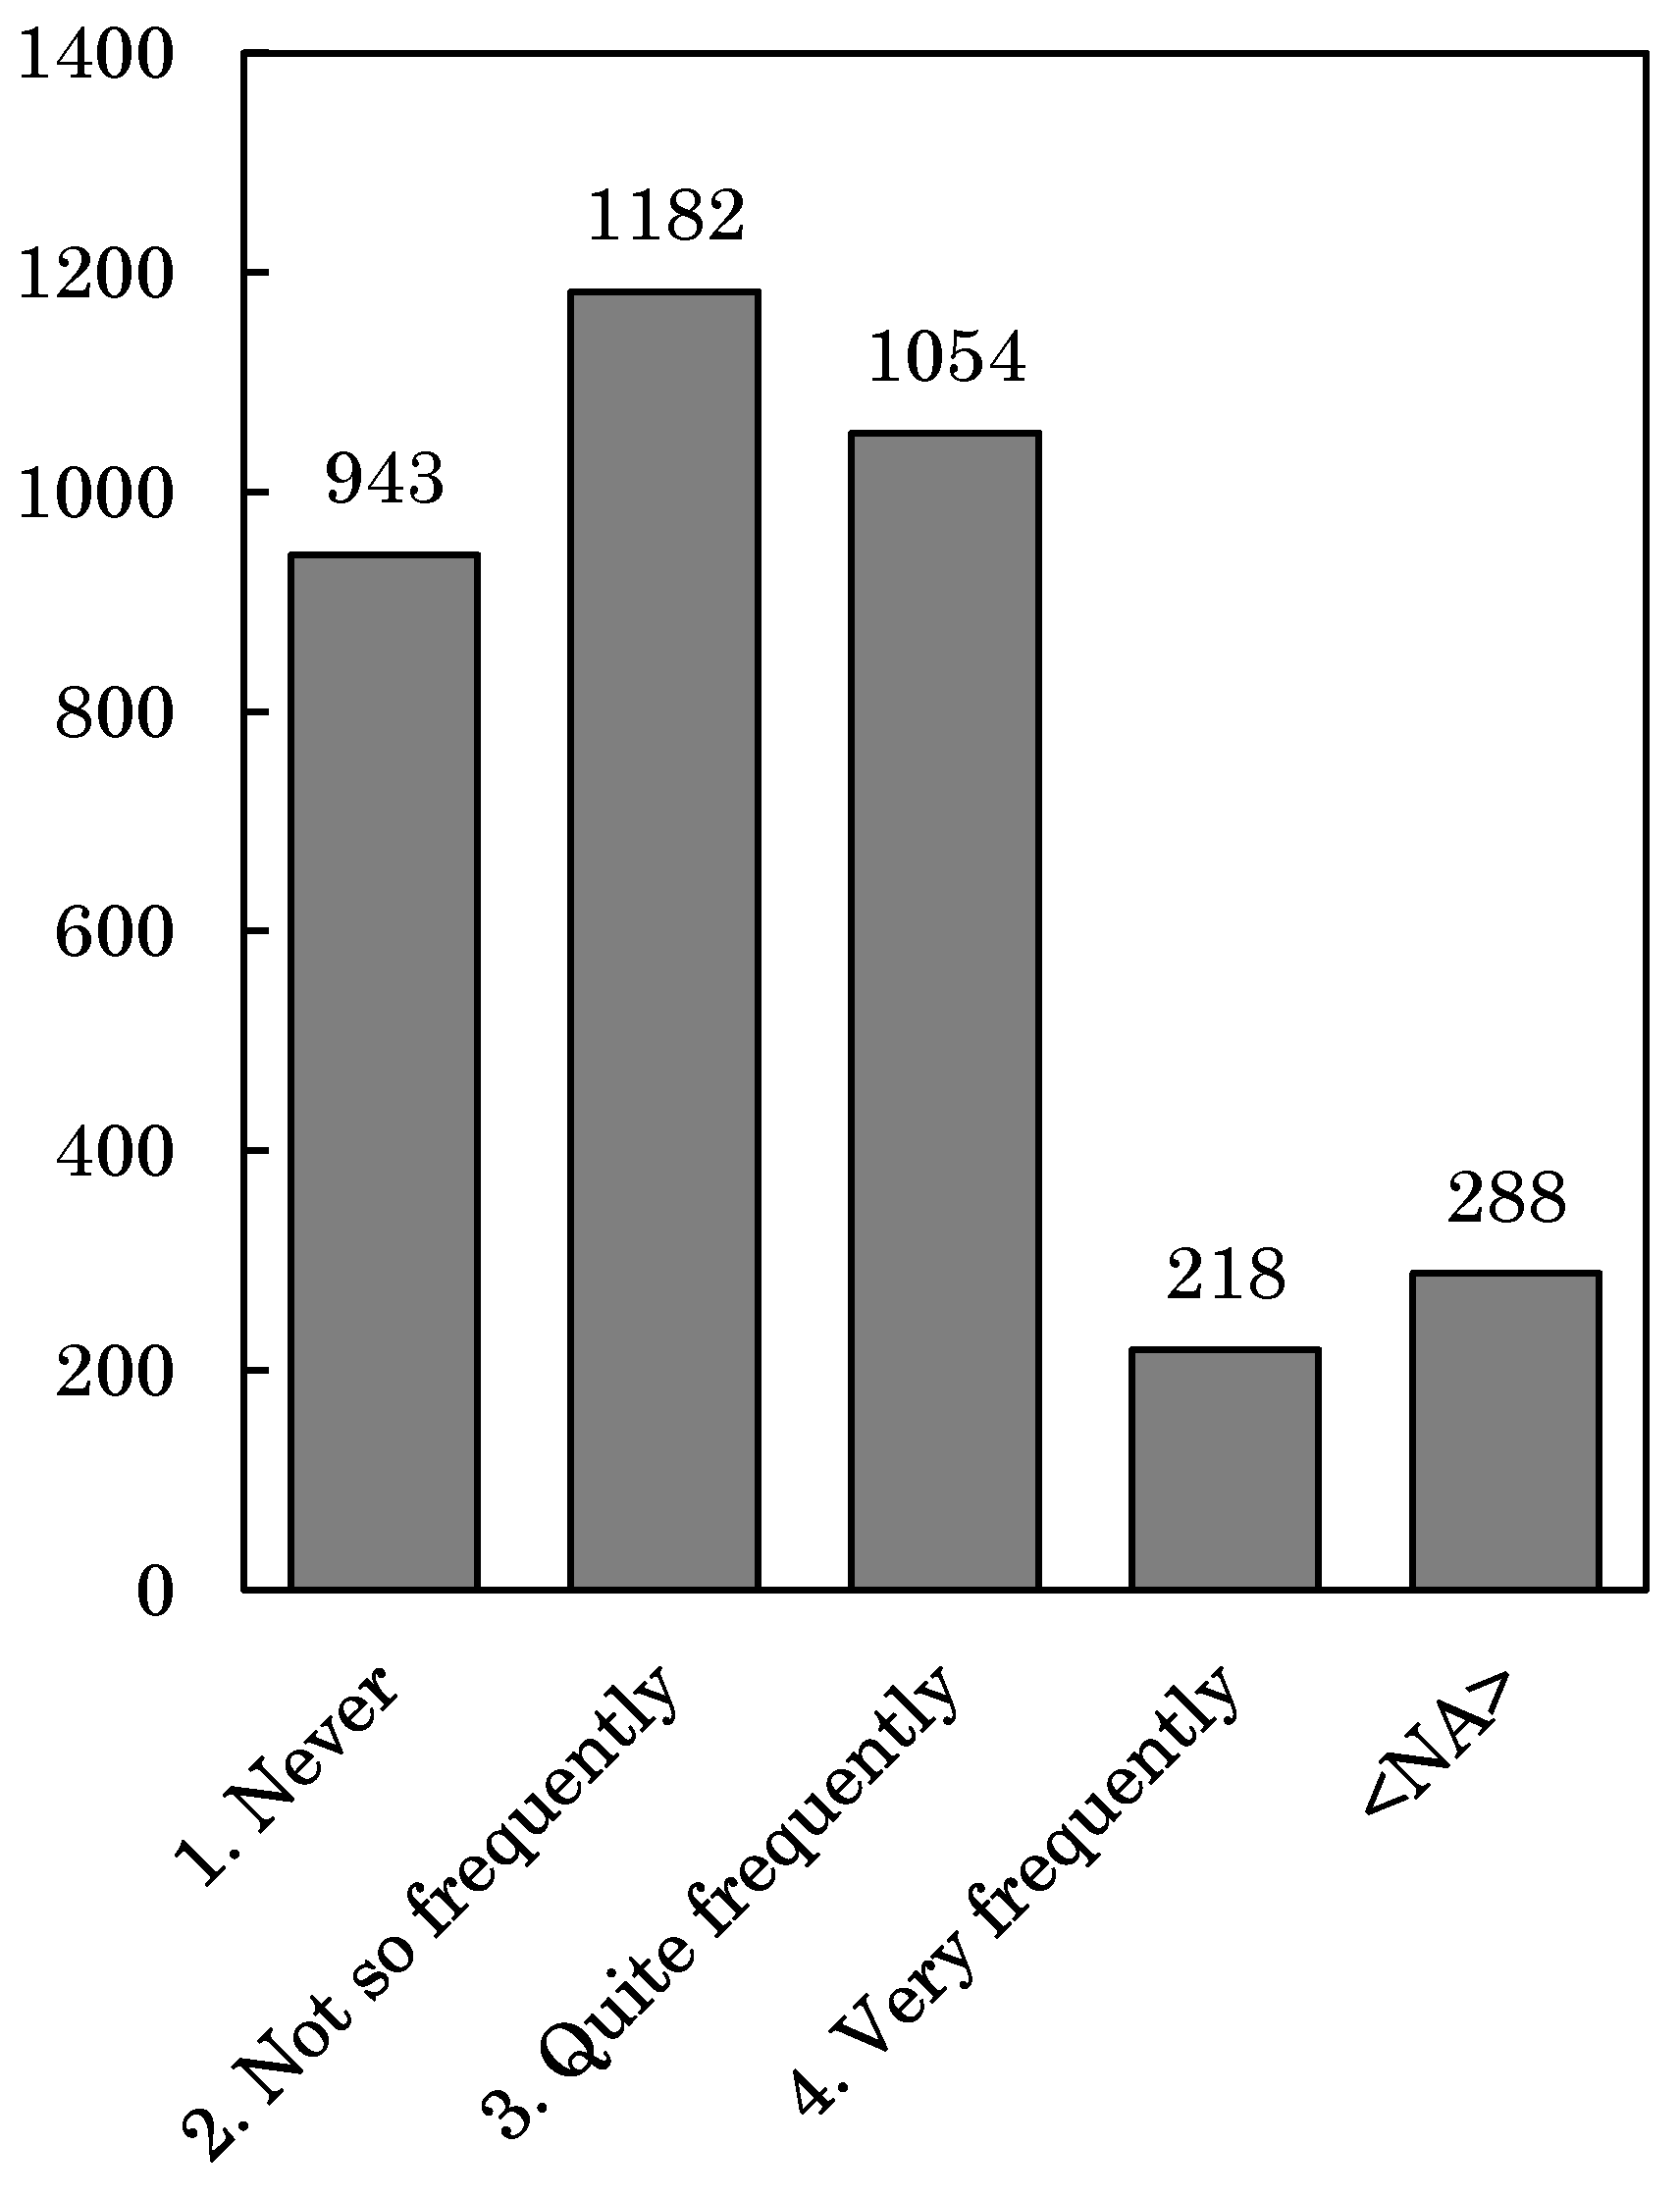
| Frequency of barter with other neighborhood residents | How often do you barter with other neighborhood residents? |
|
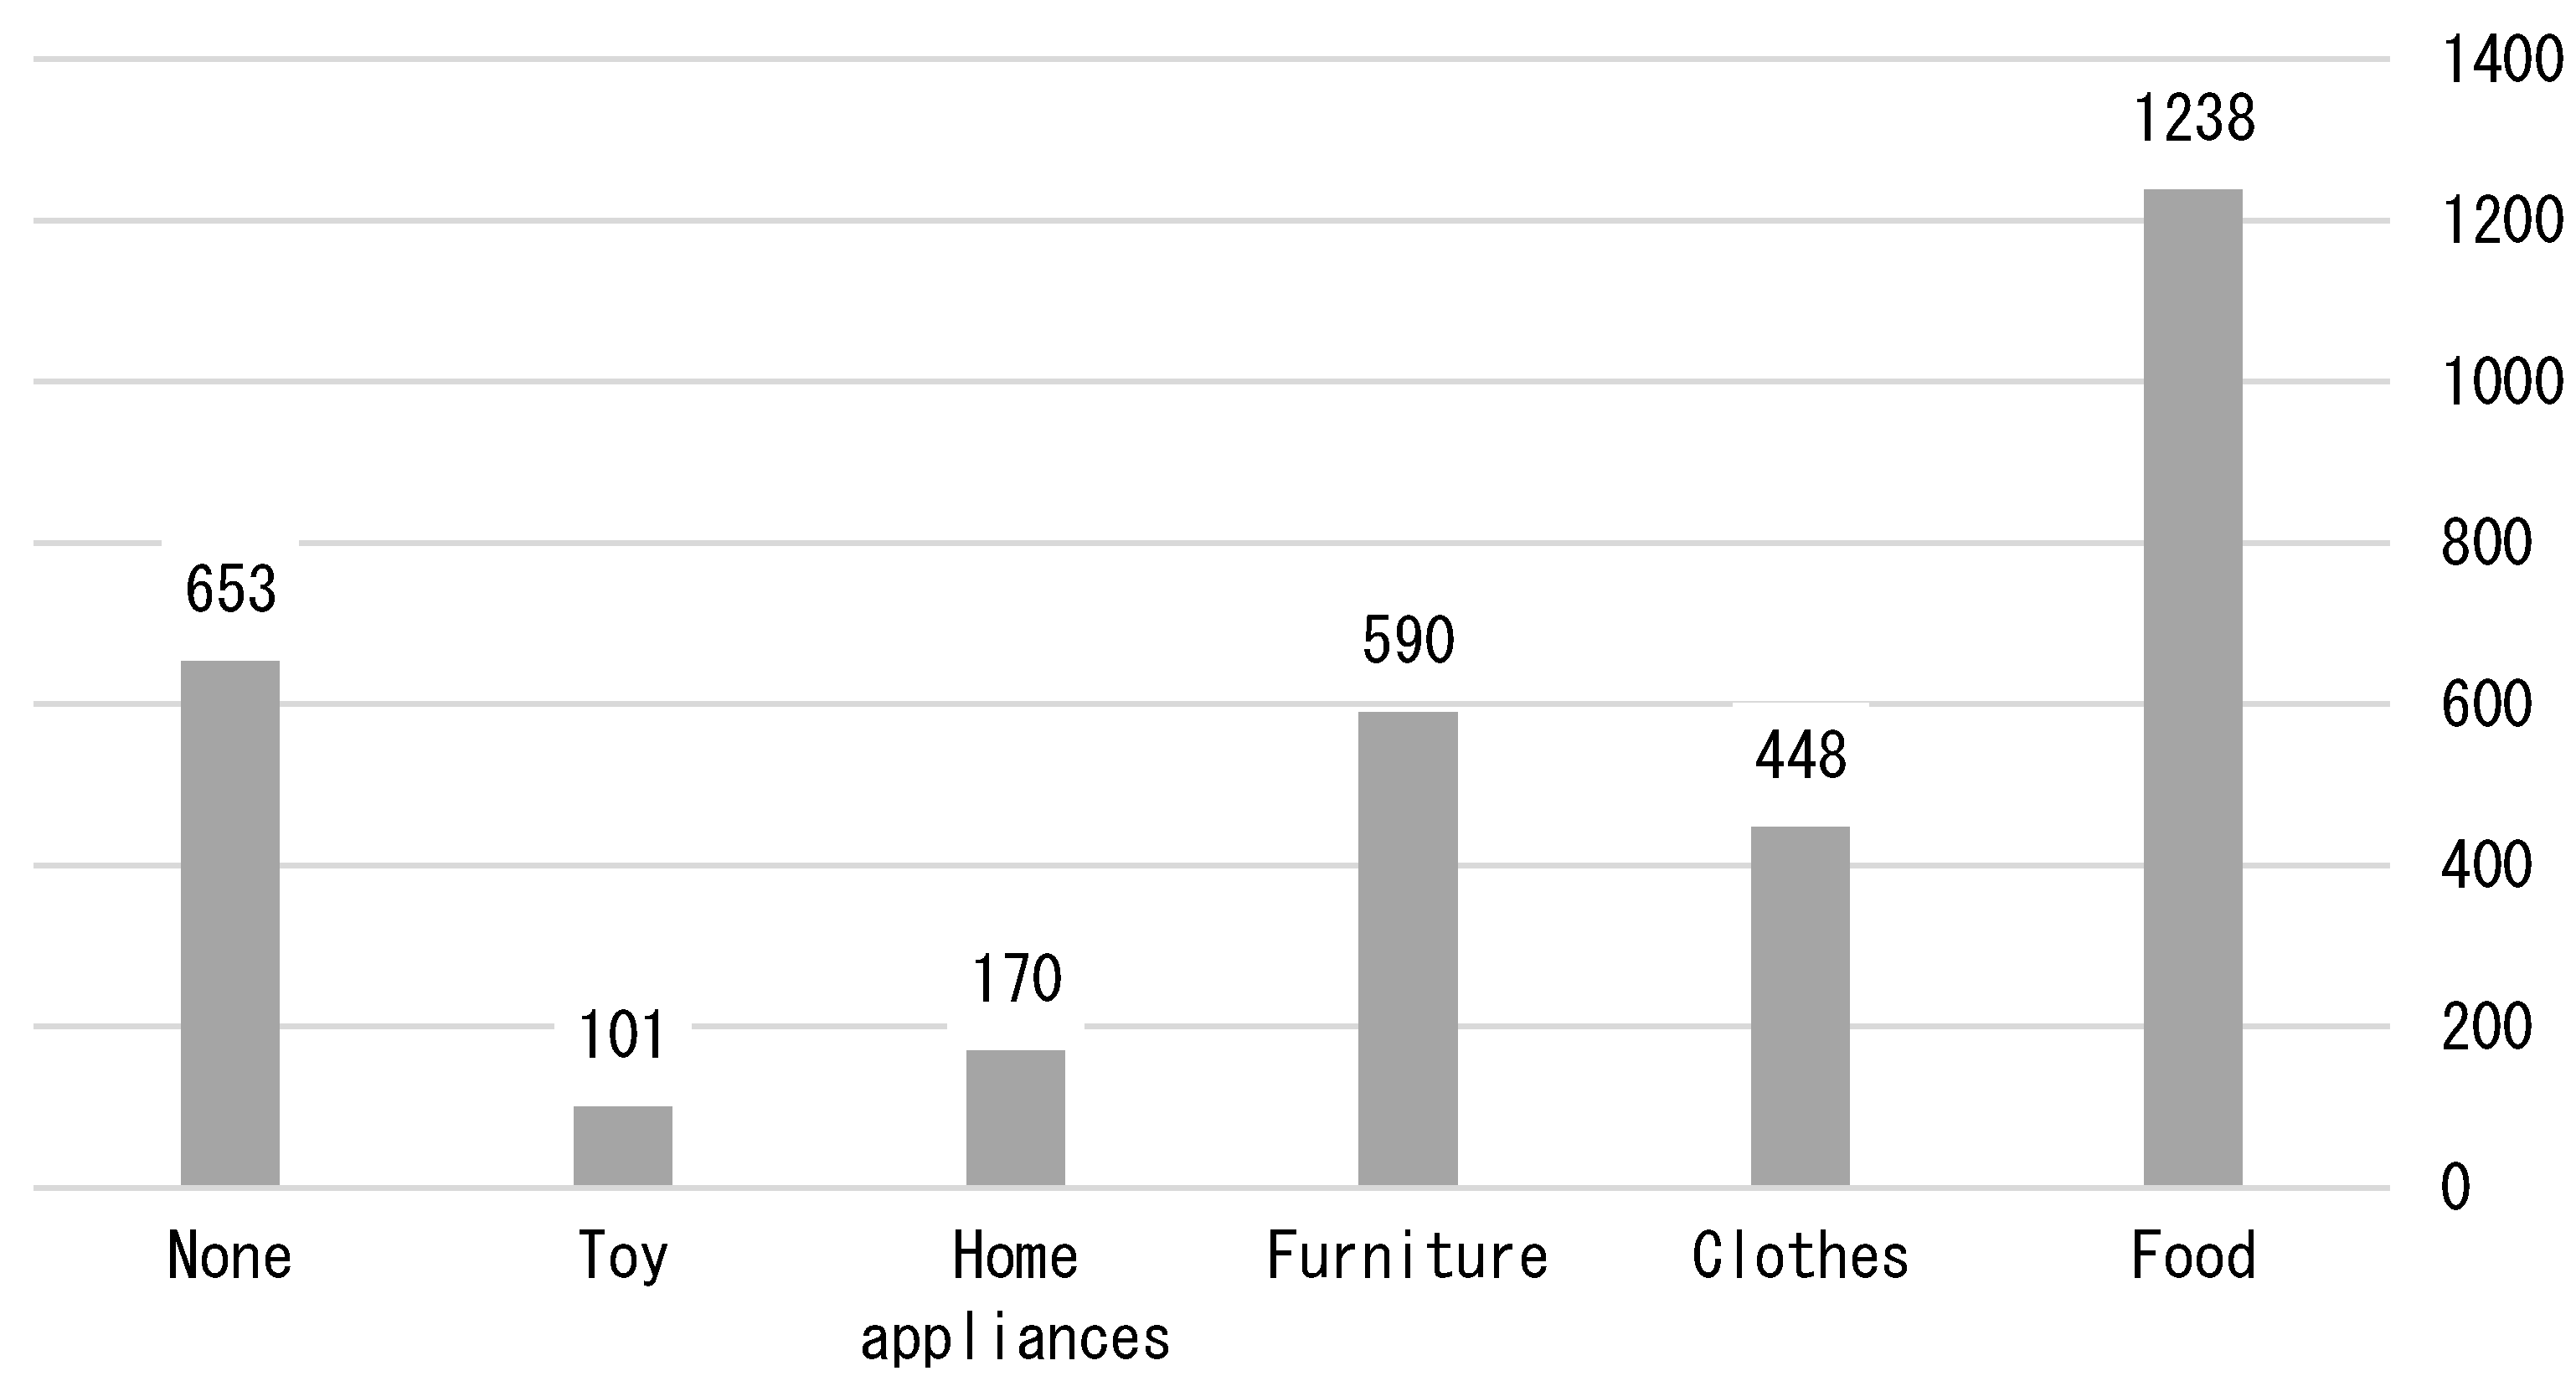
| Bartering goods | What kind of material goods do you barter with other neighborhood residents? (Multiple choice) |
|
| Survey Question | Notes | |
|---|---|---|
| Life satisfaction | Overall, how satisfied are you with your life? | “5: completely satisfied”; “1: not at all satisfied”; five-point scale (standardized 0 to 1). |
| Material consumption (US$) | What is the average monthly amount spent in your household to purchase “goods” (electrical appliances, furniture, clothes, shoes, publications, and other sundries, excluding expenditure related to housing, cars, and motorbikes)? | |
| Monthly household consumption expenditure: unit (US$) | Overall, approximately how much does your household spend monthly on consumption? Please see the consumption categories under “Reference” and include all these expenses before answering this question.
Apparel (clothes and shoes) Food expenses (foodstuff and dining costs) Housing expenses (loans, rent, land fees, equipment repairs/maintenance expenses, construction, other housing-related services, and utility fees) Durable consumer goods (electrical appliances, furniture, bedding, automobiles/motorcycles/bicycles, etc.) Miscellaneous expenses (sundries, consumables, and hairdressing) Medical expenses Transportation expenses Social expenses Insurance Communications expenses (postage, mobile phone, and Internet) Educational expenses Entertainment expenses | |
| Age | Please tell us your age. | Unit: age. |
| Gender | Please tell us your gender. | (1: man; 0: woman) |
| Marriage | Are you married? | (1: married; 0: other) |
| Children | Do you have children? | (1: yes; 0: no) |
| Number of family members | Including yourself, how many people live in your household? | |
| Education | Please tell us your highest academic qualification (if a student, please tell us which school you graduated from most recently). | (college graduate or higher: 1; other: 0). |
| Attachment | Please select all items that are applicable.
| (1: applicable; 0: not applicable) |
| Obs. | Mean | S.D. | Min. | Max. | |
|---|---|---|---|---|---|
| Darsal dummy | 3685 | 0.661 | 0.474 | 0 | 1 |
| Life satisfaction (standardized: 0 to 1) | 3685 | 0.751 | 0.181 | 0 | 1 |
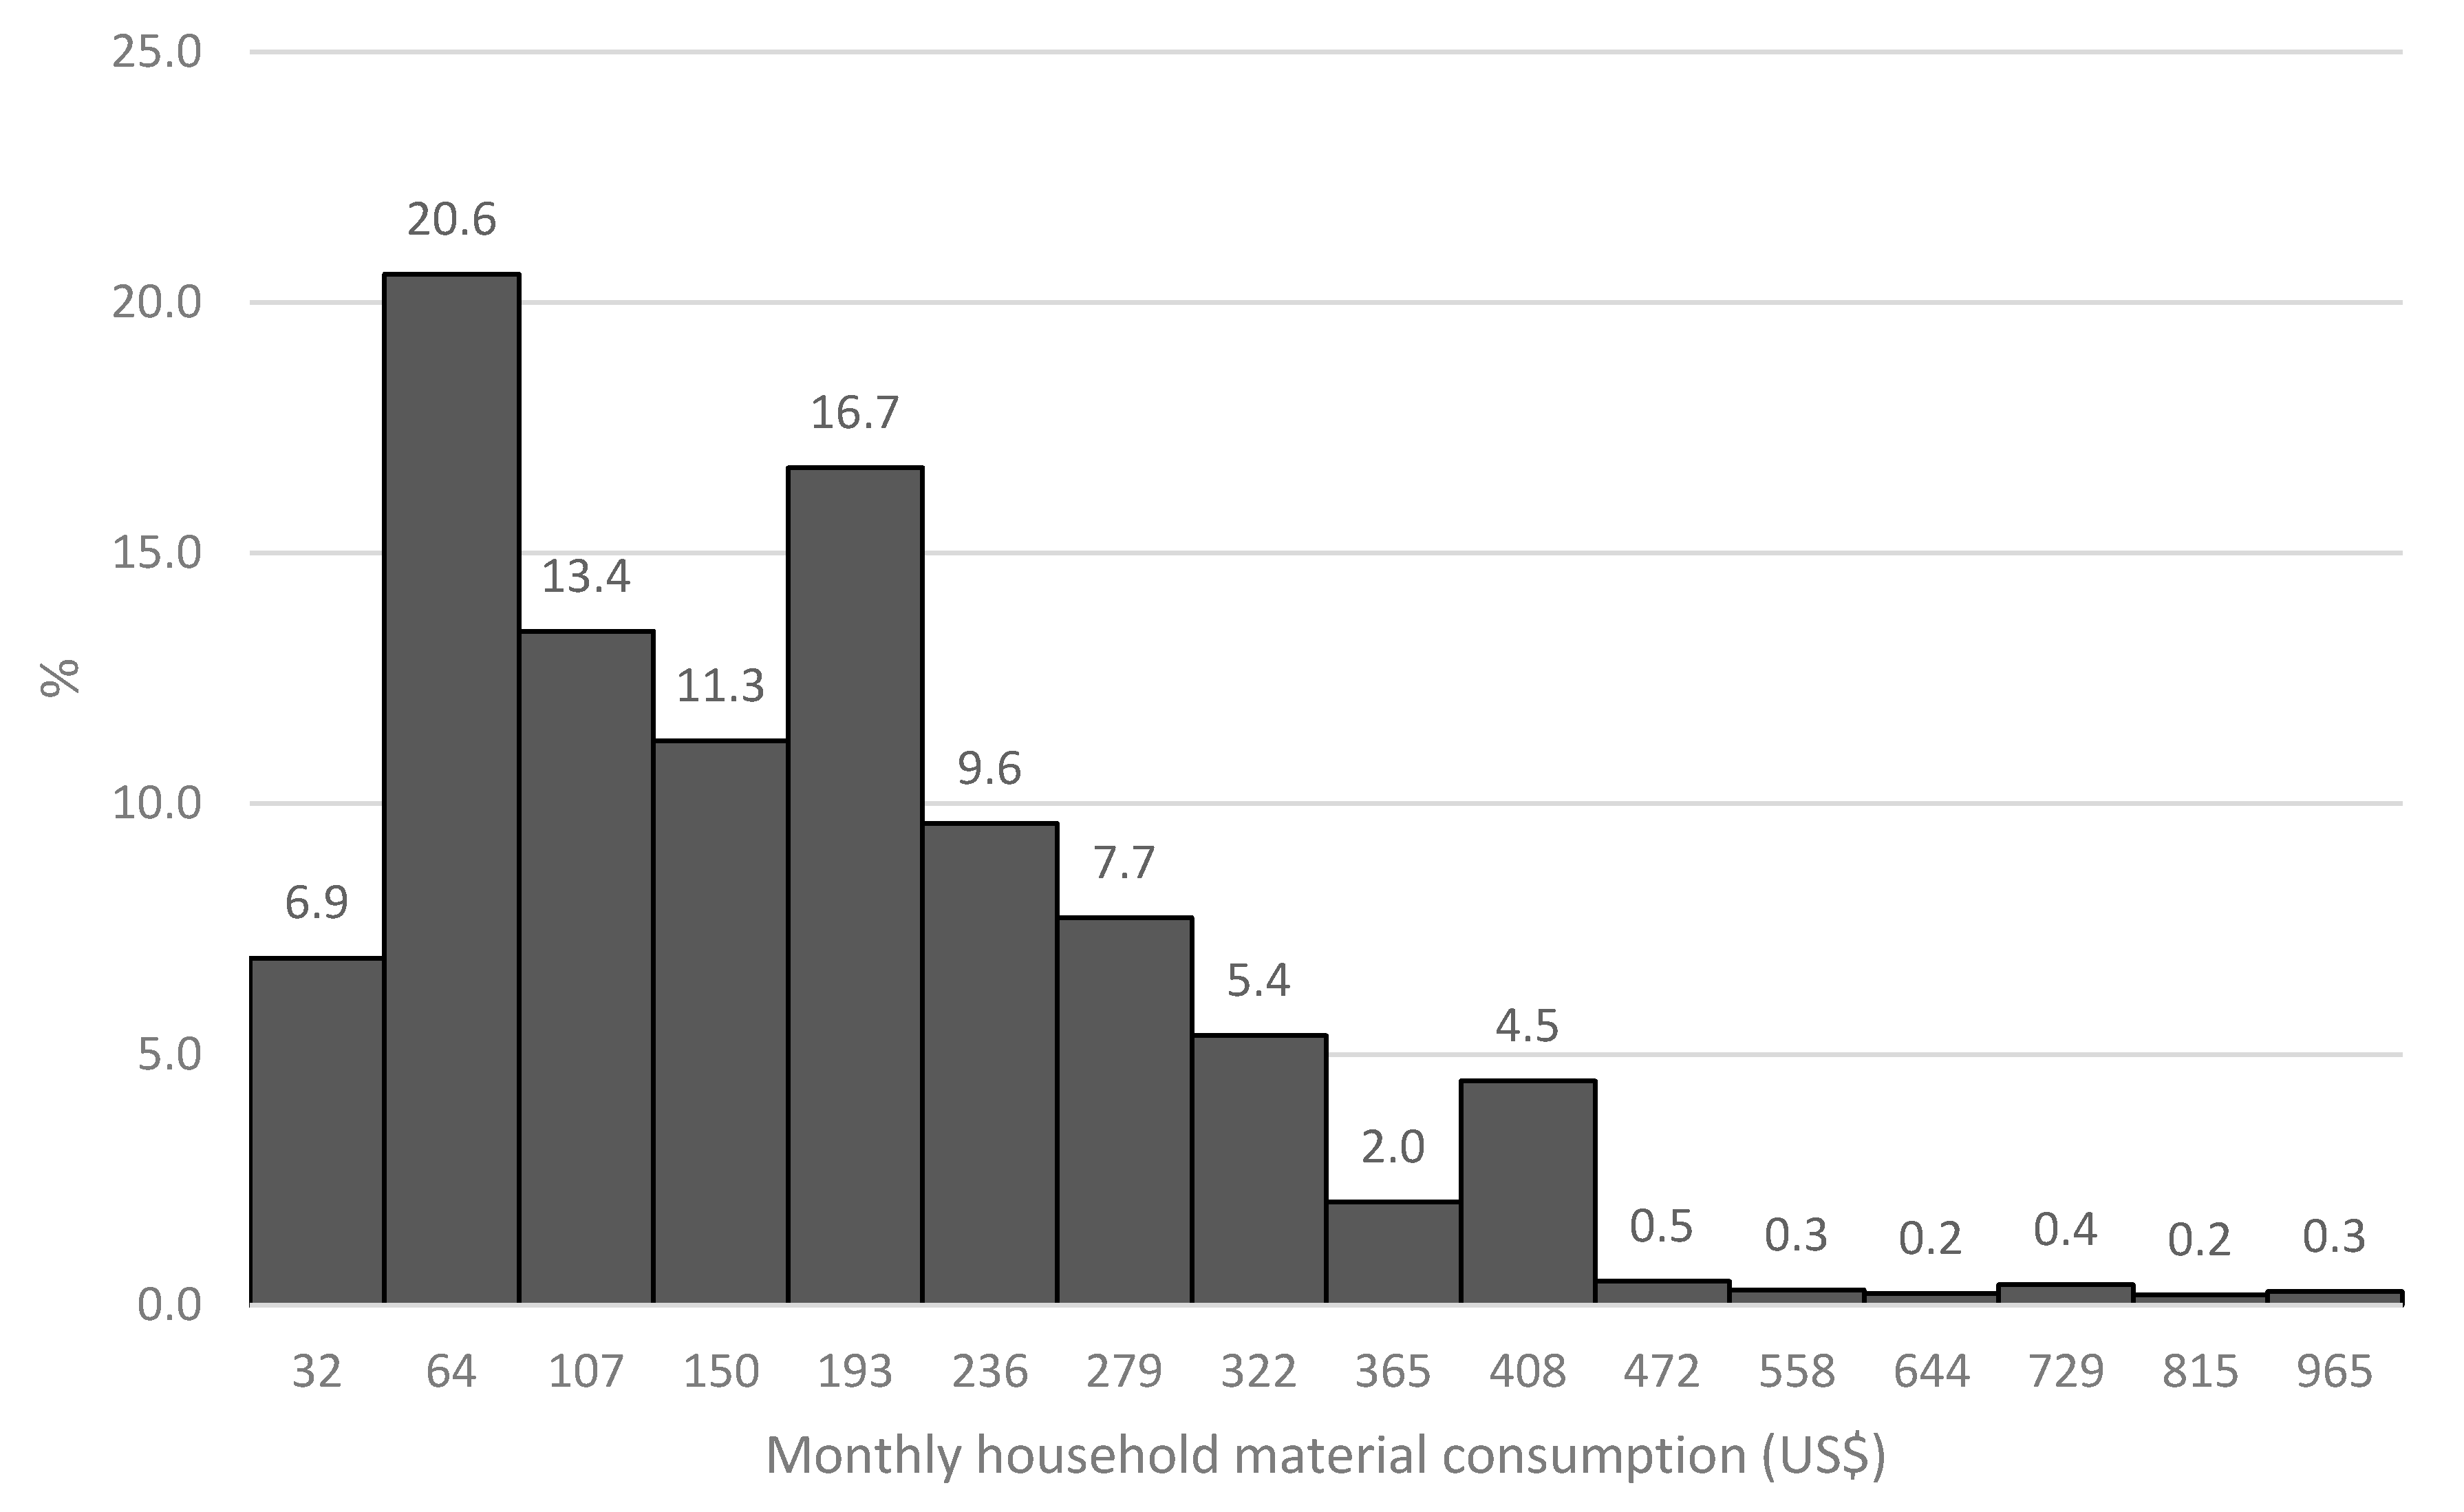
| Monthly household material consumption (US$) | 3685 | 179 | 124 | 32 | 965 |
| Monthly household total consumption (US$) | 3685 | 255 | 426 | 54 | 1931 |
| Age | 3685 | 39.9 | 12.8 | 18 | 101 |
| Gender | 3685 | 0.499 | 0.500 | 0 | 1 |
| Marriage | 3685 | 0.871 | 0.335 | 0 | 1 |
| Children | 3685 | 0.906 | 0.292 | 0 | 1 |
| Number of family members | 3685 | 4.01 | 1.28 | 1 | 10 |
| Education | 3685 | 0.044 | 0.206 | 0 | 1 |
| Attachment dummy | 3685 | 0.242 | 0.428 | 0 | 1 |
| Obs. | Mean | S.D. | Min. | Max. | |
|---|---|---|---|---|---|
| Darsal dummy | 892 | 0.646 | 0.479 | 0 | 1 |
| Life satisfaction (standardized: 0 to 1) | 892 | 0.747 | 0.244 | 0 | 1 |
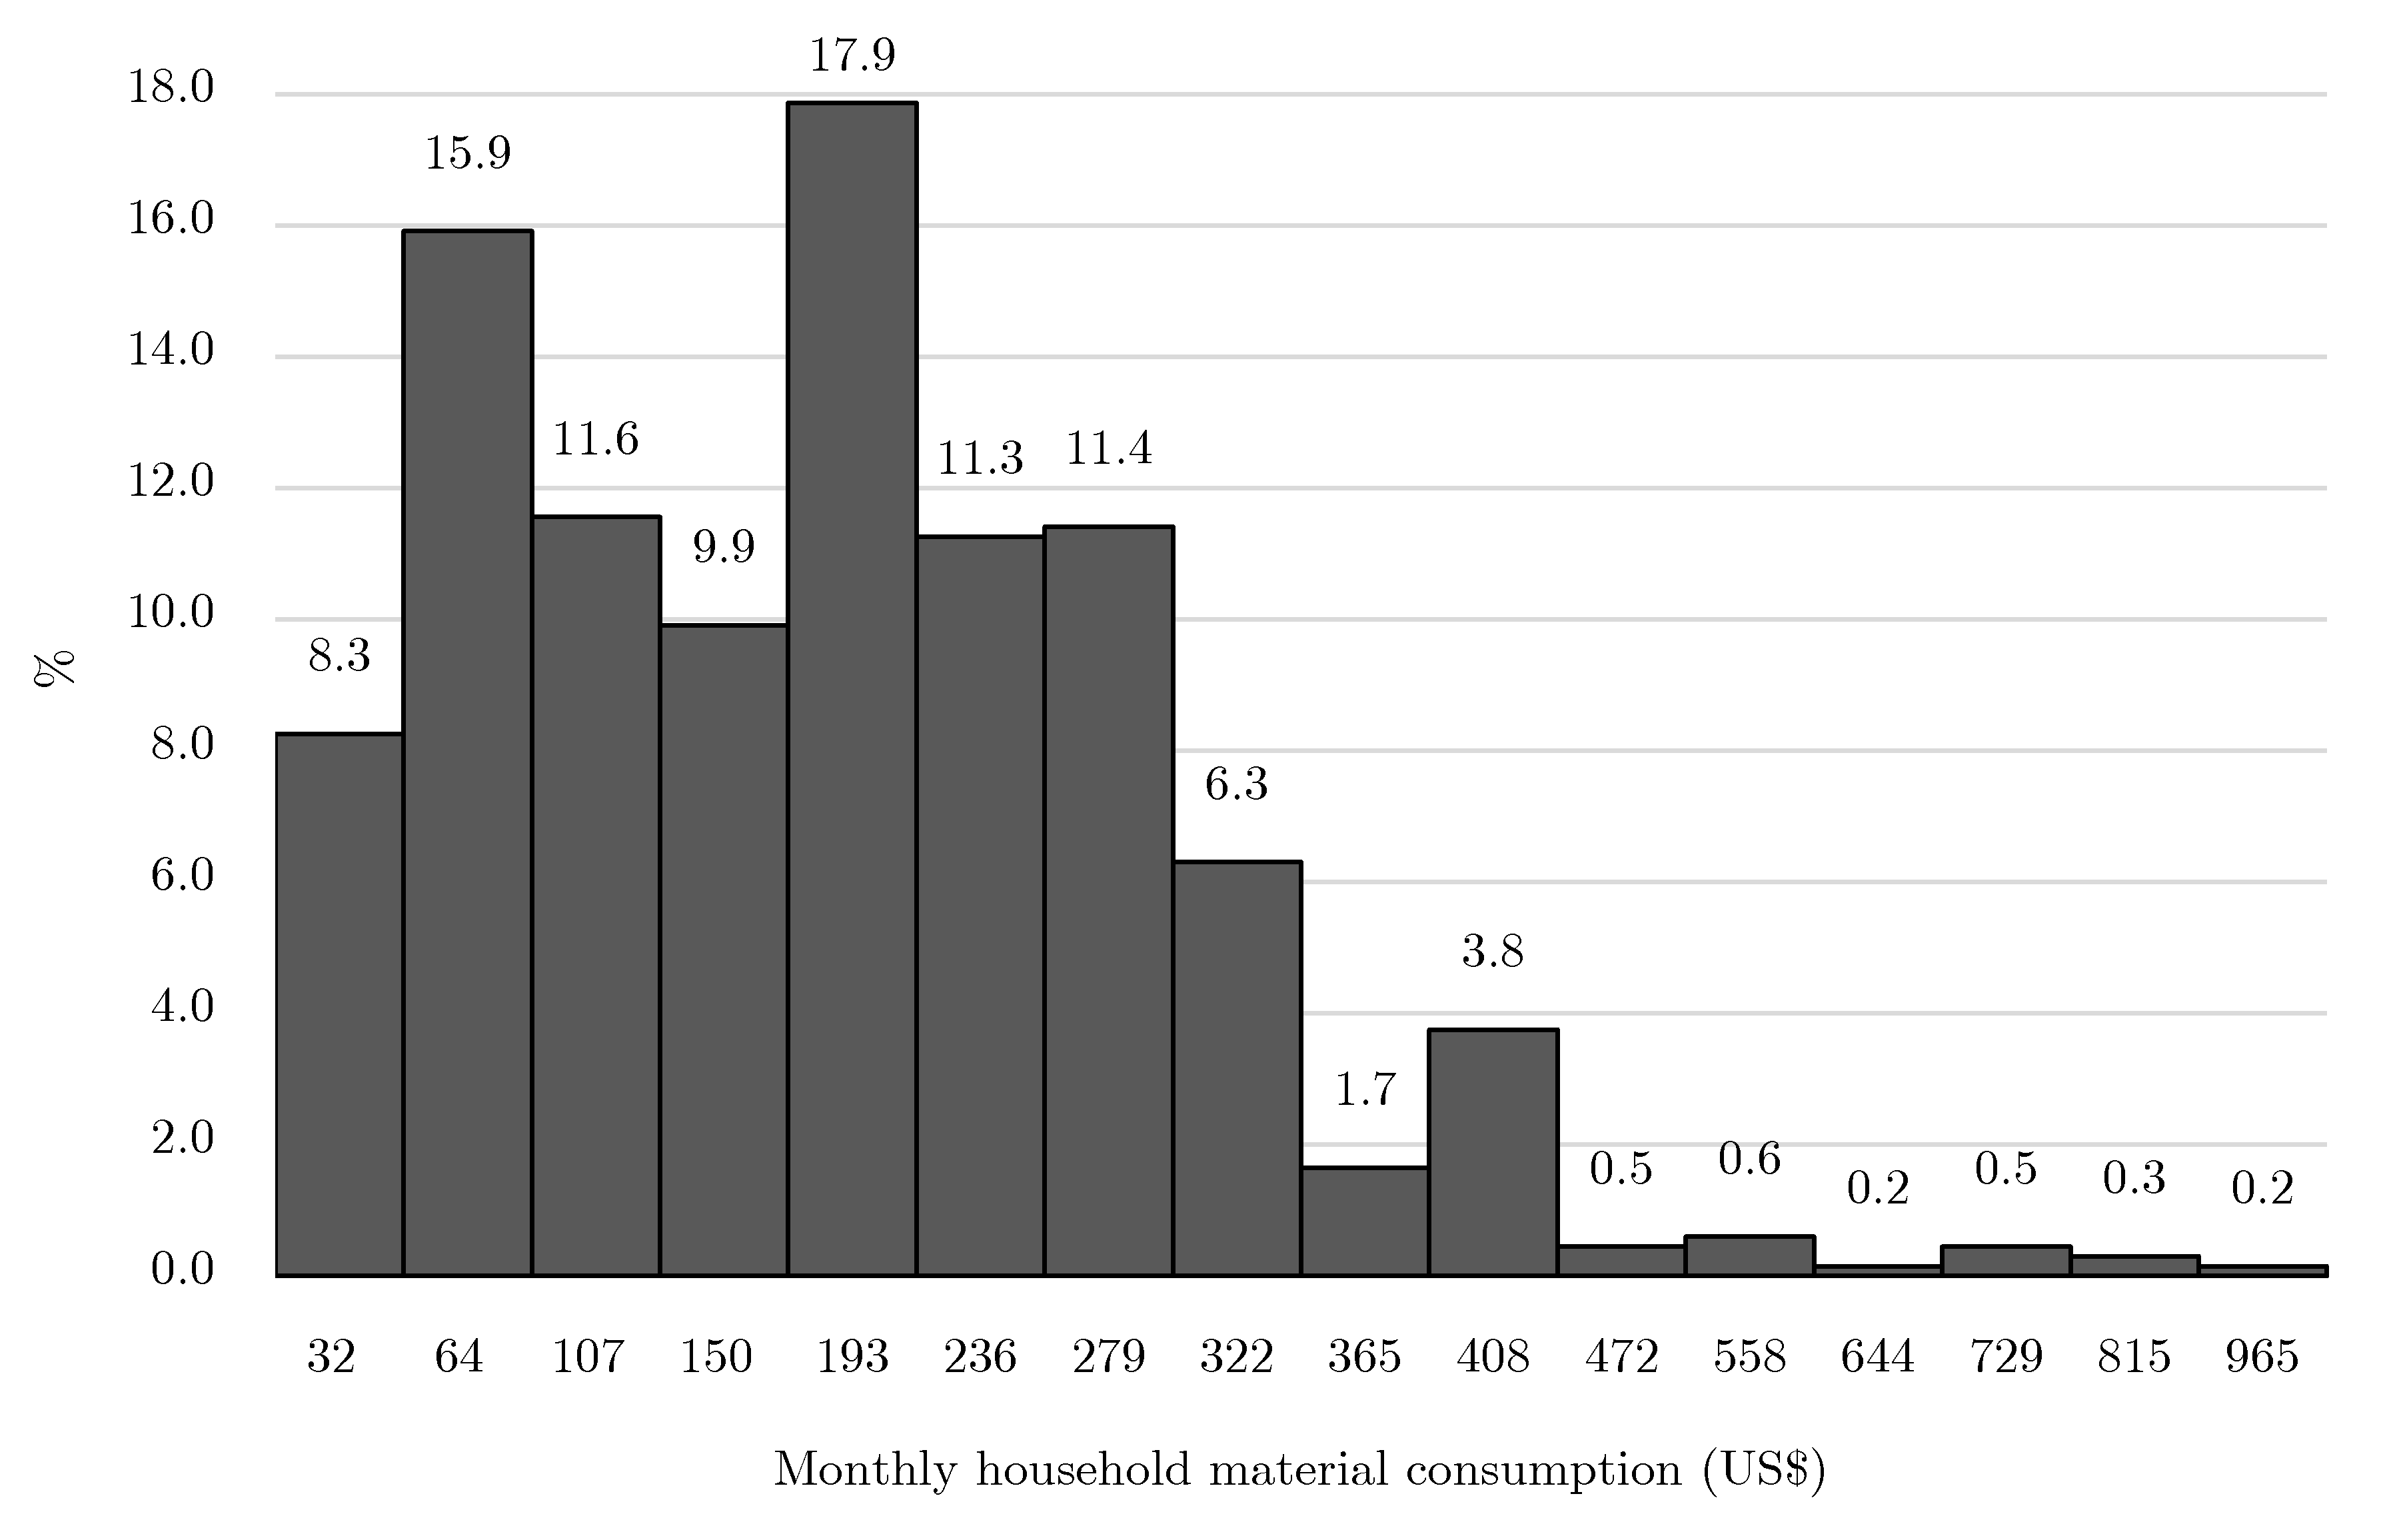
| Monthly household material consumption (US$) | 892 | 188 | 122 | 32 | 965 |
| Monthly household total consumption (US$) | 892 | 259 | 435 | 54 | 1931 |
| Age | 892 | 39.4 | 13.6 | 18 | 100 |
| Gender | 892 | 0.524 | 0.500 | 0 | 1 |
| Marriage | 892 | 0.859 | 0.348 | 0 | 1 |
| Children | 892 | 0.898 | 0.303 | 0 | 1 |
| Number of family members | 892 | 4.17 | 1.45 | 1 | 10 |
| Education | 892 | 0.052 | 0.221 | 0 | 1 |
| Obs. | Mean | S.D. | Min. | Max. | |
|---|---|---|---|---|---|
| Darsal dummy | 2689 | 0.667 | 0.471 | 0 | 1 |
| Life satisfaction (standardized: 0 to 1) | 2689 | 0.752 | 0.220 | 0 | 1 |
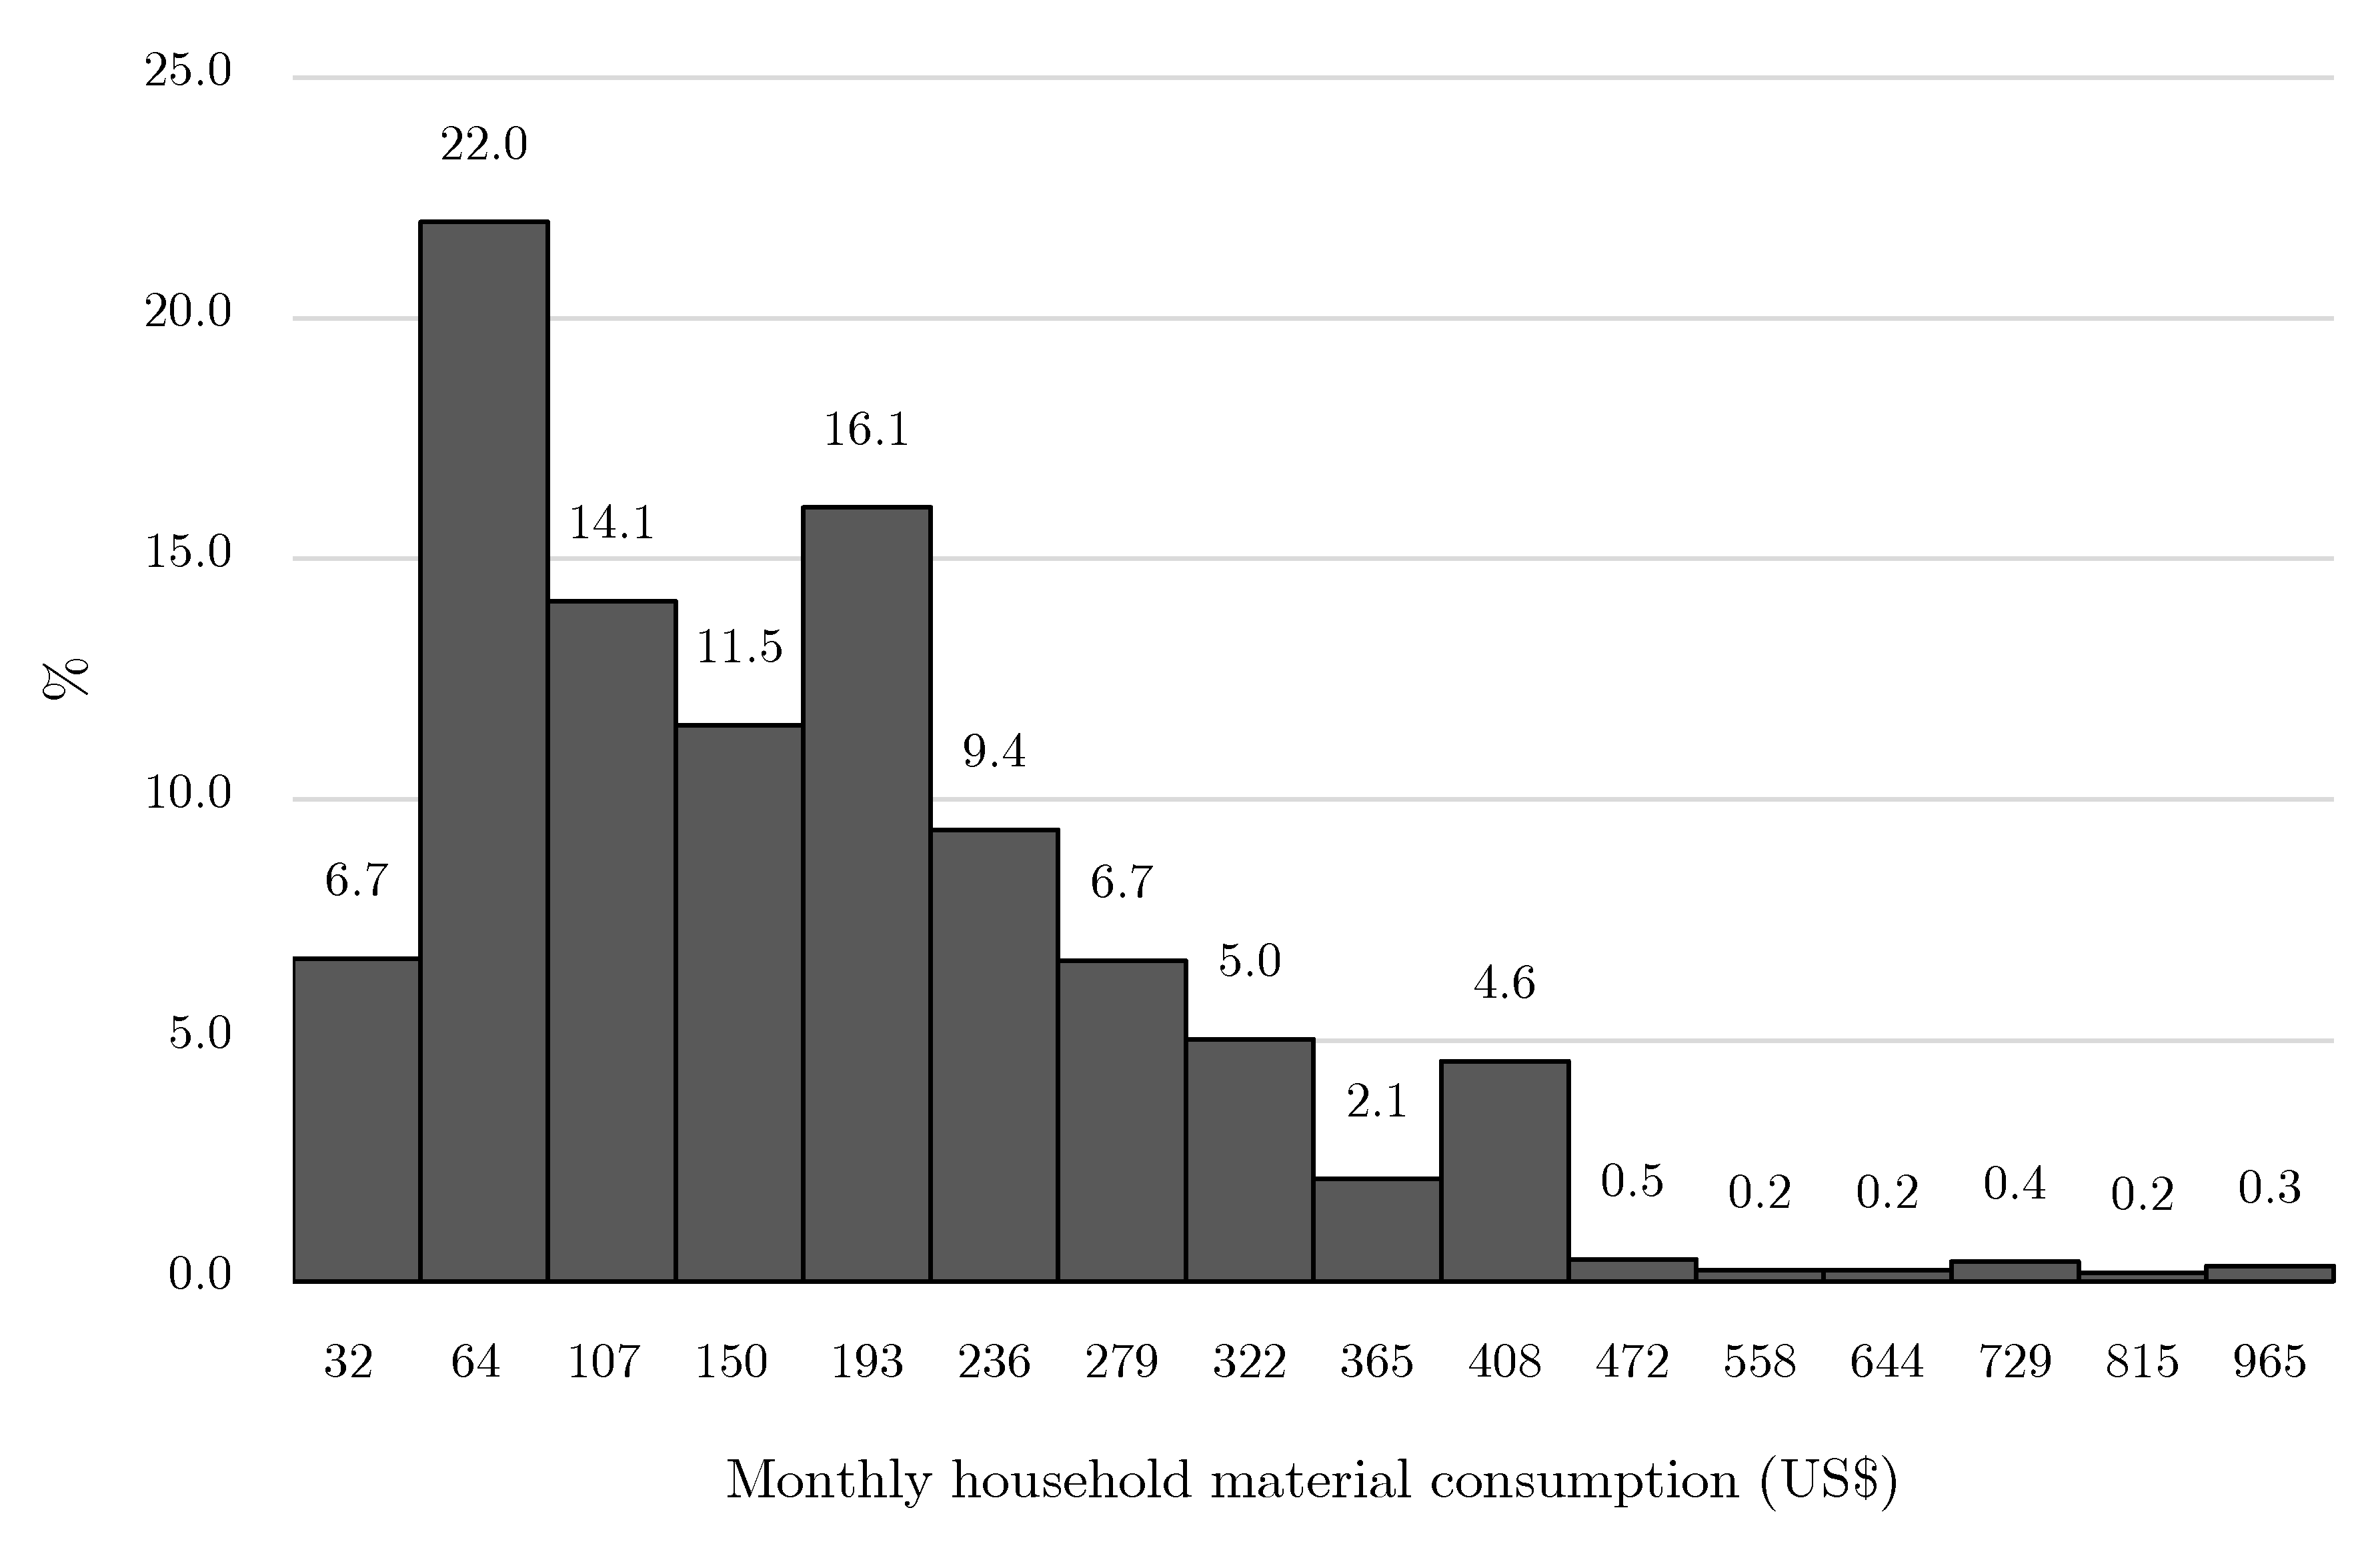
| Monthly household material consumption (US$) | 2689 | 175 | 124 | 32 | 965 |
| Monthly household total consumption (US$) | 2689 | 254 | 443 | 54 | 1931 |
| Age | 2689 | 40.2 | 12.5 | 18 | 100 |
| Gender | 2689 | 0.490 | 0.500 | 0 | 1 |
| Marriage | 2689 | 0.332 | 0.874 | 0 | 1 |
| Children | 2689 | 0.907 | 0.290 | 0 | 1 |
| Number of family members | 2689 | 3.96 | 1.22 | 1 | 10 |
| Education | 2689 | 0.043 | 0.202 | 0 | 1 |
| Approximate Significance of Smooth Term (F Value) | |
|---|---|
| Overall sample | 137.8 *** |
| Subsample 1 (Attachment dummy = 1) | 4.426 * |
| Subsample 2 (Attachment dummy = 0) | 141.9 *** |
| Variable | Overall Sample | Subsample 1 | Subsample 2 |
|---|---|---|---|
| Age | 0.030 (0.12) | −0.022 * (0.010) | 0.011 (0.0073) |
| Age squared | −0.10 (0.15) | 0.00022 * (0.00011) | −0.00016 * (0.000079) |
| Gender (Male dummy) | 0.010 (0.0069) | −0.042 (0.056) | 0.019 * (0.0086) |
| Marriage | −0.042 * (0.026) | −0.072 (0.10) | −0.088 (0.059) |
| Children | −0.014 (0.016) | −0.016 (0.13) | −0.0086 (0.076) |
| Number of family members | −0.11 *** (0.025) | −0.084 *** (0.020) | −0.029 * (0.013) |
| Education | 0.018 (0.017) | 0.23 * (0.12) | 0.025 (0.080) |
| Residual consumption | 0.023 ** (0.011) | 0.019 * (0.009) | 0.021 ** (0.010) |
| Darsal dummy | −0.12 *** (0.0079) | −0.99 *** (0.016) | −0.34 *** (0.037) |
| Constant term | 0.89 *** (0.020) | 1.04 *** (0.038) | 4.33 *** (0.25) |
| Adjusted R squared | 0.15 | 0.31 | 0.12 |
| No. of observation | 3685 | 892 | 2689 |
Publisher’s Note: MDPI stays neutral with regard to jurisdictional claims in published maps and institutional affiliations. |
© 2020 by the authors. Licensee MDPI, Basel, Switzerland. This article is an open access article distributed under the terms and conditions of the Creative Commons Attribution (CC BY) license (http://creativecommons.org/licenses/by/4.0/).
Share and Cite
Tsurumi, T.; Yamaguchi, R.; Kagohashi, K.; Managi, S. Attachment to Material Goods and Subjective Well-Being: Evidence from Life Satisfaction in Rural Areas in Vietnam. Sustainability 2020, 12, 9913. https://doi.org/10.3390/su12239913
Tsurumi T, Yamaguchi R, Kagohashi K, Managi S. Attachment to Material Goods and Subjective Well-Being: Evidence from Life Satisfaction in Rural Areas in Vietnam. Sustainability. 2020; 12(23):9913. https://doi.org/10.3390/su12239913
Chicago/Turabian StyleTsurumi, Tetsuya, Rintaro Yamaguchi, Kazuki Kagohashi, and Shunsuke Managi. 2020. "Attachment to Material Goods and Subjective Well-Being: Evidence from Life Satisfaction in Rural Areas in Vietnam" Sustainability 12, no. 23: 9913. https://doi.org/10.3390/su12239913
APA StyleTsurumi, T., Yamaguchi, R., Kagohashi, K., & Managi, S. (2020). Attachment to Material Goods and Subjective Well-Being: Evidence from Life Satisfaction in Rural Areas in Vietnam. Sustainability, 12(23), 9913. https://doi.org/10.3390/su12239913