Review

Urban Ecosystem Services: A Review of the Knowledge Components and Evolution in the 2010s

1
Department of Forest Environment and Systems, College of Science and Technology, Kookmin University, 77 Jeongneung-ro, Seongbuk-gu, Seoul 02707, Korea
2
O-Jeong Resilience Institute (OJERI), Korea University, 145 Anam-ro, Seongbuk-gu, Seoul 02841, Korea
*
Author to whom correspondence should be addressed.
Sustainability 2020, 12(23), 9839; https://doi.org/10.3390/su12239839
Submission received: 18 October 2020 / Revised: 17 November 2020 / Accepted: 23 November 2020 / Published: 25 November 2020

Abstract

:
In an effort to reconnect urban populations to the biosphere, which is an urgent task to ensure human sustainability, the concept of urban ecosystem services (UES) has recently garnered scholarly and political attention. With an aim to examine the emerging research trends and gaps in UES, we present an up-to-date, computer-based meta-analysis of UES from 2010 to 2019 by implementing a keyword co-occurrence network (KCN) approach. A total of 10,247 author keywords were selected and used to analyze undirected and weighted networks of these keywords. Specifically, power-law distribution fitting was performed to identify overall UES keyword trends, and clusters of keywords were examined to understand micro-level knowledge trends. The knowledge components and structures of UES literature exhibited scale-free network characteristics, which implies that the KCN of the UES throughout the 2010s was dominated by a small number of keywords such as “urbanization”, “land use and land cover”, “urban green space” and “green infrastructure”. Finally, our findings indicate that knowledge of stakeholder involvement and qualitative aspects of UES are not as refined as spatial UES approaches. The implications of these knowledge components and trends are discussed in the context of urban sustainability and policy planning.

1. Introduction

Urbanization is often associated with disproportionate anthropogenic impact on the environment due to overpopulation, pollution and deforestation [1]. Such environmental impacts occur not only at the local scale but also at regional and even global scales [2,3,4,5]. Given that more than half of the global population currently resides in cities [6,7], the concept of urban ecosystem services (UES) has recently garnered scholarly and political attention due to the desire to reconnect urban populations to the biosphere [8].
Here, the concept of ecosystem services, defined as “the direct and indirect contributions of ecosystems to human well-being” by the Economics of Ecosystems and Biodiversity [9], is expanded and applied to the concept of UES, which can be more broadly described as the contributions provided by urban ecosystems to human well-being. UES are distinct in several aspects [10]: (1) the concept of UES reflects the demand for ecosystem services from large population volumes in cities; (2) it touches upon the tension (or scale mismatches) between social and ecological processes in the urban era characterized by unprecedented urban growth, and this tension often appears between biodiversity conservation schemes and urban development; (3) it is directly and practically related with human efforts to reduce the urban ecological footprint through various strategies such as green urban planning, public engagement and ecosystem governance [7]. In other words, the concept of UES has been evolving in association with other social processes such as urbanization and biodiversity conservation efforts.
Recent reviews on UES [10,11,12,13,14,15,16,17] have analyzed the characteristics of UES literature and discussed the challenges of UES research. Among the most frequently mentioned bias of UES literature is that most UES studies are geographically centered in Europe, North America and China [11]. Further, most studies report a lack of multiservice valuations; in other words, most UES studies typically focus on a single UES within a limited number of locations [11,13,18]. Additionally, the processes by which policy planning incorporates ecosystem-services-related information to minimize urbanization pressures on urban social-ecological systems are still not actively studied or transferred as a strategic issue [14]. Further, the relationship between UES and biodiversity, particularly within the context of human perception of urban biodiversity, remains a critical knowledge gap [15]. Other challenges and pitfalls of UES studies include the clarification of key term definitions such as “urban”, “producers” or “consumers”; limited data transferability; stakeholder engagement; and integrated research efforts [13].
Although recent reviews have already attempted to survey the trends and gaps in the UES literature, most of them are often based on highly cited articles or a narrow literature selection based on the specific research objectives of any given study. Moreover, a comprehensive overview of UES knowledge components, trends and evolution has not been conducted, which is necessary to foresee future research challenges and guide research efforts. A comprehensive meta-analysis of trends and gaps in the UES knowledge base is a critical step toward operationalizing UES through integrated research and political efforts. This is particularly important in the context of the current state of civilization and development, where human well-being is profoundly affected by human–environment interactions, as clearly exemplified by the current coronavirus disease 2019 (COVID-19) pandemic [19].
In this paper, we first present data collection and organization processes followed by our methodological approaches performed at both macro and micro levels. Key findings of each analytical method are summarized and discussed in the context of urban sustainability and policy planning.

2. Materials and Methods

2.1. Materials

To ensure a comprehensive computer-based meta-analysis, the ISI Web of Science database was searched to identify all scientific studies published from 2010 to 2019 that focused on urban and ecosystem services. Our initial search demonstrated that the number of UES publications has rapidly increased since the 2010s, with the first UES-related study being published in 1997. Among 4428 publications from 1997 to 2019, 4179 were published in the 2010s. A total of 4179 records were selected, from which we removed studies without author keywords, as we were particularly interested in understanding which specific terms and concepts were employed as keywords to create a relevant knowledge map. As a result, the original 4179 records were narrowed down to 3800. The author keywords from these 3800 studies were then examined to eliminate redundancies and potential errors prior to network analysis, which included changing all plural forms to singular if both terms appeared in the list and were interchangeable. A total of 10,247 keywords were collected as the final materials of our study, and the selected studies were then organized into three 3-year or 4-year periods to examine the changes in knowledge components and clusters, as described in previous literature [20].
A total of 273 articles were identified between 2010 and 2012, 753 between 2013 and 2015 and 2774 between 2016 and 2019. Moreover, a total of 1045 keywords were identified for 2010–2012, 2350 for 2013–2015 and 6852 for 2016–2019.

2.2. Methods

Application of Keyword Co-Occurrence Network Metrics

The keyword co-occurrence networks (KCNs) were constructed as undirected and weighted networks using the R statistical computing language (ver. 3.5.2) [21]. For the visualization of knowledge maps, our study also employed VOSviewer (ver. 1.6.15), a software tool optimized for bibliometric network visualization [22]. The KCN approach focused on the links between keywords, treating a keyword as a node and the co-occurrence of a keyword pair as a link between the two keywords, as well as on the number of co-occurring keyword pairs [20]. In the weighted network, the weight of the link was determined by the number of co-occurring keyword pairs (i.e., strength as a function of node degree) [20].
Here, different metrics were used to analyze urban ecosystem services (UES) research trends at both macro and micro levels. For the analysis of macro trends, we hypothesized that keyword co-occurrence networks follow heavy-tailed distributions (i.e., inverse power law), with a large proportion of keywords with low strength and a small proportion of keywords with high strength over time. For this, we performed a statistical test to examine the fitting of power-law distributions by using the Kolmogorov–Smirnov (KS) test statistic [23], which is simply defined as the maximum distance between the cumulative distribution functions (CDFs) of the actual data and the fitted model, in the “igraph” [24] and “poweRlaw” [25] R packages. As for the KS test, the null hypothesis is that the empirical distribution follows the power law. With this analytical method, we sought to analyze the characteristics of the UES literature as complex knowledge systems. We also visualized the knowledge structure of each period through VOSviewer to examine the overall evolution.
Based on the results of the statistical and visual analyses at the macro level, as well as our understanding of the existing UES research challenges, we calculated a few more network metrics focusing on more detailed purposes. For instance, the VOSviewer clustering technique was used to detect the community structure of frequent keywords (i.e., at least five occurrences) within each time window [26]. The modularity-based clustering technique of VOSviewer is a variant of the cluster detection algorithm developed by Clauset et al. [27] which uses modularity to detect communities (i.e., clusters) within a network, a metric that accounts for both community cohesion and coupling [28].

3. Results

3.1. UES Literature Macro Trends

Figure 1 illustrates the strength distributions of the KCNs for 2010–2012, 2013–2015 and 2016–2019. In the figure, the y-axis represents complementary cumulative probability values, whereas the x-axis represents strength values. Overall, all three co-occurrence networks exhibited a scale-free strength distribution, indicated by the presence of power laws P(k) ~ k−γ [29]. Interestingly, this scale-free distribution pattern becomes more apparent toward the end of the 2010s.
Table 1 summarizes the results of the “igraph” and “poweRlaw” R package test statistics over the KCN strength distribution. Kolmogorov–Smirnov test statistics will be hereinafter referred to as KS statistics. A lower score denotes a better fit. Moreover, low p-values (<0.05) obtained by the poweRlaw package indicate that the test rejects the hypothesis that original data could have been sampled from the fitted power-law distribution. In the table, the results of the exponent and KS statistics generated by both packages were largely similar. Among the three time periods studied herein, the 2016–2019 period exhibited the highest absolute log-likelihood and p-value, as well as the lowest KS statistic score, indicating that this period had the best power-law distribution fit.
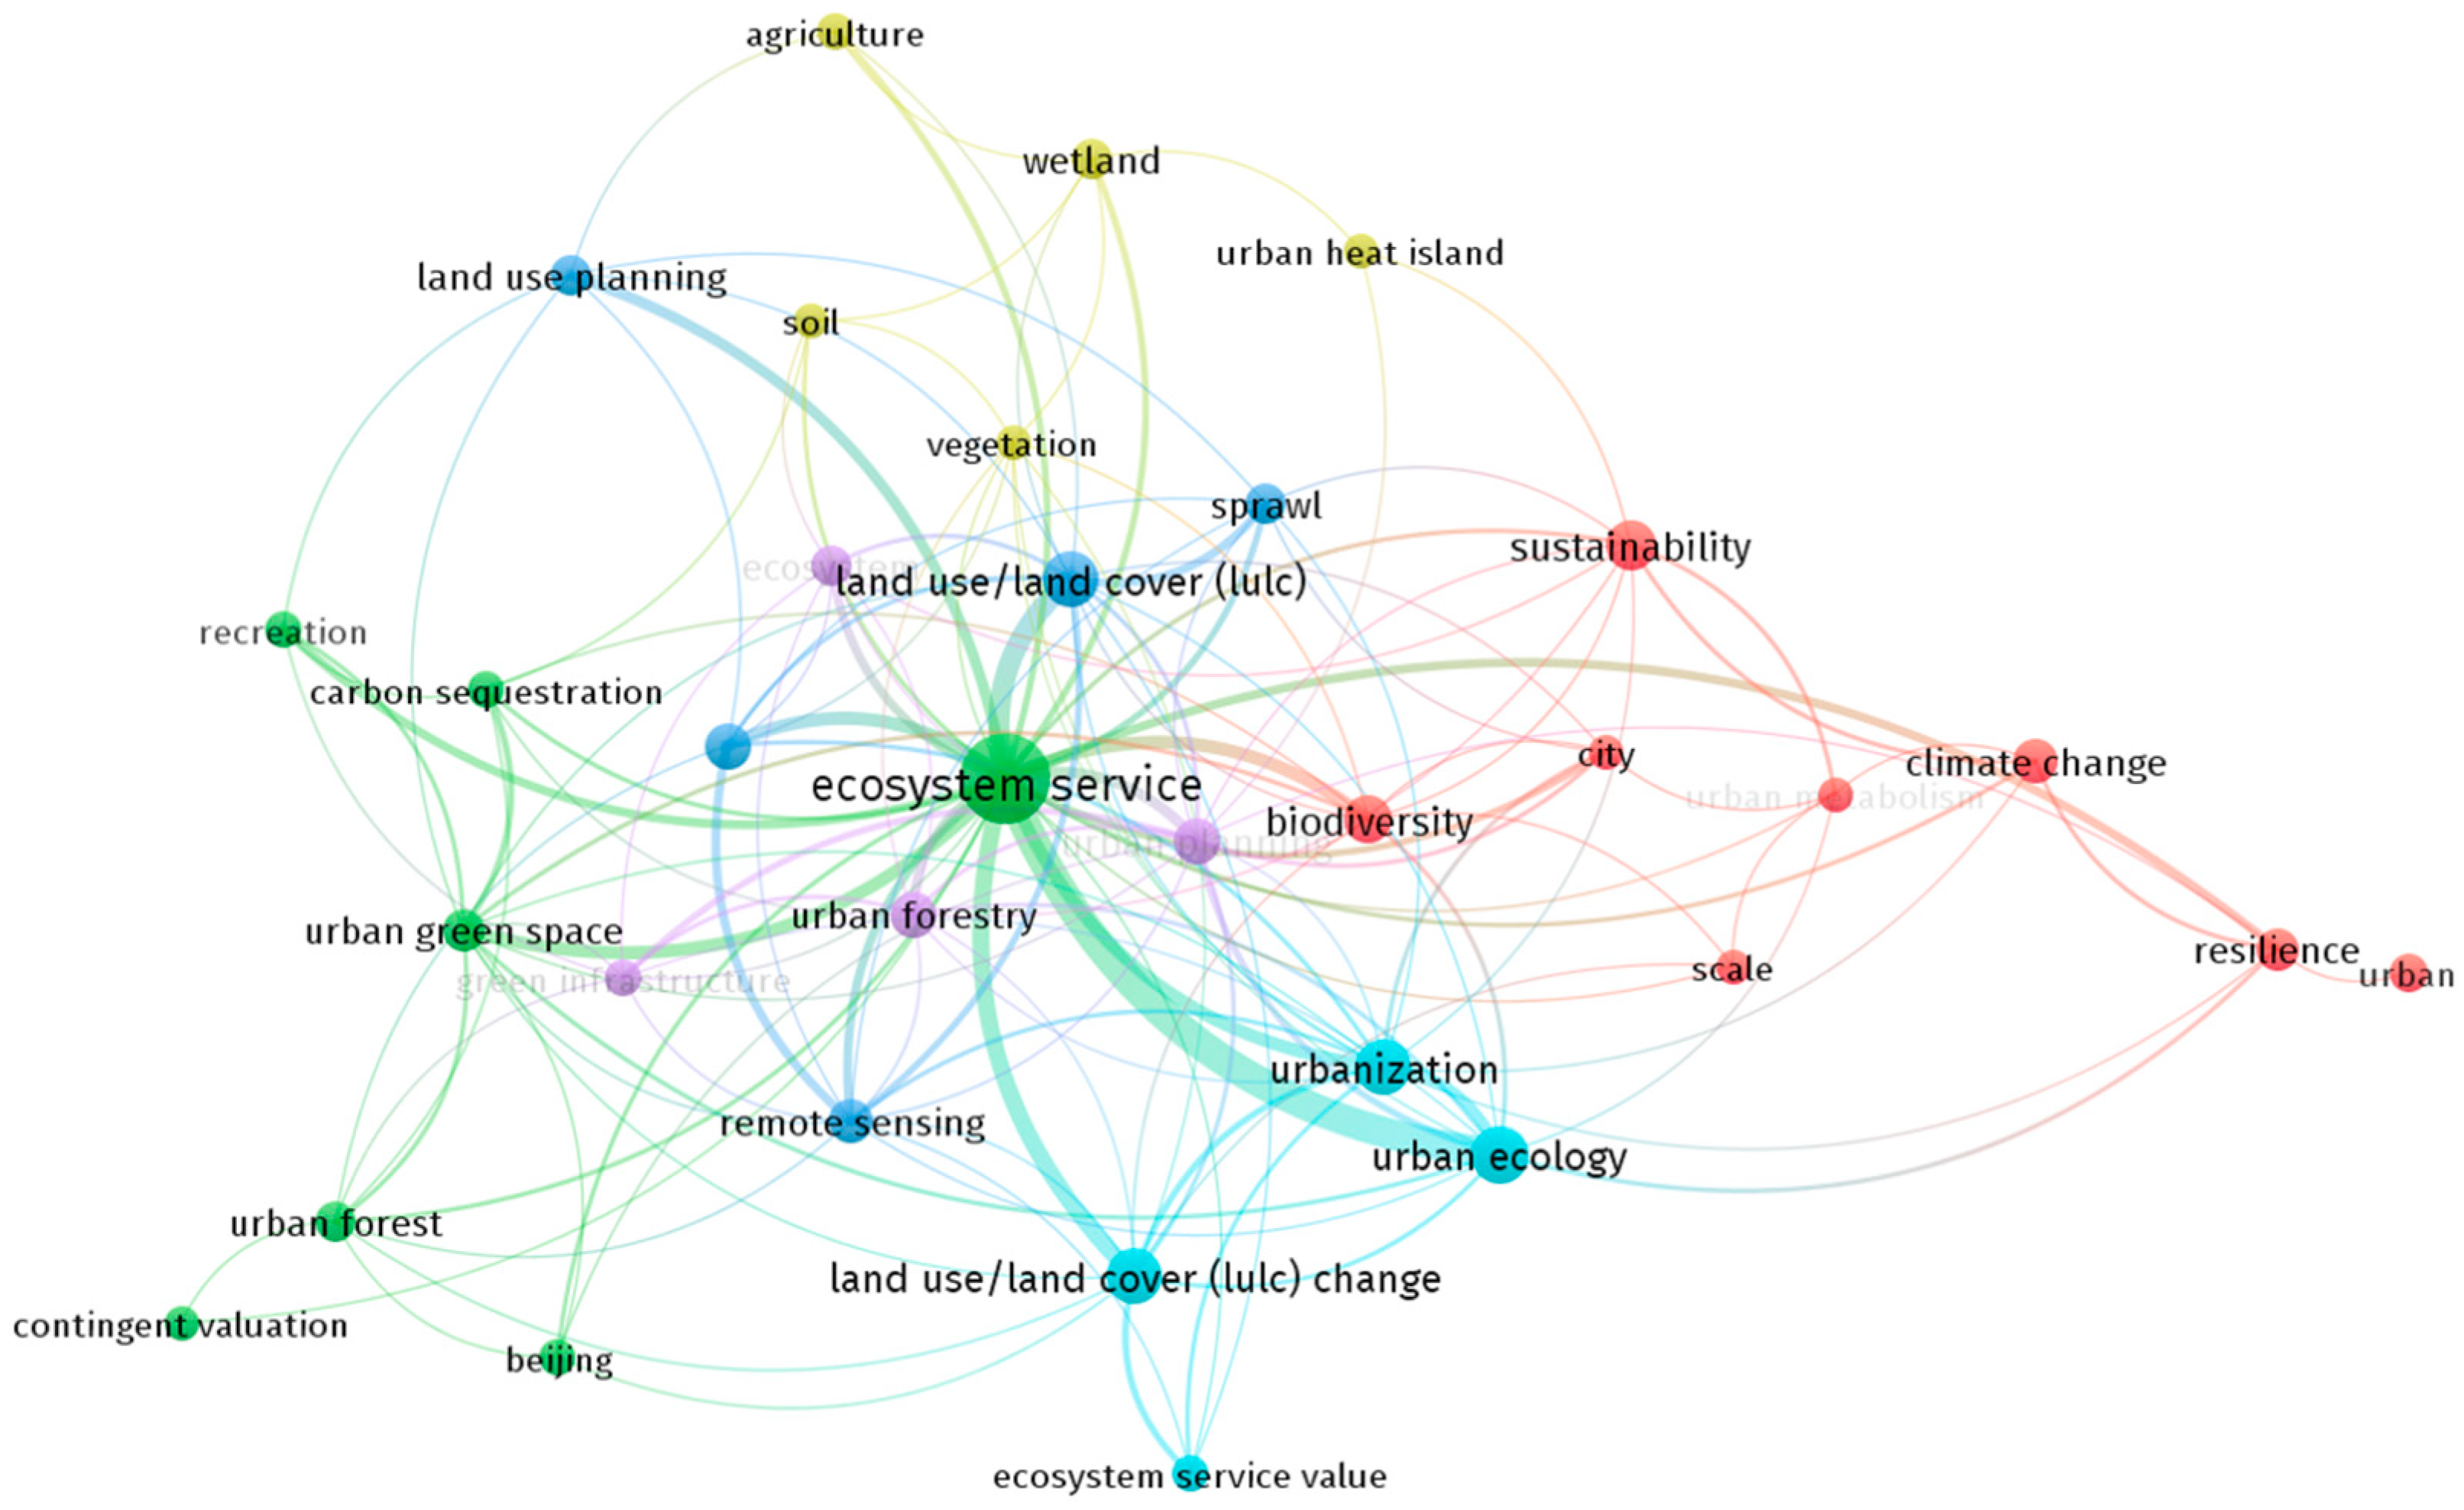
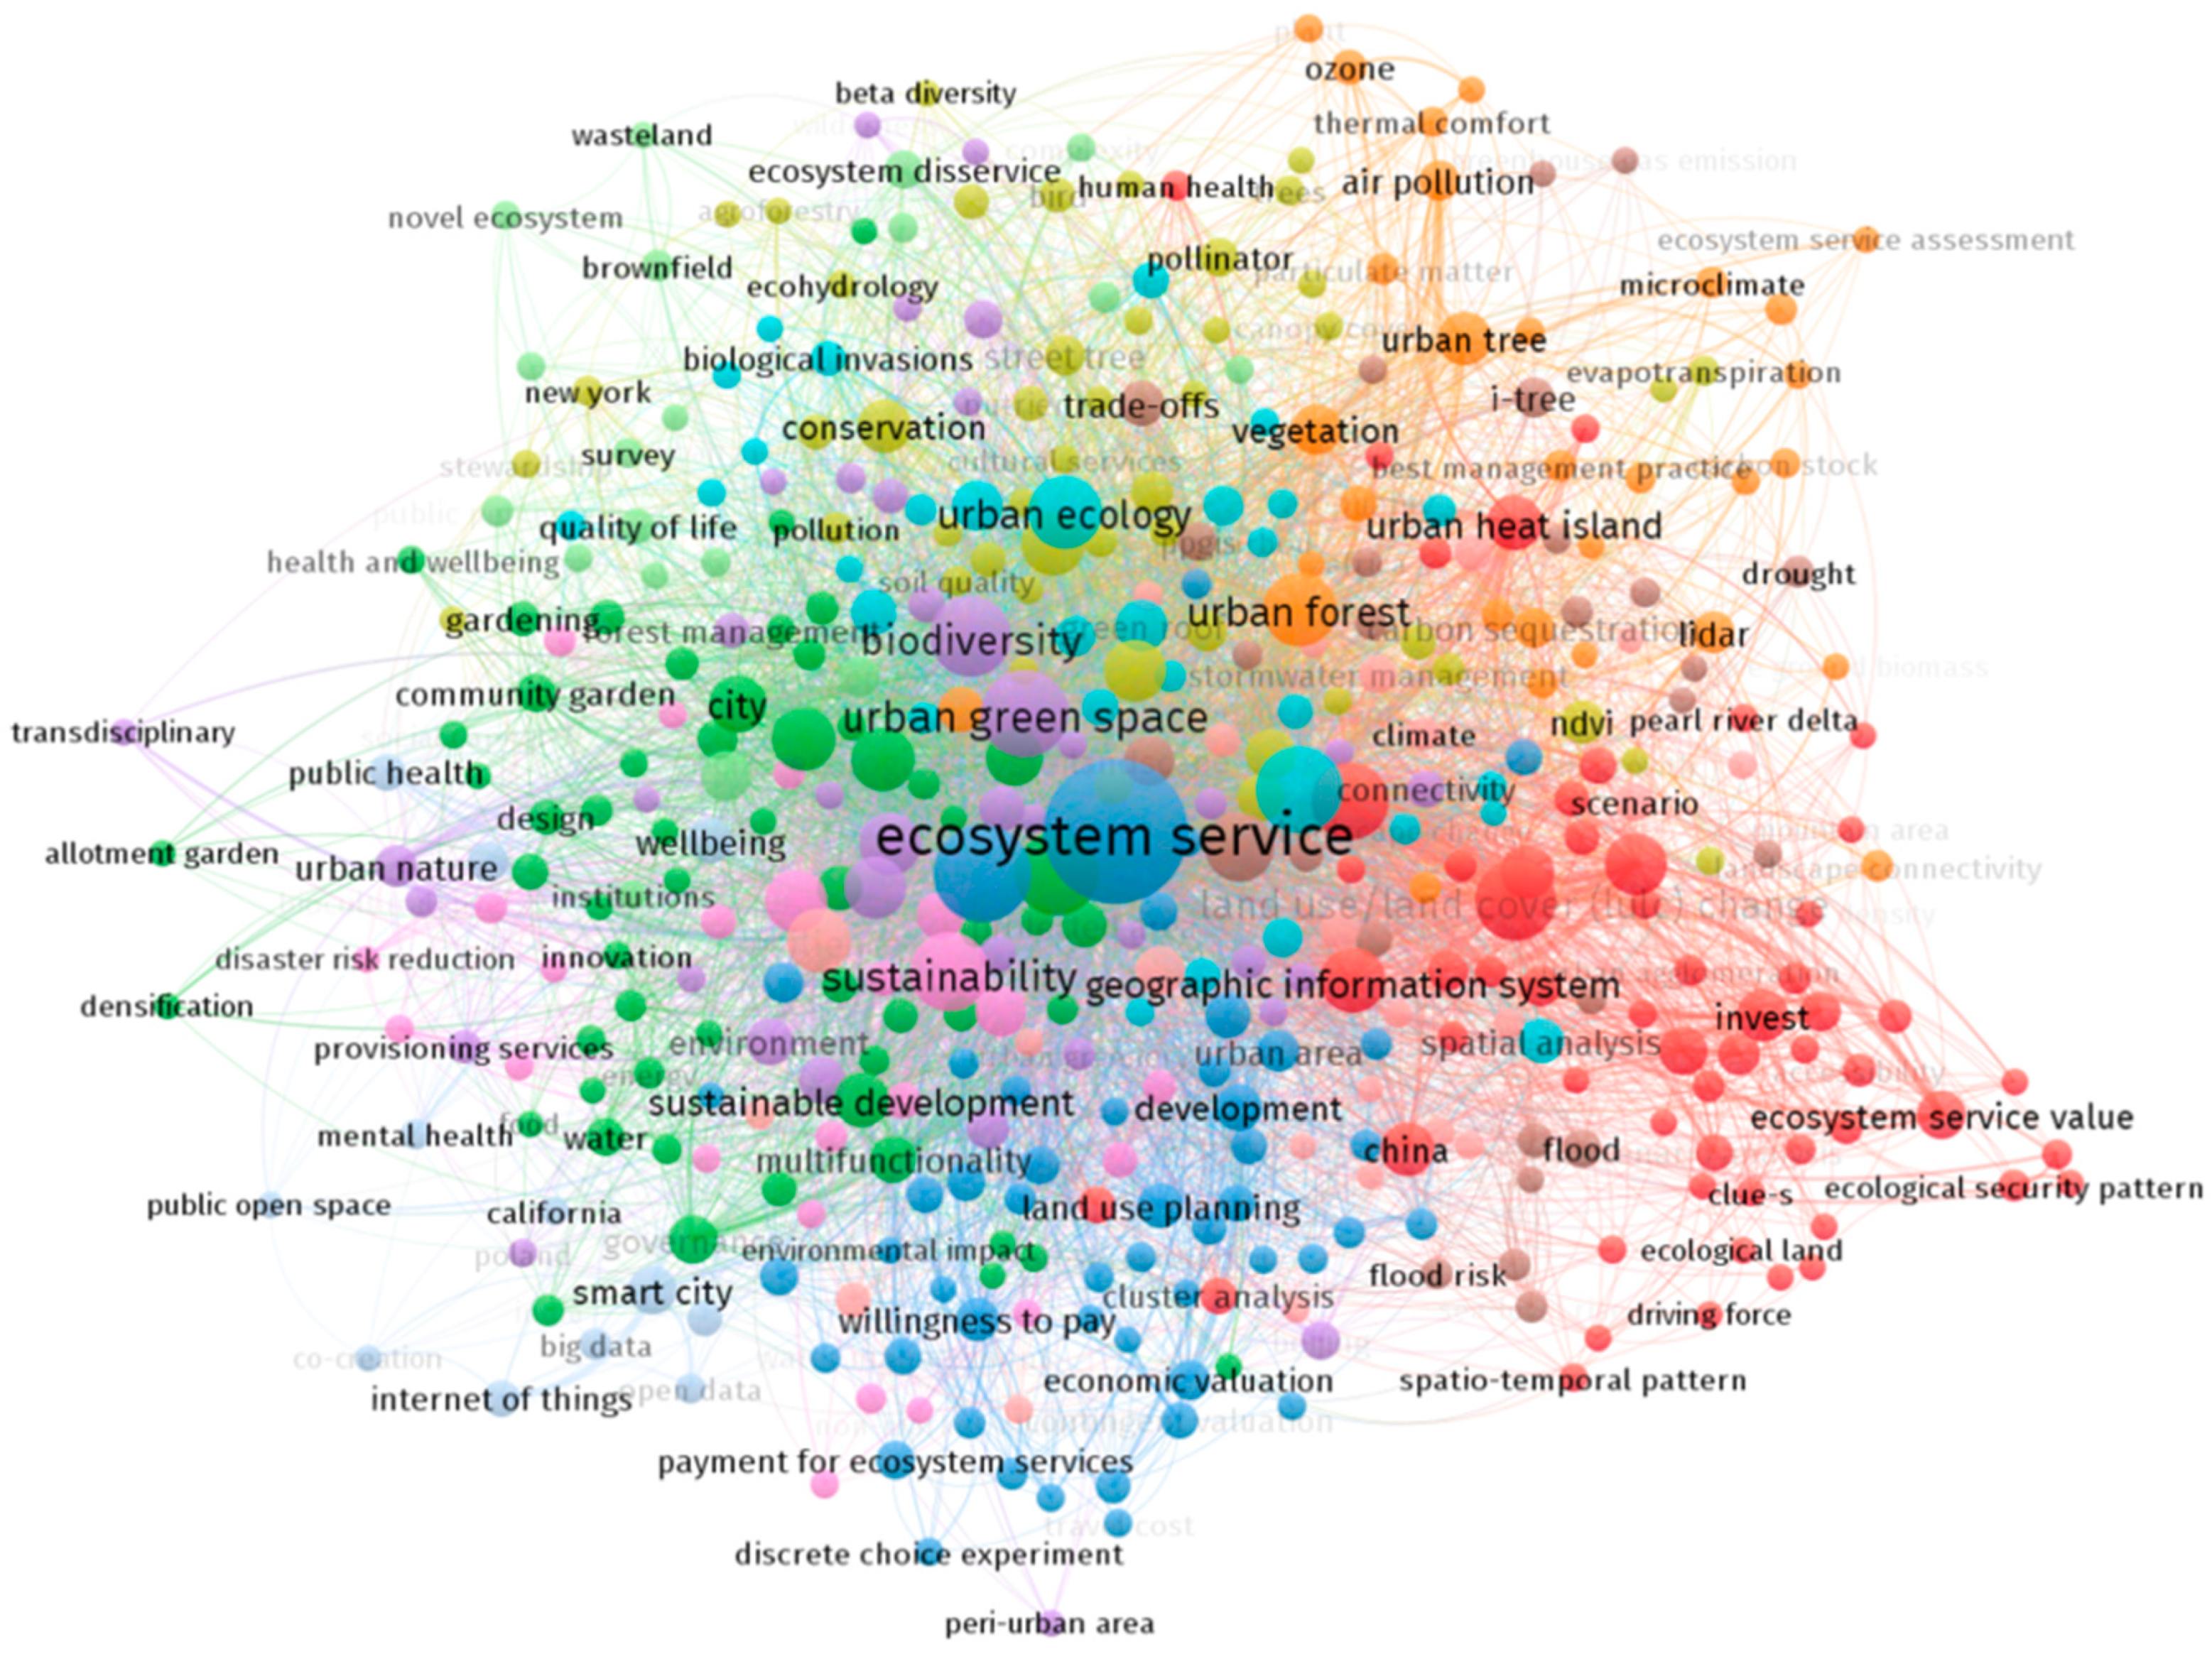
Figure 2, Figure 3 and Figure 4 represent the knowledge map visualizations for the three studied periods. Different node colors in the figures represent different clusters, whereas the node and font sizes of each keyword represent the strength values. The KCNs for 2010–2012, 2013–2015 and 2016–2019 comprise 6, 9 and 12 clusters, respectively. As shown in the figures, our findings not only identified an increase in the number of keywords but also in the number of links and clusters, suggesting that both the knowledge components and structures were greatly diversified and expanded over the last 10 years. At the same time, the keywords with high strength values remained relatively constant with the exception of only a few keywords.

3.2. Additional Analyses (Micro-Level Knowledge Trends)

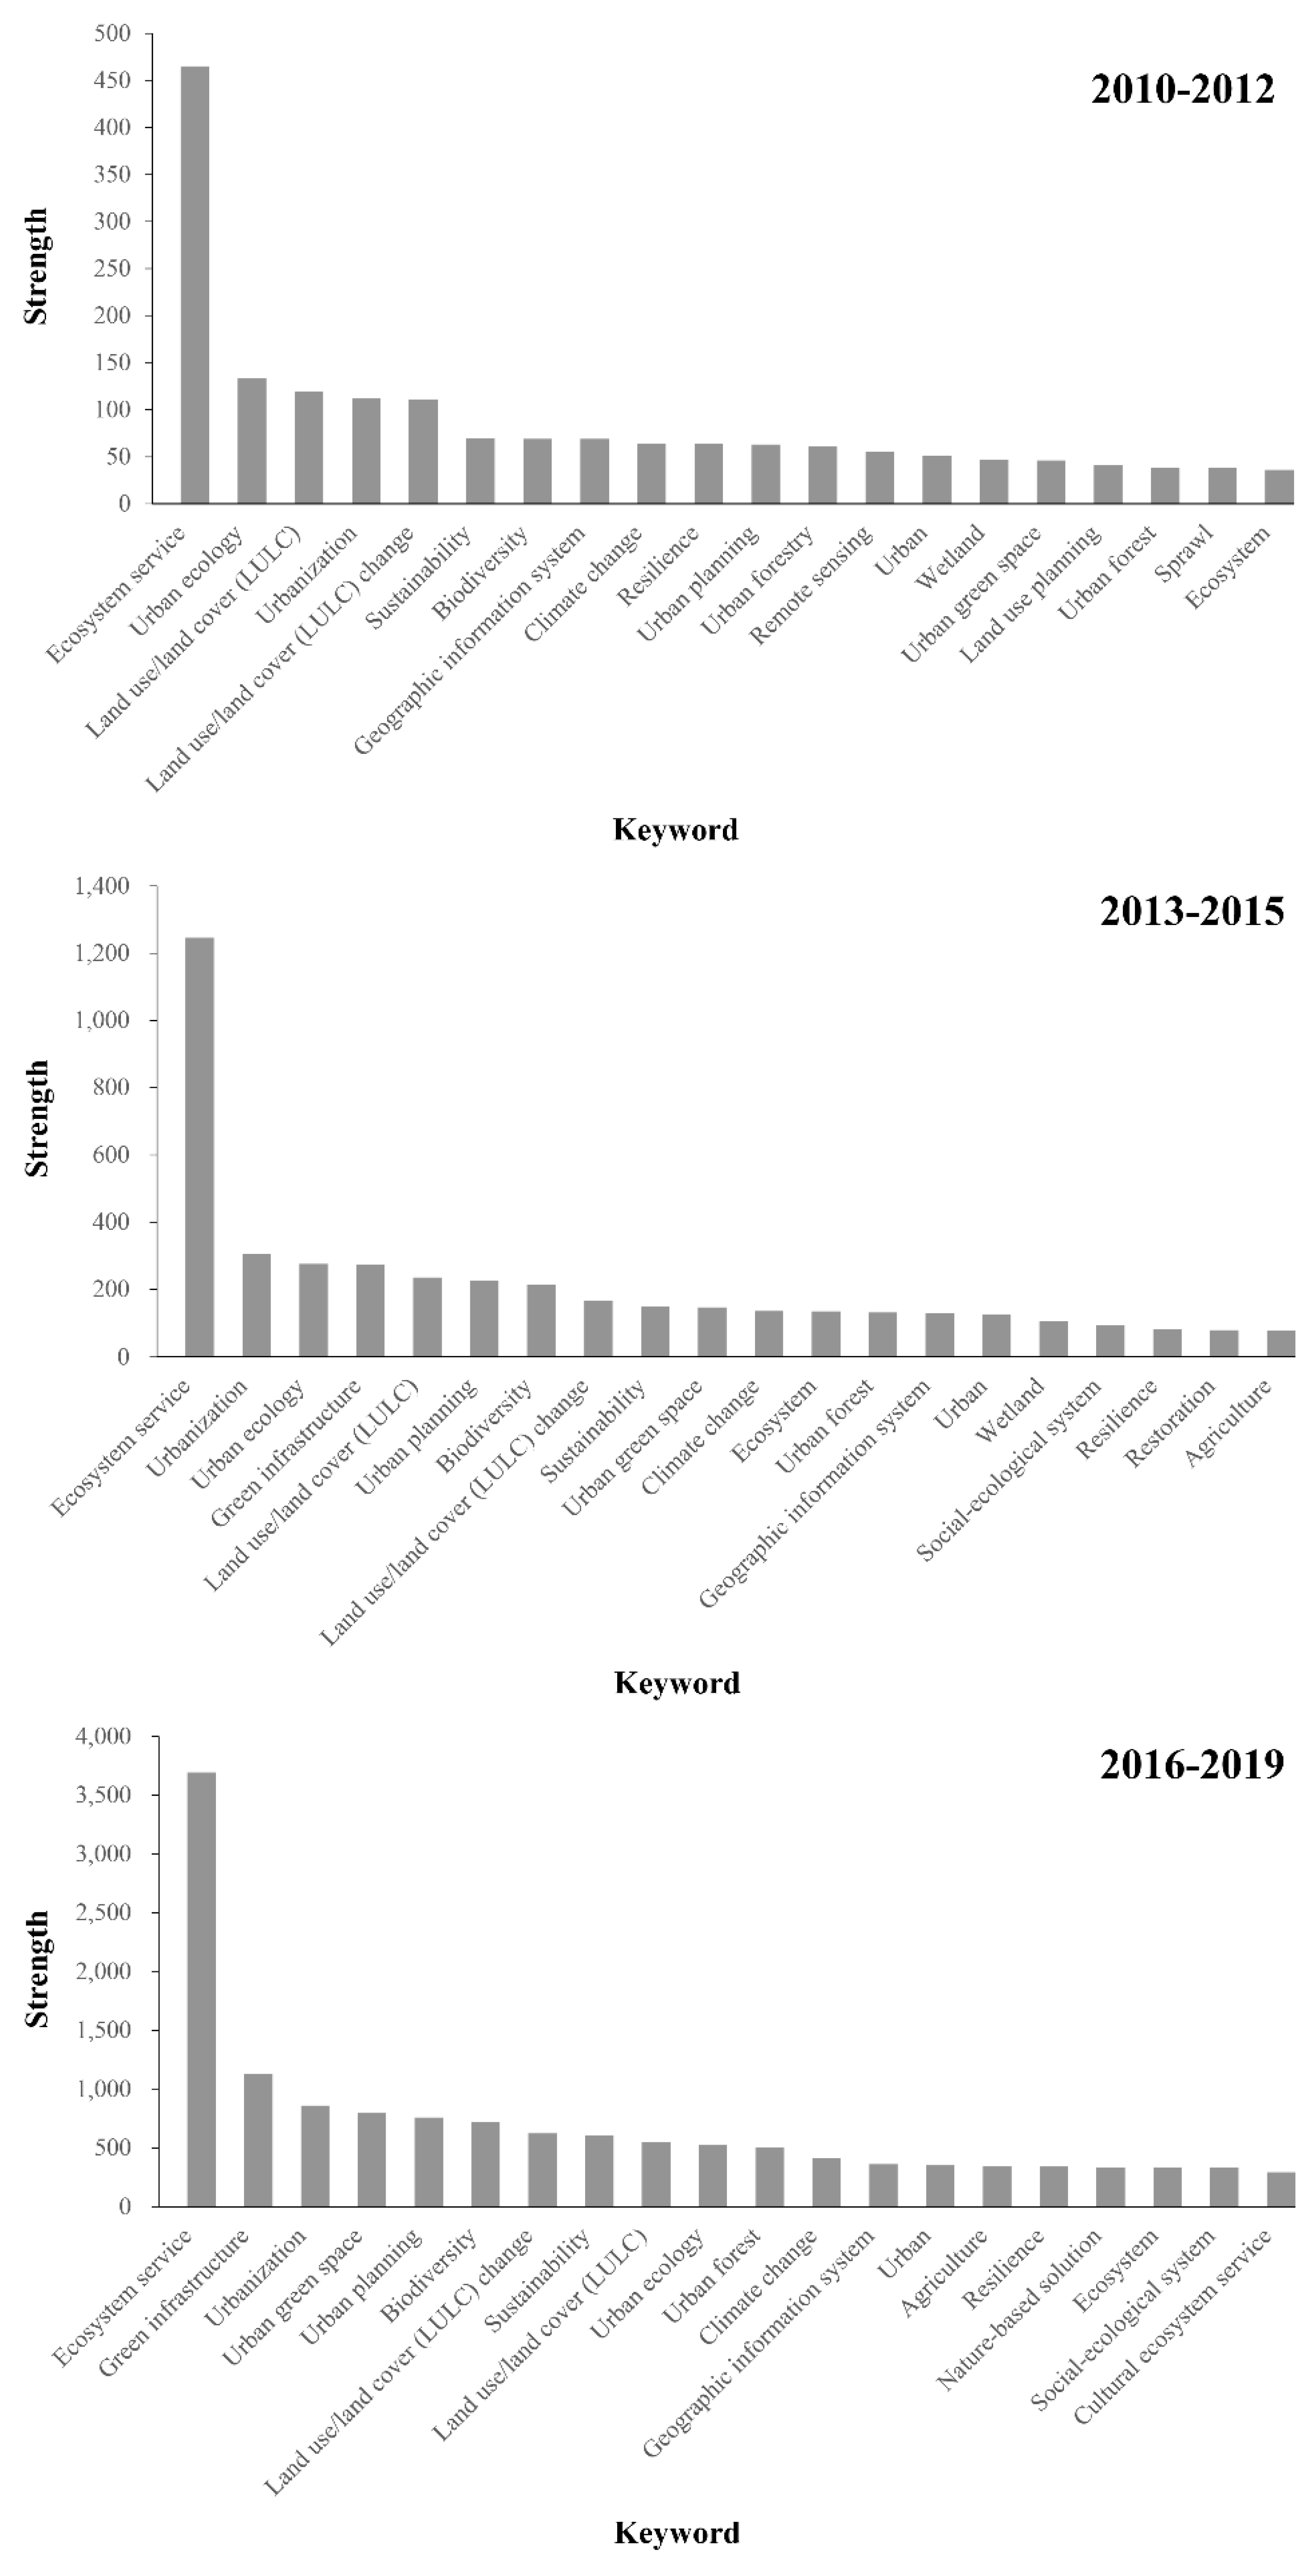
Figure 5 illustrates the top 20 keywords for each period by strength. Although most of the keywords in the bar graph of each time window remain constant, a few keywords such as “green infrastructure” and “nature-based solution” appear in the middle of the decade. Additionally, some of the keywords show slight changes in their ranks. For example, the occurrence of the term “urban ecology” tended to decrease gradually, whereas that of “urban planning” increased. “Urbanization”, “biodiversity” and “land use/land cover (LULC)” were found to be the most commonly discussed keywords in the UES literature in the 2010s. Considering that LULC is a subset or a methodological approach to examine urbanization, we further analyzed the characteristics of keyword clusters associated with the terms “urbanization” and “biodiversity”, as summarized in Table 2 and Table 3, respectively. Earlier in our manuscript, “urbanization” and “biodiversity” were discussed as the most critical social-ecological processes that may characterize UES literature. As shown in the results of our further in-depth cluster examination, the expansion and diversification of knowledge components were clearly observed, with a few common keywords often adopted to describe concepts in the UES literature.

4. Discussion and Conclusions

In our study, the KCN metrics were applied to analyze the research trends of UES literature in the 2010s from a knowledge structure and knowledge component standpoint. As the number of UES articles and keywords increased, both the knowledge components and structures of UES literature exhibited a gradual growth toward the end of the 2010s. Overall, our results demonstrated a scale-free strength distribution, indicating that the KCN of UES in the 2010s was dominated by a relatively small number of keywords.
The development and evolution of UES literature in the last decade was characterized by few keywords. It is therefore critical to clarify the significance and implication of those keywords, in terms of their definition and critical role in forming UES knowledge systems. We identified a list of the top 20 keywords for each time window based on the direction given by the previous study [20], which revealed that the term “urbanization” has steadily been mentioned throughout the evolution of UES research. Not surprisingly, many parts of the world are still being urbanized, which affects both the quantity and quality of ecosystem services at all scales in the 21st century [30,31]. Indeed, the central crisis of our time is to cope with the double-edged sword of urbanization [32]. In this regard, the concept of ecosystem services is, as it should be, in line with the concept of sustainable development, which seeks to preserve the ecosystem while improving the quality of human life [33]. In the context of UES, the application of the ES concept can be a breakthrough against the environmental and social pressures of urbanization [6].
Other keywords in the bar graph (i.e., Figure 5), including “sustainability”, “resilience”, “social-ecological system” and “nature-based solution”, can be interpreted as key concepts and visions of human efforts in association with UES. The gradual decrease of the term “urban ecology” over the studied years may imply that urban ecology approaches to UES have been replaced and have thus benefitted from broader social-ecological approaches, which has yielded several findings in the context of ecosystem stewardship in urban landscapes [8]. Moreover, “nature-based solution” first appears in the graph of the 2016–2019 period (i.e., the last time window studied herein). In a recent urban forestry review, the term “nature-based solution” was described as a snowballing concept that began to appear in 2015 and represents the social and political implications of urban forestry [34]. The emergence of the term “nature-based solution” in the mid-2010s was interpreted as the most recent attempt to embrace and acknowledge the intensification of urban environmental, socio-political and ecological challenges, whereas other terms sharing a similar root such as “urban forestry” and “green infrastructure” tend to focus on the spatial pattern of natural ecosystems [34]. Interestingly, our results indicated that the occurrence of the term “green infrastructure” exhibited the highest tendency to change over time, which might be further investigated in follow-up studies.
The terms “urban green space”, “green infrastructure” and “urban planning” can be interpreted to represent the current spatial-based approaches to achieve sustainability goals in cities. Other spatial-context-based keywords such as “land use and land cover (LULC)” also steadily appear as a top-ranked keyword throughout the three time windows examined herein, suggesting that this approach has been instrumental in UES research over time. Although such spatial approaches are known to be efficient for ES evaluation, their limitations in terms of delivering transferability and encouraging new empirical and field-based research are among the key challenges for future UES literature [12].
The vitality of urban ecosystems is dependent on the synergetic interplay of a wide range of economic, ecological, political and cultural factors, and conserving and planning urban forestry, i.e., urban green spaces and green infrastructure in urban areas, is critical for the preservation of biodiversity and human well-being [33,35,36,37]. Creating green spaces or green infrastructure is only the first step toward urban sustainability [36]. Urban green spaces are closely linked to public health and livability, social equality, ecological services, cultural exchange, economic enhancement, climate change mitigation and social-ecological resilience in cities and towns [35,37]. To sustain the benefits provided by urban green spaces, there is an urgent need to engage the people responsible for the development and maintenance of these spaces [8]. In this regard, cultural contexts in which people experience human–nature relations are particularly critical in urban landscapes, which are characterized by high population densities [12]. Therefore, the absence of keywords related to the social and public dimensions of UES approaches in our results highlights the challenges of future research in terms of stakeholder involvement and integrated research efforts.
Our study reveals that UES have an intrinsic relationship with urban forestry. Depending on their size, location and quality, they may have significant contributions towards improving eco-mobility, circulation, rainwater drainage, aeration and microclimatic conditions, which are discrete functions within urban city management [38]. Thus, policy planning for the development and management of urban forestry should involve intersectoral participation and mapping among local government agencies and be based on systems-oriented and sectorally integrated approaches to enhance social-ecological resilience and sustainability.
Owing to the importance of local social and cultural functions of urban forestry, it is imperative to focalize policy planning, participation and development and adopt a bottom-up approach or a citizen science approach [39], from the community and neighborhood levels to the urban subdistrict and city levels. This ensures that most of the benefits are well accepted and distributed locally, and it enhances the social-ecological resilience and sustainability of local communities. Policy planning, therefore, should be based on participative approaches that engage local stakeholders in the planning, design, development and, whenever possible, management of urban forestry [40].

Limitations and Future Research Directions

This study was based exclusively on author-specified keywords taken from UES-related publications and therefore identified as UES knowledge components. This suggests that the results obtained in our study may not necessarily apply to every UES-related publication. Moreover, given that our discussion focused on the top 20 keywords, we may have ignored the importance of other knowledge components. Nonetheless, we recommend the implementation of our analytical approach for future systematic review studies, as it effectively illustrated general knowledge trends and characteristics [20].
Policies for UES that drive long-term public and private investment in urban forestry need to account for evolving social and economic preferences for safer, greener, healthier and more sustainable living. The COVID-19 pandemic has highlighted the importance of local urban forestry and its contributions towards supporting human psychological and physiological well-being, diminishing the propensity of disease through natural aeration and providing spaces for safe congregation, aside from other well-studied ecological, social and cultural benefits. Policy for urban forestry planning should focus on both assimilating and cultivating the evolving societal preferences for more ecologically connected and socially conscious living. This means that the emphasis in research and policy-making should not be merely on biophysical and economic aspects and functions but also on normative aspects and functions, all while also incorporating the multidimensionality and intertemporality of sustainable urban development.

Author Contributions

W.K., J.C. and G.K. conceived and designed the analysis, and W.K. and G.K. performed and interpreted the analysis. W.K., J.C. and G.K. wrote the manuscript. All authors have read and agreed to the published version of the manuscript.

Funding

This work was supported by the National Research Foundation of Korea (NRF) grants funded by the Korea government (MSIT) (Nos. 2019R1F1A1064166 and NRF-2020R1I1A1A01073404).

Acknowledgments

We thank Rahul T. Vaswani for his contributions in providing insightful political implications of our findings.

Conflicts of Interest

The authors declare no conflict of interest. The founding sponsors had no role in the design of the study; in the collection, analyses, or interpretation of data; in the writing of the manuscript; or in the decision to publish the results.

References

  1. Elmqvist, T.; Fragkias, M.; Goodness, J.; Güneralp, B.; Marcotullio, P.J.; McDonald, R.I.; Parnell, S.; Schewenius, M.; Sendstad, M.; Seto, K.C.; et al. Urbanization, Biodiversity and Ecosystem Services: Challenges and Opportunities: A Global Assessment; Springer Nature: Dordrecht, The Netherlands, 2013; p. 755. [Google Scholar]
  2. Grimm, N.B.; Faeth, S.H.; Golubiewski, N.E.; Redman, C.L.; Wu, J.; Bai, X.; Briggs, J.M. Global change and the ecology of cities. Science 2008, 319, 756–760. [Google Scholar] [CrossRef] [PubMed] [Green Version]
  3. Gómez-Baggethun, E.; Gren, Å.; Barton, D.N.; Langemeyer, J.; McPhearson, T.; O’Farrell, P.; Andersson, E.; Hamstead, Z.; Kremer, P. Urban Ecosystem Services. In Urbanization, Biodiversity and Ecosystem Services: Challenges and Opportunities: A Global Assessment; Elmqvist, T., Fragkias, M., Goodness, J., Güneralp, B., Marcotullio, P.J., McDonald, R.I., Parnell, S., Schewenius, M., Sendstad, M., Seto, K.C., et al., Eds.; Springer: Dordrecht, The Netherlands, 2013; pp. 175–251. [Google Scholar]
  4. Seto, K.C.; Fragkias, M.; Güneralp, B.; Reilly, M.K. A meta-analysis of global urban land expansion. PLoS ONE 2011, 6, e23777. [Google Scholar] [CrossRef] [PubMed]
  5. Rockström, J.; Steffen, W.; Noone, K.; Persson, Å.; Chapin, F.S.; Lambin, E.F.; Lenton, T.M.; Scheffer, M.; Folke, C.; Schellnhuber, H.J. A safe operating space for humanity. Nature 2009, 461, 472–475. [Google Scholar] [CrossRef] [PubMed]
  6. Elmqvist, T.; Andersson, E.; Frantzeskaki, N.; McPhearson, T.; Olsson, P.; Gaffney, O.; Takeuchi, K.; Folke, C. Sustainability and resilience for transformation in the urban century. Nat. Sustain. 2019, 2, 267–273. [Google Scholar] [CrossRef]
  7. Goddard, M.A.; Dougill, A.J.; Benton, T.G. Scaling up from gardens: Biodiversity conservation in urban environments. Trends Ecol. Evol. 2010, 25, 90–98. [Google Scholar] [CrossRef] [PubMed]
  8. Andersson, E.; Barthel, S.; Borgström, S.; Colding, J.; Elmqvist, T.; Folke, C.; Gren, Å. Reconnecting Cities to the Biosphere: Stewardship of Green Infrastructure and Urban Ecosystem Services. AMBIO 2014, 43, 445–453. [Google Scholar] [CrossRef] [Green Version]
  9. TEEB. The Economics of Ecosystems and Biodiversity: Mainstreaming the Economics of Nature: A Synthesis of the Approach, Conclusions and Recommendations of TEEB. 2010. Available online: www.teebweb.org (accessed on 6 July 2020).
  10. Haase, D.; Frantzeskaki, N.; Elmqvist, T. Ecosystem Services in Urban Landscapes: Practical Applications and Governance Implications. AMBIO 2014, 43, 407–412. [Google Scholar] [CrossRef]
  11. Haase, D.; Larondelle, N.; Andersson, E.; Artmann, M.; Borgström, S.; Breuste, J.; Gomez-Baggethun, E.; Gren, Å.; Hamstead, Z.; Hansen, R.; et al. A Quantitative Review of Urban Ecosystem Service Assessments: Concepts, Models, and Implementation. AMBIO 2014, 43, 413–433. [Google Scholar] [CrossRef] [Green Version]
  12. Kremer, P.; Hamstead, Z.; Haase, D.; McPhearson, T.; Frantzeskaki, N.; Andersson, E.; Kabisch, N.; Larondelle, N.; Rall, E.L.; Voigt, A. Key insights for the future of urban ecosystem services research. Ecol. Soc. 2016, 21, 29. [Google Scholar] [CrossRef] [Green Version]
  13. Luederitz, C.; Brink, E.; Gralla, F.; Hermelingmeier, V.; Meyer, M.; Niven, L.; Panzer, L.; Partelow, S.; Rau, A.-L.; Sasaki, R. A review of urban ecosystem services: Six key challenges for future research. Ecosyst. Serv. 2015, 14, 98–112. [Google Scholar] [CrossRef] [Green Version]
  14. Cortinovis, C.; Geneletti, D. Ecosystem services in urban plans: What is there, and what is still needed for better decisions. Land Use Policy 2018, 70, 298–312. [Google Scholar] [CrossRef]
  15. Schwarz, N.; Moretti, M.; Bugalho, M.N.; Davies, Z.G.; Haase, D.; Hack, J.; Hof, A.; Melero, Y.; Pett, T.J.; Knapp, S. Understanding biodiversity-ecosystem service relationships in urban areas: A comprehensive literature review. Ecosyst. Serv. 2017, 27, 161–171. [Google Scholar] [CrossRef] [Green Version]
  16. Nesbitt, L.; Hotte, N.; Barron, S.; Cowan, J.; Sheppard, S.R.J. The social and economic value of cultural ecosystem services provided by urban forests in North America: A review and suggestions for future research. Urban Urban Green 2017, 25, 103–111. [Google Scholar] [CrossRef]
  17. Alavipanah, S.; Haase, D.; Lakes, T.; Qureshi, S. Integrating the third dimension into the concept of urban ecosystem services: A review. Ecol. Indic. 2017, 72, 374–398. [Google Scholar] [CrossRef]
  18. Ziter, C. The biodiversity–ecosystem service relationship in urban areas: A quantitative review. Oikos 2016, 125, 761–768. [Google Scholar] [CrossRef]
  19. Chakraborty, I.; Maity, P. COVID-19 outbreak: Migration, effects on society, global environment and prevention. Sci. Total Environ. 2020, 728, 138882. [Google Scholar] [CrossRef] [PubMed]
  20. Radhakrishnan, S.; Erbis, S.; Isaacs, J.A.; Kamarthi, S. Novel keyword co-occurrence network-based methods to foster systematic reviews of scientific literature. PLoS ONE 2017, 12, e0172778. [Google Scholar]
  21. R Core Team. R: A Language and Environment for Statistical Computing; R Foundation for Statistical Computing: Vienna, Austria, 2018; Available online: http://www.R-project.org/ (accessed on 3 June 2020).
  22. Van Eck, N.J.; Waltman, L. VOSviewer Manual: Version 1.6.15. 2020. Available online: https://www.vosviewer.com/documentation/Manual_VOSviewer_1.6.15.pdf (accessed on 6 July 2020).
  23. Press, W.H.; Teukolsky, S.A.; Vetterling, W.T.; Flannery, B.P. Numerical Recipes in C: The Art of Scientific Computing, 2nd ed.; Cambridge University Press: Cambridge, UK, 1992. [Google Scholar]
  24. Csardi, G.; Nepusz, T. The igraph software package for complex network research. Interjournal Complex Syst. 2006, 1695, 1–9. [Google Scholar]
  25. Gillespie, C.S. Fitting heavy tailed distributions: The poweRlaw package. J. Stat. Softw. 2015, 64, 1–16. [Google Scholar] [CrossRef]
  26. Waltman, L.; van Eck, N.J.; Noyons, E.C.M. A unified approach to mapping and clustering of bibliometric networks. J. Inf. 2010, 4, 629–635. [Google Scholar] [CrossRef] [Green Version]
  27. Clauset, A.; Newman, M.E.J.; Moore, C. Finding community structure in very large networks. Phys. Rev. E 2004, 70, 066111. [Google Scholar] [CrossRef] [Green Version]
  28. Newman, M.; Girvan, M. Finding and evaluating community structure in networks. Phys. Rev. E 2004, 69, 026113. [Google Scholar] [CrossRef] [PubMed] [Green Version]
  29. Wuchty, S. Scale-free behavior in protein domain networks. Mol. Biol. Evol. 2001, 18, 1694–1702. [Google Scholar] [CrossRef] [PubMed] [Green Version]
  30. Olivier, T.; Thébault, E.; Elias, M.; Fontaine, B.; Fontaine, C. Urbanization and agricultural intensification destabilize animal communities differently than diversity loss. Nat. Commun. 2020, 11, 1–9. [Google Scholar] [CrossRef] [PubMed]
  31. Wang, J.; Zhou, W.; Pickett, S.T.A.; Yu, W.; Li, W. A multiscale analysis of urbanization effects on ecosystem services supply in an urban megaregion. Sci. Total Environ. 2019, 662, 824–833. [Google Scholar] [CrossRef] [PubMed]
  32. Florida, R. The New Urban Crisis: How Our Cities Are Increasing Inequality, Deepening Segregation, and Failing the Middle Class—And What We Can Do about It; Basic Books: New York, NY, USA, 2017. [Google Scholar]
  33. Bennett, E.M.; Cramer, W.; Begossi, A.; Cundill, G.; Díaz, S.; Egoh, B.N.; Geijzendorffer, I.R.; Krug, C.B.; Lavorel, S.; Lazos, E. Linking biodiversity, ecosystem services, and human well-being: Three challenges for designing research for sustainability. Curr. Opin. Environ. Sustain. 2015, 14, 76–85. [Google Scholar] [CrossRef]
  34. Escobedo, F.J.; Giannico, V.; Jim, C.Y.; Sanesi, G.; Lafortezza, R. Urban forests, ecosystem services, green infrastructure and nature-based solutions: Nexus or evolving metaphors? Urban For. Urban Green. 2019, 37, 3–12. [Google Scholar] [CrossRef]
  35. Coutts, C.; Hahn, M. Green infrastructure, ecosystem services, and human health. Int. J. Environ. Res. Public Health 2015, 12, 9768–9798. [Google Scholar] [CrossRef] [Green Version]
  36. Hostetler, M.; Allen, W.; Meurk, C. Conserving urban biodiversity? Creating green infrastructure is only the first step. Landsc. Urban Plan. 2011, 100, 369–371. [Google Scholar] [CrossRef]
  37. Tzoulas, K.; Korpela, K.; Venn, S.; Yli-Pelkonen, V.; Kaźmierczak, A.; Niemela, J.; James, P. Promoting ecosystem and human health in urban areas using Green Infrastructure: A literature review. Landsc. Urban Plan. 2007, 81, 167–178. [Google Scholar] [CrossRef] [Green Version]
  38. Vargas-Hernández, J.G.; Pallagst, K.; Zdunek-Wielgołaska, J. Urban green spaces as a component of an ecosystem. In Handbook of Engaged Sustainability; Dhiman, S., Marques, J., Eds.; Springer: Cham, Switzerland, 2018; pp. 885–916. [Google Scholar]
  39. Francis, R.A.; Lorimer, J. Urban reconciliation ecology: The potential of living roofs and walls. J. Environ. Manag. 2011, 92, 1429–1437. [Google Scholar] [CrossRef] [PubMed]
  40. Amado, M.; Santos, C.; Moura, E.; Silva, V. Public participation in sustainable urban planning. Int. J. Hum. Soc. Sci. 2010, 5, 102–108. [Google Scholar]
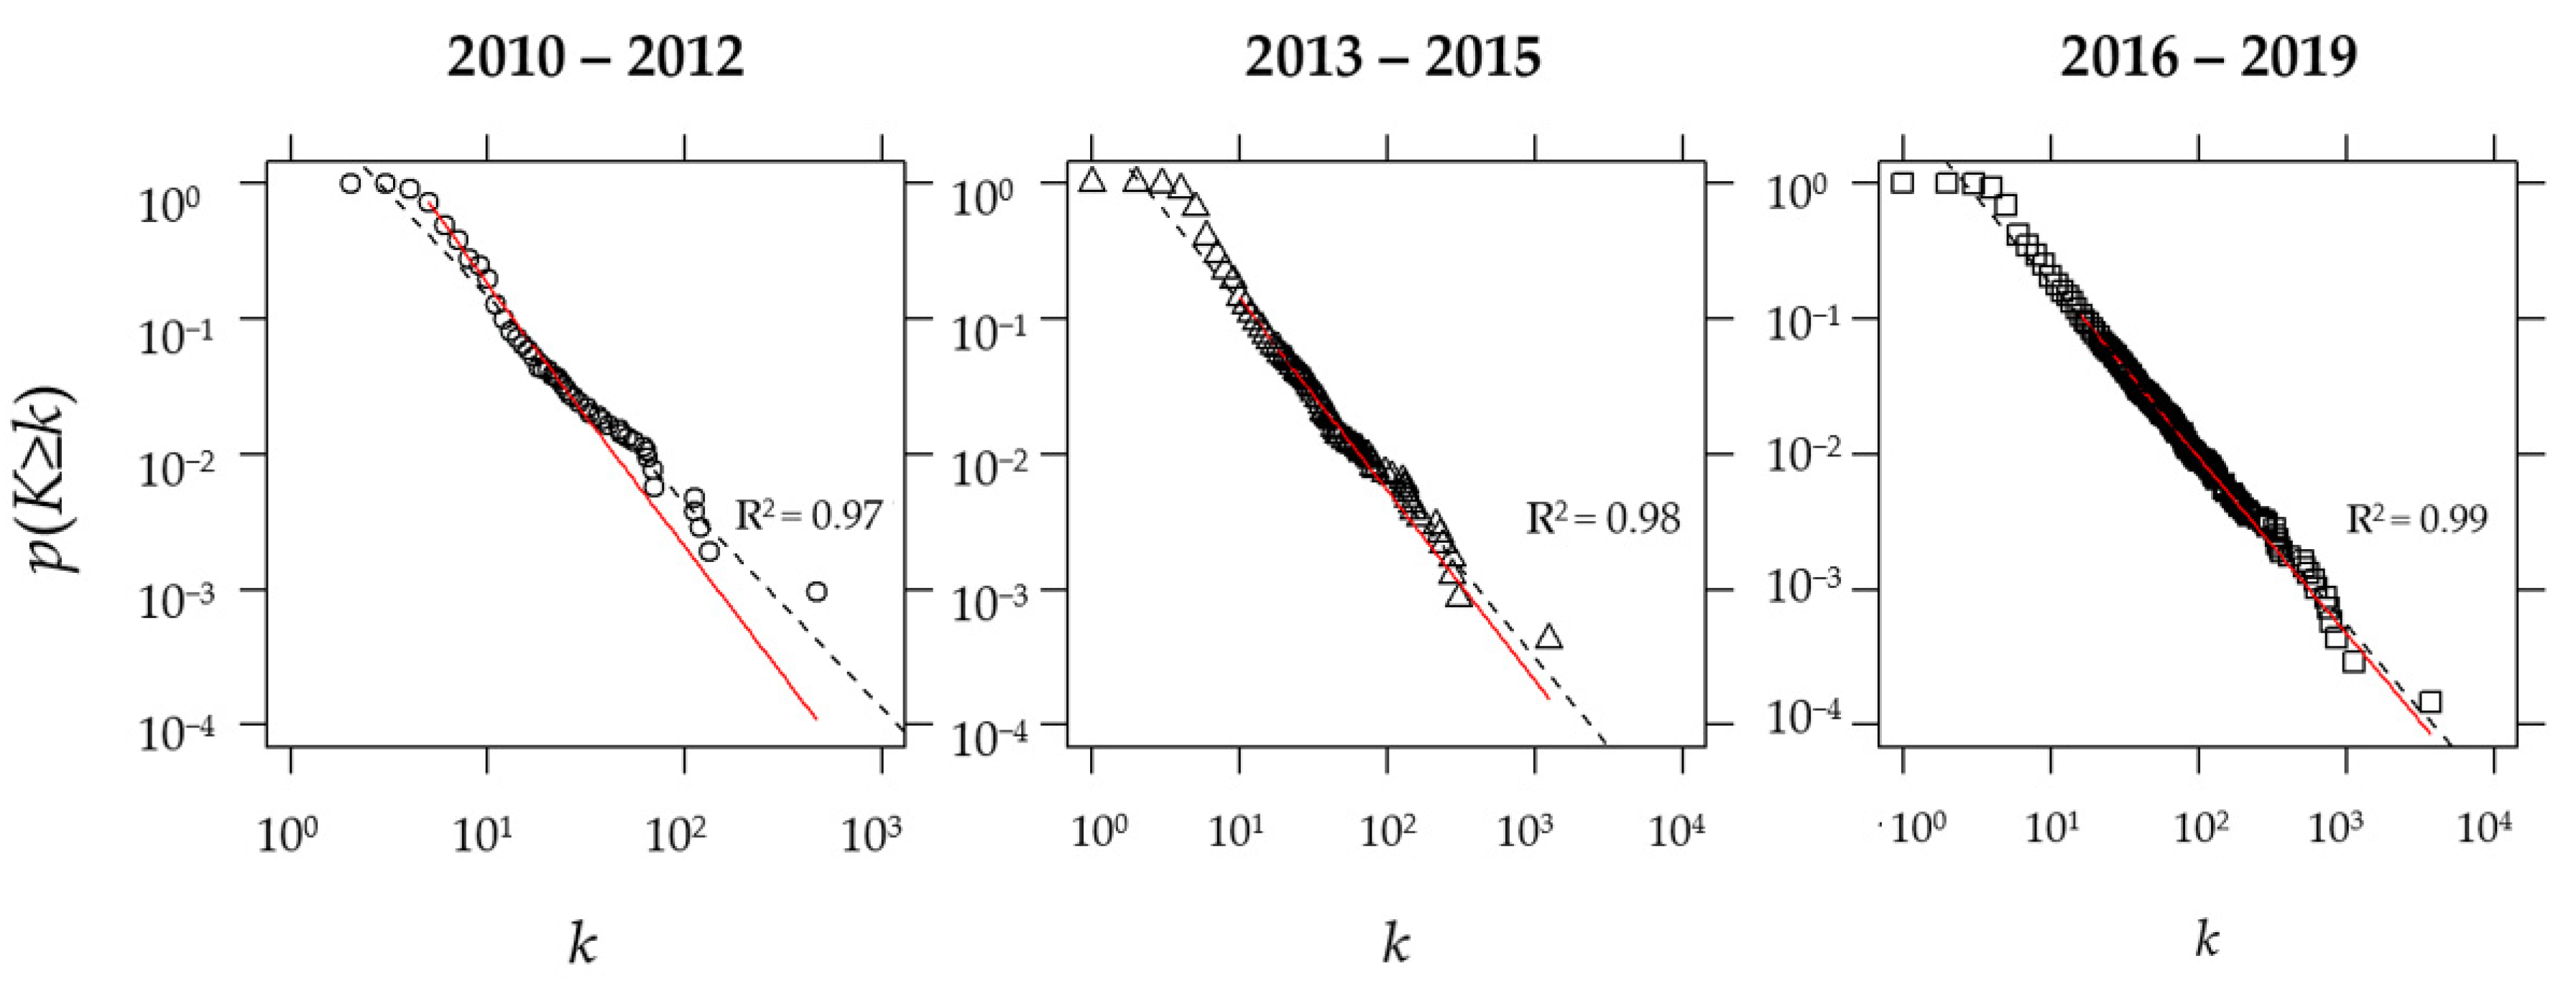
Figure 1. Complementary cumulative distribution function of the keyword co-occurrence networks. The solid line (strength k) indicates a power-law fit, with x-min values of 5 for 2010–2012, 10 for 2013–2015 and 16 for 2016–2019, where power-law fit is best. The dashed line represents the least-squares power-law fit of all empirical data (with R2).
Sustainability 12 09839 g001
Figure 2. Visualization of keyword co-occurrence network including pairs of keywords for the 2010–2012 period. With the minimum number of co-occurrences set to five, a total of 33 keywords out of the sample of 1045 keywords and six clusters are shown. The node size refers to the total number of co-occurring keywords (i.e., strength), while node color and line thickness refer to clustering and link strength, respectively.
Sustainability 12 09839 g002
Figure 3. Visualization of keyword co-occurrence network for the 2013–2015 period. With the minimum number of co-occurrences set to five, a total of 103 keywords out of the sample of 2350 keywords and nine clusters are shown. The node size refers to the total number of co-occurring keywords (i.e., strength), while node color and line thickness refer to clustering and link strength, respectively.
Sustainability 12 09839 g003
Figure 4. Visualization of keyword co-occurrence network for the 2016–2019 period. With the minimum number of co-occurrences set to five, a total of 421 keywords out of the sample of 6852 keywords and 12 clusters are shown. The node size refers to the total number of co-occurring keywords (i.e., strength), while node color and line thickness refer to clustering and link strength, respectively.
Sustainability 12 09839 g004
Figure 5. Top 20 keywords by strength as per three time windows.
Sustainability 12 09839 g005
Table 1. Statistical testing measures of power-law fit of the KCNs’ distribution for three time periods with R packages “igraph” and “poweRlaw”. The connectivity distribution values were calculated using strength centrality measure. The exponent represents the scaling parameter of power-law distributions, the log likelihood represents the likelihood estimation of the fitted parameters and the KS statistic represents the distance of the input vector from a fitted distribution.
Time Period“igraph”“poweRlaw”
ExponentxminLog LikelihoodKS Statisticp-ValueExponentxminKS Statistic
2010–20122.899595−1839.970.038730.2012.9000950.03882
2013–20152.4006310−1230.890.026450.9722.40065100.02644
2016–20192.3000116−3092.620.017690.9772.30038160.01762
Table 2. List of keywords clustered with “urbanization” in the urban ecosystem services literature.
Time PeriodKeywords
2010–2012ecosystem service value, land use/land cover (LULC) change, urban ecology, urbanization
2013–2015benefit transfer, China, contingent valuation, ecosystem service value, fragmentation, land use planning, land use/land cover, payment for ecosystem services, peri-urban, remote sensing, social-ecological system, urban forest, urban metabolism, urbanization, watershed
2016–2019AHP, bee, biological invasion, Brazil, carbon, climate regulation, coastal management, community assembly, ecosystem function, ecosystem service valuation, eutrophication, fragmentation, green roof, home garden, landscape change, lawn, management, natural resource, nitrogen, pesticides, phosphorus, plant diversity, pollination, seed dispersal, soil, spatial analysis, species distribution modelling, technosol, urban ecology, urban invasions, urbanization, urbanization gradient
Table 3. List of keywords clustered with “biodiversity” in the urban ecosystem services context.
Time PeriodKeywords
2010–2012biodiversity, city, climate change, resilience, scale, sustainability, urban, urban metabolism
2013–2015biodiversity, garden, landscape, management, perception, soil, sustainable development, urban ecology, urban green space, urban park
2016–2019Beijing, benefits, biocultural diversity, biodiversity, biodiversity conservation, cultural ecosystem service, deforestation, dynamics, ecological design, ecological restoration, environment, environmental indicator, environmental valuation, foraging, forest management, functional trait, geographical weighted regression, hedonic pricing, human activity, invasive species, peri-urban area, plant community, plant invasion, Poland, provision services, recreation, Singapore, soil diversity, spatial scale, transdisciplinary, urban green space, urban greenery, urban nature, urban park, wildness, woodland
Publisher’s Note: MDPI stays neutral with regard to jurisdictional claims in published maps and institutional affiliations.