Article

Spatial–Temporal Interaction Relationship between Ecosystem Services and Urbanization of Urban Agglomerations in the Transitional Zone of Three Natural Regions

1
College of Geography and Environment Science, Northwest Normal University, Lanzhou 730070, China
2
College of Marxism, Northwest Normal University, Lanzhou 730070, China
*
Authors to whom correspondence should be addressed.
Sustainability 2020, 12(23), 10211; https://doi.org/10.3390/su122310211
Submission received: 5 November 2020 / Revised: 4 December 2020 / Accepted: 4 December 2020 / Published: 7 December 2020
(This article belongs to the Special Issue Urban Sustainability Futures)

Abstract

:
Clarifying the spatial interaction relationship between urbanization and multiple ecosystem services (ESs) is a prerequisite for reducing the impact of urbanization on the ecological environment and coordinating urbanization and ecological environmental protection. Urbanization is especially significant for ecologically fragile areas, where ecosystems are particularly sensitive to changes in urban patterns. This study considered the Lan–Xi (LX) urban agglomeration in three natural transitional regions using socio-economic, ecological environment, and other data, through a variety of methods, to supersede administrative boundaries and to explore the relationship between urbanization and ESs on a grid scale. The results revealed a significant negative spatial correlation between the levels of urbanization and comprehensive ESs, indicating that rapid urbanization has led to a decline in regional ESs. However, with the rapid urbanization trend from 2010 to 2018, the ESs in the LX region showed an upward trend because the implementation of ecological protection and restoration projects greatly offset the decline in ESs caused by urban expansion. We found a positive correlation between nutrient purification and the levels of urbanization among various ESs and four principal types of spatial–temporal interactions between ESs and urbanization levels. Among them, the high–high cluster areas occupied the smallest proportion, and the low–low cluster areas occupied the largest proportion.

1. Introduction

Urbanization is one of the most important global social and economic phenomena and involves the transformation of population structure, economic structure, geographical space, and lifestyle between rural and urban areas [1]. The urbanization of various countries primarily involves two kinds of regional spatial processes. The first is the regional concentration process of population and non-agricultural activities in urban environments of different scales and the regional promotion process of transforming non-urban landscapes into urban landscapes. The second is the process of the geographical expansion of urban culture, urban lifestyle, and values in rural areas. In the modern world, the process of urbanization is greatly accelerated, and metropolitan areas are expanding. Metropolitan circles and urban agglomerations have become core areas of national development. Urbanization has made significant contributions to social progress and economic development but poses a serious threat to the health of non-urban ecosystems. Urban expansion has proven to be a driver of the damage to key health ecosystem services [2,3,4]. Since the 21st century, the ecological and environmental issues caused by global urbanization have become increasingly serious and received extensive attention from countries and related international organizations [5].
Since reform and opening up, urbanization in China has developed rapidly. The level of urbanization increased from 17.92% in 1978 to 60.6% in 2019, with an average annual growth rate of more than 1% [6]. The rapid development of urbanization has had a profound impact on the natural ecosystem and on human economic and social systems. Current issues include the rapidly increasing population [7,8], the acceleration of industrialization [8,9,10], and extensive economic growth, accompanied by the emergence of climate warming [11]; soil, air and water pollution [12]; loss of biodiversity [13]; disordered land use; unbalanced regional development; and other ecological environment and economic social issues. Rapid urbanization has seriously aggravated the pressure on the sustainable development of society and ecosystems [14], inevitably disrupting the structure and function of the original ecosystem, leading to the loss of ecosystem services (ESs) [15,16] and seriously restricting the process of healthy urbanization and the pace of aesthetic construction in China [17]. Reducing the impact of urbanization on the ecological environment and achieving sustainable development has become a global concern [18,19,20]. Understanding the interactive relationship between urbanization and ESs is a practical need to provide a scientific basis for coordinating regional ecological environmental protection and high-quality economic and social development for national strategic needs.
Interactions between urbanization and ESs are complex; urbanization is the primary driving force for ES change and processes [21,22], and ESs restrict the development of urbanization [23,24]. Coordinating urbanization and ESs is, therefore, at the forefront of Earth system science and sustainability research [25]. Many scholars worldwide have discussed the relationship between urbanization, global change, resources, and environment from the perspective of sustainable development on a global scale [26,27,28], exploring the interaction between urbanization and natural ecosystems and global change at different spatial scales [29,30,31]. For example, André Mascarenhas [32] explored the impact of population and urbanization development in the Lisbon Metropolitan Area on land occupation and ecosystem services, and the results show that each pattern can have both positive and negative effects on the supply of ecosystem services. Fernanda Coyado Reverte [33], taking the Taubaté Basin in Brazil as the research area, explored the impact of biodiversity in highly urbanized areas on ecosystem services. The results showed that anthropogenic action is the main factor that alters the availability of local services, with emphasis on the supply of water, soils, and mineral resources, and it potentially influences the quality of life of certain species. Akanksha Balha [34], predicting the impact of urbanization on water resources in the megacity of Delhi, proposed a road map to assess future water availability in various megacities across the globe. Robert Hoyer’s [35] assessment of freshwater ecosystem services in the Tualatin and Yamhill basins under climate change and urbanization showed that the estimated relative changes in ES provision under different climate and urbanization scenarios are valuable for land management decisions. Chinese scholars have primarily focused on the resources and environmental effects of urbanization [36,37], the coupling mechanism between urbanization and ecological environment [38], and the relationship between urbanization and the ecological environment (Ma et al., 2018), guided by new national urbanization development. For example, Liu [38] proposed a framework for the coupling mechanism between urbanization and the ecological environment called the Coupling Rubik’s Cube. Fang [39] reviewed the major progress made in urban agglomerations in China and constructed a theoretical framework and technical path for analyzing the interaction and coupling effects of urbanization and ecological environment in megacities. The research was concentrated in the Jingjinji urban agglomeration [40], the Yangtze River Delta urban agglomeration [41], the Pearl River Delta urban agglomeration [42], and other developed coastal urban agglomerations. However, each urban agglomeration has different conditions due to development history, resource and environmental endowments, and economic foundations. Large differences exist in the level of urbanization development, and urbanization and ecological environment issues are complex and diverse. Ecologically fragile areas, such as the transition zones of natural areas and the structure, function, and quality of the ecological environment of the ecosystem, are particularly sensitive to changes in urban patterns [43,44,45]. Clarifying the spatial interaction relationship between urbanization and multiple ESs is a prerequisite for scientifically understanding and coordinating urbanization and ecological environmental protection from the perspective of regional functions, realizing the healthy development of urbanization, and maximizing the benefits of ESs [46].
The transitional zones of natural regions are important regional ecosystems in China. The three natural regions, the Eastern Monsoon Region, the Northwest Arid and Semi-Arid Region, and the Qinghai–Tibet Alpine Region, are typical natural geographic regions divided according to factors such as topography, geological structure, and soil vegetation [47]. The topography, climate, hydrology, soil, vegetation, and other elements of these three natural regions have obvious transitional characteristics [48], making the relationship between urbanization and ESs specific and regional; temporal and spatial changes are also more complex. Here, the Lan–Xi (LX) urban agglomeration in the transitional zone of the natural region was used as an example to (1) quantitatively assess the level of development of key ecosystem services and urbanization development of the Lan–Xi urban agglomeration in 2010 and 2018 and spatially clarify the changing process of urbanization and ecosystem services; (2) reveal the spatial–temporal interaction relationship between urbanization and ESs in the LX urban agglomeration based on the grid scale, to explore the characteristics of urbanization and ecological environment evolution in the rapid urbanization areas in the upper reaches of the Yellow River; and (3) discuss suggestions for coordinating urban development and ecological protection in the future.

2. Materials and Methods
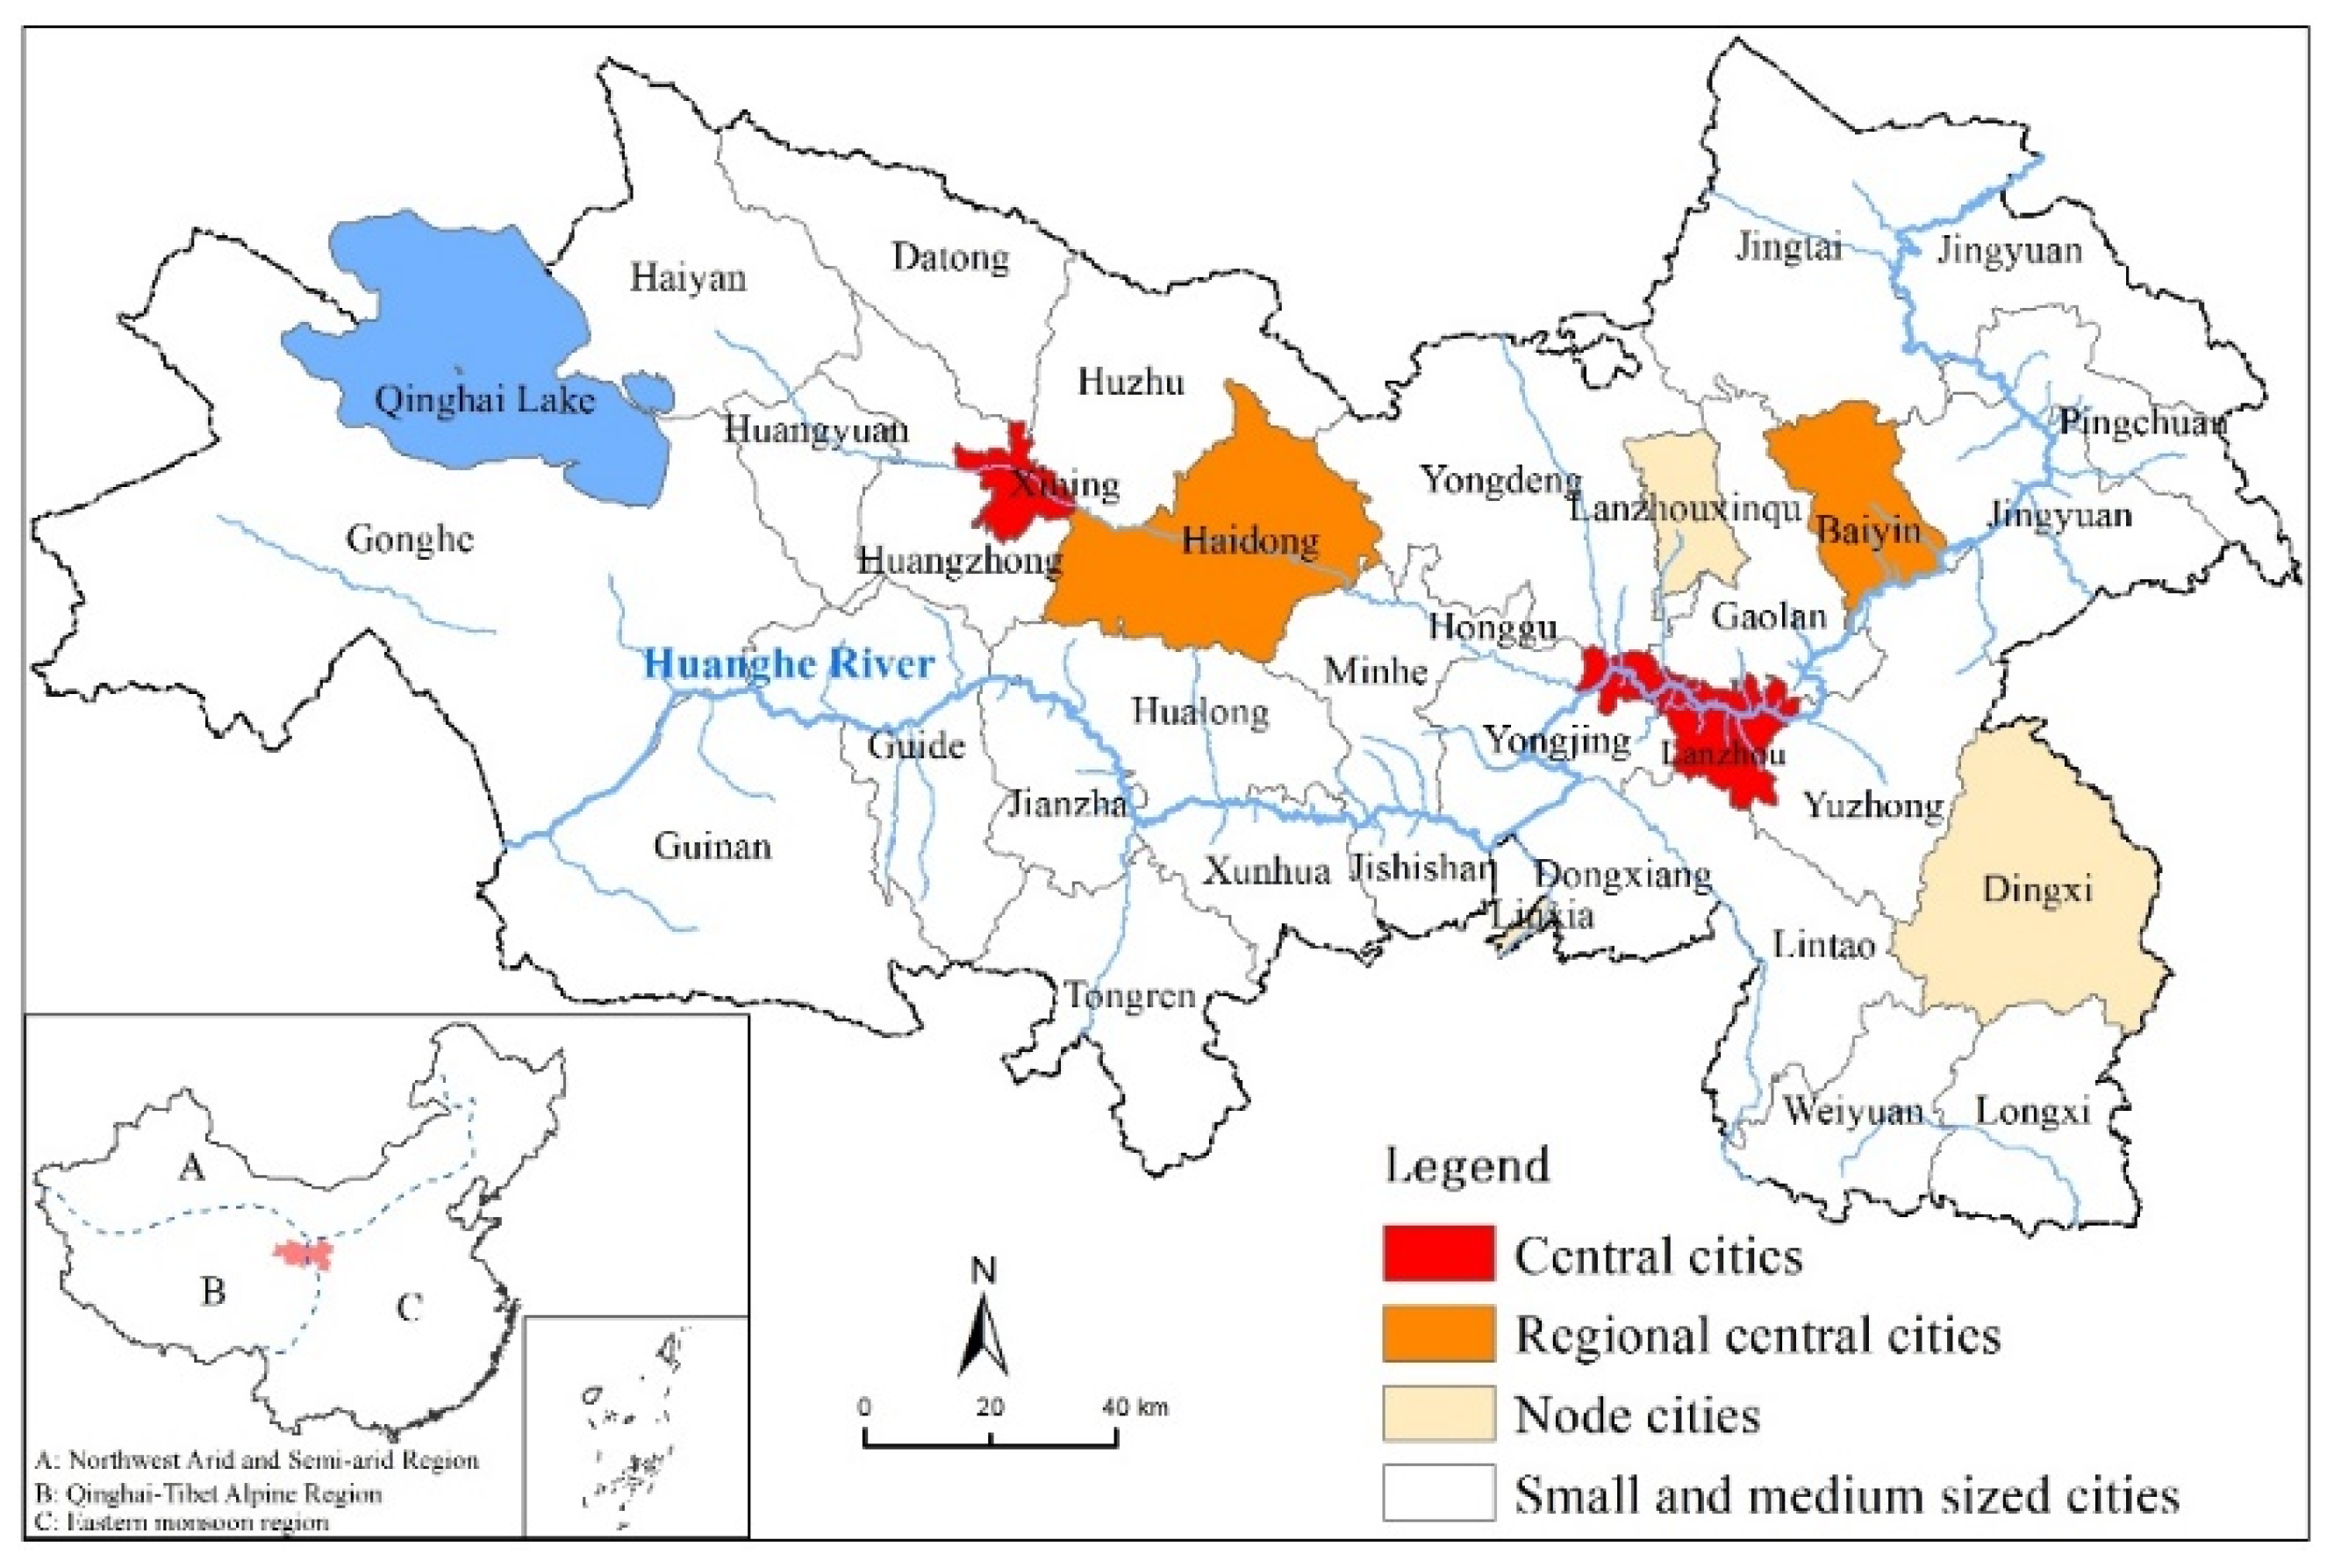
2.1. Study Area

The Lan–Xi (LX) urban agglomeration is in the upper reaches of the Yellow River, at the intersection of the Loess Plateau and the Qinghai–Tibet Plateau and the three natural areas. The special geographical location and natural conditions have formed a distinctive transitional geographical and ecological pattern from west to east. The LX urban agglomeration is an important inter-provincial urban agglomeration in Western China, with relatively dense populations and towns. In 2018, the total population of the region was 11,890,300; the population density was 122 people per km2, which was much higher than the average of the Gansu and Qinghai provinces and the western region; and the region primarily includes 39 counties, with a total area of 97,500 km2. According to the scale structure, the city is divided into central cities, regional central cities, node cities, and small and medium-sized cities (Figure 1). The level of urbanization in the LX urban agglomeration is generally low, with large spatial differences. The urbanization rate increased from 27.83% in 2000 to 61.24% in 2018—slightly higher than the national average of 59.58%. However, with rapid economic development and the continuous acceleration of urbanization, resource and environmental constraints are also increasingly intensified.

2.2. Data Sources and Preparation

The principal data used in this study consisted of the following types and came from several sources (Table 1): (1) Land use data for 2010 and 2018 were obtained from the Resource and Environment data center of the Chinese Academy of Sciences (Resolution 30m, http://www.resdc.CN). (2) Meteorological data were obtained from the China Meteorological Science Data Sharing Service Network; daily data such as temperature, precipitation, relative humidity, wind speed, and sunshine duration were the average of the three years before and after the study period. (3) Soil data were obtained from the World Soil Database (Resolution 1000m, http://www.fao.org/). (4) The digital elevation model (DEM) was downloaded from the United States Geological Survey (USGS) website (ASTER GDEM Resolution 30 m, https://www.usgs.gov/). (5) The economic and social statistical data for 2010 and 2018 were obtained from the Statistical Yearbook of Gansu Province and the Statistical Yearbook of Qinghai Province. After considering land use and the night light index, the population density and GDP density data were downscaled to a 100 × 100 m grid by interpolation. CGCS2000 coordinates were used for spatial data with a resolution of 100 m.

2.3. Methods

2.3.1. Analysis of Spatial–Temporal Interaction Relationships

This study used exploratory spatial data analysis methods to analyze the spatial relationship between urbanization and ESs. The spatial association pattern was measured and tested using the global bivariate Moran’s I index and local bivariate Moran’s I index (Local indicators of spatial association, LISA) [49]. The global bivariate Moran’s I index was used to test for spatial correlation between ESs and urbanization, and the degree of correlation. The local bivariate Moran’s I was used to explore the spatial–temporal relationship between ESs and urbanization based on a grid scale. The global Moran’s I index values range from −1 to 1. Values greater than 0 indicate that the data are spatially positively correlated, and larger values are more significantly correlated. Values less than 0 indicate that the data are negatively correlated, and larger values indicate greater spatial variability. A value of 0 indicates random space. The calculation formula is as follows [50]:
I eu = N i N j i N W i j z i e z j u ( N 1 ) i N j i N W i j
I eu = z i e j = i N W i j z i j u
where I eu is the global bivariate Moran’s I index, I eu is the local bivariate Moran’s I index, W i j is an n × n spatial weight matrix, z i e is the standardized value of ESs of grid i, and z j u is the standardized value of the urbanization level of grid j.

2.3.2. Accounting for ESs

Current ES accounting methods primarily include the value equivalent, the NPP (Net Primary Productivity) quantitative index, and the model calculation methods. In comparison, the InVEST model overcomes the unintuitive problem caused by the abstract expression of text and can visualize the evaluation result space. Therefore, the InVEST model—comprising a set of models—is recognized by most scholars and is widely used to evaluate the ESs of the LX urban agglomeration. Four sub-modules of water yield, sediment delivery ratio, nutrient delivery ratio, and carbon storage and sequestration were chosen for this study to evaluate various ESs. Owing to space limitations, the calculation method of each module is shown in reference [51].

2.3.3. Measurement of Urbanization Level

Urbanization is a complex system that includes historical processes of social productivity development, technological progress, and industrial structure adjustment [52,53,54]. Urbanization reflects changes in multiple systems, such as regional population, economy, society, and environment [55]. Based on the research results of the level of recent urbanization development and the development characteristics and data availability of the study area, this study chose population density, economic density, and proportion of construction land to comprehensively measure the level of urbanization from the perspective of population, economic, and land urbanization. On this basis, the range standardization method was used to standardize the abovementioned indicators on the grid scale, and the comprehensive urbanization level index was obtained by equal weight weighted calculation. The formula is as follows:
X i j = X i j X i min X i max X i min
where X i j is the original value of the urbanization index i and grid j, and X i j is the normalized value of X i j . X i max and are X i min the maximum and minimum values of the urbanization index i in the study area, respectively.

3. Results

3.1. Spatial–Temporal Characteristics of ESs

From 2010 to 2018, all types of ESs in the LX urban agglomeration showed an upward trend (Table 2). Among them, sediment retention and amount of carbon stored experienced the largest (151.56%) and smallest (5.82%) increases, respectively. Water yield and nutrient purification increased by more than 15%.
The overall distribution pattern of the four types of ESs in the LX urban agglomeration in 2018 was consistent with that of 2010, but the spatial distribution of various services was significantly different (Figure 2). Of these, water yield was higher in the southwest and lower in the east. High-value areas were primarily concentrated in the Qinghai–Tibet Plateau in the southwestern portion of the LX urban agglomeration, such as in Guinan, Gonghe, Jianzha, Tongren, and other counties. The region has good natural background conditions, high vegetation coverage, and abundant rainfall. The maximum water yields per unit area in 2010 and 2018 were 487.28 and 828.41 mm/ha, respectively. The overall soil retention was higher in the central part and lower in the east and west. In comparison, the amount of sediment retention per unit area was much greater in 2018 than in 2010; this was closely related to the continued advancement of returning farmland to forest, returning grazing to grassland, and other ecological protection and restoration projects. Nutrient purification was consistent with the farmland distribution pattern, trending high in the southeast and low in other regions. In the southeast (i.e., Weiyuan County, Longxi County, and Lintao County), the proportion of farmland was relatively large, the natural background conditions were ordinary, and agricultural non-point-source pollution was relatively large, resulting in a large amount of nutrient purification of 17.67 kg/ha/year from 2010 to 2018. The spatial distribution pattern of high-value carbon stored areas was consistent with the distribution of forestland, and the maximum carbon stored per unit area was 430 t/ha.
The ESs of central regional towns were the least affected by rapid urbanization, and the ESs of node towns were relatively low. In comparison, the levels of urbanization in small and medium towns were not high, but the ESs were relatively high.

3.2. Spatial–Temporal Characteristics of Urbanization Level

The spatial distribution of urbanization levels of the LX urban agglomeration in 2018 and 2010 was basically the same, whereas the spatial distribution of urbanization levels within the region was significantly different (Figure 3). The central cities of Lanzhou City (including Chengguan District, Qilihe District, and Anning District) and Xining City (including Chengzhong District, Chengdong District, Chengxi District, and Chengbei District) had the highest levels of urbanization. The urbanization level index increased from 0.31 to 0.39 from 2010 to 2018 (an increase of 25.81%). The urbanization level index of regional central cities increased from 0.021 to 0.023 from 2010 to 2018 (an increase of 9.52%). Among the node cities, the urbanization level of Lanzhou New District and Linxia City was relatively high. The urbanization level of the Lanzhou area increased from 0.02 to 0.09 from 2010 to 2018 (an increase of 350%), which was consistent with the establishment and development of the Lanzhou New District. In 2012, the State Council approved the establishment of the Lanzhou New District. Since then, the Lanzhou New District has used its location advantages and resource conditions to accelerate the process of new urbanization. Linxia City is affiliated with the Linxia Hui Autonomous Prefecture, which enjoys policy advantages in ethnic areas and relatively high levels of urbanization. The urbanization level indexes increased from 0.27 to 0.29 from 2010 to 2018. The levels of urbanization in other small and medium-sized cities and towns were relatively low due to the combined effects of factors such as topography, landform, and location.

3.3. Spatial–Temporal Interaction Relationship between Urbanization and ESs

GeoDa software was used to measure the global bivariate Moran’s I index between ESs and the levels of urbanization in 2010 and 2018 based on the grid scale (Table 3). The global bivariate Moran’s I index of comprehensive ESs and the urbanization level of the LX urban agglomeration in 2010 and 2018 were −0.082 and −0.90, respectively. During the study period, there was a significant negative spatial correlation between the level of urbanization and comprehensive ESs, indicating that rapid urbanization decreased ESs in the study area. All ESs services—except for nutrient purification, which was positively correlated—had significant negative correlations with the level of urbanization. The impact of urbanization levels in the study area on water yield and sediment retention were relatively stable, but the impact on carbon storage increased. The Moran’s I index for the levels of urbanization and carbon stored in 2010 and 2018 was −0.056 and −0.1, respectively. Overall, there was a negative correlation between ESs and the level of urbanization, and the degrees of negative correlation between various ESs and the levels of urbanization were heterogeneous.
Through local bivariate Moran’s I index analysis, the spatial correlation between ESs and the level of urbanization could be divided into four types: high–high cluster areas, high–low cluster areas, low–low cluster areas, and low–high cluster areas. The spatial distribution characteristics of the local correlations between various ESs and the level of urbanization were similar (Figure 4). Comparing the LISA aggregation maps of the comprehensive ESs and the level of urbanization in 2010 and 2018 revealed consistent spatial distribution characteristics. Specifically: (1) High–high cluster areas are primarily distributed in Xining City, Datong County, Huangzhong County, Huangyuan County, Huzhu County in the Qinghai portion of the LX urban agglomeration, and Linxia City, Jishishan County, Weiyuan, and Longxi County in the Gansu region, all of which have relatively high urbanization levels and good ESs. In 2010 and 2018, the high–high areas accounted for 3.21% and 2.14% of the total area of the study area, respectively. (2) The high–low cluster areas are primarily concentrated in the northern portion of Gansu in the LX urban agglomeration, dominated by Baiyin City and belonging to the transition zone from the Tengger Desert and the Qilian Mountains to the Loess Plateau, in which the natural vegetation coverage is relatively high, with natural forests, shrubs, and meadows, and the levels of urbanization are relatively low. (3) The area of low–low cluster areas gradually decreased from 26.43% to 25.92% from 2010 to 2018 and was primarily distributed in the northern and southern parts of Qinghai Province in the LX urban agglomeration, which had few ESs and low levels of urbanization. (4) Low–high cluster areas are primarily distributed in central Lanzhou City, the regional central city of Baiyin, the area surrounding Lanzhou New District, and (to a lesser extent) in Xining City. In 2010 and 2018, the areas of low–low cluster areas accounted for 5.27% and 5.18% of the total area of the study area, respectively. The population density and GDP density in this area are relatively large, the proportion of urban construction land is high, and the overall urbanization level is high. However, rapid urbanization stresses and destroys ecological resources more seriously, resulting in low ES supply capacity.

4. Discussion

4.1. The ESs of the LX Urban Agglomeration Gradually Improved

Overall, ESs in the LX urban agglomeration grew, although the region experienced rapid and intense urbanization from 2010 to 2018. The improved ESs were consistent with those from the China Ecosystem Assessment at the national scale [56] and from other studies [57]. Such improvement, similar to that at the national scale, may be primarily attributed to national conservation policies started in 2000, which effectively alleviated ecological deterioration [54,56].

4.2. The Regional Spatial Heterogeneity of Urbanization Level was More Significant in the LX Urban Agglomeration

The overall urbanization level of the LX urban agglomeration gradually improved, but the spatial difference was more significant. From 2010 to 2018, the urbanization levels of central cities and regional central cities in the LX urban agglomeration increased by 25.81% and 9.52%, respectively. The urbanization level of node cities and small and medium-sized cities has not increased significantly. The spatial characteristics of urbanization levels do not show a spatial weakening pattern from core to periphery, unlike the results for the Jingjiji urban agglomeration and the middle Yangtze River urban agglomeration in Eastern China obtained by other researchers [58,59]. This is because the LX urban agglomeration is located in the transition zone between the Qinghai Tibet Plateau and the Loess Plateau, and the development of the urban agglomeration is supported and constrained by the complex and diverse topography. The western portion of the LX urban agglomeration is affected by the uplift of the Qinghai–Tibet Plateau and has formed a beaded river valley landform with numerous staggered canyons and basins. The western portion is the Loess Plateau, which contains abundant loess deposits and is affected by the rising and falling of the Qilian Mountain fault block and the erosion of rivers, forming discontinuous loess platforms and multi-level river terraces. Therefore, constrained by rivers, canyons, basins, and river terraces, to a certain extent, the radiative driving effect of the central cities of the LX urban agglomeration has been hindered. Affected by the policy, the urbanization level of central cities has increased significantly, and the urbanization of regional central cities, node cities, and small and medium-sized cities has slowly developed; additionally, the urbanization level of the LX urban agglomeration has significant spatial and regional differences.

4.3. The Relationship between Urbanization and ESs

The relationship between urbanization and ecosystem services has received widespread attention in recent years [58]. Many studies have shown that urbanization causes a decline in the ecological environment [49] and ESs [14,60] and affects the landscape patterns of urban space, which then influences ESs [61]. The results of this study also confirm this. There was a significant negative spatial correlation between the urbanization level of the LX urban agglomeration and the integrated ESs. The global bivariate Moran’s I index values in 2010 and 2018 were −0.082 and −0.90, respectively. The increase in absolute value indicates that the spatial difference between the two gradually increased. The rapid progress of urbanization in the LX urban agglomeration has brought rapid economic and population growth and sharply increased demand for housing, transportation, and public service facilities in urbanized areas, and the rapid development of industrial structure and non-agricultural development has led to changes in land use. The conversion of forest land, grassland, and farmland with many ESs into construction land with few ESs has seriously affected the supply capacity of ESs in the region. The impact of urbanization depends on the type of ES. Specifically, the level of urbanization has a significant negative spatial correlation with water yield, sediment retention, and carbon storage but a positive spatial correlation with nutrient purification, which indicates that the improvement of the urbanization level of the LX urban agglomeration has promoted an increase in nutrient purification in the region; this is contrary to the conclusions obtained by other scholars in the central and eastern urban agglomeration [50,54] because the InVEST nutrient purification module is primarily used to evaluate the purification function of nitrogen and phosphorus nutrients in the ecosystem. The amount of nutrient purification depends on the pollutant load and the retention rate of nitrogen and phosphorus. Point-source pollutants, such as industrial wastewater and sewage treatment plants, and agricultural non-point-source pollutants are the primary sources of nitrogen and phosphorus. On the one hand, the amount of urban sewage discharge increased significantly during the process of urbanization, resulting in a significant increase in pollutant load. On the other hand, with increased levels of urbanization, awareness among the residents regarding ecological and environmental protection and the technical means of ecological environmental governance have improved. This partially promotes the maintenance of nitrogen and phosphorus by plants and microorganisms.

4.4. Suggestions for Coordinating Urban Development and Ecological Protection

As the primary area of ecological protection and high-quality development in the transition zone of three natural regions, the LX urban agglomeration has a complex relationship with urbanization and the ecological environment [25]. Therefore, from the perspective of system science, dialectical thinking should be used to understand the spatial interaction relationship between urbanization and ecosystems to coordinate ecological protection and urban development [17]. High–high cluster areas of ESs and urbanization should continue to strengthen the monitoring and protection of the ecological environment, strictly prevent the destruction of the ecological source of high ecological service functions, improve the intensive and economical utilization of urban construction land, accelerate industrial transformation, and upgrade in a green and high-quality direction. High–low cluster areas should rationally plan urban construction land, improve land use efficiency, and develop new industries that do not rely on natural resources. Low–low cluster areas are primarily distributed in high-altitude areas. More ecological restoration projects should be planned to accelerate the ecological transformation of traditional agriculture and animal husbandry. Low–high cluster areas should strictly control the scale of urban land use and layout ecological restoration projects according to the differentiated ecological environment to avoid the destruction of the original ecological environment.

4.5. Limitations and Future Perspectives

This study superseded administrative boundaries and explored the spatial–temporal distribution pattern of ESs and urbanization in the LX urban agglomeration in the transition zone of three natural regions based on grid and regional scales to reveal the temporal and spatial interaction relationship between ESs and urbanization. However, due to research data limitations, the urbanization development level measured by population, economy, and land using 2010 and 2018 as the time node may not be comprehensive. Future research should fully utilize the advantages of modern information technology, such as big data, and consider cultural, social, and other factors to build a long-term database and to clarify the dynamic evolution of the spatial interaction between ESs and urbanization to allow more in-depth research. Additionally, we only considered four types of ESs and excluded others, such as cultural services. The beautiful scenery and invaluable cultural heritage of the study area form an important national and international tourist destination in China, and the development of tourism influences ecosystem services [62]. Cultural ESs needs to be considered in future research.

5. Conclusions

(1)
From 2010 to 2018, various ecosystem services in the LX urban agglomeration showed an overall upward trend. The overall distribution pattern of various ecosystem services is consistent, but the spatial differences are obvious. The central and regional center cities have the fewest ecosystem services, the node cities have relatively few ecosystem services, and the small and medium-sized cities have a relatively high number of ecosystem services.
(2)
In 2018 and 2010, the spatial distribution pattern of urbanization level in the LX urban agglomeration was basically the same, and the regional spatial differences were significant. The urbanization level is the highest in the central cities of Lanzhou and Xining, followed by the regional central cities.
(3)
The relationship between urbanization and ESs is complex. There is a negative correlation between urbanization and ESs in the LX urban agglomeration, and the degree of negative correlation between urbanization and ESs is heterogeneric. The spatial–temporal relationships between urbanization and water yield, sediment retention, and carbon storage are significantly negatively correlated, but the relationship between urbanization and nutrient purification is significantly positively correlated. Future effective measures should be taken to promote the rational population and economic development, to promote intensive and economical land use, and to achieve the sustainable development of cities.

Author Contributions

Conceptualization, X.P. and P.S.; methodology, X.P. and N.W.; software, X.P.; formal analysis, X.P. and N.W.; writing—original draft preparation, X.P.; writing—review and editing, X.P. and N.W.; funding acquisition, P.S. All authors have read and agreed to the published version of the manuscript.

Funding

This research was funded by Natural Science Foundation of China, grant number 41771130 and Postdoctoral Science Foundation of China, grant number 2020M673641XB.

Conflicts of Interest

The authors declare no conflict of interest.

References

  1. Xu, X.Q.; Zhou, Y.X.; Ning, Y.M. Urban Geography; Higher Education Press: BeiJing, China, 2009; pp. 52–84. [Google Scholar]
  2. Bowen, J.L.; Valiela, I. The ecological effcts of urbanization of coastal watersheds: Historical increases in nitrogen loads and eutrophication of Waquoit Bay estuaries. Can. J. Fish. Aquat. Sci. 2001, 58, 1489–1500. [Google Scholar] [CrossRef]
  3. Beach, D. Coastal Sprawl: The Effcts of Urban Design on Aquatic Ecosystems of the United States. Pew Oceans Comm. 2002. [Google Scholar]
  4. Mentens, J.; Raes, D.; Hermy, M. Green roofs as a tool for solving the rainwater run of problem in the urbanized 21st century? Landsc. Urban Plan. 2006, 77, 217–226. [Google Scholar] [CrossRef]
  5. Qiu, G.Y.; Zhang, N. China’s urbanization and its ecological environment challenges in the 21st century. Prog. Geogr. 2019, 34, 640–649. [Google Scholar]
  6. Du, X.; Meng, Y.R.; Fang, C.L.; Li, C. Spatio-temporal characteristics of coupling coordination development between urbanization and eco-environment in Shandong Peninsula urban agglomeration. Acta. Ecol. Sin. 2020, 40, 5546–5559. [Google Scholar]
  7. Elmqvist, T.; Fragkias, M.; Goodness, J.; Güneralp, B.; Marcotullio, P.J.; McDonald, R.I.; Parnell, S.; Schewenius, M.; Sendstad, M.; Seto, K.C.; et al. Urbanization, Biodiversity and Ecosystem Services: Challenges and Opportunities; Springer: Berlin/Heidelberg, Germany, 2013; pp. 31–52. [Google Scholar]
  8. Seto, K.C.; Fragkias, M.; Güneralp, B.; Reilly, M.K. A Meta-Analysis of Global Urban Land Expansion. PLoS ONE 2011, 6, e23777. [Google Scholar] [CrossRef] [PubMed]
  9. Deng, X.; Huang, J.; Rozelle, S.; Zhang, J.; Li, Z. Impact of urbanization on cultivated land changes in China. Land Use Policy 2015, 45, 1–7. [Google Scholar] [CrossRef]
  10. Wu, Y.; Zhang, X.; Shen, L. The impact of urbanization policy on land use change: Ascenario analysis. Cities 2011, 28, 147–159. [Google Scholar] [CrossRef]
  11. Zope, P.; Eldho, T.I.; Jothiprakash, V. Impacts of land use–land cover change and urbanization on flooding: A case study of Oshiwara River Basin in Mumbai, India. Catena 2016, 145, 142–154. [Google Scholar] [CrossRef]
  12. Xu, Q.; Yang, R.; Dong, Y.-X.; Liu, Y.-X.; Qiu, L.-R. The influence of rapid urbanization and land use changes on terrestrial carbon sources/sinks in Guangzhou, China. Ecol. Indic. 2016, 70, 304–316. [Google Scholar] [CrossRef]
  13. Roberts, A.D.; Prince, S.D.; Jantz, C.A.; Goetz, S.J. Effects of projected future urbanland cover on nitrogen and phosphorus runoff to Chesapeake Bay. Ecol. Eng. 2009, 35, 1758–1772. [Google Scholar] [CrossRef]
  14. Seto, K.C.; Güneralp, B.; Hutyra, L.R. Global forecasts of urban expansion to 2030 and direct impacts on biodiversity and carbon pools. Proc. Natl. Acad. Sci. USA 2012, 109, 16083–16088. [Google Scholar] [CrossRef] [Green Version]
  15. Yuan, Y.; Wu, S.; Yu, Y.; Tong, G.; Mo, L.; Yan, D.; Li, F. Spatiotemporal interaction between ecosystem services and urbanization: Case study of Nanjing City, China. Ecol. Indic. 2018, 95, 917–929. [Google Scholar] [CrossRef]
  16. Alberti, M. Maintaining ecological integrity and sustaining ecosystem function inurban areas. Curr. Opin. Environ. Sustain. 2010, 2, 178–184. [Google Scholar] [CrossRef]
  17. Liu, J.; Li, J.; Qin, K.; Zhou, Z.; Yang, X.; Li, T. Changes in land-uses and ecosystem sevices under multi-scenarios simulation. Sci. Total Environ. 2017, 586, 522–526. [Google Scholar] [CrossRef] [PubMed]
  18. Song, Y.Y.; Xue, D.Q.; Ma, P.P.; Yang, K.Y.; Mi, W.B. Urbanization Process and Its Ecological Environment Response Pattern on the Loess Plateau. China Econ. Geogr. 2020, 40, 174–184. [Google Scholar]
  19. Breuste, J.; Qureshi, S. Urban sustainability, urban ecology and the Society for Urban Ecology (SURE). Urban Ecosyst. 2011, 14, 313–317. [Google Scholar] [CrossRef]
  20. Breuste, J.; Qureshi, S.; Li, J. Applied urban ecology for sustainable urban environment. Urban Ecosyst. 2013, 16, 675–680. [Google Scholar] [CrossRef]
  21. Taylor, L.; Hochuli, D.F. Creating better cities: How biodiversity and ecosystem functioning enhance urban residents’ wellbeing. Urban Ecosyst. 2015, 18, 747–762. [Google Scholar] [CrossRef]
  22. Ran, S.-H.; Lü, C.-H.; Jia, K.-J.; Qi, Y.-H. Environmental impact assessment of the land use change in china based on ecosystem service value. Huan Jing ke Xue = Huanjing Kexue 2006, 27, 2139–2144. [Google Scholar]
  23. Amundson, R.; Berhe, A.A.; Hopmans, J.W.; Olson, C.; Sztein, A.E.; Sparks, D.L. Soil and human security in the 21st century. Science 2015, 348, 1261071. [Google Scholar] [CrossRef] [PubMed] [Green Version]
  24. Huang, B.L.; Zhang, J. Coordination between population development and economic structure based on the land in Xijiang. J. Arid Land. Resour. Environ. 2012, 26, 175–180. [Google Scholar]
  25. Peng, J.; Tian, L.; Liu, Y.; Zhao, M.; Hu, Y.; Wu, J. Ecosystem services response to urbanization in metropolitan areas: Thresholds identification. Sci. Total Environ. 2017, 607, 706–714. [Google Scholar] [CrossRef] [PubMed]
  26. Fang, C.L.; Cui, X.G.; Liang, L.W. Theoretical analysis of urbanization and eco-environment coupling coil and coupler control. Acta Geogr. Sin. 2019, 74, 2529–2546. [Google Scholar]
  27. Lin, Y.Y.; Qiu, R.Z.; Yao, J.X.; Jin, G.L. The effects of urbanization on China’s forest loss from 2000 to 2012: Evidence from a panel analysis. J. Clean Prod. 2019, 214, 270–278. [Google Scholar] [CrossRef]
  28. Wang, Y.; Luo, X.; Chen, W.; Zhao, M.; Wang, B. Exploring the spatial effect of urbanization on multi-sectoral CO2 emissions in China. Atmos. Pollut. Res. 2019, 10, 1610–1620. [Google Scholar] [CrossRef]
  29. Lapointe, M.; Gurney, G.G.; Cumming, G.S. Urbanization alters ecosystem service preferences in a Small Island Developing State. Ecosyst. Serv. 2020, 43, 101109. [Google Scholar] [CrossRef]
  30. Zhao, Y.; Wang, S.; Ge, Y.; Liu, Q.; Liu, X. The spatial differentiation of the coupling relationship between urbanization and the eco-environment in countries globally: A comprehensive assessment. Ecol. Model. 2017, 360, 313–327. [Google Scholar] [CrossRef]
  31. Cai, D.; Fraedrich, K.; Guan, Y.; Guo, S.; Zhang, C. Urbanization and the thermal environment of Chinese and US-American cities. Sci. Total Environ. 2017, 589, 200–211. [Google Scholar] [CrossRef] [Green Version]
  32. Sunde, M.G.; He, H.S.; Hubbart, J.A.; Urban, M.A. An integrated modeling approach for estimating hydrologic responses to future urbanization and climate changes in a mixed-use midwestern watershed. J. Environ. Manag. 2018, 220, 149–162. [Google Scholar] [CrossRef]
  33. Mascarenhas, A.; Haase, D.; Ramos, T.B.; Santos, R. Pathways of demographic and urban development and their effects on land take and ecosystem services: The case of Lisbon Metropolitan Area, Portugal. Land Use Policy 2019, 82, 181–194. [Google Scholar] [CrossRef]
  34. Reverte, F.C.; Garcia, M.D.G.M.; Brilha, J.B.; Pellejero, A.U. Assessment of impacts on ecosystem services provided by geodiversity in highly urbanised areas: A case study of the Taubaté Basin, Brazil. Environ. Sci. Policy 2020, 112, 91–106. [Google Scholar] [CrossRef]
  35. Balha, A.; Vishwakarma, B.D.; Pandey, S.; Singh, C.K. Predicting impact of urbanization on water resources in megacity Delhi. Remote. Sens. Appl. Soc. Environ. 2020, 20, 100361. [Google Scholar] [CrossRef]
  36. Li, S.C.; Zhao, Z.Q.; Wang, Y.L. Urbanization process and effects of natural resource and environment in china: Research trends and future direction. Prog. Geogr. 2009, 28, 63–70. [Google Scholar]
  37. Liu, Y.B.; Li, R.D. Scenario Simulation of Future Urbanization and Its Resource & Environment Effects in Jiangsu Province. Geogr. Geo-Infor. Sci. 2007, 23, 61–64. [Google Scholar]
  38. Liu, H.M.; Fang, C.L.; Li, Y.H. The Coupled human and natural cube: A conceptual framework for analyzing urbanization and eco-environment interactions. Acta Geogr. Sin. 2019, 74, 1489–1507. [Google Scholar]
  39. Fang, C.L.; Wang, Z.B.; Ma, H.T. The theoretical cognition of the development law of China’s urban agglomeration and academic contribution. Acta Geogr. Sin. 2018, 73, 651–665. [Google Scholar]
  40. Lang, W.L.; Wang, Z.B.; Sun, Z. Spatiotemporal differentiation and coordinated development pattern of urbanization and the ecological environment of the Beijing-Tianjin-Hebei urban agglomeration. Acta Ecol. Sin. 2019, 39, 1212–1225. [Google Scholar] [CrossRef]
  41. Chen, X.F.; Guo, J.F.; Yao, S.M. Study on the Coupling Between Ecological Capacity and New Urbanizationin Yangtze River Delta Agglomeration: Based on the Leopold’s Earth Ethics. Res. Envir. Yangtze Basin 2018, 27, 7157–7224. [Google Scholar]
  42. Wu, Z.X.; Zhang, Q.; Song, C.Q.; Zhang, F.; Zhu, X.D.; Sun, P.; Fan, K.K.; Yu, H.Q.; Shen, Z.X. Impacts of urbanization on spatio-temporal variations of temperature over the Pearl River Delta. Acta Geogr. Sin. 2019, 74, 2342–2357. [Google Scholar]
  43. Montgomery, M. World Bank: World Development Report 2009: Reshaping Economic Geography. Popul. Dev. Rev. 2009, 35, 197–200. [Google Scholar] [CrossRef]
  44. Smeraldo, S.; Bosso, L.; Fraissinet, M.; Bordignon, L.; Brunelli, M.; Ancillotto, L.; Russo, D. Modelling risks posed by wind turbines and power lines to soaring birds: The black stork (Ciconia nigra) in Italy as a case study. Biodivers. Conserv. 2020, 29, 1959–1976. [Google Scholar] [CrossRef]
  45. Hu, M.; Li, Z.; Yuan, M.; Fan, C.; Xia, B. Spatial differentiation of ecological security and differentiated management of ecological conservation in the Pearl River Delta, China. Ecol. Indic. 2019, 104, 439–448. [Google Scholar] [CrossRef]
  46. Fan, J.; Wang, Y.F.; Liang, B. The evolution process and regulation of China’s regional development pattern. Acta Geogr. Sin. 2019, 74, 2437–2454. [Google Scholar]
  47. Huang, B.W. The integrated nature division draft of China. Chin. Sci. Bull. 1959, 4, 594–602. [Google Scholar]
  48. Li, Y.; Zhu, G.R. Changes of climate zones in the transition area of three natural zones during the past 50 years and their responses to climate change. Adv. Earth Sci. 2015, 30, 791–801. [Google Scholar]
  49. Xu, J.H. Mathematical Methods in Contemporary Geography (Third Edition). China HEP 2017, 149–154. [Google Scholar]
  50. Ou, Y.X.; Zhu, X.; He, Y.Q. Spatial interaction between urbanisation and ecosystem services: A case study in Changsha-Zhuzhou-Xiangtan urban agglomeration, China. Acta Ecol. Sin. 2019, 39, 7502–7513. [Google Scholar] [CrossRef]
  51. Wu, N.; Song, X.Y.; Kang, W.H.; Deng, X.H.; Hu, X.Q.; Shi, P.J.; Liu, Y.Q. Standard of payment for ecosystem services in a watershed based on InVEST model under different standpoints: A case study of the Weihe River in Gansu Province. Acta Ecol. Sin. 2018, 38, 2512–2522. [Google Scholar] [CrossRef] [Green Version]
  52. Chuai, X.W.; Huang, X.J.; Zheng, Z.Q.; Zhang, M.; Liao, Q.L.; Lai, L.; Lu, J.Y. Land use change and its influence on carbon storage of terrestrial ecosystems in jiangsu Province. Res. Sci. 2011, 33, 1932–1939. [Google Scholar]
  53. Ke, X.L.; Tang, L.P. Impact of cascading processes of urban expansion and cropland reclamation on the ecosystem of a carbon storage service in Hubei Province, China. Acta Ecol. Sin. 2019, 39, 672–683. [Google Scholar] [CrossRef]
  54. Chen, W.X.; Liu, Z.L.; Li, J.F.; Ran, R.; Zeng, J. Mapping the spatial relationship between ecosystem services and urbanization in the middle reaches of the Yangtze River Urban Agglomerations. Acta Ecol. Sin. 2020, 40, 5137–5150. [Google Scholar]
  55. Zeng, H.; Yan, C.H.; Huang, W.B.; Lin, Q.Y.; Yu, L.Y.; Qiu, G.Y. A case study on the relationship between urbanization level and water use efficiency in the pearl river delta urban agglomeration. Acta Sci. Nat. U Pekin. 2020, 56, 561–570. [Google Scholar]
  56. Ouyang, Z.; Zheng, H.; Xiao, Y.; Polasky, S.; Liu, J.; Xu, W.; Wang, Q.; Zhang, L.; Rao, E.; Jiang, L.; et al. Improvements in ecosystem services from investments in natural capital. Science 2016, 352, 1455–1459. [Google Scholar] [CrossRef] [PubMed]
  57. Viña, A.; McConnell, W.J.; Yang, H.; Xu, Z.; Liu, J. Effects of conservation policy on China’s forest recovery. Sci. Adv. 2016, 2, e1500965. [Google Scholar] [CrossRef] [PubMed] [Green Version]
  58. Jiang, W.; Deng, Y.; Tang, Z.; Lei, X.; Chen, Z. Modelling the potential impacts of urban ecosystem changes on carbon storage under different scenarios by linking the CLUE-S and the InVEST models. Ecol. Model. 2017, 345, 30–40. [Google Scholar] [CrossRef]
  59. Chen, Q.; Pu, L.; Liang, H.; Wen, J. Assessment of ecological environment of urbanland expansion in rapid urbanization area: A case study of Qixia District in Nanjing. Acta Agr. Univ. Jiangxien 2009, 31, 750–755. [Google Scholar]
  60. Zhang, Y.; Liu, Y.; Zhang, Y.; Liu, Y.; Zhang, G.; Chen, Y. On the spatial relationship between ecosystem services and urbanization: A case study in Wuhan, China. Sci. Total Environ. 2018, 637, 780–790. [Google Scholar] [CrossRef]
  61. Du, X.; Huang, Z. Ecological and environmental effects of land use change in rapid urbanization: The case of hangzhou, China. Ecol. Indic. 2017, 81, 243–251. [Google Scholar] [CrossRef]
  62. Wang, J.; Zhou, W.; Pickett, S.T.; Yu, W.; Li, W. A multiscale analysis of urbanization effects on ecosystem services supply in an urban megaregion. Sci. Total Environ. 2019, 662, 824–833. [Google Scholar] [CrossRef]
Figure 1. The map of Lan–Xi (LX) urban agglomeration.
Sustainability 12 10211 g001
Figure 2. Spatial pattern of ESs in the LX urban agglomeration (2010 and 2018). The grading standards were as follows: water yield: 1: 0–71.47, 2: 71.48–168.93, 3: 168.94–289.13, 4: 289.14–461.31, 5: 461.31–828.41; sediment retention:1: 0–2493.85, 2: 2493.86–11,221.28, 3: 11,221.29–32,416.45, 4: 32,416.46–78,547.13, 5: 78,547.14–31,7927.94; nutrient purification: 1:0–1.10, 2:1.11–2.91, 3: 2.92–5.75, 4: 5.76–9.90, 5: 9.91–17.66; carbon stored: 1: 0–0.13 × 10¹¹, 2: 0.14 × 10¹¹–0.60 × 10¹¹, 3: 0.61 × 10¹¹–1.75 × 10¹¹, 4:1.76 × 10¹¹–2.39 × 10¹¹, 5: 2.40 × 10¹¹–4.3 × 10¹¹.
Sustainability 12 10211 g002
Figure 3. Spatial distribution pattern of urbanization level in the LX urban agglomeration (2010 and 2018).
Sustainability 12 10211 g003
Figure 4. LISA cluster maps between ecosystem services and urbanization level (2010 and 2018).
Sustainability 12 10211 g004
Table 1. Key ecosystem service (ES) parameters and their acquisition paths.
Ecosystem ServiceKey ParametersData SourcesRaw DataData Processing Method
Water yieldAnnual precipitationChina Meteorological Science Data Sharing Service NetworkDaily precipitationCokriging interpolation
Average annual reference evapotranspirationWind speed, relative humidity, temperature, sunshine duration, etc.Penman model, cokriging interpolation
Plant available water contentWorld Soil DatabaseSoil texture dataSoil AWC (the volumetric (mm) plant available water content) estimation model
Root restricting layer depthSoil depth point dataCokriging interpolation
Land use Resource and Environment data center of Chinese Academy of Sciences——Resample to 100 × 100 m
Sub watershedsUSGS websiteDEM dataHydrology module in GIS
Zhang constantHydrological stationObservations of annual evapotranspiration and water productionAfter much debugging, the simulation effect is the best when Z constant is 30
Sediment delivery ratio modelRainfall erosivity index (R)China Meteorological Science Data Sharing Service NetworkDaily precipitationWestheimer method
Soil erodibility (K)World Soil DatabaseSoil texture dataWilliams method
Threshold flow accumulation valueUSGS websiteDEM dataWhen the threshold is 1500, the generated river network is more consistent with the actual water system
Nutrient delivery ratio modelNutrient runoff proxyChina Meteorological Science Data Sharing Service NetworkDaily precipitationCokriging interpolation
Carbon storage and sequestrationCarbon poolsRelated literature [42,43],
IPCC (Intergovernmental Panel on Climate Change) (2006)
Carbon density dataCollect and sort
Table 2. Total and changes of ESs from 2010 to 2018.
ESsWater Yield (m3)Sediment Retention (t)Nutrient Purification (t)Carbon Stored (t)
2010122.69 × 10868.08 × 1080.29 × 10811.85 × 108
2018150.84 × 108171.26 × 1080.34 × 10812.54 × 108
changes28.15 × 108103.18 × 1080.05 × 1080.69 × 108
Table 3. Global bivariate Moran’s I index between the level of urbanization and various ESs.
YearsUrbanization and Water YieldUrbanization and Sediment RetentionUrbanization and Nutrient PurificationUrbanization and Carbon StoredUrbanization and Comprehensive Ecosystem Services
2010−0.123−0.0560.060−0.056−0.082
2018−0.104−0.0510.061−0.100−0.090
Publisher’s Note: MDPI stays neutral with regard to jurisdictional claims in published maps and institutional affiliations.

