Abstract
Green development is not only important for realizing a sustainable development strategy, but also a key approach for constructing an ecological civilization and transforming economic development. On the basis the development concept of a coordinated human–earth relationship and the paradigm of the process–pattern mechanism, this research adopted the drivers, pressures, state, impact, and response (DPSIR) model to build a green development level indicator system. The established indicator system is then applied to explore the spatial-temporal patterns and obstacles in the green development of 34 prefectural cities in Northeast China from 2008 to 2017 by the use of the entropy weight TOPSIS model, the obstacle model and the GIS spatial visualization method. There are three main findings. First, during the research period, the spatial evolution of the green development level of cities in Northeast China has gradually shifted from a small gap at an overall low level to a large gap at an overall high level; the spatial pattern of the green development level in these cities is characterized by a decrease from north to south and obvious spatial agglomeration effects. Second, specific findings in this research fail to indicate that the correlation between the economic development level and green development level of cities in Northeast China is entirely positive. That is, cities with higher economic development levels do not necessarily have higher green development levels, while some cities with lower economic development levels did present higher green development levels, which may be related to each region’s resources and environmental carrying capacity. Third, the mechanisms influencing spatial-temporal variation in the green development level of cities in Northeast China are not identical. Among them, resource endowment conditions, economic development status and government investment scale are playing a vital role in changes in the regional green development level, and they are also behind the diverse evolutionary characteristics presented in the different stages of regional green development. For the cities in Northeast China, in the process of promoting green development and to consolidate their existing green development level, efforts should be made to overcome inefficiencies in socioeconomic growth and to continuously enhance ecological protection and environmental governance. Moreover, it is essential to promote incremental increases in the green development level on the basis of the local conditions through the ingestion, absorption and combination of each city’s own characteristics with lessons from the successful experience of different types of cities. In the future, our research should fully consider the role of urbanization, industrial structure, population density, institutional mechanisms, environmental protection supervision, scientific and technological progress and other factors on the green development level in Northeast China and seek an important entry point to achieve regional human–earth coordination.
1. Introduction
Since the industrial revolution, the traditional development concept of pursuing high economic growth and maximum output has held a dominant position among human societies, and the world economy has entered a golden period of prosperity and development. The traditional development concept is based on the industrial technological revolution, emphasizing human needs as the value judgment of economic activities, which are characterized by pursuing high economic growth, revering regional unbalanced development, focusing on immediate interests and placing “material capital” at a higher level than “human capital” [1]. However, the limited supply and limited ability of natural resources and ecosystems to restore themselves mean that the traditional economic growth model is creating various problems worldwide, including ecological imbalances, environmental damage, an abnormal climate, land quality decline, resource depletion, and species extinction; these problems are gradually creating a dilemma for human society by oppressing both resources and the environment, such as photochemical smog incidents in Los Angeles, smoke incidents in London, Minamata disease events in Japan, Chernobyl nuclear leakage incidents in Ukraine, etc. Against this background, countries worldwide have begun to re-examine the relationship between humans and nature and decide how to explore the path of sustainable development.
Green development is a historical process. The birth of its related theory is based on human reflection and awakening to the increasingly bad ecological environment. Accompanied by the industrial civilization development, humans have also unprecedentedly exploited and destroyed nature. With the deepening of human understanding of the relationship between economic growth and the ecological environment, scholars have gradually begun to study the causes and solutions of environmental problems and the future of the earth. For example, in 1798, Malthus mentioned the concept of “the theory of resources absolute scarcity” in his book Principle of Population, which holds that the main contradiction of human society in the future is the contradiction between the population, land and food [2]. In 1817, Ricardo clearly pointed out that natural resources restrict economic growth in the book On the Principles of Political Economy and Taxation [3]. In 1864, Marsh reflected upon the negative impact of human industrialization activities on the natural environment in the book Man and Nature [4]. In this period, these works and theories have greatly promoted the formation of the idea of green development. Green development, an economic development concept that practices the idea of sustainable development, first appeared in Boulding’s theory of a spaceship economy in the 1960s [5]. It was later discussed in a set of expositions about the steady-state economy and the green economy by Daly and Pierce, which were mainly used to guide ecological industry development [6]. However, it was not until the international financial crisis broke out in 2008 that worldwide consensus began to form around the need for green development, mainly because international organizations and developed countries and regions such as the United Nations, the European Union, the United States and Japan aimed to not only achieve their own economic recovery but also seize a dominant position in a new round of fierce global competition. For example, the UNEP proposed a green new deal and a green economic plan [7]. The United States proposed investing in clean energy to stimulate green development, and the European Union proposed establishing green industry to develop a green economy [8]. South Korea developed a green growth strategy to stimulate economic revitalization, and Japan proposed establishing a low-carbon society to promote green economic growth [9]. Developing countries, including Cambodia and South Africa, have also developed strategic plans for a green economy [10]. Under the dual demand to construct an ecological civilization and transform its economic development, China, as the largest developing country in the world, has listed green development as one of its five major development goals in its 13th Five-Year Plan [11]. Green development has achieved an unprecedented position in China, gradually becoming an important path for China in realizing its sustainable development strategies. Reviewing domestic and foreign theoretical explorations and the evolution of practice over nearly half a century, it can be seen that green development is gradually transitioning from a single dimension concept to one with multiple dimensions, from simplicity to complexity, and from its initial stage to a mature stage [12,13]; these trends provide not only a useful exploration of the theory and practice of regional sustainable development but also a deep reflection on the development and survival of human society.
At present, the domestic and foreign academic community has made positive progress in green development research, which can be generalized into four areas: the definition and connotation of the green development concept, green development framework construction and model evaluation, spatial-temporal variation and driving mechanism of green development, and the incentive mechanisms and path for realizing green development. First, the definition and connotation of the green development concept is reviewed. The definition of green development is mostly derived from studies on the relationship between human development and ecology. The usual formulation includes the green economy, green growth and the ecological economy. The boundary of this concept is relatively vague, and the essential differences between definitions are not large [14]. As described by the UNEP, the green economy is a low-carbon, green, energy efficient, environmentally friendly, resource efficient and socially inclusive economic growth model [15]. The OECD regarded green growth as a solution to promote economic development and ensure that natural resources sustainably provide the resources and ecosystem services on which human wellbeing depends [16]. The World Bank considered green growth to be a socially inclusive path for economic growth, emphasizing the efficient utilization of natural resources, the minimization of environmental pollution and the effective response to ecological disasters [13]. In addition to the relevant definitions of green development given by the above international authorities, scholars have also discussed and explained the connotation of green development in depth. Jack proposed that a green economy means that resource consumption and environmental pollution driven by economic development conform to local environmental conditions and that respect for the ecological environment does not allow the unrestricted use of resources [17]. Bartelmus maintained that green growth is the green and sustainable development of the economy and not all-inclusive development or all-inclusive human wealth, welfare and overall development [18]. Zhu et al. emphasized that green development depends more on the output efficiency of ecological capital and improvement in the output efficiency of economic welfare under the restriction of ecological capital [19]. Hu and Zhou regarded green development as the second-generation outlook of sustainable development, being a new development of the social, economic and ecological trinity that emphasizes systematic, holistic and coordinated relationships between the economic system, social system and natural system [20]. Second, in the field of green development framework construction and model evaluation, domestic and foreign research on evaluating green development has formed various mature analytical frameworks and measurement methods. For example, the OECD green growth evaluation framework [21], the UNEP green economy measurement model [22] and the green development index evaluation model of Beijing Normal University [23] have been widely used in the academic community. Satbyul et al. made cross-country comparisons of green growth for 30 countries by using the OECD evaluation framework [24]. Lyytimaki et al. built a series of key indicators of green growth for Finland based on the Green Growth Knowledge Platform [25]. Hu and Zhou constructed the three circles model of green development based on discussion of the symbiosis among economic, social and natural systems [20]. Li et al. constructed the human green development index by analyzing the current situation in terms of global natural and human development [26]. Zhu established the object-subject-process framework system and analyzed the global green development practices and policy effects evaluation model from the perspective of the United Nations Sustainable Development Goals [27]. Wu et al. used the DPSIR model to evaluate urban green development in Beijing by simultaneously considering resource depletion, environmental damage and ecological benefits [28]. Third, in the field of the spatial-temporal variation and driving mechanism of green development, attention has always focused on the spatial heterogeneity of specific research objects. Similarly, the study of green development inevitably must explore the occurrence, change and influence of green development differences. For example, Shao et al. analyzed whether technological innovation can cause a shift to become greener with empirical evidence from industry in Shanghai [29]. Lv et al. analyzed the dynamic evolution characteristics of the spatial pattern of green growth in China by using the coefficient of variation, the Gini coefficient and exploratory spatial data analysis [30]. Zhang et al. used panel data to determine whether technological innovation promotes or hinders urban green development and investigated the heterogeneous characteristics of urban green development in China [31]. Chen et al. measured and analyzed the regional green development level and its spatial relationship in China based on the provincial panel dataset [32]. Hasan adopted the LMDI model to analyze the economic scale, industrial structure and technological progress as influencing factors of green development in Germany [33]. Fourth, in the field of incentive mechanisms and the path for realizing green development, these are mainly reflected in the perspectives of concept technology, industrial transformation, policy decision making, and government behavior. For example, UNEP proposed investing 1% of global GDP to improve the energy efficiency of old and new buildings, developing renewable energy sources such as wind energy, developing rapid public transport, and investing in ecological infrastructure and sustainable development to promote the greening of the global economy [34]. Carfi and Schiliro proposed a win–win Pareto solution with a view to establishing a green economy model of competitive cooperation globally [35]. John maintained that the key to achieving green growth is to curb environmental emissions, encourage cleaner green production, eliminate high pollution industries, levy high carbon taxes, and support subsidies for clean energy industries [36]. Li and Zhao explored the path for transforming and upgrading the Daqiuzhuang iron and steel industry in China based on the concept of innovation and environmental protection [37]. Liu presented various optimization measures to promote the development of green service functions, improve the government and the public two-way communication mechanism, perfect the relevant laws and regulations, strengthen the government’s conduct as regards regulation, and establish an effective mechanism for supervising green development responsibility and conduct [38]. On the whole, local and international scholars have produced considerable research on the theory and practice of green development, but there are still some problems to be further explored. First, the connotation and definition of green development have some issues with concept generalization, boundary ambiguity, and concepts that are called “green development” but that are essentially less relevant, mainly because of the failure to clarify the logical relationship between “green” and “development” [1]. Moreover, there is a one-sided view treating green development as economic growth, social development and environmental protection, but the internal relationship between the three is not clear, which seriously restricts the theoretical construction and empirical evaluation of the green development concept. Second, a perfected green development evaluation system is lacking; in particular, there is no effective scientific basis or methodology for managing the multiple objectives of green development, selecting indicators and managing weights, which makes it difficult to construct a green development evaluation indicator system in line with the reality of regional development. Third, empirical investigations of green development pay more attention to mathematical reasoning and econometric analysis and rarely involve the study of green development from a geographical or spatial perspective [28,29,31]. Moreover, most studies suggest that the development strategy, development model and development direction are too general, macro suggestions are secondary, policy guidelines are insufficient, and the feasibility of proposed solutions are poor [28,29,30].
Northeast China, as the cradle of new China’s industry, made significant historical contributions to China’s socialist economic construction and played a strong supporting role in its national economic security. However, due to the late start of the reform and opening up, particularly the long-term effects of the rigid planned economic system and an unreasonable industrial structure, Northeast China showed signs of economic recession in the 1990s, referred to as the “Northeast phenomenon”. In Northeast China, industrial growth saw widespread stagnation and recession, regional economies lost vitality and competitiveness, and various social development problems emerged [39]. From October 2003, when the central government launched “Certain Opinions on the Implementation of the Strategy for the Revitalization of Old Industrial Bases in Northeast China”, until April 2016, when the central government promulgated “Certain Opinions regarding the Comprehensive Revitalization of Old Industrial Bases, including Northeast China”, China has been emphasizing the importance and urgency of improving the sustainable development of Northeast China. In addition, Northeast China is China’s main commodity grain producing area and ecological functional area; therefore, fully releasing the potential for maximum grain production and ensuring national food security and ecological land security will become a major strategic task for the sustainable development of Northeast China. Against this background, green development based on the constraints of resource and environmental carrying capacity becomes an inevitable choice if the old industrial base in Northeast China is to adapt, revitalize and experience economic transformation. Meanwhile, green development also offers a new idea for the scientific development of important commodity grain bases and ecological security areas in Northeast China [40].
Overall, to fill in the above gaps, this paper attempts to extend three aspects of the existing research. First, to define the connotation of green development, this research adopts the DPSIR model to construct a green development evaluation indicator system. Then, the established indicator system depicts the relationship between the elements of the green development system by considering economic, social, ecological and environmental factors, reveals the causality of human–earth interactions, and provides a scientific basis for accurately reflecting regional green development. Second, taking 34 prefectural cities in Northeast China as the object of investigation, this research applies the entropy weight TOPSIS model, obstacle model and GIS spatial visualization method to scientifically and objectively explore the spatial-temporal patterns and obstacles to green development in Northeast China, aiming at revealing the dynamic evolution characteristics and mechanisms influencing the spatial pattern of green development and providing a reference for realizing green sustainable development in Northeast China. Third, this research seeks to identify the laws governing spatial-temporal heterogeneity and the mechanisms influencing green development—specifically considering the geographical process–pattern mechanism—to not only expand the research framework for green development but also enrich and develop theory on coordinating the human–earth relationship considering geography.
2. Study Case, Data Sources and Methodology
2.1. Study Case and Data Sources
Northeast China is an important old industrial base, commodity grain producing area and ecological functional area in China. Since the central government initiated “the Northeast Revitalization Strategy” in 2003, the economic growth rate of Northeast China has rapidly accelerated, gradually narrowing its development gap with the rest of the country. However, because high pollution and high energy consumption industries occupy an important position in its economic system, extensive economic growth has highly stressed the ecological environment of Northeast China. Furthermore, against the background of China vigorously promoting the construction of an ecological civilization and rapid economic transformation and upgrading, relevant research on green development in Northeast China is of great practical significance.
In this paper, the study area refers to Northeast China in the traditional sense, covering 36 prefectural cities, including 14 cities in Liaoning Province, 9 cities in Jilin Province and 13 cities in Heilongjiang Province. In view of data availability and computational feasibility, this analysis excludes Yanbian North Korea Autonomous Prefecture and Daxing’anling area. Therefore, the remaining 34 prefectural cities in Northeast China are selected as the object of investigation. The sample covers the period from 2008 to 2017, and the original data needed for each indicator are derived from the Liaoning Statistical Yearbook (2009–2018), Jilin Statistical Yearbook (2009–2018), Heilongjiang Statistical Yearbook (2009–2018), and China City Statistical Yearbook (2009–2018). The locations of the study area are shown in Figure 1.
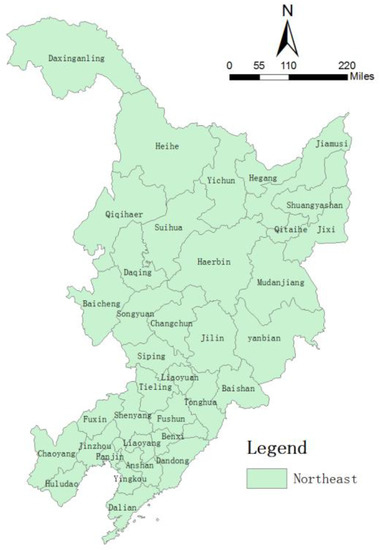
Figure 1.
Location of the study area.
2.2. Methodology Specification
2.2.1. Construction of the Indicator System
The construction of the indicator system is based on the understanding of the meaning of green development. In view of the different research fields and perspectives [13,15,16,17,18,19,20], such as economics, management, sociology, environment, ecology, etc., a unified definition has not yet formed around the green development concept. Generally, green development is an economic development model that aims to realize economic efficiency, social equity and ecological protection through resource intensive, environmentally friendly and culturally integrated actions; it follows the path established by the low-carbon economy, circular economy and ecological economy and aims to improve human wellbeing and guide the transformation of the human social form from an industrial to an ecological civilization [40] that emphasizes the symbiosis of economic, social and natural systems and the diversification of development goals [20]. The DPSIR model, as a common tool for measuring the environment and sustainable development, is generally able to provide a comprehensive analysis of issues in terms of the causal relationship between human activities and the geographical environment; namely, human lives and production drive socioeconomic development, but they also pressure resources and the environment, changing the original state of the ecological environment, which in turn affects human activities. To maintain sustainable socioeconomic development, human beings must take measures and adopt means to cope with or mitigate these changes [41]. The model is divided into five elements: the drivers (D), pressures (P), state (S), impact (I), and response (R). The interaction between the various elements is then analyzed so that the causes of the problem and the means of its solution are reflected in the indicator system [42]. Therefore, this paper adopts the DPSIR model to build an indicator system for the green development level in Northeast China by considering economic, societal, resource and environmental aspects based on fundamental principles—such as comprehensive, scientific, systematic, representative and operational principles—drawing lessons from the existing literature [28,41,42] and combining these with the actual situation in the study area. In this paper, the drivers (D) is linked to the driving factors that promote change in green development, which are mainly economic and social drivers; the four indicators selected are per capita GDP, per capita fixed asset investment, population density and urbanization rate. Pressures (P) is related to the load caused by human activities on the ecological environment, and mainly includes the two aspects of resource pressure and environmental pressure; the four indicators selected are water consumption per unit of GDP, energy consumption per unit of GDP, industrial waste water discharge density, and industrial sulfur dioxide emission density. State (S) refers to the condition of the ecological environment under the above driving force and pressure, and it includes the two aspects of resource endowment conditions and environmental background conditions. The selected indicators are per capita water resources, per capita cultivated land area, per capita green area and green coverage ratio in built-up areas. Impact (I) is linked to the impact of changes in the state of the ecological environment on the social economy, human health and public life; these mainly include environmental resource and socioeconomic impacts, and the selected four indicators are the industrial solid waste comprehensive utilization ratio, the environmental quality index (sewage treatment ratio and the geometric mean of the domestic refuse harmless treatment ratio), the urban to rural resident income ratio, and the financial self-sufficiency ratio. Response (R) is related to the countermeasures and policies taken by human society to prevent ecological environment degradation; these compensate for losses or adapts to new trends and mainly include socioeconomic responses and ecological civilization responses. The four selected indicators are total social labor productivity, public transport vehicles per 10,000 people, proportion of tertiary industry and environmental protection expenditure as a proportion of fiscal expenditure. The specific indicator system is shown in Table 1.

Table 1.
Indicator system for the green development level in Northeast China.
2.2.2. Entropy Weight TOPSIS Model
The TOPSIS model provides a comprehensive evaluation method using distance as the evaluation standard. The model evaluates the regional green development level by calculating the relative proximity of an evaluation value to its ideal solutions, which is then used to rank the evaluation values [39]. However, the weight of each indicator is too rough in the evaluation process, resulting in deviations in practical application. For this reason, the entropy weight TOPSIS model is introduced in this paper, as it can effectively eliminate the influence of subjective factors and scientifically and objectively reflect the regional green development level. The basic calculation steps are as follows [39,41].
Step 1. Calculate the standardized evaluation matrix.
The original evaluation matrix is set as . To eliminate the impact of different dimensions on the evaluation results, the indicators are first standardized to form , namely, a standardized evaluation matrix.
The benefit criterion indicator is calculated as follows:
The cost criterion indicator is calculated as follows:
where xij, yij, min xj and max xj represent the original value, the standard value, the minimum value and the maximum value of the i indicator in the j year, respectively.
Step 2. Determine the indicator weights.
The entropy weight method can effectively and objectively reflect the importance of the indicators, making it suitable for the comprehensive evaluation of multivariate indicators. The formula is calculated as follows:
where wi, Ei and pij represent the weight, information entropy and characteristic-specific gravity of the i indicator, respectively, and . The specific indicator weight is shown in Table 1.
Step 3. Weight the normalization evaluation matrix.
Entropy weight wi is used to construct the normalization evaluation matrix .
Step 4. Determine the positive (negative) ideal solution.
Let S+j and S−j be the maximum and minimum evaluation values of the i indicator in the j year, namely, the positive and negative ideal solutions.
Step 5. Calculate the Euclidean distance between the evaluation values and the positive (negative) ideal solution.
Let D+j be the distance between indicator i and indicator S+j; similarly, let D−j be the distance between indicator i and indicator −j.
Step 6. Calculate the relative proximity to the ideal solution.
Let Tj be the relative proximity to the ideal solution in year j.
Obviously, Tj ∈ (0, 1). When Tj tends to 1, it indicates that the evaluation object is more proximate to the ideal solution, and when it tends to 0, it indicates greater distance.
2.2.3. Obstacle Model
The obstacle degree model is usually applied to analyze the negative contribution of an individual indicator to the whole system, namely, the degree to which an individual indicator hinders and restricts the green development level. Therefore, this paper introduces the factor contribution, indicator deviation, and obstacle degree to identify and diagnose the obstacle factors affecting the green development level in Northeast China. The calculation method is as follows:
where Ii is the degree to which indicator i presents an obstacle, oij is indicator i’s deviation in year j, , yij is the standard value of indicator i in year j, and wi is factor i’s contribution (indicator i’s weight).
3. Empirical Results
3.1. Characteristics of the Temporal Evolution of Green Development
Using the indicator system and evaluation model constructed above, the green development level and the scores of its constituent elements are calculated for Northeast China from 2008 to 2017, as shown in Figure 2.
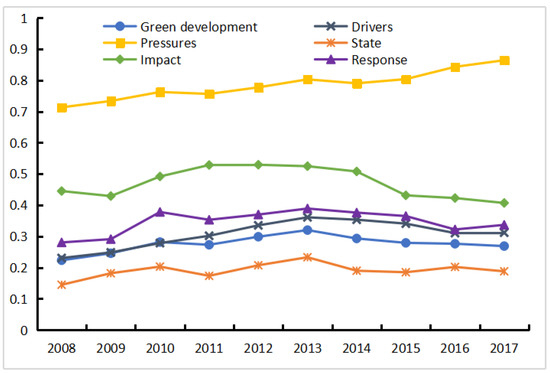
Figure 2.
The green development level and its constituent elements in Northeast China.
At the regional level, from 2008 to 2017, green development level in Northeast China rose, with its score increasing from 0.2234 to 0.2688, but the average annual growth rate was only 2.08. In stages, the green development level in the Northeastern region continued to rise from 2008 to 2013, mainly thanks to the Northeast revitalization strategy and a series of energy conservation and emission reduction policy implementations, so ecological protection and ecological civilization construction have achieved considerable results. The green development level in the Northeastern region declined from 2013 to 2017; the root cause of this decline is the returning problem of a stalled Northeast economy and weak growth. Moreover, local governments are under pressure to maintain growth, so they are beginning to increase investment in resource- and energy-intensive industries and ignoring the potential problems that will stem from sacrificing resources and the environment in exchange for economic growth. From the constituent elements of the green development level, an overall decline in the 10-year impact index was observed (the score dropped from 0.4451 in 2008 to 0.4069 in 2017, for an average annual decline rate of 0.99), the remaining constituent elements show different degrees of increases. For example, the driving force index rose from 0.2305 in 2008 to 0.3119 in 2017, the pressure index rose from 0.7133 in 2008 to 0.8643 in 2017, the state index rose from 0.1449 in 2008 to 0.1880 in 2017, the response index rose from 0.2805 in 2008 to 0.3368 in 2017, and the average annual growth rates for these indexes were 3.42%, 2.16%, 2.94% and 2.05%, respectively. These results also clearly demonstrate that ignoring resource and environmental protection ensures long-term and stable economic growth in Northeast China, which further threatens the sustainable and healthy development of the social economy and the improvement and promotion of human wellbeing.
At the municipal level, from 2008 to 2017, with the exception of Anshan, Tieling and Jixi, the green development level of the remaining 31 cities showed upward trends of differing degrees. The green development level of Changchun, Liaoyuan, Haerbin, Mudanjiang and Heihe had the most significant increase, with scores increasing from 0.2223, 0.1665, 0.2144, 0.2518, and 0.3147 in 2008 to 0.3125, 0.2680, 0.2941, 0.3518, and 0.4466 in 2017, respectively. The average annual growth rates were 3.86%, 5.43%, 3.58%, 3.78% and 3.97%. Changchun and Haerbin, as the political, economic, cultural, social, scientific and technological innovation centers of Jilin and Heilongjiang provinces, also represent the development core of the Ha-Chang urban agglomeration, which gives them unique advantages in the process of green transformation and enormous potential for regional green development. Since Liaoyuan joined the first pilot targeting the economic transformation of resource-based cities in China in 2005, its industrial structure has become “cleaner” and “lighter”, and the ecological affinity of its regional economic development has also gradually increased. Mudanjiang and Heihe are an important bridge from Northeast China to the outside world and allow participation in the international division of labor, making them also important node cities in the revitalizing Northeast China strategy and Russian Far East development strategy. With policy, financial and technological support, the development of regional export-oriented economies and green ecological economies is improving.
3.2. Spatial Distribution Characteristics of the Green Development Level
Calculation results based on the coefficient of variation of the green development level and its constituent elements are shown in Figure 3. The coefficient of variation of the green development level in Northeast China increased from 0.1867 in 2008 to 0.2353 in 2017, indicating that the spatial difference in the green development level in Northeast China has gradually changed from a small gap at an overall low level to a large gap at an overall high level. Examining the constituent elements of the green development level, with the exception of the downward trend of the coefficient of variation of the pressure index (the score from 0.2384 in 2008 to 0.1165 in 2017), the coefficient of variation of the driving force index, the state index, the impact index and the response index all showed individual upward trends over the 10 years, with scores increasing from 0.3359, 0.4437, 0.3214, and 0.2305 in 2008 to 0.3587, 0.5651, 0.3480, and 0.2811 in 2017. The coefficient variation of the state index is the greatest, indicating that the difference in the state index is the primary factor driving differences in the green development level between cities in Northeast China. In contrast, the coefficient of variation of the driving force index shows minimal variation. However, the difference in green development level between cities in Northeast China has not been effectively improved. This perspective can be further supported by the specific values of the coefficient of variation. During the research period, the regional difference in the state index > the regional difference in the driving force index > the regional difference in the impact index > the regional difference in the response index > the regional difference in the pressure index, indicating that it is urgent to strengthen ecological protection to maintain the stability of green ecological space, accelerate green growth to promote the expansion of green production space, and actively improve infrastructure construction to create a good green living space in those regions with a lower green development level in Northeast China.
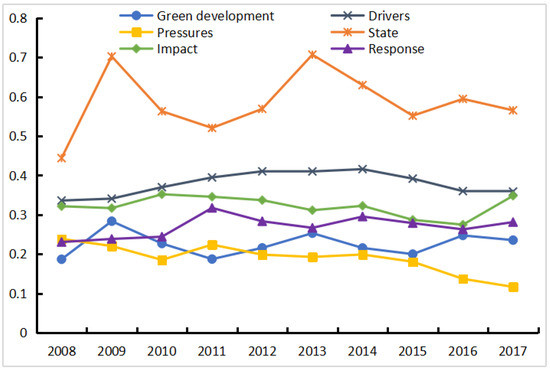
Figure 3.
The coefficient of variation for the green development level and its constituent elements in Northeast China.
To further explore the spatial distribution and evolution of the green development level and determine their characteristics and laws, the natural breaks method in ArcGIS 10.2 software was used to divide 34 cities in Northeast China in 2008, 2011, 2014 and 2017 into four types, as shown in Figure 4: high level, medium-high level, medium-low level and low level [1,43]. During the research period, the spatial pattern of the green development level in Northeast China presented a distribution characterized by a north to south decrease and an obvious spatial agglomeration effect. Specifically, for Northeast China, the northern regions mostly have high and medium-high green development. Because of the diversity and integrity of the ecosystem, to maintain the necessary agricultural production and green ecological space, local governments often vigorously support emerging energy-saving and environmentally friendly industries through financial transfer and ecological compensation to stimulate green economic growth and improve the green development level. The central regions are mostly medium–high -level green development regions and have strong spatial robustness characteristics. Because of their internally focused economy, the central regions are relatively less affected by the international financial crisis and technical barriers. Therefore, the green development level has maintained medium–high rapid steady growth over a long period. The southern regions are mostly low and medium–low-level green development regions. These regions have seen prominent structural problems in their economic development accumulating over a long period, which, coupled with gradually emerging problems of rigid institutional mechanisms and a lack of vitality in enterprise innovation and development, makes achieving sustainable regional development more difficult. From the perspective of spatial evolution, the number of high and medium–high-level green development regions decreased from 8 and 14 in 2008 to 4 and 12 in 2017, respectively, and the number of medium-low and low green development regions increased from 8 and 4 in 2008 to 11 and 7 in 2017, respectively. This clearly indicates that improving the quality and efficiency of green development in Northeast China is not an overnight process but a long and arduous process, and it remains necessary to further explore and practice new green development modes and choices in the future.
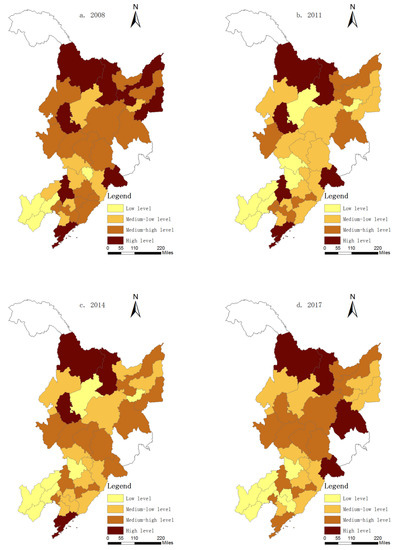
Figure 4.
Spatial differentiation and evolution of the green development level in Northeast China. Spatial differentiation of the green development level in Northeast China in (a) 2008; (b) 2011; (c) 2014; (d) 2017.
3.3. Obstacle to the Green Development Level
To reveal the causes of the above spatial-temporal distribution and extract the factors that restrict and hinder the green development level, this paper introduces the obstacle degree model to conduct a diagnostic analysis and obtained the top five obstacles for the 34 cities in Northeast China in 2008, 2011, 2014 and 2017.
The frequency results show that the top five factors impeding the green development level in Northeast China in 2008 are ranked S1 > D2 > D1 > S2 > R4, in 2011 are ranked S1 > D2 > S2 > D1 > R4, in 2014 are ranked S1 > S2 > D1 > D2 > I4, and in 2017 are ranked S1 > D1 > S2 > D2 > I4. The study found that S1 (per capita water resources), D1 (per capita GDP), S2 (per capita cultivated land area) and D2 (per capita fixed asset investment) are the key factors restricting improvements in the green development level in Northeast China. S1 is the primary obstacle throughout and shows relative stability in the intensity with which it impedes the green development level; the green development level is clearly inseparable from the shortage and the spatially–temporally uneven distribution of water resources in Northeast China. In the future, to optimize and upgrade the green development level in Northeast China, it will be the most important to resolve the problem of water resource shortages and meet the needs of socioeconomic development. D1 and S2 rose from the third and fourth obstacle ranking in 2008 to the second and third in 2017, and the intensity with which they impede the green development level gradually increased, again confirming that cities in Northeast China are under pressure to guarantee growth and strongly pursue economic benefits and output maximization, resulting in the high occupation and consumption of material and energy resources, ultimately constraining the overall optimization and promotion of the green development level in Northeast China. The ranking of D2 dropped from second in 2008 to fourth in 2017, and the intensity with which it obstructed the green development level gradually weakened, but it remains an important obstacle, mainly due to the scale and growth of fixed asset investment, which are closely related to Northeast China’s economic growth. In addition, I4 rose from a ranking of sixth in 2008 to fifth in 2017, and the intensity of its effect on the green development level is gradually increasing, indicating that the impact of the fiscal self-sufficiency rate on the green development level is also increasing. In the future, ensuring that government expenditure is better used to improve people’s livelihood should be the main focus of further optimization and upgrading in the green development level in Northeast China.
4. Discussion
Northeast China, as an important old industrial base, commodity grain production area and ecological function area, has undertaken not only rapid socioeconomic development but also intensive resource exploitation and rational ecological protection [44]. However, at present, attention to environmental problems are not effectively integrated with the pursuit of economic growth in Northeast China on a scientific platform of green development research, which seriously affects the value obtained from the practical application of green development research results. To clarify the spatial-temporal evolution characteristics of the green development level and reveal its influencing mechanism in Northeast China, this paper takes the theory of coordinated human–earth relationships from geographical research as the basis and the conceptual paradigm of the process–pattern mechanism as the starting point and carries out a quantitative analysis of samples from 34 prefectural cities in Northeast China.
A major innovation of this research is the introduction of a DPSIR model for the comprehensive evaluation of the green development level. Specifically, the indicator system for the green development level based on the DPSIR model emphasizes the causal relationship between socioeconomic activities and the geographical environment. Compared with the traditional evaluation method, which reveals only the surface conditions, the DPSIR model can fully consider the factors influencing green development, such as the economy, society, ecology, the environment, technology and management. While scientifically and objectively portraying the factors, problems, current situation and countermeasures needed for green development, it can highlight the relationships between the natural environment, resources and human beings, support the overall management of the internal elements of green development, and provide a scientific and effective basis for decision makers. Moreover, based on the introduction of the DPSIR model to construct the evaluation indicator system, another innovation of this research is its use of the entropy weight TOPSIS model to explore the green development level horizontally and vertically. Specifically, the entropy weight TOPSIS model, which is a basic decision technology in system engineering, is commonly applied to resolve the multi-objective decision problem of a finite scheme, as its calculation process is simple and practical, and its evaluation results are scientific and objective. This method can provide not only good methodological support for the multidimensional analysis of the green development level but also a realistic basis for evaluating the direction of the green development level.
Overall, three main findings can be drawn from this research. First, during the research period, most cities in Northeast China show a rising benign green development level, but there are some differences in the range of this rise. Among them, the green development levels of Changchun, Liaoyuan, Haerbin, Mudanjiang and Heihe increased the most significantly, and they showed a relatively ideal green development trend. Changchun and Haerbin, as comprehensive cities, are the growth poles of the regional economy and convergence sites for various flows, giving the, unique advantages in promoting economic green transformation. Although Liaoyuan is a resource-based city, after more than a decade of economic transformation development, its industrial structure has become “cleaner” and “lighter”, and the regional ecological affinity of its economic system has also gradually increased. Mudanjiang and Heihe, as the open border cities, were able to develop and expand emerging industries with the support of national policies, funds and technology, and their regional export-oriented economy has gradually formed. Therefore, for the cities in Northeast China, in the process of promoting green development, efforts should be made to overcome the problems of inefficiency in socioeconomic growth and to continuously enhance ecological protection and environmental governance to consolidate their existing green development level. Moreover, it is essential to promote incremental increases in green development levels based on local conditions through the ingestion, absorption and combination of each city’s internal characteristics with lessons from the successful experiences of different types of cities. Second, the spatial pattern of the green development level of cities in Northeast China shows a decreasing distribution from north to south and obvious spatial agglomeration effects. Interestingly, this research has specific findings that fail to prove an entirely positive correlation between the economic development level and green development level of cities in Northeast China. That is, cities with higher economic development levels do not necessarily also have higher green development levels, while cities with lower economic development levels can reach higher green development levels. This phenomenon may be related to the regional resource and environmental carrying capacity. For example, Heihe, Yichun, Mudanjiang, Baicheng and other cities with rich natural resources and a good ecological environment, due to limitations in their own development direction and functional orientation (cities are mostly ecological protected areas or fragile ecosystem areas), have a relatively narrow industrial structure and a relatively simple industrial system, leading to fewer difficulties in the green and low-carbon transformation and upgrading of their economies. Moreover, with policy and financial support, these cities can quickly realize a green economy. In contrast, cities such as Haerbin, Daqing, Shenyang, Dalian and others with good location conditions and a large economic scale, due to rapid socioeconomic development, have a high intensity of human activities, exceeding the supply of resources and the environmental endowment. That is, the superposition of highly intense human activities and a low supply ecological environment results in a great increase in the difficulty coefficient of cities’ green development. This shows that in the process of promoting regional green development, Northeast China must correctly address the coordinated development of humans and nature or of the economy and the environment. Moreover, the scale and intensity of human activities must be kept within the limits of regional resources and environmental carrying capacity. Third, the mechanism influencing spatial-temporal variation in the green development level in Northeast China is not identical across cities. Resource endowment conditions, economic development status and government investment scale play vital roles in changes in the regional green development level, which leads to diverse characteristics in different evolutionary stages of the regional green development level. However, against the background of a nation vigorously promoting the construction of an ecological civilization and rapid economic transformation and upgrading, the factors influencing the green development level in Northeast China are becoming increasingly complex, while the intensity of individual factors is weakening. In the future, we should fully consider the role of urbanization, industrial structure, population density, institutional mechanisms, environmental protection supervision, scientific and technological progress and other factors on the green development level in Northeast China and seek an important entry point to achieve regional human–earth coordination.
5. Conclusions
Green development is the core research field of human–earth relationship systems; similarly, human–earth relationship systems are a basic main stream and important topical area of geography research. This paper adopts the DPSIR model to construct an indicator system of the green development level in Northeast China by considering economic, societal, resource and environmental aspects, applying the entropy weight TOPSIS model, obstacle model and GIS spatial visualization method to analyze the spatial-temporal pattern and obstacles to the green development level of 34 prefectural cities in Northeast China from 2008 to 2017. The empirical analysis results are presented below. (1) From a temporal perspective, from 2008 to 2017, the green development level in Northeast China showed an overall upward trend, but the growth rate was relatively slow. The reason is that the problem of weak economic growth in Northeast China has continued to ferment, while local governments continue to be pressured to maintain growth, which leads resources and the environment to be sacrificed in exchange for economic growth, resulting in a gradual decrease in the ecological affinity of regional development, threatening the sustained and healthy growth of green development in Northeast China. (2) From a spatial perspective, the spatial evolution of the green development level in Northeast China gradually shifted from a small gap at an overall low level in 2008 to a large gap at an overall high level in 2017. Moreover, the spatial pattern of the green development level in Northeast China shows a decreasing distribution from north to south and an obvious spatial agglomeration effect. Specifically, for Northeast China, the high- and medium–high-level green development regions are mainly distributed in the northern and central regions, and the low and medium–low green development regions are mainly distributed in south, and their number is gradually increasing; this indicates that the quality and efficiency of green development in Northeast China cannot be improved overnight but will be a long and arduous process. (3) The spatial-temporal difference in the green development levels in Northeast China is the result of multiple factors, among which, per capita water resources, per capita GDP, per capita cultivated land area and per capita fixed asset investment are the key factors affecting improvement in the green development level in Northeast China. This finding indicates that an urgent need exists to coordinate the contradiction between the supply capacity of resource endowments and the rapid growth in the social economy as the primary task for improving the green development level in Northeast China.
Three aspects exist in the contribution of this paper. First, instead of applying traditional mathematical reasoning and econometric analysis, our research seeks the rules covering spatial-temporal heterogeneity and mechanisms influencing green development considering geographical process–pattern mechanisms, which provides a new perspective for green development research. Second, using the DPSIR model, our research constructs a scientific and reasonable indicator system for the green development level, which can provide a good theoretical framework for evaluating green development levels. Third, our research not only has practical significance for the green development of 34 prefectural cities in Northeast China but also offers a useful reference for the green development of other cities in China.
Suggested countermeasures derived from the empirical findings and regional situation are provided as follows. (1) Establish and perfect the performance evaluation system so that it is in accord with the green development view and is conducive to promoting ecological civilization construction. Specifically, change the traditional GDP development view, strengthen the evaluation of regional public services, social management and sustainable development ability, require the government, enterprises and the public to more fully consider ecological environment protection while pursuing economic interests, firmly establish the concept of coordinated human–earth coordinated, and promote the formation of a performance appraisal evaluation system that accords with the requirements of ecological civilization construction. (2) Implement differentiated green development strategies and promote synergistic regional development. Specifically, adopt a green development strategy guided by local conditions and classification while considering the carrying capacity, development intensity and development potential of different types of regions to establish cross-regional green development linkages and compensation mechanisms. Combine these mechanisms with the economic, social, political, cultural and technological conditions of each region to gradually reduce internal differences and realize regional synergistic development. (3) Strengthen government policy guidance and supervision and green development management system innovation. Specifically, formulate strict pollution emission standards and environmental protection systems, strengthen the power of government supervision and management, raise the threshold for environmental protection access, and strictly identify and penalize regions where environmental quality exceeds the standard. Moreover, accelerate the improvement of green development incentive mechanisms and guidance mechanisms and actively cultivate and support high-tech industries, emerging industries and other environmental protection industries to provide strong industrial support for regional green development.
The evolution characteristic of spatial-temporal pattern of green development level is the inevitable result of multi-factor circulation accumulation, and it is also the natural embodiment of the socioeconomic development law. Although our research offers some positive achievements and insights, there are still several limitations and room for further investigation. In view of the limitation of statistical data and the difference of statistical caliber, constructing a comprehensive evaluation indicator system to reflect the regional green development is facing great challenges. In selecting the evaluation indicators for the green development level, our research considers only the key measurable indicators, such as economic indicators, social indicators, resource indicators, and environmental indicators, and neglects other factors that affect green development, including markets, technology, policies, regimes, and culture. In future work, our research should establish as far as possible a more comprehensive evaluation indicator system to obtain more scientific results. In addition, our research also preliminarily found that there is the phenomenon of agglomeration development in similar areas of green development level in Northeast China, but our research did not further track and explore this field. The future research can clarify the spatial interaction of various green development factors from the perspective of geographical spatial heterogeneity and spatial correlation, and reveal the mechanism behind the spatial interaction of multiple elements at various scales to further expand the research perspectives of green development.
Author Contributions
Conceptualization, Y.S.; Data curation, L.T.; Formal analysis, L.T.; Writing–original draft preparation, Y.S.; Writing–review and editing, Y.S., L.T. and D.L. All authors have read and agreed to the published version of the manuscript.
Funding
This work was supported by the National Natural Science Foundation of China (41771138 and 41771161).
Conflicts of Interest
The authors declare no conflict of interest.
References
- Cheng, Y.; Wang, J.; Wang, Y.; Ren, J. A comparative research of the spatial-temporal evolution track and influence mechanism of green development in China. Geogr. Res. 2019, 38, 2745–2765. [Google Scholar]
- Malthus, T.R. Principle of Population; The Macmillan Company: New York, NY, USA, 1923. [Google Scholar]
- Ricardo, D. On the Principles of Political Economy and Taxation; Kessinger Publishing, LLC: Whitefish, MT, USA, 2010. [Google Scholar]
- Marsh, G.P. The Earth as Modified by Human Action: A New Edition of Man and Nature; Adamant Media Corporation: Boston, MA, USA, 2001. [Google Scholar]
- Valentinov, V. Demand, supply, and sustainability: Reflections on Kenneth Boulding’s evolutionary economics. Soc. Natur. Resour. 2015, 28, 1216–1232. [Google Scholar] [CrossRef]
- Jänicke, M. “Green Growth”: From a growing eco-industry to a sustainable economy. Energy Policy 2011, 48, 13–21. [Google Scholar] [CrossRef]
- Barbier, E.B. A global green new deal: Rethinking the economic recovery. Choice Rev. Online 2011, 48, 48. [Google Scholar] [CrossRef]
- Wang, M.-X.; Zhao, H.-H.; Cui, J.-X.; Fan, D.; Lv, B.; Wang, G.; Li, Z.-H.; Zhou, G.-J. Evaluating green development level of nine cities within the Pearl River Delta, China. J. Clean. Prod. 2018, 174, 315–323. [Google Scholar] [CrossRef]
- Skea, J.; Nishiok, S. Policies and practices for a low-carbon society. Clim. Policy (Earthscan) 2008, 8, 5–16. [Google Scholar] [CrossRef]
- UNEP. Green Economy Indicators-Brief Paper; UNEP: Nairobi, Kenya, 2012. [Google Scholar]
- Song, M.; Wang, S. Measuring environment-biased technological progress considering energy saving and emission reduction. Process. Saf. Environ. Prot. 2018, 116, 745–753. [Google Scholar] [CrossRef]
- OECD Green Growth Studies. Green Growth Indicators 2014; OECD Publishing: Paris, France, 2014. [Google Scholar]
- World Bank. Inclusive Green Growth: The Pathway to Sustainable Development; World Bank Publications: Washington, DC, USA, 2012. [Google Scholar]
- Yang, C.; Zhu, Y. Research progress overview of international green development. J. Cent. South For. Tech. Univ. (Soc. Sci.) 2015, 9, 43–50. [Google Scholar]
- UNEP. Towards a Green Economy: Pathways to Sustainable Development and Poverty Eradication. A Synthesis for Policy Makers; UNEP: Nairobi, Kenya, 2011. [Google Scholar]
- OECD. Towards Green Growth: Monitoring Progress OECD Indicator; OECD: Paris, France, 2011. [Google Scholar]
- Reardon, J. Comments on ‘Green economics: Setting the scene. Aims, context, and philosophical underpinnings of the distinctive new solutions offered by green economics’. Int. J. Green Econ. 2007, 1, 532. [Google Scholar] [CrossRef]
- Bartelmus, P. The future we want: Green growth or sustainable development? Environ. Dev. 2013, 7, 165–170. [Google Scholar] [CrossRef]
- Zhu, D.; Liu, Q. In the frontier exploration of sustainable development and green economy—Interview with Professor Zhu Dajian. Acad. Mon. 2013, 45, 170–176. [Google Scholar]
- Hu, A.; Zhou, S. Green development: Functional definition, mechanism analysis and development strategy. China Popul. Resour. Environ. 2014, 24, 14–20. [Google Scholar]
- OECD. Towards Green Growth: A Summary for Policy Makers; OECD: Paris, France, 2011. [Google Scholar]
- UNEP. Green Economy: Cities Investing in Energy and Resource Efficiency; UNEP: Nairobi, Kenya, 2011. [Google Scholar]
- Beijing Normal University, National Bureau of Statistics. 2016 China Green Development Index Report: Regional Comparison; Beijing Normal University Press: Beijing, China, 2016. [Google Scholar]
- Kim, S.E.; Kim, H.; Chae, Y. A new approach to measuring green growth: Application to the OECD and Korea. Future 2014, 63, 37–48. [Google Scholar] [CrossRef]
- Lyytimäki, J.; Antikainen, R.; Hokkanen, J.; Koskela, S.; Kurppa, S.; Känkänen, R.; Seppälä, J. Developing key indicators of green growth. Sustain. Dev. 2018, 26, 51–64. [Google Scholar] [CrossRef]
- Li, X.; Liu, Y.; Song, T. Calculation of the green development index. Soc. Sci. China 2014, 35, 69–95, 207–208. [Google Scholar]
- Zhu, D. Research from global Sustainable Development Goals (SDGs) to sustainability science based on the object-subject-process framework. Chin. J. Popul. Resour. Environ. 2017, 15, 8–20. [Google Scholar] [CrossRef]
- Wu, H.; Yu, Y.; Li, S.; Huang, K. An empirical study of the assessment of green development in Beijing, China: Considering resource depletion, environmental damage and ecological benefits simultaneously. Sustainability 2018, 10, 719. [Google Scholar] [CrossRef]
- Shao, S.; Luan, R.; Yang, Z.; Li, C. Does directed technological change get greener: Empirical evidence from Shanghai’s industrial green development transformation. Ecol. Indic. 2016, 69, 758–770. [Google Scholar] [CrossRef]
- Lv, X.; Lu, X.; Fu, G.; Wu, C. A spatial-temporal approach to evaluate the dynamic evolution of green growth in China. Sustainability 2018, 10, 2341. [Google Scholar] [CrossRef]
- Zhang, J.; Chang, Y.; Zhang, L.; Li, D. Do technological innovations promote urban green development?—A spatial econometric analysis of 105 cities in China. J. Clean. Prod. 2018, 182, 395–403. [Google Scholar] [CrossRef]
- Chen, L.; Zhang, X.; He, F.; Yuan, R. Regional green development level and its spatial relationship under the constraints of haze in China. J. Clean. Prod. 2019, 210, 376–387. [Google Scholar] [CrossRef]
- Rüstemoğlu, H. Factors affecting Germany’s green development over 1990–2015: A comprehensive environmental analysis. Environ. Sci. Pollut. Res. 2019, 26, 6636–6651. [Google Scholar] [CrossRef] [PubMed]
- UNEP. Global green new deal policy brief. Am. Ceram. Soc. Bull. 2009, 88, 15. [Google Scholar]
- Carfi, D.; Schilirò, D.; Schiliro’, D. A coopetitive model for the green economy. Econ. Model. 2012, 29, 1215–1219. [Google Scholar] [CrossRef]
- Reilly, J.M. Green growth and the efficient use of natural resources. Energy Econ. 2012, 34, S85–S93. [Google Scholar] [CrossRef]
- Li, X.; Zhao, Z. Thinking and advice about the green transformation and upgrading of traditional steel industry under the innovation concept based on the investigation of Daqiuzhuang Steel Industry. Sci. Tech. Manage. Res. 2015, 35, 130–134. [Google Scholar]
- Liu, H. Research on the Government Conduct in Promoting Green Development. Master’s Thesis, Guangzhou University, Guangzhou, China, 2016. [Google Scholar]
- Li, W.; Yi, P.; Zhang, D. Sustainability evaluation of cities in northeastern China using dynamic TOPSIS-entropy methods. Sustainability 2018, 10, 4542. [Google Scholar] [CrossRef]
- Guo, F.; Hou, A.; Tong, L.; Ma, Z. Spatio-temporal pattern and influencing factors of green development in the Northeast Restricted Development Zone since the Revitalization of the Northeast China. Econ. Geogr. 2018, 38, 58–66. [Google Scholar]
- Wang, M.; Li, Z.; Gong, Q.; Ji, Z. Measurement of regional green economy sustainable development ability based on entropy weight-topsis-coupling coordination degree—A case study in Shandong province, China. Sustainability 2019, 11, 280. [Google Scholar] [CrossRef]
- Zhang, X.; Wei, F.; Yuan, X. Evaluation and evolution of provincial high-quality green development in China. Econ. Geogr. 2020, 40, 108–116. [Google Scholar]
- Guo, Y.; Tong, L.; Mei, L. The effect of industrial agglomeration on green development efficiency in northeast China since the revitalization. J. Clean. Prod. 2020, 258, 120584. [Google Scholar] [CrossRef]
- Fan, J. Frontier approach of the sustainable process and pattern of human-environment system. Acta Geogr. Sin. 2014, 69, 1060–1068. [Google Scholar]


Publisher’s Note: MDPI stays neutral with regard to jurisdictional claims in published maps and institutional affiliations. |
© 2020 by the authors. Licensee MDPI, Basel, Switzerland. This article is an open access article distributed under the terms and conditions of the Creative Commons Attribution (CC BY) license (http://creativecommons.org/licenses/by/4.0/).