Article

Resilience Assessment Framework for Nature Based Solutions in Stormwater Management and Control: Application to Cities with Different Resilience Maturity

1
Urban Water Unit, National Civil Engineering Laboratory, LNEC, Av. Brasil 101, 1700-066 Lisbon, Portugal
2
CERIS, Instituto Superior Técnico, Universidade de Lisboa, Av. Rovisco Pais, 1049-001 Lisbon, Portugal
*
Author to whom correspondence should be addressed.
Sustainability 2020, 12(23), 10040; https://doi.org/10.3390/su122310040
Submission received: 14 October 2020 / Revised: 25 November 2020 / Accepted: 27 November 2020 / Published: 1 December 2020
(This article belongs to the Special Issue Urban Resilience in a Context of Climate Change)

Abstract

:
Cities face unprecedented demographic, environmental, economic, social, and spatial challenges. In recent years, the implementation of nature-based solutions (NBS) is becoming more relevant in cities to improve urban resilience and to cope with climate change. NBS represent cost effective solutions that simultaneously provide environmental, social, and economic benefits and help build resilience. A comprehensive and multi-dimension Resilience Assessment Framework (RAF) to evaluate the NBS contribution to urban resilience, focused on NBS for stormwater management and control, was developed. This RAF is aligned with the RESCCUE RAF and the main assessment frameworks focused on NBS and urban resilience. This RAF for NBS is driven by the definition of resilience objectives and is able to evaluate short- and long-term changes, considering a comprehensive definition of the urban resilience and addressing the environmental, social, and economic capabilities. Regarding the initial resilience maturity and the available information in the city, three analysis degrees were proposed for the RAF application, namely, the essential, complementary, and comprehensive degrees, for which a pre-defined selection of metrics is proposed. This paper aims to present the application of the RAF essential analysis degree and its extensive validation regarding cities with different resilience maturity and available information. The application to seven cities with different resilience and NBS challenges allowed an in-depth validation of the pre-defined metrics included in the RAF essential analysis. In this sense, the analysis of the resilience maturity of the participating cities is presented, the main challenges and consolidated aspects in the cities are identified, and the cities ready to apply the complementary analysis degree are recognized. To conclude, to validate the essential analysis degree, the assessment of the main requirements of the RAF for NBS are verified, based on the RAF metrics results for the cities. In this light, the main requirements of the RAF for NBS were aggregated in three main categories, namely, NBS aspects, resilience capabilities, and the performance, risk and cost analysis.

1. Introduction

Over the last decade, the emergence of the urban resilience and nature-based solutions (NBS) concepts has offered the opportunity to deal with the current challenges in cities from a sustainable and resource efficient perspective. Building resilience represents a crucial challenge for governments and organizations [1], clearly identified and supported by the global long-term agendas, such as the Paris Agreement on Climate Change, the New Urban Agenda 2030, or the Sendai Framework for Disaster Risk Reduction 2015–2030. With focus on urban resilience, several studies have been carried out to date [2,3], specially focused on the water sector and on water supply and urban drainage approaches [4,5,6].
NBS play an important role to achieve the goals of the United Nation Agenda 2030 for sustainable development [7,8] and of the other global long term agendas, such as the Paris Agreement on Climate Change [9]. In European cities, the NBS implementation has been promoted over the past years as viable solutions to urban challenges such as climate change, urban degeneration, and aging infrastructures [10]. NBS can be defined as living solutions inspired by, continuously supported by, and using nature, which are designed to address several societal challenges from a resource-efficient perspective and to provide economic and environmental benefits simultaneously [11].
Within stormwater management and control, some studies mainly focused on specific ecosystem services or benefits provided by NBS implementation have been carried out to date [12,13,14,15]. Nevertheless, enhancing the evidence and knowledge base to support the identification of specific strategies for NBS planning, designing, and implementing and its cost efficiency, related to the conventional grey approaches, still represents a current need [16,17]. Regarding the NBS evaluation, some assessment approaches focused on relevant aspects such as NBS effectiveness in the face of climate change or supporting the NBS design and impact assessment for climate resilience [16,18,19] have been published. In these assessment approaches, urban resilience is indirectly considered, but it is not the main focus.
A broader analysis of the NBS contribution to urban resilience, along with assessment tools able to demonstrate their long-term value, is needed [13]. A stronger evidence base, focused on the multiple NBS benefits and co-benefits, and assessment frameworks to support its evaluation are required [17]. Promoting the NBS application and increasing the evidence and knowledge base, grounded on their implementation across different urban scales and contexts, helps to upscale NBS interventions. To ensure the transference of successful approaches between countries, communities, and case studies, the stakeholders’ involvement on NBS design, planning, and implementation is crucial [19].
The methodology proposed in the present paper is based on the application of a specific RAF to assess the NBS contribution to urban resilience with a focus on solutions for stormwater management and control, previously developed in [20]. The RAF application can be adapted to cities with different resilient maturity and available information. In this sense, different analysis degrees and a set of corresponding pre-selected metrics are proposed, progressively providing a more in-depth assessment, namely, the essential, complementary, and comprehensive degrees. To support the RAF in cities with less resilience maturity and available information, the essential analysis degree was proposed, focusing on the assessment of key NBS aspects that should be considered for any city. In this paper, the application of the RAF essential analysis degree and its adequacy to cities with less resilience is demonstrated.
This paper aims to present the application of the RAF essential analysis degree to the participating cities and to validate its application regarding cities with different resilience maturity and available information. Seven cities with different challenges regarding urban resilience and NBS were involved in this extensive validation. In essence, the assessment of the resilience maturity of the participating cities is analysed. The main challenges and consolidated aspects are also identified and the cities ready to apply the complementary analysis degree are recognized. Last, the main requirements’ assessment of the RAF for NBS are verified in order to validate the essential analysis degree, based on RAF metrics results to the cities.
In this sense, the RAF essential analysis degree is applied to seven participating cities with different international and urban context and different challenges regarding urban resilience and NBS. These cities were selected since they are closely engaged to urban resilience, greening development, and other concerns related to stormwater management and control and NBS. These cities are, namely, Almada (Portugal), Barcelona (Spain), Bristol (UK), Coimbra (Portugal), Lisbon (Portugal), Porto (Portugal), and Vancouver (Canada). The main contributions of this paper are to (i) identify the resilience maturity of the cities; (ii) identify the main challenges to enhance the NBS contribution to urban resilience and the consolidated aspects in the cities; and (iii) validate the adequacy of the RAF essential analysis degree, based on its application to the cities.

2. Material and Methods

2.1. Background

A comprehensive and multi-dimension RAF to evaluate the contribution of NBS to urban resilience was developed in [20], focused on NBS for stormwater management and control. This assessment framework is grounded in the definition of resilience objectives and assessment criteria, based on the structure proposed in the ISO 24,500 standards [21,22,23]. The several NBS contributions to urban resilience are considered in the RAF by the objectives’ definition. Subsequently, the different points of view of the resilience objectives are then evaluated through assessment criteria. The proposed objectives are grouped in two resilience dimensions, namely, the integration of the NBS at city level (Dimension I) and the operation and service of the NBS (Dimension II).
For an oriented assessment of the criteria, qualitative and quantitative metrics are defined. Regarding the different information sources and complexity, three types of metrics were proposed, namely: (i) data based (whenever determined considering usually available common data); (ii) procedure based (when determined through the application of a specific straightforward procedure); and (iii) model based (when determined through the application of a mathematical model or, alternatively for a few metrics, based on in situ monitoring) [20].
After the calculation of the value for each metric, the proposed metrics are classified by associating each answer to a resilience development level between 0 and 3. The correspondence between each metric value and the resilience level was defined based on reference values from the literature review. Resilience development levels reflect the maturity of the metric value achieved, namely: (i) incipient [0–1], for non-existent aspects or those at an early stage of development; (ii) progressing ]1–2], when significant steps have already been taken; or (iii) advanced ]2,3], for consolidated resilience results [24].
The RAF aims to support the diagnosis, decision-making, implementation, planning, and management of the NBS and to identify solutions with potential to contribute to city resilience. The application of the RAF for NBS also helps to identify the information maturity and the main existing gaps in the city.
In this framework, urban resilience is defined as a city’s ability to absorb disturbances, learn from the past, adapt, transform, and prepare for the future. In this sense, the resilience capabilities adopted in the RAF for NBS correspond to absorb, learn, adapt, transform, and prepare. Moreover, the analysis of the performance, risk, and cost is ensured in the RAF by the metrics’ definition, as established in [25].

2.2. Methodological Approach

The RAF application can be adapted to cities with different resilient maturity and available information. In this sense, different analysis degrees and a set of corresponding pre-selected metrics are proposed, progressively providing a more in-depth assessment. The proposed analysis degrees are established in accordance with the classification of relevance recommended in [24]. In essence, three analysis degrees are proposed, namely: (i) essential, when the assessment is focused on the key NBS aspects for all cities; (ii) complementary, when the purpose is to make an intermediate assessment; and (iii) comprehensive, when the purpose is to make an in-depth assessment of the city.
The RAF essential analysis degree represents the first assessment approach to evaluate the NBS contribution to urban resilience in cities. This analysis degree includes the key NBS aspects that should be integrated in the assessment of any city. It is recommended for cities with an initial incipient resilience level and is carried out based on the common data available for the city.
The RAF essential analysis degree was applied to the participating cities in order to identify the main challenges and consolidated aspects. The application of the RAF essential analysis degree involved the following steps:
i.
Determination of the pre-selected metrics for the essential analysis degree.
ii.
Analysis of the RAF application results, identifying the main challenges to enhance the NBS contribution to urban resilience and the consolidated aspects and recognizing the cities ready to apply the complementary analysis degree.
iii.
Extensive validation of the essential analysis degree for cities with different initial resilience maturity by verifying the main requirements’ assessment of the RAF.
The essential analysis degree was applied to the participating cities in collaboration with the local water utility or the municipality during the individual working sessions. These individual working sessions were developed specifically for the RAF validation by the stakeholders. The RAF validation included the following steps: (i) analysis of the RAF approach (objectives, criteria, and metrics) and determination of metrics’ relevance and feasibility of application; (ii) thorough RAF application (comprehensive analysis degree) to the case study; (iii) application of the essential analysis degree to the cities; iv) extensive validation of the essential analysis degree, based on its application to the cities. The present paper is focused on the results of the application of the essential analysis degree to the cities and the extensive validation of the essential analysis degree.

2.3. Determination of the Pre-Selected Metrics for the Essential Analysis Degree

The pre-selected metrics for the essential analysis degree correspond to all data based metrics and two procedure based metrics proposed in the RAF [20]. These metrics assess key aspects of the RAF for NBS and correspond to the metrics with less information complexity. The selected procedure based metrics were selected to complement the assessment, avoiding assessing a criterion based on only one metric. In essence, the essential analysis degree involves 49 data based and two procedure based metrics.
In Dimension I, the following criteria are fully or partially assessed at city level: (i) NBS at planning level (crit. 1.1), (ii) Stakeholders’ awareness (crit. 1.2), (iii) Public finance (crit. 2.1), (iv) Economic opportunities (crit. 2.2), (v) some aspects of the Citizens’ engagements and accessibility to NBS (crit. 3.1), (vi) Social co-benefits (crit. 3.2), (vii) Fresh water provision (crit.4.1), (viii) Water treatment (crit. 4.4), (ix) Erosion prevention and maintenance of soil fertility (crit.4.5), and (x) Habitats for species promotion (crit. 4.6).
In Dimension II, the following criteria are fully or partially assessed at city level: (i) Hazard and exposure mapping (crit. 5.1), (ii) Land use and NBS inclusion (crit. 5.2), (iii) Service management and planning (crit. 6.1), (iv) Resources availability and adequacy (crit. 6.2), (v) some aspects of the Flexible service (crit. 7.1), (vi) Scenarios relevance for disaster response (crit. 7.2), (vii) Infrastructure assets criticality and protection (crit. 8.1), (vii) some aspects of the Infrastructure assets robustness (crit. 8.2), (ix) Infrastructure monitoring and maintenance (crit. 8.3), (x) some aspects of the Infrastructure preparedness for recovery and buildback (crit. 9), (xi) Infrastructure dependence (crit. 10.1), and (xii) some aspects of the Infrastructure autonomy (crit. 10.2).
The required information to determine these data based metrics was provided by the local water utility and the municipality. Regarding the procedure based metrics for this analysis degree, these metrics can be also determined based on the information usually available in the city, by applying a simple defined procedure.
The essential analysis degree was applied to the participating cities during working sessions. The proposed pre-selected metrics for this analysis degree were determined for the seven participating cities. Table 1 presents the RAF objectives, criteria, and metrics of the essential analysis degree, identifying the metric’s type. It should be noticed that the numbering of the objectives and criteria was established for the complete RAF (comprehensive analysis degree). In essence, the numbering presented in Table 1 is not continuous and presents some numbering gaps, which correspond to criteria not considered in the essential analysis degree. For example, the Local air quality regulation criterion (crit. 4.2) is not presented here, given that its assessment is only proposed for the complementary and comprehensive analysis degrees.

2.4. Analysis of the RAF Application to the City

The analysis of the RAF application was developed considering the RAF metrics’ results for the cities aggregated at the objective level and at metric level. The classification of the RAF metrics results allowed to identify the main challenges to improve the NBS contribution to urban resilience and the consolidated aspects in the cities, either at the objective or metric level. This analysis also provided the opportunity to identify the cities with the required resilience maturity and information to later upgrade their diagnosis by applying the complementary analysis degree.
In addition, the analysis of the main challenges and consolidated aspects at the metric level also allowed us to define specific recommendations and measures to enhance the NBS contribution to urban resilience in the cities.

2.5. Extensive Validation of the Essential Analysis Degree to the City

The validation of the essential analysis degree was developed through the analysis of the metrics’ results of its application to the participating cities. To validate the pre-selected metrics, the capacity of the cities to answer specific metrics that aim to address RAF’s main requirements, based on the application of the RAF essential analysis degree, were analyzed. For this analysis, the main requirements of the RAF were categorized in three main groups, namely, (i) the main NBS aspects; (ii) all resilience capabilities; (iii) the performance, risk, and cost analysis.

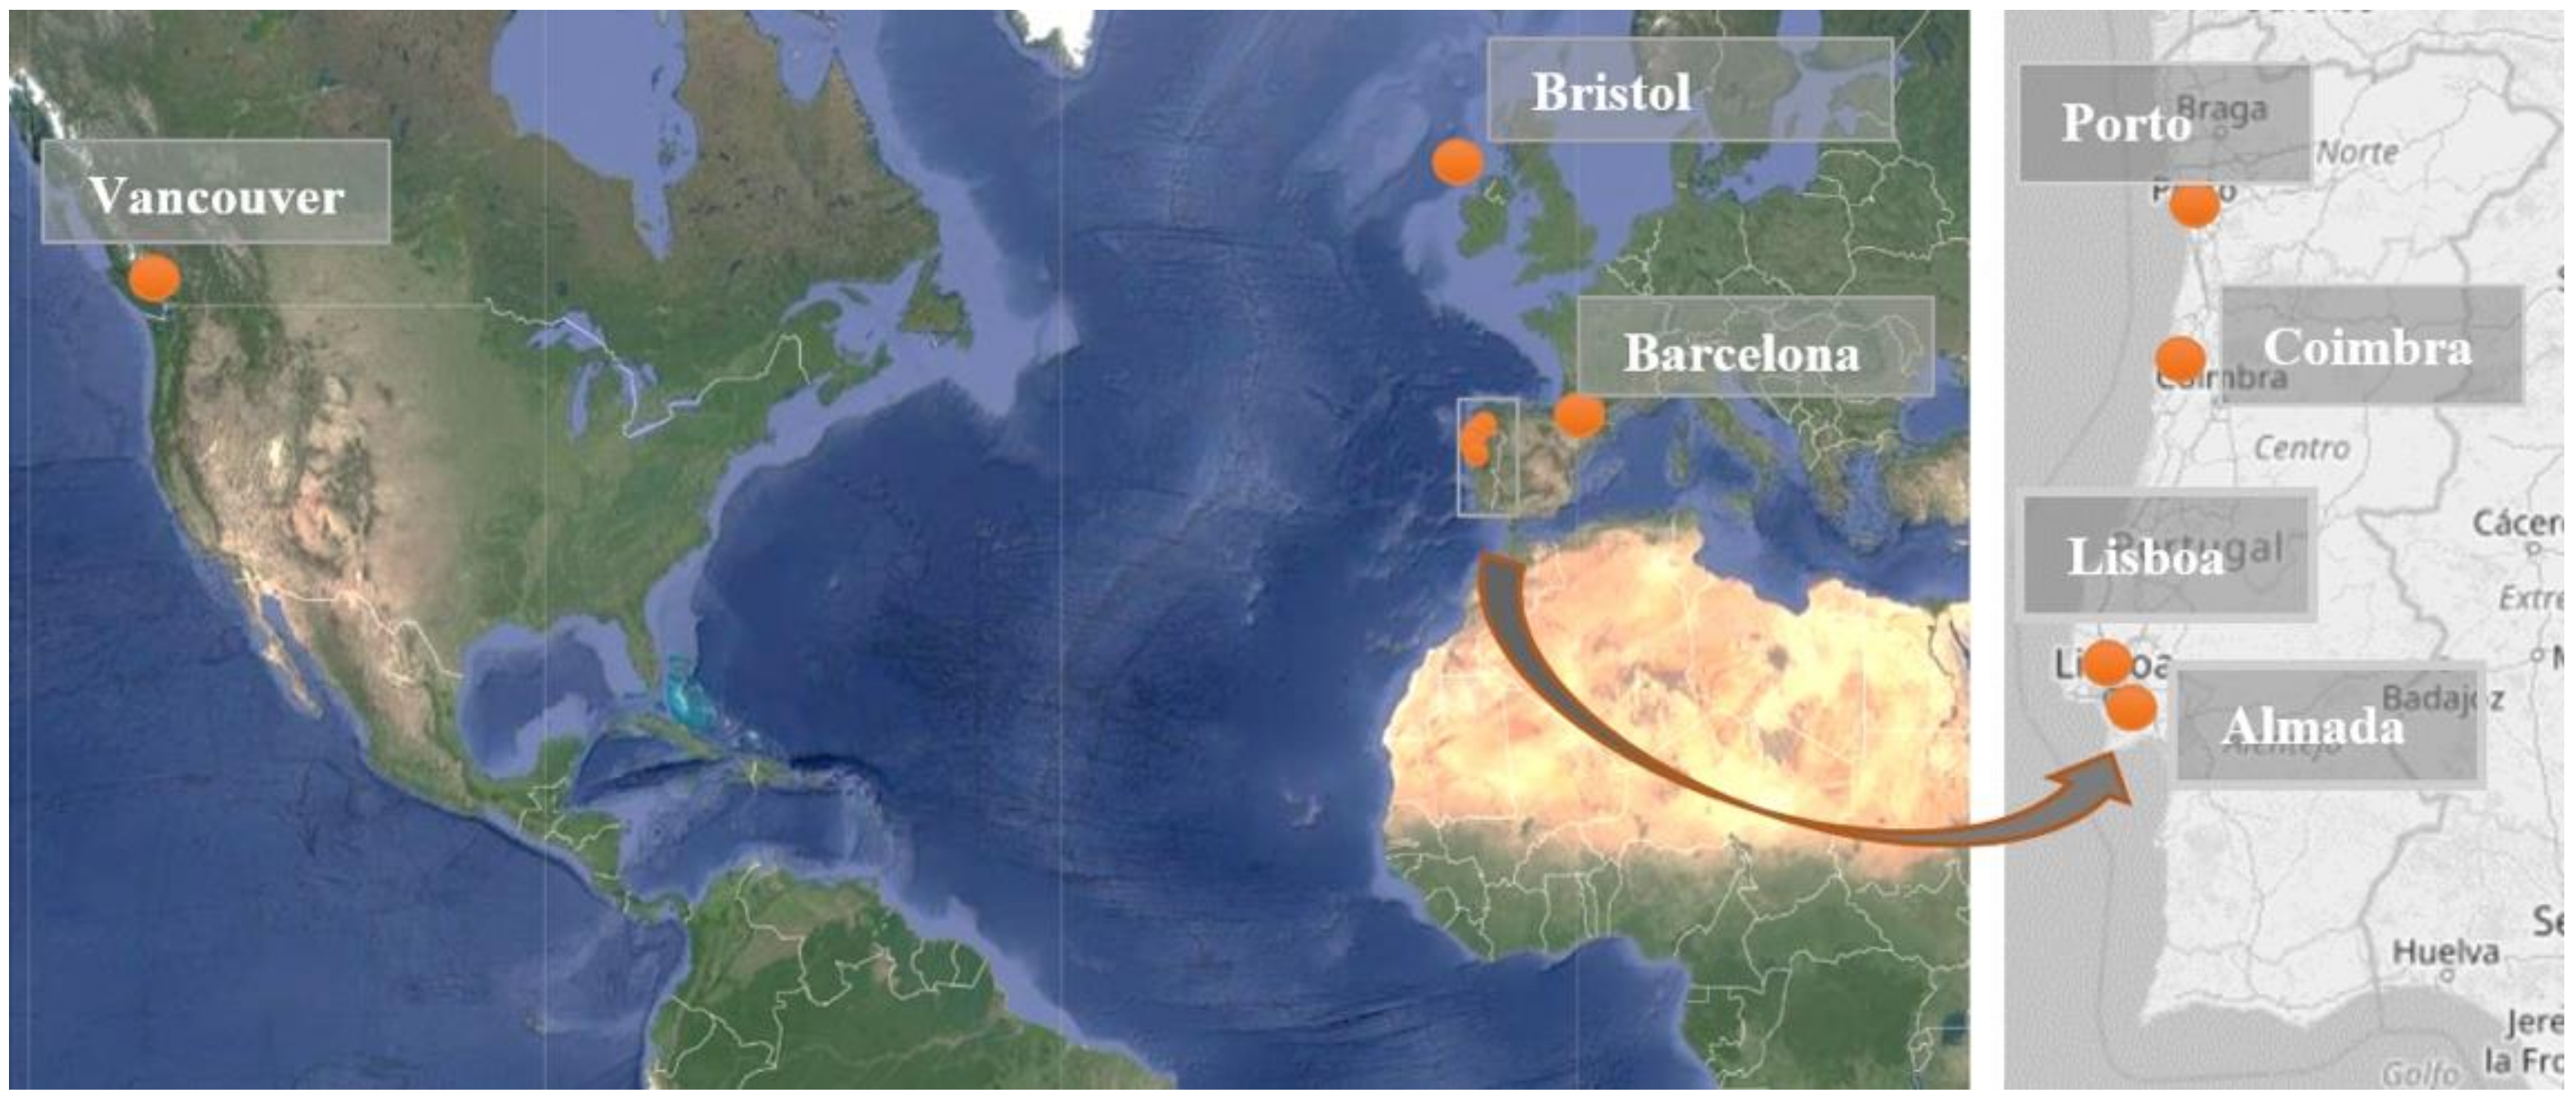
2.6. Characterization of the Participating Cities

A representative group of cities with different challenges regarding urban resilience and NBS participated in the application and validation of the essential analysis degree. This set includes cities with different international and urban context, city dimension and management, NBS management, social involvement, and awareness, among other factors. These cities were selected since they are closely engaged to urban resilience and greening development and participed in several projects and iniciatives focused on stormwater management and control, NBS, and asset management.
Seven cities have participated and contributed to the RAF validation during the working sessions, namely, Almada (Portugal), Barcelona (Spain), Bristol (UK), Coimbra (Portugal), Lisbon (Portugal), Porto (Portugal), and Vancouver (Canada). In Porto, two organizations were involved in the RAF validation, namely, the local water utility and the municipality. Stakeholders from water utilities and municipalities participated in the working sessions. A total of eight organizations validated the RAF. Figure 1 presents the location of the cities.
All cities are localized near to a river and most of them are in coastal area. Cities are characterized by marine west coast (Cfb), dry-summer subtropical (Csb) or Mediterranean (Csa) climates, according to the Köppen’s climate classification. In this light, cities present significant differences regarding the average temperatures and annual rainfall, even between cities with the same climate classification. For example, Vancouver’s average annual rainfall is ranging between 1200 and 4000 mm [26]. However, Porto’s annual rainfall, with the same climate classification, varies between 1000 and 1200 m. Table 2 presents the characterization of the cities, identifying the location, total area, green area, resident population, and population density. Hereafter, for confidentiality reasons, the cities are coded by a number in the presentation of the RAF application results (from #1 to #7, with no specific order).
Overall, the cities’ areas vary between 41 and 110 km2. Regarding the urbanized areas, involved cities range from dense and compact settlement to less consolidated. In essence, involved cities present different population contexts, from high densely populated cities, such as Barcelona (with a population density of 15,873 hab./km2), to more intermediate populated ones, like Lisbon and Vancouver (with a population density of 6446 and 5493 hab./km2, respectively).
The participating cities are aware of the importance of the NBS and its essential role in enhancing the urban resilience. In line with this, several projects and strategies are being implemented with a focus on progress toward greener cities and on their importance to face to climate change challenge, such as the “City of Vancouver’s Greenest City 2020 Action Plan” [36] and the “Bristol’s Parks and Green Strategy” [37]. Overall, green areas in the cities vary between 35% and 6% of the city’s area.

3. Results and Discussion

3.1. Analysis of the Resilience Maturity and Available Information

The resilience maturity and the available information in the cities are analyzed in this section. Figure 2 presents the overall metrics’ results of the essential analysis degree for the cities, identifying the resilience development level. The overall RAF metrics’ results correspond to the percentage of metrics within incipient, progressing, and advanced levels obtained for every city through the application of the RAF essential analysis degree. Moreover, the pecentages of not answered and not applicable metrics are also detailed.
The RAF metrics results allow to identify a differentiated maturity in the cities in terms of resilience and available information. In five cities (#1, #2, #3, #4, and #6), the metrics with advanced resilience level represent less than 35% of the answered metrics. Additionally, these cities present a significant percentage of not answered metrics (>10%). On the other hand, in two cities (# 5 and #7), the metrics with advanced level represent more than 55% of the answered metrics. Regarding the available information, these cities present a low percentage of not answered metrics (<10%).
In this sense, the cities can be aggregated into two main groups, in function of the resilience maturity and available information. Group I considers the cities with a lower (#1, #2, #3, #4, and #6) and Group II involves the higher (#5 and #7) percentage of metrics with advanced resilience development level.

3.2. RAF Application to the Participating Cities

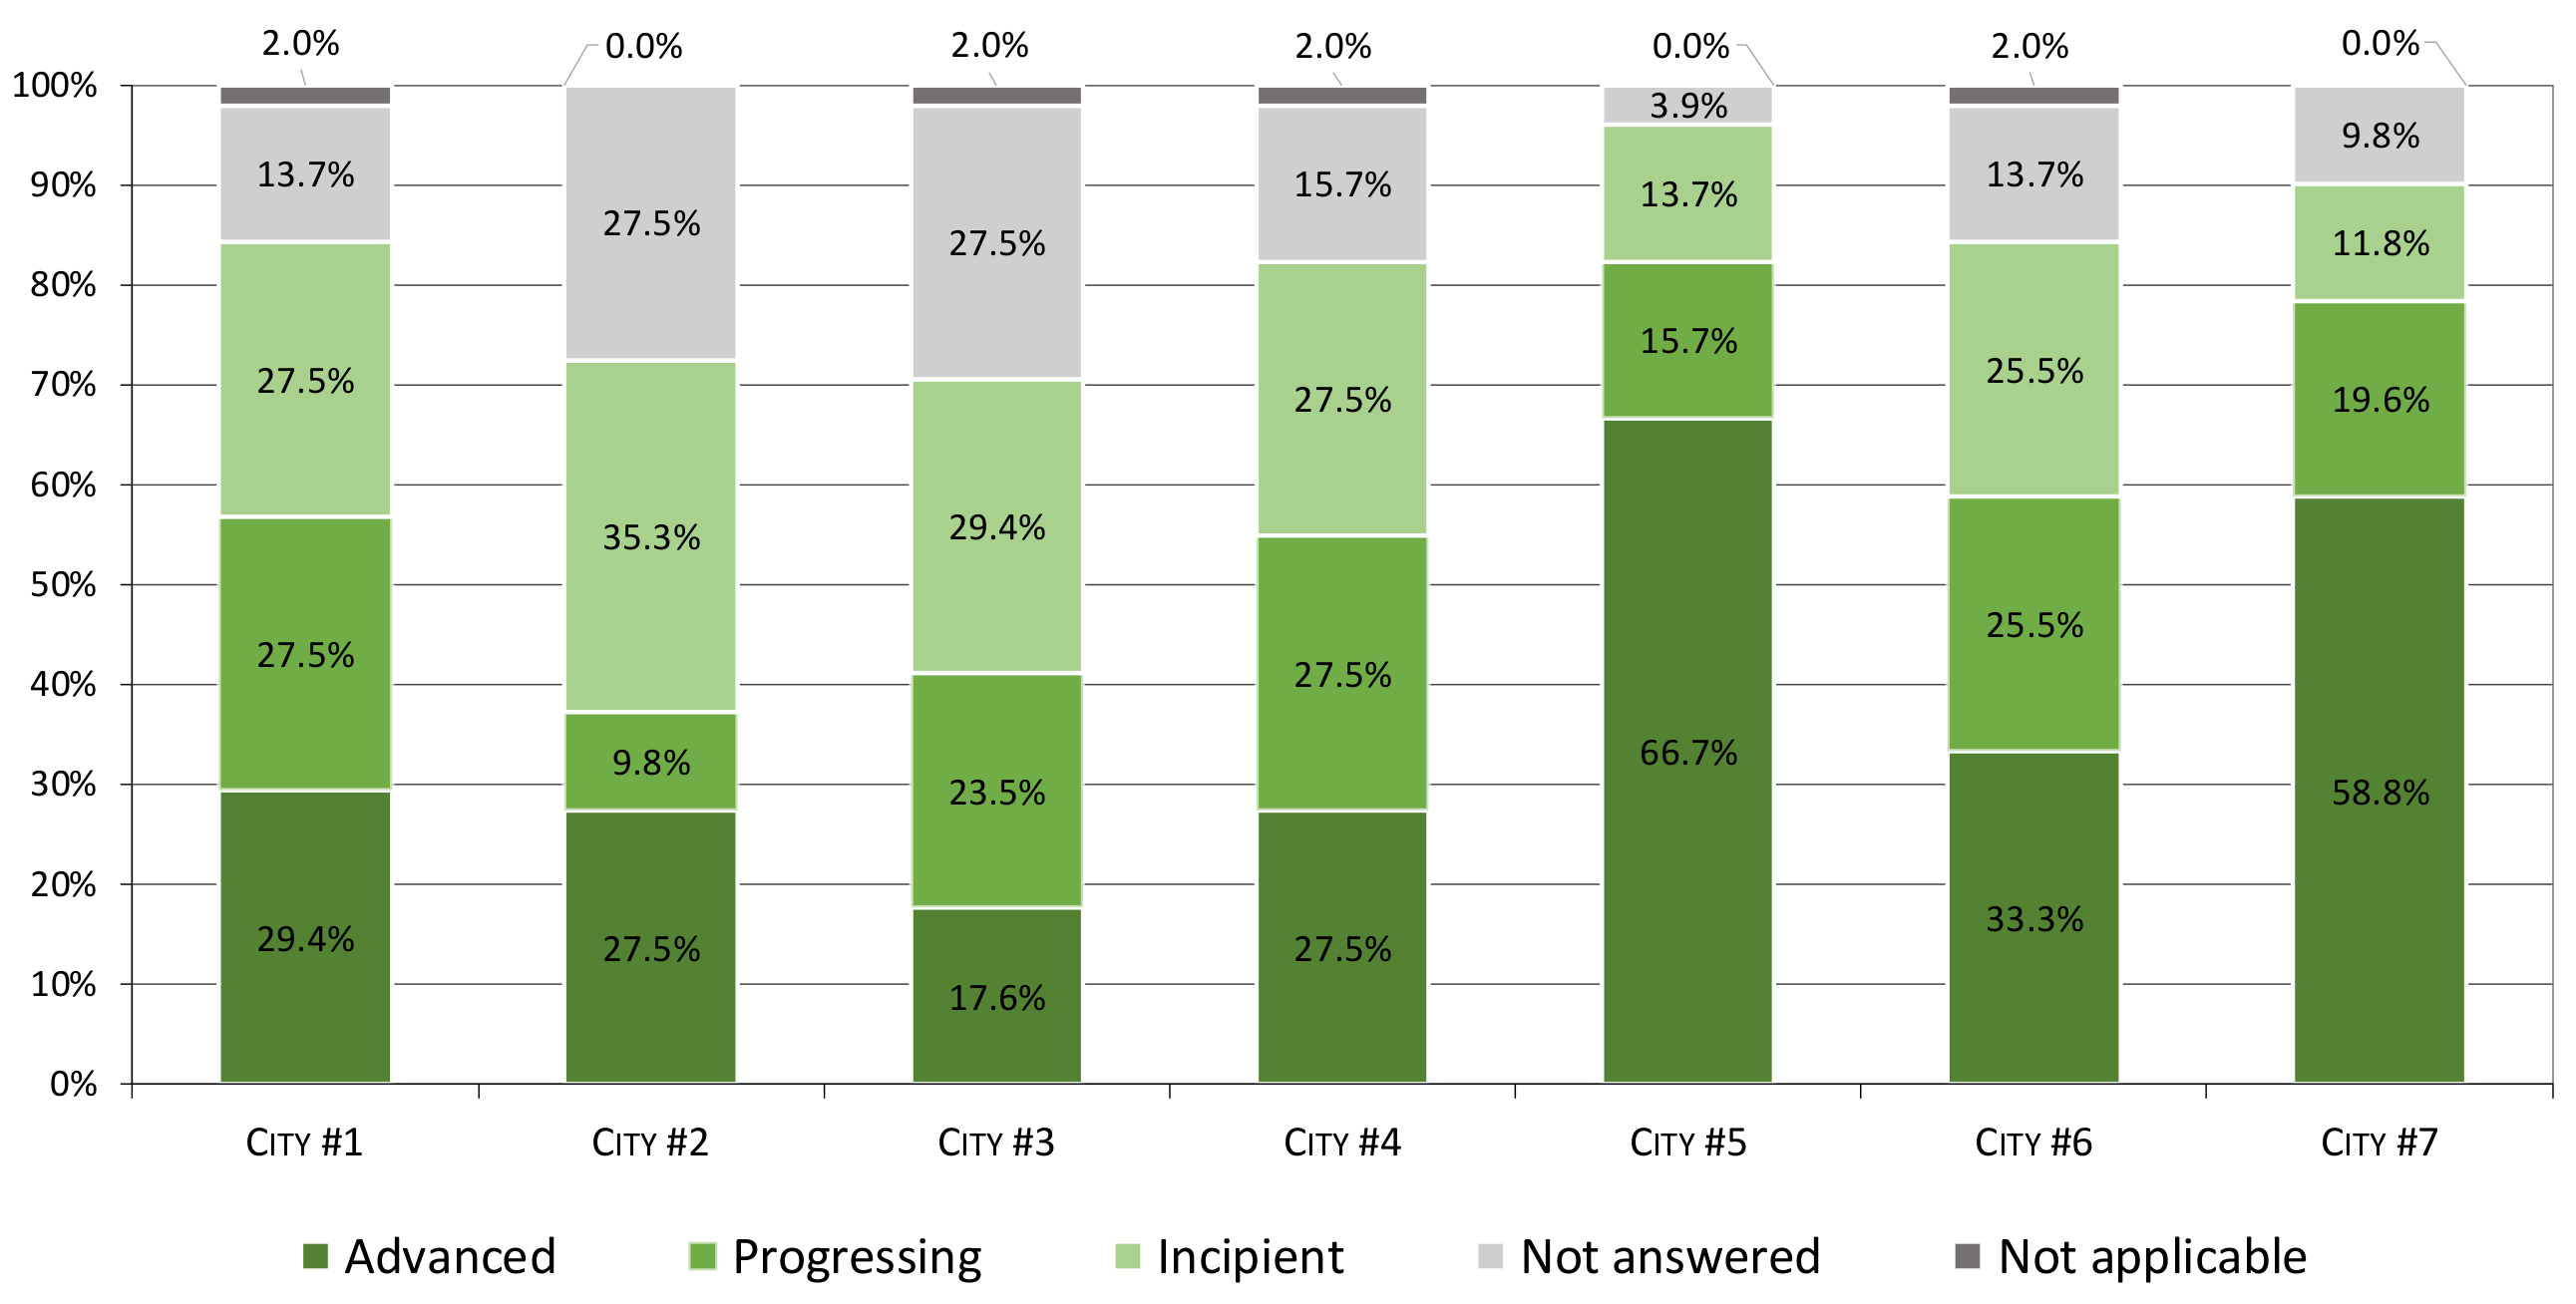
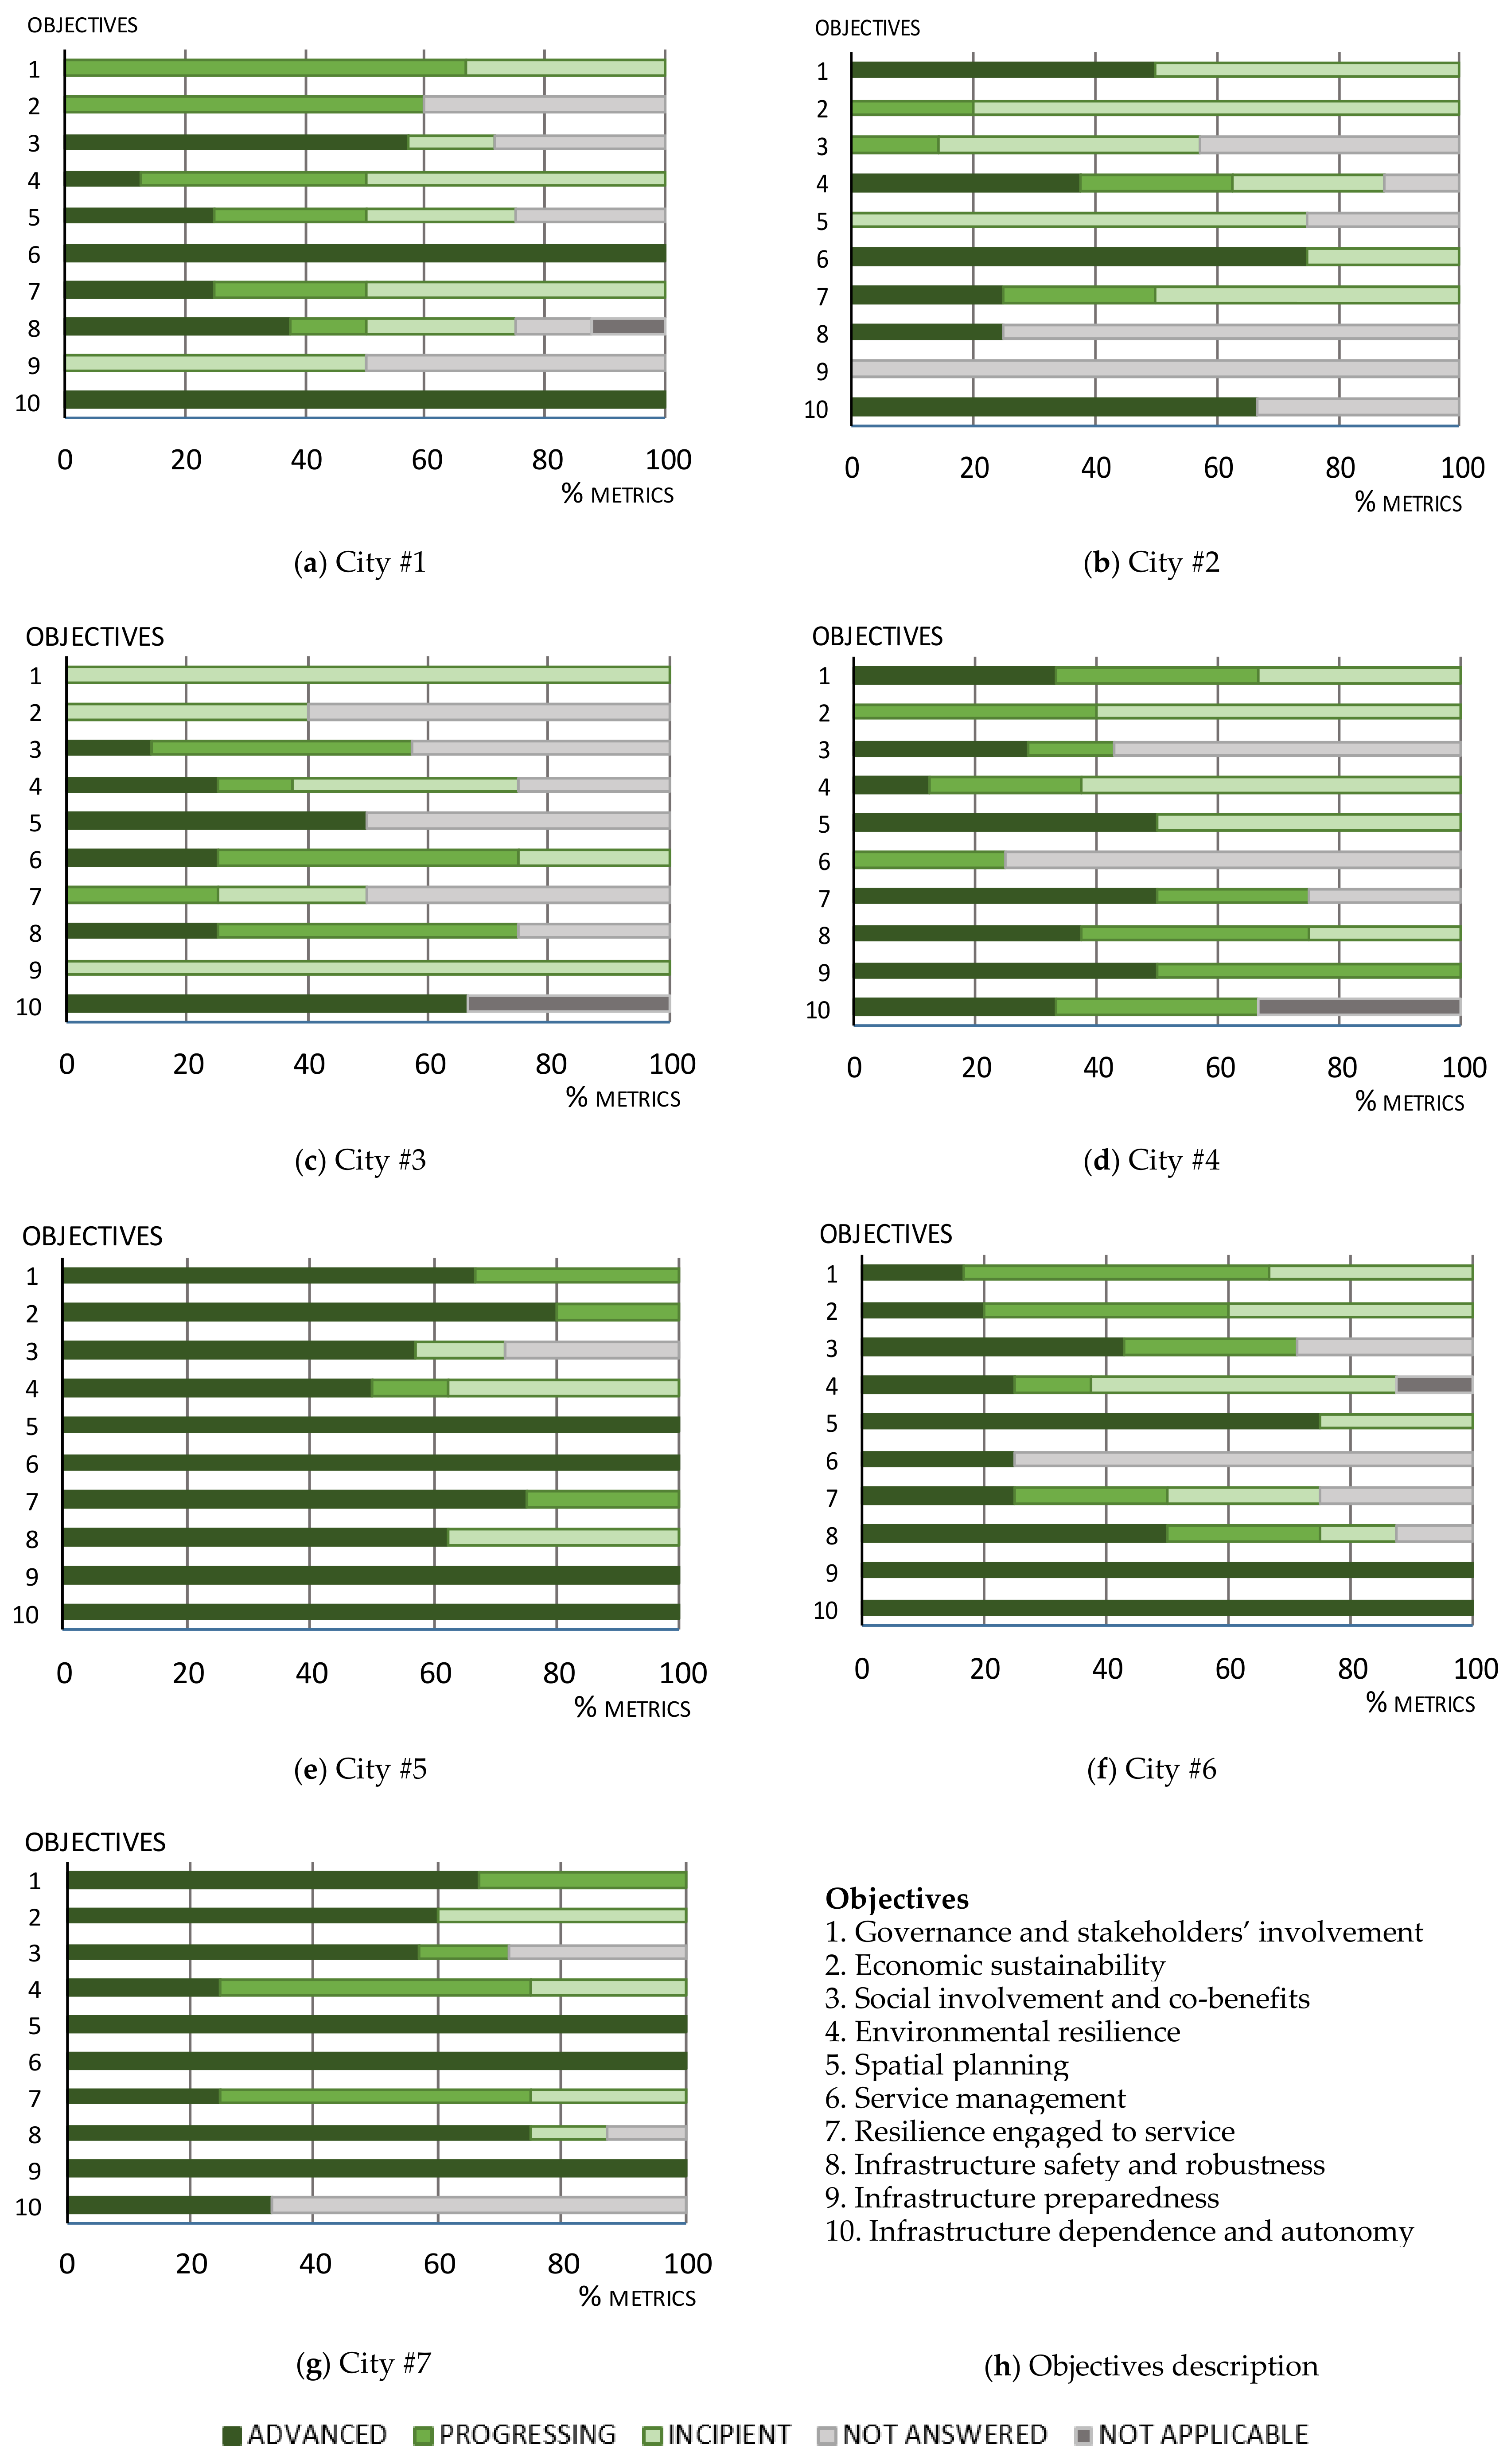
3.2.1. Analysis of the RAF Metrics Results

The classification of the RAF metrics results is an opportunity to identify the main challenges to improve the NBS contribution to urban resilience and the consolidated aspects in the cities. This analysis also allows us to identify the cities with the required resilience maturity and information to later upgrade their diagnosis by applying the complementary analysis degree.
Overall, regarding all the assessed metrics: (i) 37% of the cities present with an advanced level; (ii) 21% with a progressing level; (iii) 24% with an incipient level; (iv) 16% are not answered; and (v) 1% are not applicable, given the city’s context. A significant percentage of metrics with advanced level is obtained. The percentage of consolidated aspects is significantly higher than the main challenges to improve the NBS contribution. The percentage of metrics within each development level varies from city to city. Figure 3 presents the RAF metrics results for each city regarding each objective in the essential analysis degree. Each tone of green corresponds to a resilience development level.
Figure 3 highlights that some common challenges and consolidated aspects have been identified in the cities of Group I and of Group II. In Group I (cities #1, #2, #3, #4, and #6), the Governance and stakeholders’ involvement (obj. 1) and Economic sustainability (obj. 2) represent the main challenges for almost every city. Furthermore, other common challenges come up in several cities of Group I, namely, the Environmental resilience (obj. 4) and Infrastructure preparedness (obj. 9) objectives.
In Group I, the main consolidated aspects correspond to the Infrastructure dependence and autonomy (obj. 10). Some other consolidated aspects, identified in at least in two cities simultaneously, are Spatial planning (obj. 5), Social involvement and co-benefits (obj. 3), Service management (obj. 6), and Infrastructure preparedness (obj. 9).
With regard to Group II (cities #5 and #7), the main common challenge to improve the NBS contribution corresponds to the Environmental resilience (obj. 4). Regarding the consolidated aspects in the cities, the cities of this group present several well developed aspects, namely, the Governance and stakeholders’ involvement (obj. 1), Spatial planning (obj. 5), Service management (obj. 6), Infrastructure safety and robustness (obj. 8), and Infrastructure preparedness (obj. 9).
Overall, the Environmental resilience (obj. 4) stands out as the main challenge to improve the NBS contribution in the cities. This challenge is common to both groups of cities. On the other hand, the Spatial planning (obj. 5), Service management (obj. 6), Infrastructure safety and robustness (obj. 8), and Infrastructure preparedness (obj. 9) are consolidated aspects in both groups.
Lastly, Group I presents not only many NBS aspects that can be improved to increase the NBS contribution to urban resilience, but also significant knowledge and information gaps. As expected, Group II has a significant higher number of consolidated aspects when compared to Group I. Moreover, the knowledge and information gaps in Group II are reduced. In essence, the cities of Group II meet the required resilience maturity and information to apply the RAF’s complementary analysis degree.

3.2.2. Main Challenges, Consolidated Aspects, and Recommendations

In order to identify the specific recommendations to enhance the NBS contribution to urban resilience, the analysis of the main challenges and consolidated aspects at the metric level is performed. Figure 4 presents the main metrics with incipient level. These metrics presented an incipient level in at least 30% of the cities. The first two digits in the metric’s identification number relates to the corresponding objective and the criteria, respectively. The percentages in the graph depict the cities with incipient development level in every metric.
Regarding the Governance and stakeholders’ involvement (obj. 1), the main identified challenges are the Ecosystem services and protective infrastructure identification (1.1.1), the Civil society links (1.2.2), and the Awareness campaigns and events (1.2.3) metrics. In this sense, the main recommendation to enhance the NBS contribution corresponds to the identification ecosystem services and the protective infrastructure provided by the NBS in the city and the promotion of stakeholders’ involvement in several stages of decision-making (planning, monitoring, and maintenance of NBS). For example, public consultation of the NBS projects may be a way to involve stakeholders or community associations. Furthermore, implementing awareness events for a better understanding, by the community, of the NBS contribution for resilience and for ecosystem services (e.g., through the distribution of flyers, installation of billboards on NBS) should also be implemented.
The Economic sustainability (obj. 2) presents important challenges, namely, regarding the NBS budget (2.1.2), the NBS financial support to community involvement (2.1.2), the Green jobs opportunities (2.2.1), and the Tourism enhancement (2.2.3). In this sense, developing a specific budget in the financial plan of the city or the entity in charge, focused on the NBS implementation, maintenance, and monitoring, represents an adequate measure to improve the economic sustainability. Additionally, the creation of green jobs and the tourism in the NBS (e.g., advertising and awareness campaigns) should be promoted.
Related to the Environmental resilience (obj. 4), the main challenges are focused on the use of NBS for stormwater treatment (4.4.1), Use of NBS for wastewater treatment (4.4.2), and the Regeneration of abandoned areas (4.5.1). Specific measures to promote the NBS for the stormwater treatment of surface runoff and to help in the pollution treatment in the city’s wastewater treatment plants should be adopted. Additionally, the NBS implementation in derelict areas and brownfield lands supports the regeneration of these areas.
In Dimension II, the integration of NBS into city policy and projects (5.2.2) metric represents the main challenge to improve the NBS contribution with regard to the Spatial planning (obj. 5) objective. The creation of new requirements to promote NBS on major urban development and infrastructure projects by local policy can be enhanced. For example, the municipal master plan may establish that new constructed areas should include a specific area (e.g., 15% of the total area) for NBS.
The main challenge identified in the Resilience engaged to service (obj. 7) objective is the Water reuse (7.1.2). Reusing water retained in the existing NBS for other purposes should be implemented in the cities, such as for irrigation or urban cleaning.
With regard to the Infrastructure safety and robustness (obj. 8) objective, the main aspect to be improved corresponds to the Identification of protective buffers (8.1.2) for specific NBS. Protective buffers are spatially delimited areas surrounding the infrastructure, where activities are restricted to protect the structural integrity of the assets or their ecosystem services [38]. In specific NBS, a surrounding area may be already defined as a protective buffer. For example, when the NBS is located on a water course, several restrictions related to land use and building construction, among others, may have been established in the water course’s protective area.
To identify the most consolidated aspects in the cities, the metrics with advanced resilience development level are analyzed. Figure 5 presents the main metrics with advanced level. These metrics presented an advanced level in at least 70% of the cities. The percentages in the graph depict the cities with advanced level in every metric.
In Dimension II, the main consolidated aspects correspond to the Risk identification (1.1.3) and the Standing water quality (4.4.3) metrics. Regarding Dimension II, the main consolidated aspects are Presentation process for risk information (5.1.1), Integrated management plan and NBS management (6.1.1), the Scenarios definition (7.1.2), the program (8.3.3), NBS dependency from other services (10.1.1), and Infrastructure of other services dependent on NBS infrastructure (10.1.2).
Regarding the challenges, most of them are to Dimension I. In this sense, as expected, most consolidated aspects were identified in Dimension II.

3.3. Validation of the Essential Analysis Degree

3.3.1. Overview

To validate the proposal of pre-selected metrics for the RAF essential analysis degree, the ability to answer specific metrics that aim to address RAF’s main requirements was analyzed, namely metrics related to (i) the main NBS aspects; (ii) all resilience capabilities; and (iii) the performance, risk, and cost components. Figure 6 presents the answered and not answered essential metrics by cities, aggregated for each resilience objective. Additionally, not applicable metrics were also identified by each city. Each shade of blue corresponds to a different city.
Overall, the main difficulties in Dimension I corresponds to the assessment of the Social involvement and co-benefits (obj. 3), regarding the not answered metrics. In Dimension II, the difficulties are mainly identified in the Service management (obj. 6), Infrastructure safety and robustness (obj. 8), and Infrastructure preparedness (obj. 9).

3.3.2. NBS Aspects

All relevant NBS aspects identified in a previous literature review have been considered in the RAF through the assessment criteria and, more aggregately, the resilience objectives. In this section, the NBS aspects assessed by the cities are analyzed based on the answered metrics for every resilience objective. This analysis allows us to identify the main difficulties in NBS aspects assessment regarding the essential analysis degree. Figure 7 presents the summary of the answered metrics for the resilience objectives by the cities, based on the application of the RAF essential analysis degree. In the box plots, the bottom and top of the box correspond to the percentile 25 and 75, respectively.
All NBS aspects considered are evaluated by almost all cities, based on Figure 7. In essence, for almost all resilience objectives, the cities answered at least 50% of the proposed metrics, except for the Service management (obj. 6). The percentile 25 for this objective corresponds to 25%. In essence, even for this resilience objective, at least 25% of the proposed metrics were answered by almost all cities. Regarding the minimum percentage of answered metrics, it should be noted that the Infrastructure preparedness (obj. 9) was not assessed completely by one city.
In this sense, it is possible to conclude that all NBS aspects were assessed by almost all cities based on the essential analysis degree application. Although some difficulties have been identified, the assessment of all relevant NBS aspects can be ensured in the application of the RAF essential analysis degree. Moreover, given the importance of Infrastructure preparedness (obj. 9) to evaluate the NBS contribution to urban resilience, its assessment continues to be proposed in the essential analysis degree.

3.3.3. Resilience Capabilities

The consideration of all resilience capabilities (e.g., absorb, learn) represent an important requirement in the RAF. The essential analysis degree proposes a set of 51 metrics to assess all resilience capabilities, namely, (i) four absorb metrics (8.2%), (ii) eight learn metrics (16.3%), (iii) 11 adapt metrics (22.4%), (iv) 12 transform metrics (24.5%), and (v) 16 prepare metrics (32.7%). Figure 8 presents the summary of the answered metrics for the resilience capabilities by the cities, based on the application of the RAF essential analysis degree. In the box plots, the bottom and top of the box correspond to the percentile 25 and 75, respectively.
According to the Figure 8, the answered metrics allow us to conclude that most cities answered (i) from 50% to 100% of the absorb metrics, (ii) at least 87.5% of the learn metrics, (iii) from 50% to 70% of the adapt metrics, and (iv) at least 80% of the transform and prepare metrics. In the learn metrics, it was not possible to represent the box plot. The percentiles 25, 50, and 75 of the answered metrics, for this capability, have equal value (87.5%). For all resilience capabilities, the cities answered at least 50% of the proposed metrics. Therefore, it is possible to conclude that all cities assessed every resilience capability in the application of the RAF essential analysis degree.

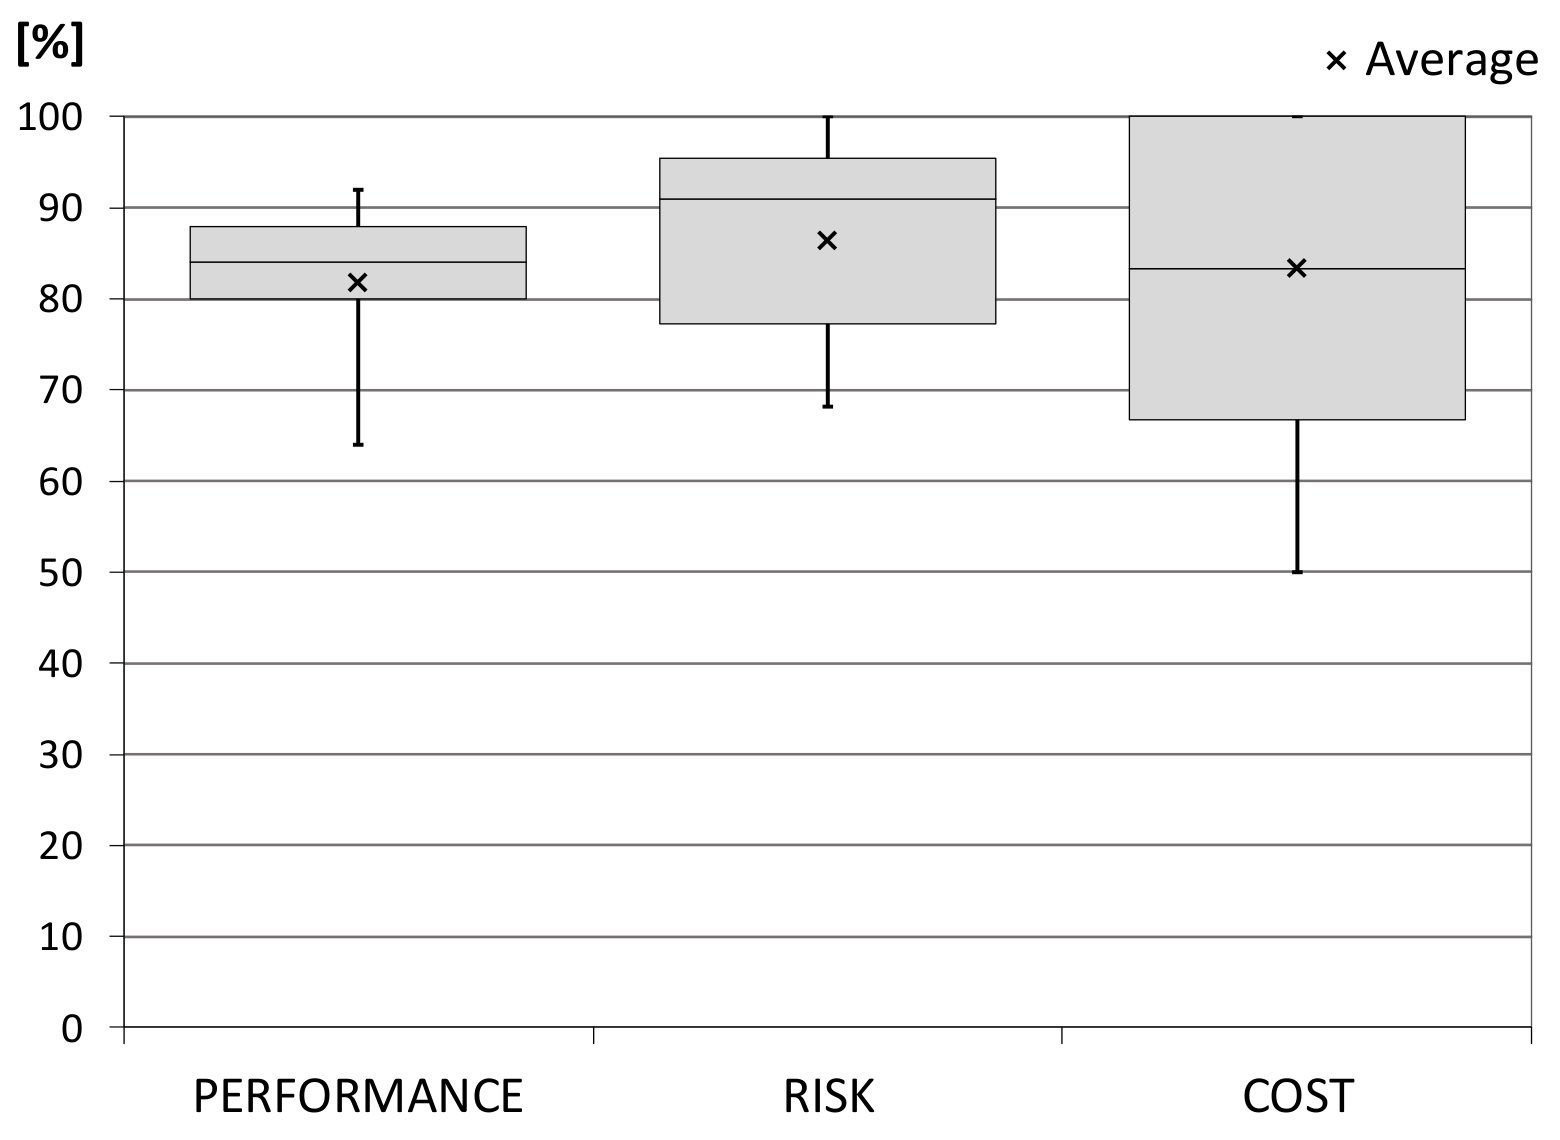
3.3.4. Performance, Risk, and Cost Analysis

The risk, cost, and performance analysis is recommended for service performance assessment, as detailed in the European Standard EN752:2008 [25]. In this sense, these different sorts of analysis should be ensured by the essential analysis degree of RAF for NBS. The essential analysis degree proposes a set of 51 metrics that includes (i) 23 performance metrics, (ii) 22 risk metrics, and (iii) six cost metrics. Figure 9 present the summary of the performance, risk, and cost metrics answered by the cities. In the box plots, the bottom and top of the box correspond to the percentile 25 and 75, respectively.
Based on this summary (Figure 9), the performance, risk, and cost analysis is ensured in the RAF application of the essential analysis degree. Cities presented a percentage of answered metrics higher than 80%, 77%, and 67% for the performance, risk, and cost metrics, respectively.

3.3.5. Final Considerations

The essential analysis degree allowed us to assess the main requirements for the RAF for NBS by the cities. Even for cities with lower resilience maturity, the essential analysis degree ensured the evaluation of the main requirements for a comprehensive assessment of the NBS contribution to urban resilience in almost all cities.
It should be noted that it was not possible to engage in the RAF validation phase all entities related to the NBS processes in every participating city. In this sense, some difficulties or information gaps identified may be solved through the involvement of other local entities. The RAF determination should involve a multidisciplinary team composed by human resources of the entities in charge of NBS management, stormwater management services, and green space management.

4. Conclusions

The application of the RAF essential analysis degree to the participating cities and its extensive validation regarding cities with different resilience maturity and available information were presented. Seven cities, comprising eight organizations, with different international and urban contexts and challenges regarding urban resilience and NBS have been involved in this process. The essential analysis degree was applied to the cities in collaboration with the local utility or the municipality during working sessions.
The analysis of the resilience maturity and available information in the cities was presented, allowing us to identify two main cities’ groups. Group I (cities #1, #2, #3, #4, and #6) and Group II (cities #5 and #7) involve the cities with, respectively, a lower and a higher percentage of metrics with advanced resilience development level, respectively. Given the different resilience maturities and information, the cities are fit to validate the essential analysis degree. The analysis of the resilience maturity and the identification of the cities’ groups provide an interesting opportunity for benchmarking between cities with similar resilience maturity and available information.
The main common challenges to improve NBS contribution to urban resilience and the consolidated aspects across the participating cities were identified, based on the application results of the RAF essential analysis degree. Overall, the Environmental resilience was identified as the main challenge, including both cities’ groups. Regarding the consolidated aspects, the Spatial planning, Service management, Infrastructure safety and robustness, and Infrastructure preparedness presented a well-developed level in both groups.
In addition, it may be concluded that the cities within Group II meet the required resilience maturity and information to progress and apply the RAF complementary analysis degree. In relation to Group I, several aspects should be improved.
Some specific recommendations to enhance the NBS contribution to urban resilience were proposed, based on the main challenges identified at the metric level. At this level, the main consolidated aspects were also identified.
To conclude, the essential analysis degree was applied to the cities in order to validate the proposal of pre-selected metrics. In this sense, the assessment of the main requirements of the RAF for NBS were verified, namely, all relevant NBS aspects; all resilience capabilities; and the performance, risk, and cost components. It was possible to conclude that the essential analysis degree allows us to assess the main requirements based on its application to the cities, even for the cities with lower resilience maturity.

Author Contributions

The conceptualization of the work and implementation were carried out by P.B. The material and methods were carried out by P.B., R.S.B., and A.G. Original draft preparation was developed by P.B. and review and editing were accomplished by P.B., R.S.B., and A.G. All authors have read and agreed to the published version of the manuscript.

Funding

This research was funded by Portuguese Foundation for Science and Technology (FCT) through the PhD fellowship PD/BD/135216/2017.

Acknowledgments

The authors gratefully acknowledge the support of the Portuguese Foundation for Science and Technology (FCT), through the PhD fellowship PD/BD/135216/2017. The authors acknowledge the RESCCUE project for the opportunity to participate in this special issue. The authors would like to thank the following organizations for the collaboration and all constructive comments during this work and for the collaboration in the RAF validation step: Águas de Coimbra, Águas do Porto, Ajuntament de Barcelona, Bristol City Council, Câmara Municipal de Lisboa, Câmara Municipal do Porto, City of Vancouver, and SMAS de Almada.

Conflicts of Interest

The authors declare no conflict of interest. The funders had no role in the design of the study; in the collection, analyses, or interpretation of data; in the writing of the manuscript; or in the decision to publish the results.

References

  1. Sayaas, S. Resilient Cities Report—Preliminary Version. OCDE Regional Policies for Sustainable Development Division; OCDE: Paris, France, 2016. [Google Scholar]
  2. Coaffee, J.; Therrien, M.-C.; Chelleri, L.; Henstra, D.; Aldrich, D.P.; Mitchell, C.L.; Tsenkova, S.; Rigaud, É. Urban resilience implementation: A policy challenge and research agenda for the 21st century. J. Contingencies Crisis Manag. 2018, 26, 403–410. [Google Scholar] [CrossRef]
  3. Meerow, S.; Newell, J.P.; Stults, M. Defining urban resilience: A review. Landsc. Urban Plan. 2016, 147, 38–49. [Google Scholar] [CrossRef]
  4. Diao, K.; Sweetapple, C.; Farmani, R.; Fu, G.; Ward, S.; Butler, D. Global resilience analysis of water distribution systems. Water Res. 2016, 106, 383–393. [Google Scholar] [CrossRef] [PubMed] [Green Version]
  5. Milman, A.; Short, A. Incorporating resilience into sustainability indicators: An example for the urban water sector. Glob. Environ. Chang. 2008, 18, 758–767. [Google Scholar] [CrossRef]
  6. Mugume, S.N.; Gomez, D.E.; Fu, G.; Farmani, R.; Butler, D. A global analysis approach for investigating structural resilience in urban drainage systems. Water Res. 2015, 81, 15–26. [Google Scholar] [CrossRef] [PubMed] [Green Version]
  7. UNESCO. UN World Water Development Report, Nature-Based Solutions for Water; UNESCO: Paris, France, 2018. [Google Scholar]
  8. United Nations General Assembly. Resolution Adopted by the General Assembly on 6 July 2017. 71/313 Work of the Statistical Commission Pertaining to the 2030 Agenda for Sustainable Development. A/RES/71/313. 2017. Available online: https://undocs.org/A/RES/71/313 (accessed on 10 July 2017).
  9. UN-Climate Action. The Nature-Based Solutions for Climate Manifesto-Developed for the UN Climate Action Summit 2019. UN Secretary General Climate Action Summit. 2019. Available online: https://stg-wedocs.unep.org/xmlui/bitstream/handle/20.500.11822/29705/190825NBSManifesto.pdf?sequence=1&isAllowed=y (accessed on 25 August 2020).
  10. Frantzeskaki, N. Seven lessons for planning nature-based solutions in cities. Environ. Sci. Policy 2019, 93, 101–111. [Google Scholar] [CrossRef]
  11. European Commission. Towards an EU Research and Innovation Policy Agenda for Nature-Based Solutions and Re-Naturing Cities. Final Report of The Horizon 2020 Expert Group on Nature-Based Solutions and Re-Naturing Cities; European Commission: Brussels, Belgium, 2015. [Google Scholar]
  12. Davis, A.P.; Stagge, J.H.; Jamil, E.; Kim, H. Hydraulic performance of grass swales for managing highway runoff. Water Res. 2012, 46, 6775–6786. [Google Scholar] [CrossRef] [PubMed]
  13. Dhakal, K.P.; Chevalier, L.R. Managing urban stormwater for urban sustainability: Barriers and policy solutions for green infrastructure application. J. Environ. Manag. 2017, 203, 171–181. [Google Scholar] [CrossRef] [PubMed]
  14. Leroy, M.-C.; Portet-Koltalo, F.; Legras, M.; LeDerf, F.; Moncond’Huy, V.; Polaert, I.; Marcotte, S. Performance of vegetated swales for improving road runoff quality in a moderate traffic urban area. Sci. Total. Environ. 2016, 566, 113–121. [Google Scholar] [CrossRef] [PubMed]
  15. Wihlborg, M.; Sörensen, J.; Olsson, J.A. Assessment of barriers and drivers for implementation of blue-green solutions in Swedish municipalities. J. Environ. Manag. 2019, 233, 706–718. [Google Scholar] [CrossRef] [PubMed]
  16. Kabisch, N.; Frantzeskaki, N.; Pauleit, S.; Naumann, S.; McKenna, D.; Artmann, M.; Haase, D.; Knapp, S.; Korn, H.; Stadler, J.; et al. Nature-based solutions to climate change mitigation and adaptation in urban areas: Perspectives on indicators, knowledge gaps, barriers, and opportunities for action. Ecol. Soc. 2016, 21, 2. [Google Scholar] [CrossRef] [Green Version]
  17. Pagano, A.; Pluchinotta, I.; Pengal, P.; Cokan, B.; Giordano, R. Engaging stakeholders in the assessment of NBS effectiveness in flood risk reduction: A participatory System Dynamics Model for benefits and co-benefits evaluation. Sci. Total. Environ. 2019, 690, 543–555. [Google Scholar] [CrossRef] [PubMed]
  18. NATURE4CITIES. NATURE4CITIES—D2.1—System of Integrated Multi-Scale and Multi-Thematic Performance Indicators for the Assessment of Urban Challenges and NBS. 2019. Available online: https://docs.wixstatic.com/ugd/55d29d_3b17947e40034c168796bfc9a9117109.pdf (accessed on 1 March 2019).
  19. Raymond, C.M.; Berry, P.; Breil, M.; Nita, M.R.; Kabisch, N.; de Bel, M.; Enzi, V.; Frantzeskaki, N.; Geneletti, D.; Cardinaletti, M.; et al. An Impact Evaluation Framework to Support Planning and Evaluation of Nature-based Solutions Projects; Report prepared by the EKLIPSE Expert Working Group on Nature-based Solutions to Promote Climate Resilience in Urban Areas; Centre for Ecology & Hydrology: Wallingford, UK, 2017. [Google Scholar]
  20. Beceiro, P.; Brito, R.; Rizzo, A. The Contribution of NBS to Urban Resilience in Stormwater Management and Control: A Framework with Stakeholder Validation. Sustainability 2020, 12, 2537. [Google Scholar] [CrossRef] [Green Version]
  21. ISO. ISO 24510:2007. Activities Relating to Drinking Water and Wastewater Services—Guidelines for the Assessment and for the Improvement of the Service to Users; International Organization for Standardization: Geneva, Switzerland, 2007. [Google Scholar]
  22. ISO. ISO 24511:2007. Activities Relating to Drinking Water and Wastewater Services—Guidelines for the Management of Wastewater Utilities and for the Assessment of Drinking Water Services; International Organization for Standardization: Geneva, Switzerland, 2007. [Google Scholar]
  23. ISO. ISO 24512:2007. Service Activities Relating to Drinking Water and Wastewater—Guidelines for the Management of Drinking Water Utilities and for the Assessment of Drinking Water Services; International Organization for Standardization: Geneva, Switzerland, 2007. [Google Scholar]
  24. Cardoso, M.A.; Brito, R.; Pereira, C.; David, L.M. Avaliação da resiliência dos serviços urbanos de águas face às alterações climáticas. In Proceedings of the XVI Seminário Ibero-Americano sobre Sistemas de Abastecimento e Drenagem, SEREA19, Lisbon, Portugal, 15–17 July 2019. [Google Scholar]
  25. CEN. EN 752:2008. Drain and Sewer Systems Outside Buildings; European Standardization Committee: Brussels, Belgium, 2007. [Google Scholar]
  26. Jakob, M.; McKendry, I.; Lee, R. Long-Term Changes in Rainfall Intensities in Vancouver, British Columbia. Can. Water Resour. J. 2003, 28, 587–604. [Google Scholar] [CrossRef] [Green Version]
  27. CBC. British Columbia. City of Vancouver in Middle of the Pack When it Comes to Density. 2020. Available online: https://www.cbc.ca/news/canada/british-columbia/vancouver-density-report-jan-2018-1.4479501#:~:text=36-The%20City%20of%20Vancouver%20is%20the%20densest%20city%20in%20Canada,measured%20by%20the%20Fraser%20Institute (accessed on 22 September 2020).
  28. City of Vancouver. Census Population and Dwelling Results for the City of Vancouver. 2016. Available online: https://vancouver.ca/files/cov/2017-02-08-city-of-vancouver-2016-census-population-and-dwelling-counts.PDF (accessed on 22 September 2020).
  29. City of Vancouver. Greenest City. 2020 Action Plan. 2019–2020 Progress Highlights and Dashboard. 2020. Available online: https://vancouver.ca/files/cov/greenest-city-action-plan-implementation-update-2019-2020.pdf (accessed on 22 September 2020).
  30. CMA. Câmara Municipal de Almada. Almada em 1 minuto. 2020. Available online: https://www.m-almada.pt/xportal/xmain?xpid=cmav2&xpgid=genericPage&genericContentPage_qry=BOUI=5771022&actualmenu=5770956 (accessed on 22 September 2020).
  31. EMAC—Estratégia Municipal de Adaptação às Alterações Climáticas. Município do Porto. ClimaAdaPTt.Local. Agencia Portuguesa do Ambiente (APA). 2016. Available online: https://apambiente.pt/index.php?ref=16&subref=81&sub2ref=118&sub3ref=395 (accessed on 2 September 2019).
  32. Gómez-Gonçalves, A.; Costa, C.; Santana, P. Acessibilidade e utilização dos espaços verdes urbanos nas cidades de Coimbra (Portugal) e Salamanca (Espanha). Finisterra 2014, 49, 49–68. [Google Scholar] [CrossRef] [Green Version]
  33. INE. Censos 2011. Informação estatísica. Publicações. Instituto Nacional de Estatística. 2020. Available online: https://censos.ine.pt/xportal/xmain?xpid=CENSOS&xpgid=ine_censos_publicacoes (accessed on 22 September 2020).
  34. IPMA—Instituto Português do Mar e da Atmosfera. Clima de Portugal Continental. 2020. Available online: https://www.ipma.pt/pt/educativa/tempo.clima/ (accessed on 5 June 2020).
  35. Vela, S. Identification of Potential Hazard for Urban Strategic Services Produced by Extreme Events. 224p. Deliverable 2.1, RESCCUE Project. 2017. Available online: http://www.resccue.eu/sites/default/files/d2.1_identification_of_potential_hazard_for_urban_strategic_services_produced_by_extreme_events.pdf (accessed on 21 September 2020).
  36. City of Vancouver. Vancouver 2020: A Bright Green Future: An Action Plan for Becoming the World’s Greenest City by 2020. 70pp. Vancouver, Greenest City Action Team. 2009. Available online: https://vancouver.ca/files/cov/bright-green-future.pdf (accessed on 22 September 2020).
  37. BCC. Bristol’s Parks and Green Space Strategy. Visual Technology; Bristol City Council: Bristol, UK, 2008; p. 94. Available online: https://www.bristol.gov.uk/documents/20182/34780/Parks+and+Green+Space+Strategy+-+adopted+Feb+2008_0_0_0_0_0_0.pdf (accessed on 21 September 2020).
  38. Cardoso, M.A.; Brito, R.S.; Pereira, C.; David, L.; Almeida, M.C. Resilience Assessment Framework—RAF. Description and implementation. Deliverable 6.4, RESCCUE Project. 105p. (public). 2020. Available online: http://www.resccue.eu/resccue-project (accessed on 1 November 2019).
Figure 1. Identification of the participating cites (adapted from google maps).
Sustainability 12 10040 g001
Figure 2. Overall percentage of RAF metrics results for the cities, within each development level, regarding the essential analysis degree.
Sustainability 12 10040 g002
Figure 3. RAF metrics results for the cities, aggregated at the objective level, namely, (a) City #1; (b) City #2; (c) City #3; (d) City #4; (e) City #5; (f) City #6; (g) City #7; (h) Objectives description.
Sustainability 12 10040 g003
Figure 4. Identification of the main metrics with incipient resilience development level.
Sustainability 12 10040 g004
Figure 5. Identification of the main metrics with advanced resilience development level.
Sustainability 12 10040 g005
Figure 6. Percentage of the (a) answered, (b) not answered, and (c) not applicable metrics by cities, aggregated for each resilience objective.
Sustainability 12 10040 g006
Figure 7. Box-plots for the answered metrics for the resilience objectives, based on the application of the RAF essential analysis degree.
Sustainability 12 10040 g007
Figure 8. Box-plots for the answered metrics for the resilience capabilities, based on the application of the RAF essential analysis degree.
Sustainability 12 10040 g008
Figure 9. Box-plots for the performance, risk, and cost answered metrics, based on the application of the RAF essential analysis degree.
Sustainability 12 10040 g009
Table 1. RAF objectives, criteria, and metrics of the essential analysis degree, identifying the metric’s type.
ObjectivesCriteriaMetric TypeMetrics
DIMENSION I1. Governance and stakeholders’ involvement1.1 NBS planning at the city levelData based1.1.1 Ecosystem services and protective infrastructure identification
Data based1.1.2 NBS plan or strategy alignment with ecosystem services
Data based1.1.3. Risk identification
1.2 Stakeholders’ awareness and involvementData based1.2.1 Stakeholder service awareness
Data based1.2.2 Civil society links
Data based1.2.3 Awareness campaigns and events
2. Economic sustainability2.1 Public financeData based2.1.1 NBS budget
Data based2.1.2 NBS financial support to community involvement
Procedure based2.1.3 NBS annual cost
Procedure based2.1.4 Scenario impact on NBS annual cost
2.2 Economic opportunities Data based2.2.1 Greens jobs opportunities
Data based2.2.2 Business and activities with benefits
Data based2.2.3 Tourism enhancement
3. Social involvement and co-benefits3.1 Citizens’ engagement and accessibility to NBSData based3.1.1 Citizens engagement to NBS
Data based3.1.2 Public accessibility
Data based3.1.3 NBS distribution
3.2 Social co-benefitsData based3.2.1 Citizens awareness of NBS urban heat island
Data based3.2.2 Health and well-being co-benefits
Data based3.2.3 Urban biodiversity
Data based3.2.4 Aesthetical and recreational importance
4. Environmental resilience4.1 Fresh water provisionData based4.1.1 Groundwater recharge
4.4 Water treatment Data based4.4.1 Use of NBS for stormwater treatment
Data based4.4.2 Use of NBS for wastewater treatment
Data based4.4.3 Standing water quality
4.5 Erosion prevention and maintenance of soil fertilityData based4.5.1 Regeneration of abandoned areas
Data based4.5.2 Land slide and erosion prevention
4.6 Habitats for species promotionData based4.6.1 Adequate living spaces
Data based4.6.2 Undesired species
DIMENSION II5. Spatial planning5.1 Hazard and exposure mappingData based5.1.1 Presentation process for risk information
Data based5.1.2 NBS on risk areas
5.2 Land use and NBS inclusionData based5.2.1 Land use planning
Data based5.2.3 Integration of NBS into city policy and projects
6. Service management6.1 Service management and planningData based6.1.1 Integrated management plan and NBS management
Data based6.1.2 Service articulation
6.2 Resources availability and adequacyData based6.2.1 Service management and competences adequacy
Data based6.2.2 Financial, operational and technical resources
7. Resilience engaged service7.1 Flexible serviceData based7.1.1 Ecosystem service improvement
Data based7.1.2 Water reuse
7.2 Scenarios relevance for disaster responseData based7.2.1 Scenarios definition
Data based7.2.2 Risk awareness in scenarios
8. Infrastructure safety and robustness8.1 Infrastructure assets criticality and protectionData based8.1.1 Critical components
Data based8.1.2 Protective buffer
8.2 Infrastructure assets robustnessData based8.2.5 Overall hydraulic performance
Data based8.2.6 Overall water quality
8.3 Infrastructure monitoring and maintenanceData based8.3.1 Monitoring program
Data based8.3.2 Monitored variables and relevant aspects
Data based8.3.3 Maintenance program
Data based8.3.4 Variables and relevant aspects for maintenance
9. Infrastructure preparedness9.1 Infrastructure preparedness for recovery and buildbackData based9.1.2 Overall hydraulic performance under stress
Data based9.1.3 Overall water quality performance under stress
10. Infrastructure dependence and autonomy10.1 Infrastructure dependenceData based10.1.1 NBS dependency from other services
Data based10.1.2 Infrastructure of other services dependent on NBS infrastructure
10.2 Infrastructure autonomyData based10.1.3 Infrastructure autonomy
Table 2. Characterization of the participating cities.
CityLocationTotal AreaGreen AreaResident PopulationPopulation Density
Units[-][km2][km2][hab.][hab./km2]
AlmadaCoastal area and near to river70.0No available data174,0302486
BarcelonaCoastal area and near to river101.436.11,619,33715,873
BristolCoastal area and near to river110.018.7449,3004085
CoimbraNear to river58.7No available data143,3962485
LisbonCoastal area and near to river85.823.3547,7336446
PortoCoastal area and near to river41.43.0237,5915739
VancouverCoastal area and near to river114.020.5631,4865493
Sources: [27,28,29,30,31,32,33,34,35].
Publisher’s Note: MDPI stays neutral with regard to jurisdictional claims in published maps and institutional affiliations.

