Article

Importance of Urban Green at Reduction of Particulate Matters in Sihwa Industrial Complex, Korea

Urban Forests Research Center, National Institute of Forest Science, 57, Hoegiro, Dongdaemun-gu, Seoul 02455, Korea
*
Author to whom correspondence should be addressed.
Sustainability 2020, 12(18), 7647; https://doi.org/10.3390/su12187647
Submission received: 5 July 2020 / Revised: 5 September 2020 / Accepted: 12 September 2020 / Published: 16 September 2020

Abstract

:
The utilization of urban green areas has increased, but it is unclear whether urban green areas can decrease the concentration of particulate matter at an industrial complex city in Korea. We measured the extent of particulate matter (PM) reduction at a buffer green area in the Sihwa Industrial Complex. PM was measured at the industrial complex, the urban green area, and a nearby residential area from April to October 2019. PM reduction rates were highest at the urban green area in August and October, which is related to increased atmospheric mixing height and the active west wind blowing from the industrial complex to the residential area. Reduction rates of PM10 and PM2.5 at the urban green area showed the lowest values, namely 14.4% and 25.3%, respectively. The air temperature, wind speed, and humidity could affect the PM reduction rate by influencing the movement and dispersion of PM at the micro-spatiotemporal scale. These results indicated that PM concentration could be reduced by the structural change of a forest layer at a micro scale in urban green areas.

1. Introduction

High domestic PM concentration is known to lead to increased human activity at urban green areas in industrial complex cities. The PM concentration in Korea is usually expressed as the same concentration according to the area where the national atmospheric monitoring station is installed. However, the actual PM values vary, and they change in accordance with the existence of the urban green areas [1,2]. Thus, citizens want to know information about the PM concentration under the forest canopy at hiking time. Urban green area is currently regarded as an important PM reduction measure that is highly accessible to citizens, and it also performs the role of atmospheric purification [3,4,5]. As a result, urban green area is widely used to manage the urban atmosphere [6,7].
Urban green area can reduce PM by absorption, blocking, and deposition. In the process of photosynthesis, the trees in the green area can absorb gaseous air pollutants such as carbon dioxide (CO2), nitrogen dioxide (NO2), and sulfur dioxide (SO2) through the stomata of the leaves [8]. The tree canopy can also reduce the speed and movement of PM, resulting in PM being blocked and then falling to the surface of the ground [9,10]. Areas with large forest cover ratios were found to have lower PM concentrations than highly urbanized areas [2,7]. However, some studies have reported that the effects of urban green area on the urban atmosphere appear to be limited. The presence of roadside green area interferes with the airflow, causing roadside PM to stagnate and resulting in a higher PM concentration at the roadside green area than at other areas on the roadside [11,12]. The status of PM adsorbed on the leaves could reach the saturation point and block the stoma during the dry winter season [13]. The deposition rate is also sensitive to weather conditions [3,14]. Leaf PM deposition velocity was found to increase with increasing wind speed [15,16], and PM removal rates from the leaf surface were found to be correlated with high rainfall intensity and duration [17]. Therefore, urban green areas have different effects of PM reduction that depend on their structure and the meteorological factors that affect PM movement. It is important to identify the characteristics of PM reduction in urban green areas according to environmental conditions and meteorological factors.
Most studies have focused on identifying the reduction of PM concentration with equations and chamber-based experiments [15,16,17], so the effects of reducing air pollutants through urban green space need to be verified in the field.
To identify the characteristics of PM reduction in urban green areas, we conducted a study in the buffer green area of the Sihwa Industrial Complex. The research objectives were to determine the effect of urban green area in reducing PM; analyze the relationship between PM, the meteorological factors, and air pollutants; and identify the seasonal patterns of PM reduction by urban green areas.

2. Materials and Methods
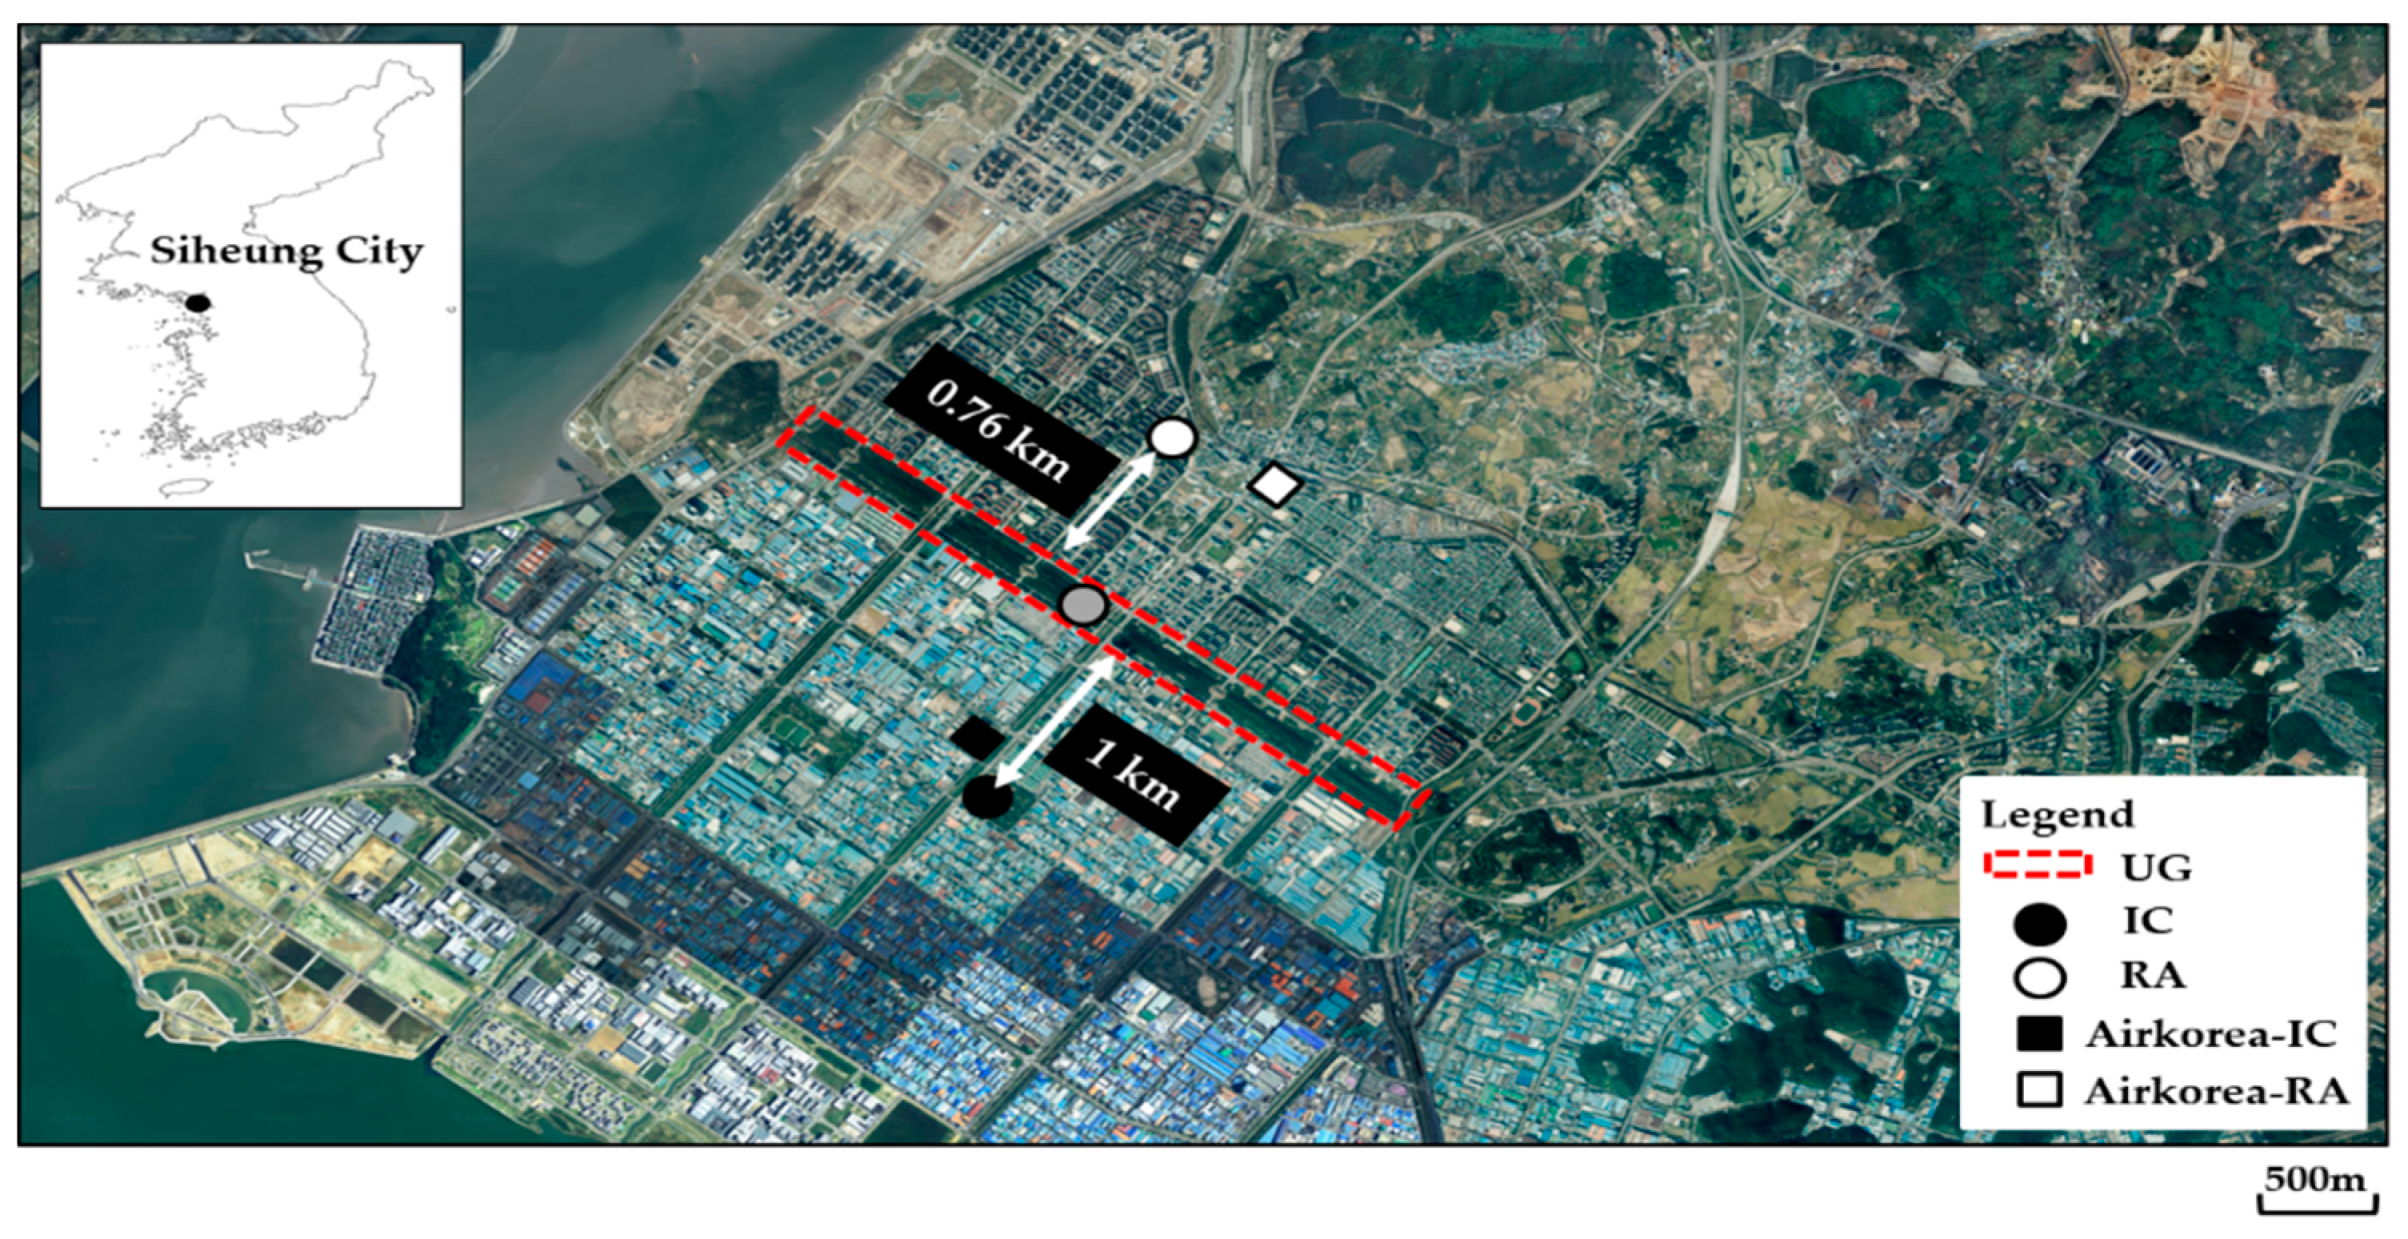
2.1. Study Site

The study site, Sihwa (37°22′N, 126°46′E), is a national industrial complex adjacent to the west coast of Korea and consists of steel-, chemical-, and machinery-oriented industries. The main air pollutants of the Sihwa Industrial Complex are NO2 and SO2 emissions, which are caused by the operation of vehicles and ships as well as the combustion involved in manufacturing activities during the production process [18]. The Sihwa Industrial Complex has the characteristic of wind blowing in the northwest direction, from the coast to the land. Thus, the buffer green area was established in the 2000s to prevent the spread of air pollutants and odor from the industrial complex to the residential area. The buffer green area is an urban green area located in the center of Sihwa Industrial Complex and New City. The dimensions of this site are 3.46 km (L), 0.18 to 0.25 km (W), and 10 m (H), and it consists of a Japanese black pine (Pinus thunbergii) and Japanese red pine (Pinus densiflora) community [19]. The densities of the Japanese black pine (Pinus thunbergii) and Japanese red pine (Pinus densiflora) are 24.5 trees/100 m2 and 0.75 trees/100 m2, respectively. To analyze the PM reduction effect of the urban green area, we selected three PM monitoring points: Somang park in the industrial complex (IC; 37°20′ N, 126°43′ E), the urban green area (UG; 37°20′ N, 126°43′ E), and Jungang park in the residential area (RA; 37°20′ N, 126°44′ E) (Figure 1). The distance between IC and UG is 1 km, and the distance between RA and UG is 0.76 km. As IC is surrounded by various industries and RA is a nearby apartment complex, we considered that these measuring points could reflect the characteristics of PM in each area. IC is dominated by Pinus strobus (4.5 trees/100 m2) and Pseudocydonia sinensis (0.5 trees/100 m2). RA is made up of Pinus rigida (8.75 trees/100 m2) and Pinus densiflora (0.5 trees/100 m2).

2.2. Measurement Method

The PM10 and PM2.5 concentrations were measured by a mobile PM measuring device, Dustmate (Turnkey, UK, ±5% accuracy), which was installed 1.5 m above the ground. The use of Dustmate for analyzing PM concentrations proved to be successful in studies [20,21]. Dustmate is a real-time PM mass concentration meter that uses the light scattering method. The Sihwa Industrial Complex is a coastal area and is highly influenced by onshore winds. Thus, Dustmate is suitable for checking varied PM concentrations in real time and can measure at high concentrations. However, in the case of the light scattering method, the concentration can be overestimated because the material can cause interference in light transmission, which could be highly influenced by humidity [22]. We excluded the PM concentration data with humidity values over 80% to avoid overestimation of PM concentrations due to binding effects of vapor particles and particulate matter. PM monitoring was conducted from April to October 2019; citizens in Korea usually visit urban green areas and enjoy the outdoors during this season. We measured the PM concentration in the morning rush hour (7–9 h), around noontime (11–13 h), and during evening rush hour (16–18 h), considering the peak hours with a large transient population. We measured data at intervals of 1 s and used these data as averages of 5 min. Based on these PM concentration data, we calculated the time mean, monthly average, and reduction rates of PM as follows:
PM   reduction   rate   ( % ) = 100   ×   C I C   C R A C I C
where C I C is PM concentration in IC and C R A is PM concentration in RA.
In order to identify the seasonal patterns of PM reduction by UG, the relationship between PM, meteorological factors, and air pollutants was analyzed. We used a portable weather meter to measure temperature, wind direction, wind speed, and humidity at each point for 24 h. Since the Dustmate equipment could not measure the concentrations of air pollutants (ozone (O3), NO2, SO2, carbon monoxide (CO)), these concentrations were measured by the national atmospheric environmental research stations located nearby in IC (Airkorea-IC; 37°20′N, 126°43′E) and RA (Airkorea-RA; 37°20′N, 126°44′E) (Figure 1). We hypothesized that the values from those stations could represent the air pollutant concentrations for the measuring points.

2.3. Analysis Method

We grouped the PM concentrations, meteorological factors, and air pollutants measured by season, i.e., spring (April and May), summer (June and August), and fall (September and October). To analyze the seasonal characteristics of PM reduction in UG, we performed the Pearson correlation analysis among these grouped data by using R v.3.0.2 (R Core Development Team 2019). Statistical analysis using the Tukey HSD procedure of R v.3.0.2 was also conducted on PM concentration and PM reduction rate. The least squares mean was used to test significant differences among measuring points and over month and hour at the 5% probability level.

3. Results

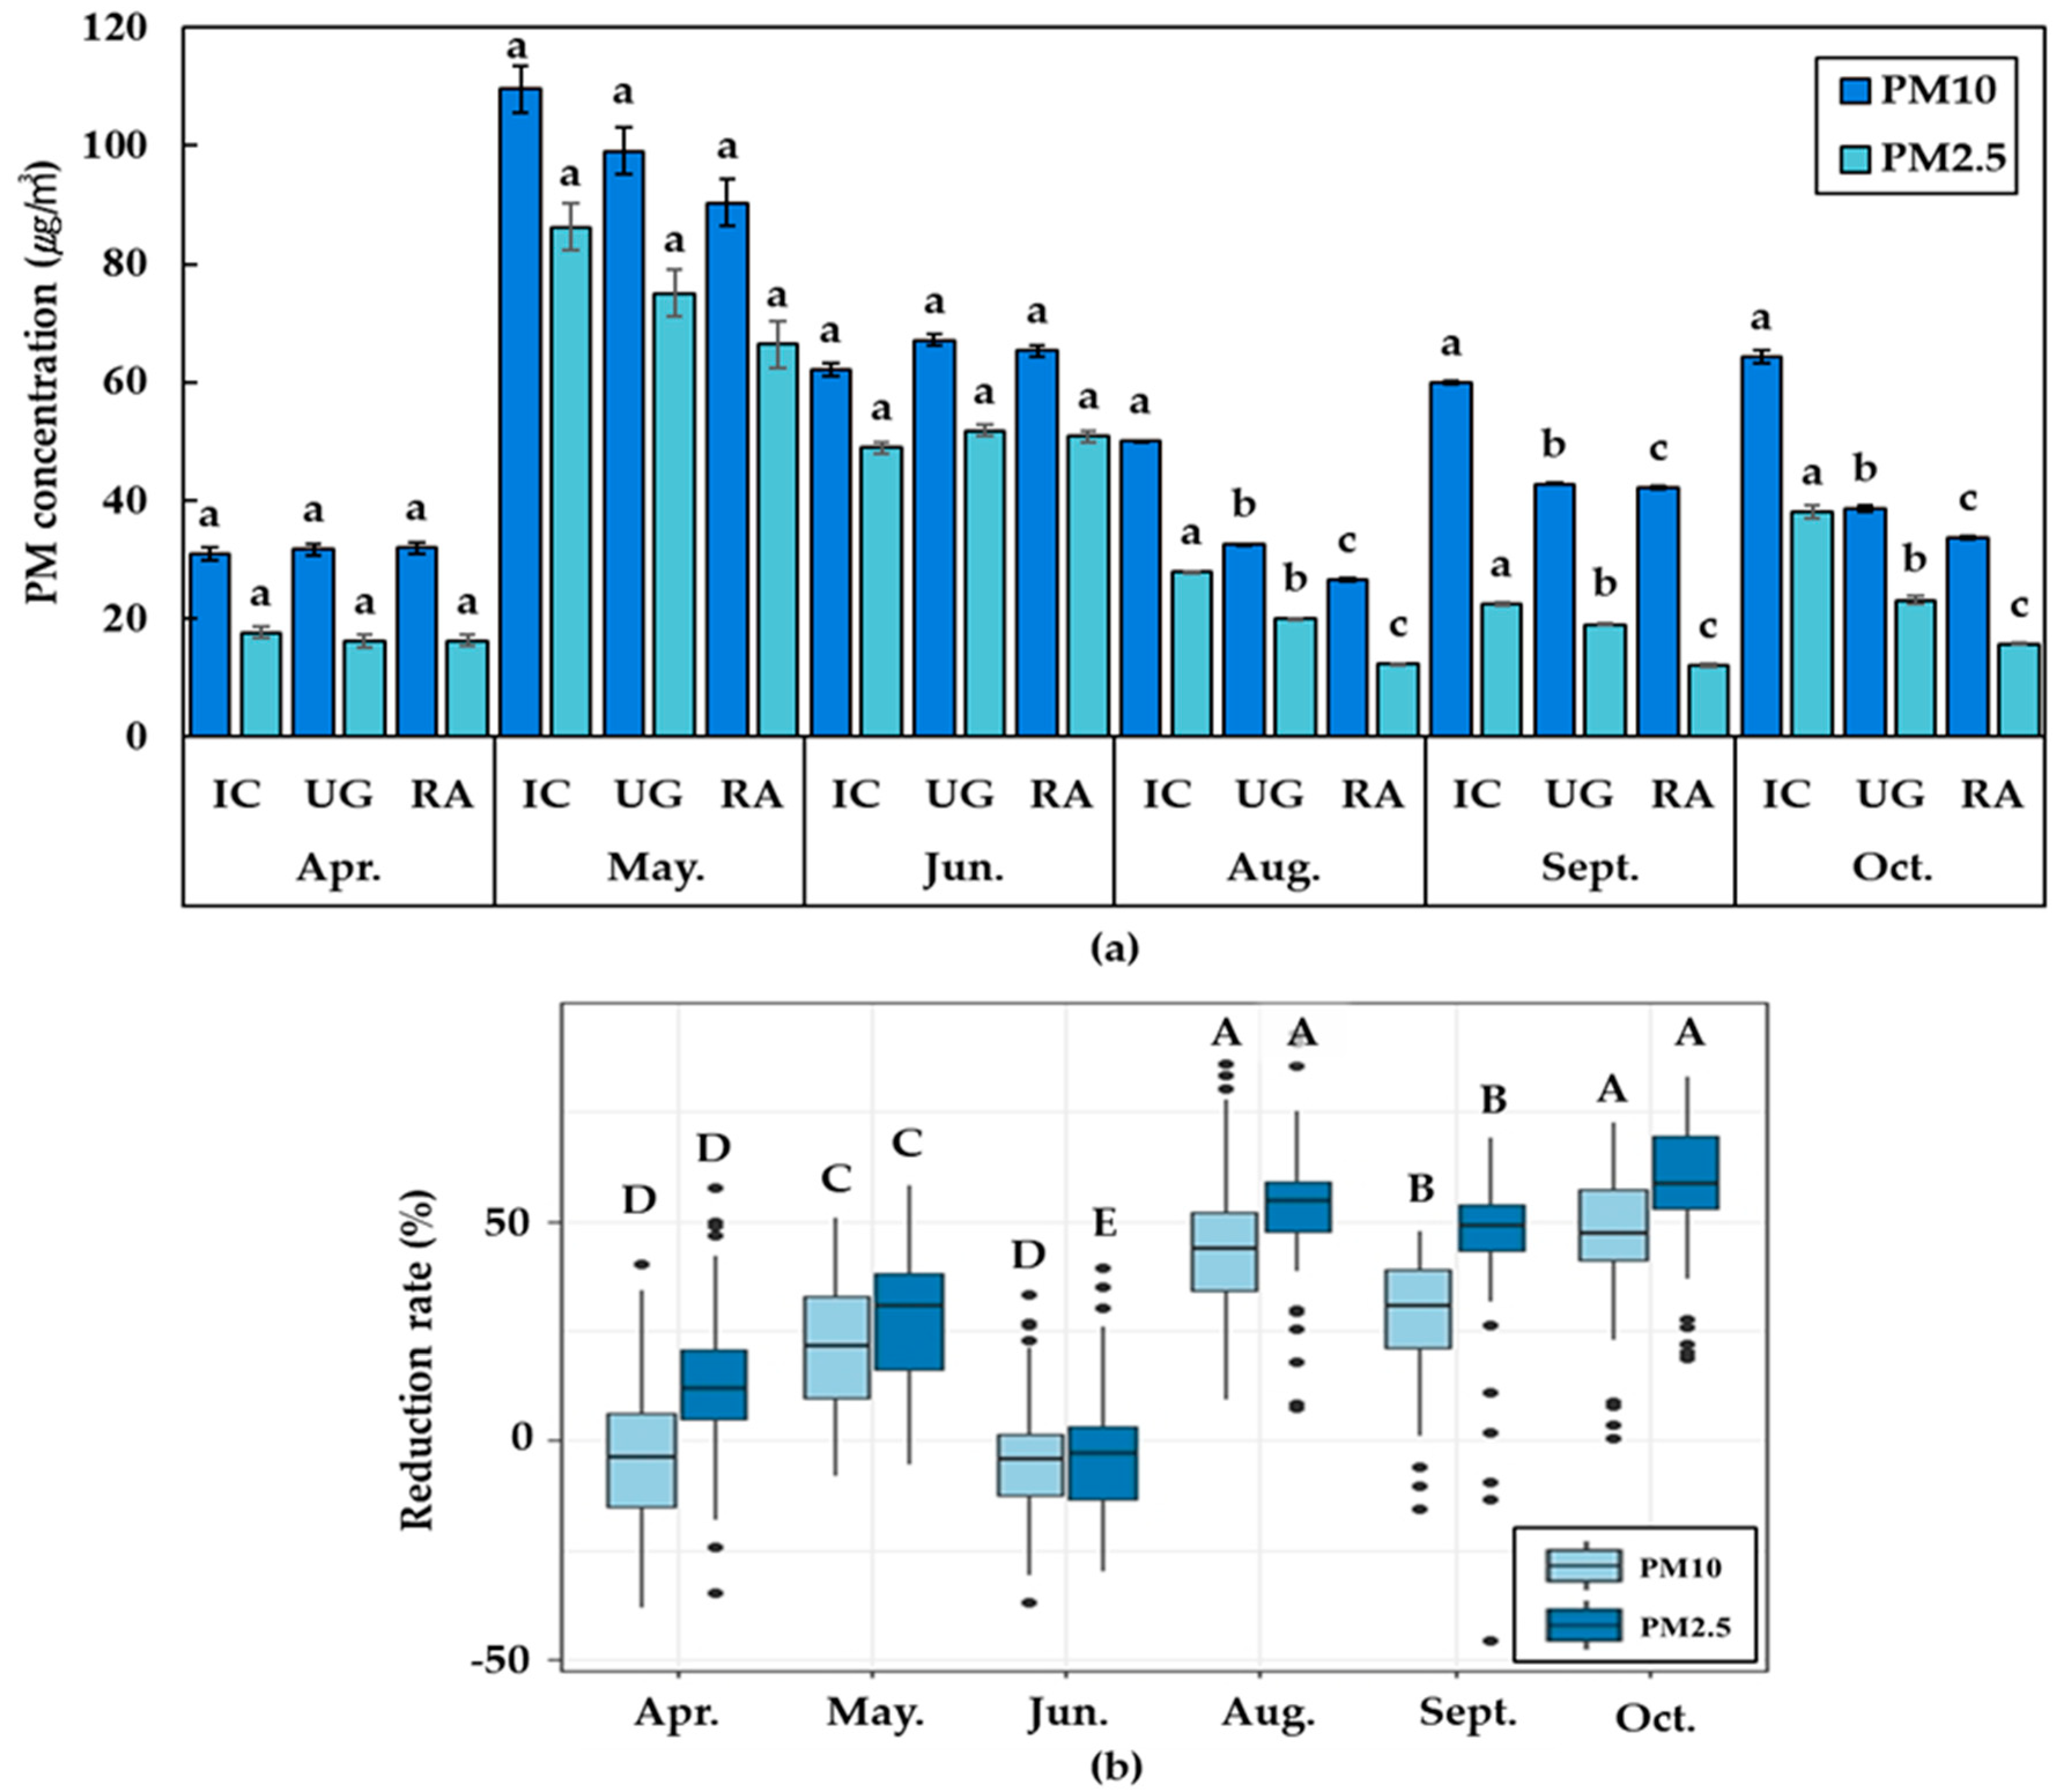
3.1. Monthly PM Concentration and PM Reduction Rate

We analyzed the monthly PM concentration, excluding PM data in July when the humidity exceeded 80%. Regardless of PM measuring points, the highest PM10 and PM2.5 concentrations were observed in May, with values of 99.7 µg/m3 and 75.9 µg/m3, respectively (Figure 2a). During the measuring period, the average PM10 and PM2.5 concentrations were shown to be at bad levels (daily mean PM10, 80–150 µg/m3; daily mean PM2.5, 35–75 µg/m3) in May, while they were observed to be at normal levels (daily mean PM10, 30–80 µg/m3; daily mean PM2.5, 15–35 µg/m3) in April. Thus, the difference between April and May values was high, even though these measurements were collected in the same season. After May, PM levels gradually decreased, with the lowest concentration being observed in August. In September, PM levels began to increase again. Large deviations of PM10 and PM2.5 concentrations were observed in the spring, meaning that high PM concentration occurred frequently during that time. On the other hand, summer and fall showed a low deviation of PM concentration, indicating that PM levels were maintained relatively constant compared to spring. Furthermore, no significant differences in PM concentration levels were shown in April, May, and June between the measuring points (Figure 2a). Except for these months, high PM levels were shown, following the order of IC, UG, and RA. In August, monthly PM10 and PM2.5 reduction rates were high, with values of 44.3% and 56.4%, respectively. The monthly PM10 and PM2.5 reduction rates in October were high as well, reaching 43.5% and 54.2%, respectively. The lowest PM reduction rates were observed in June (Figure 2b).

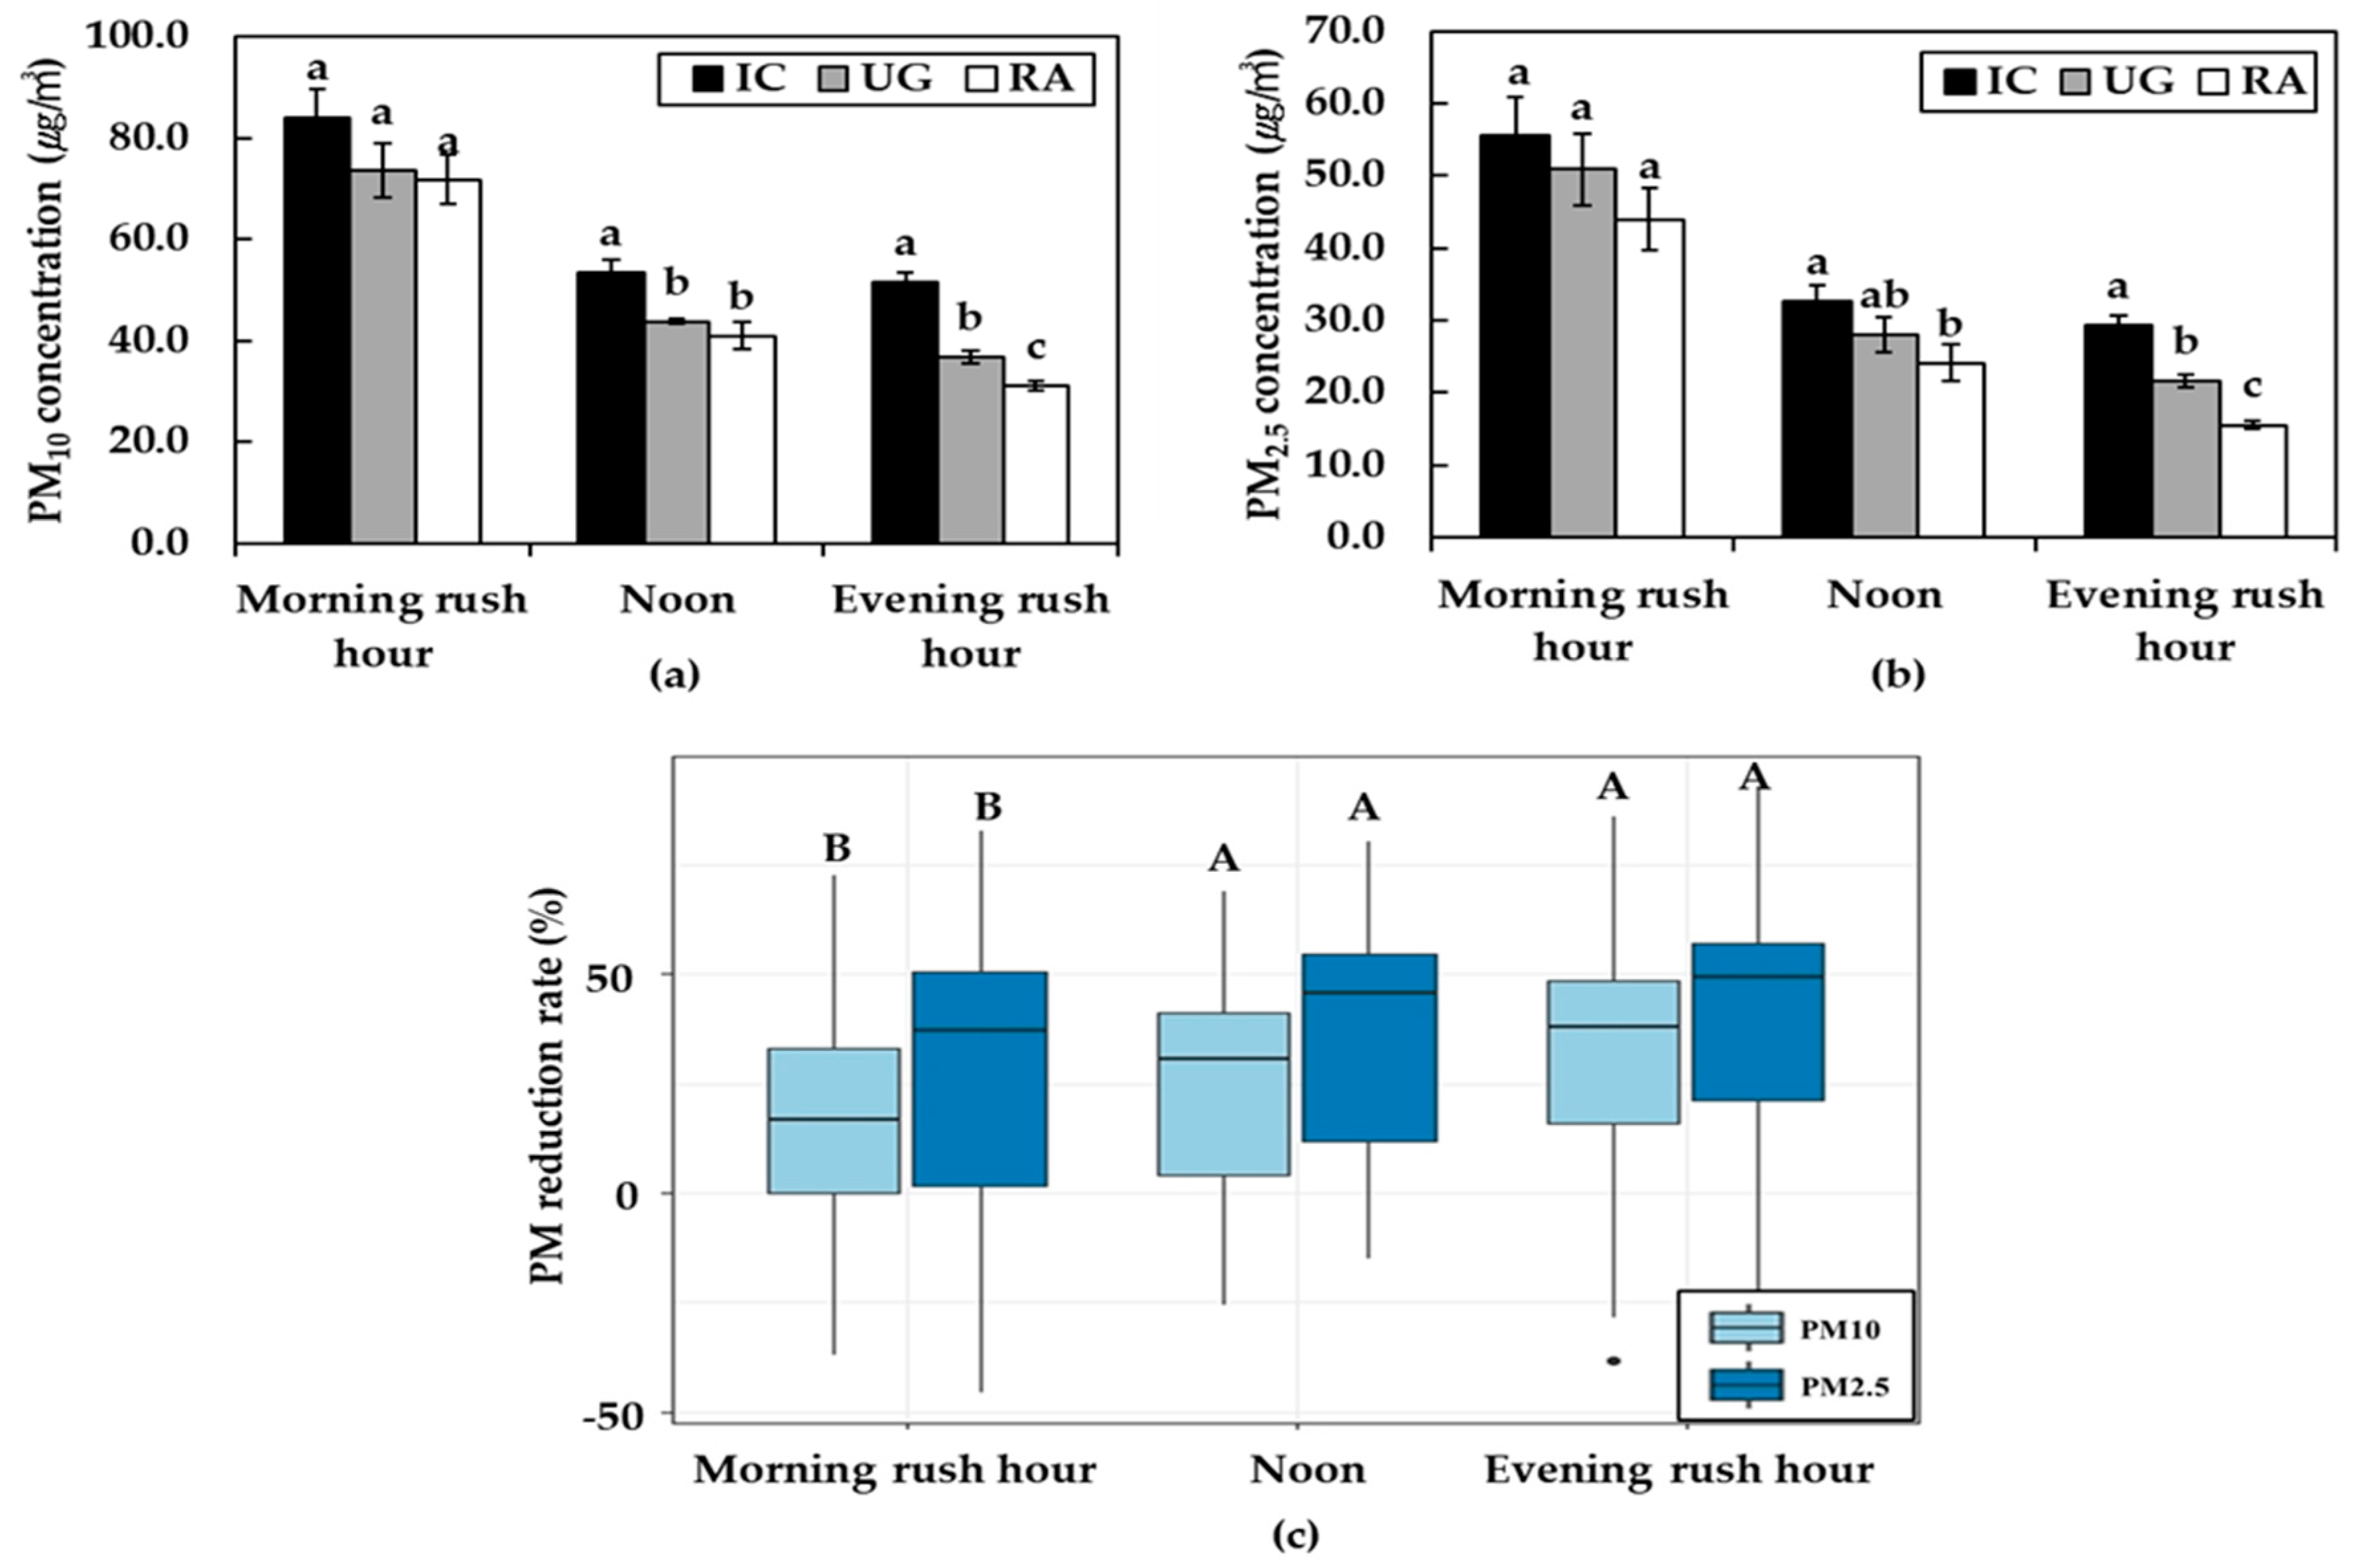
3.2. Hourly PM Concentration and PM Reduction Rate

In the case of hourly PM concentration, the PM10 and PM2.5 concentrations were the highest during the morning rush hour, reaching 77.9 and 51.4 µg/m3, respectively (Figure 3a,b). The high PM concentration in the morning rush hour gradually decreased after noon, and the value in the evening rush hour was 30% lower than that in the morning rush hour. PM10 and PM2.5 reduction rates were the highest (31.4% and 40.3%, respectively) during the evening rush hour, while those of the morning rush hour were the lowest (15.0% and 26.0%, respectively) (Figure 3c).

3.3. Relation between PM Concentration, Meteorological Factors, and Air Pollutants by Season

The PM concentration levels are affected by meteorological factors and the amount of emitted air pollutants. In this study, we considered the meteorological factors and air pollutants as factors affecting the PM concentration. Table 1 shows the correlation coefficients between the PM, meteorological factors, and air pollutants. In spring, PM levels shows positive correlation with humidity, NO2, and CO, while negative correlation was shown with wind speed and O3. In summer, PM levels were positively correlated with the amount of SO2 and negatively correlated with the temperature. In the case of fall, correlation between the PM and meteorological factors was the same as in spring, and PM was positively correlated with NO2, CO, and SO2.

4. Discussion

4.1. Factors Affecting the Monthly PM Reduction in Urban Green Areas

Overall, the PM values were higher at IC than at UG and RA. This result could be attributed to the PM reduction effects of UG. As PM generated from IC passed through UG, trees could absorb PM via leaf stomata [8,23] and remove PM by deposition onto the leaves and branches [24,25]. However, we also considered the spatial distance effect on PM reduction according to the distance from pollutant emission areas. PM10 and PM2.5, which have a long atmospheric lifetime [26], decreased, so we can speculate that the influence of UG on PM reduction was greater than that of distance.
The difference between the PM reduction rates of IC and RA was especially high in August and October. The high PM reduction rate in August seemed to be related not only to PM reduction mechanism of UG but also to an increase of atmospheric mixing height during the summer [27,28,29]. The dispersion of PM occurred rapidly due to active mixing by air turbulence in the summer [28], leading to a minimum PM concentration. Therefore, it is likely that PM could quickly spread due to the effects of intensive air mixing and prevailing western wind systems, resulting in increasing PM reduction through UG. High PM reduction rates in October were also related to the active atmospheric dispersion affecting the PM reduction, similar to the results observed in August. Moreover, the cleaning effect due to high precipitation in August during the monsoon rainy season should be considered. However, we excluded the effect of PM reduction caused by precipitation because we sampled PM in the dry period, not on rainy days. June, the sharing the summer season with August, had the lowest PM reduction rate. This phenomenon appears to be related to high humidity (remaining in the range of 60% to 70%) in June, whereas other months had lower humidity. The increase of humidity in the atmosphere could reduce solar radiation reaching the earth surface, resulting in adjusting the atmospheric temperature to be similar to that of the earth. As the atmosphere nearer to the surface becomes colder than the upper layers, the air currents seem to decrease and air pollutants become stagnant [30,31]. Therefore, the high humidity interferes with upward-moving air currents, leading to the increase of air pollutant concentrations.

4.2. Factors Affecting the Hourly PM Reduction in Urban Green Areas

High PM levels during the morning rush hour seemed to be related to increased traffic loads. Thus, this result is likely because of the effects of PM generated by vehicles and atmospheric congestion during the early morning. We observed that the PM concentrations in the morning rush hour slightly decreased after noon. This was related to active atmospheric dispersion, as temperature and wind speed slowly increased and humidity decreased after noon. A similar pattern was reported in a metropolitan city in Korea, where high PM concentration and size distribution of PM were affected by increased traffic volumes during the morning rush hour (6–9 h) and then decreased when the wind speed increased [22].
A great reduction in PM concentration during the evening rush hour was related to the strong west wind blowing from IC to RA. It is likely that the PM-reducing effect of UG is greatly increased when PM in IC passes through the UG due to the strong west wind and active atmospheric diffusion after noon. On the other hand, a low PM reduction rate was shown in the morning rush hour in study areas, which was related to the high PM concentration at RA. In the case of RA, with an increase in traffic during the morning rush hour, PM congestion was caused by the east wind blowing and the residential area being surrounded by high apartments [22,32,33]. PM concentration in RA was more affected by high traffic volume and PM congestion than PM from IC during the morning rush hour. The atmospheric diffusion models indicated that air pollutants would not spread actively in the residential area due to the west wind from the coast and the east wind from land coexisting in the study area [34].

4.3. Factors Affecting the PM Concentration by Season

This study showed a high concentration of PM in May. Recently simulated PM concentrations showed a strong negative correlation with regional wind speed, implying that reduced regional ventilation is likely associated with more stagnant conditions that cause severe pollutant episodes in South Korea [35]. Furthermore, temperature and wind speed had a negative correlation with PM, which is related to active atmospheric diffusion with increasing temperature and wind speed [36], and the high temperature influences convective air currents, resulting in rapid dispersion of PM in the atmosphere [29]. It is known that humidity contributes to the increase in PM concentration by acting as the condensation nucleus of air pollutants [37].
PM concentration was positively correlated with NO2, CO, and SO2. This is related to the PM formation, as air pollutants are precursors of PM [38,39]. PM concentration in summer had especially high correlation with SO2, while NO2 and CO were highly correlated with PM concentration in spring and fall. In summer, as the atmospheric diffusion becomes more active, the SO2 diffusion produced by the operation of the industrial complex could affect the overall PM concentrations at the measuring points [3,40]. In spring and fall, as NO2 and CO produced from the vehicles spread in all directions around the roadside, they could have a greater impact on PM concentration when compared to SO2 from the industrial complex [3,34]. Thus, the analysis of the PM composition is needed to identify the exact path of air pollutants.
O3 only showed a negative correlation with PM, which might be related to the organic PM generation process through oxidation of volatile organic compounds (VOCs) by O3 [41]. However, Bell et al. [42] observed a positive correlation between PM and O3, as PM and O3 are produced by photochemical reactions. These contradictory results indicate that PM and O3 levels are driven by a combination of the chemical reactions of their precursors and meteorological factors. Therefore, it is necessary to analyze the correlation between PM and O3 by identifying the environmental factors affecting these occurrences. In addition, measuring O3 in urban green areas and analyzing PM formation and extinction data should be conducted to understand the real correlation between O3 and PM in urban green areas.

5. Conclusions

This study investigated the PM-reducing effect of an urban green area in the Sihwa Industrial Complex. Monthly PM reduction was related to the atmospheric mixing height and west wind blowing. Hourly PM reduction was affected by the speed and direction of wind and the vehicle traffic volumes. Thus, the reduction of PM by the urban green area was associated with PM absorption, adsorption and deposition on leaves, monthly mixing height, and the large scale of air current movement affecting air stagnation and PM dispersion. Our results suggest that an urban green area will reduce PM concentration if the forest layer of the urban green area is planted at a proper location, with changes made as necessary, and the operation of industries and vehicles is managed. However, this study only identified the PM-reducing effect of an urban green area based in a limited space, namely Sihwa Industrial Complex, and analyzed the measured data just for a short period of time. Furthermore, we did not measure PM without an urban green area to confirm the real PM reduction effect of the urban green area. Further research on PM measurement at a control site is required, and it is necessary to identify the overall seasonal PM reduction characteristics through long-term monitoring. Moreover, as the wind condition significantly influences the urban green area’s PM reduction effect, further research of prevailing wind field modeling at spatial boundaries on a city level should be carried out to address local solutions for reducing PM concentration.

Author Contributions

Collecting the field data and writing the paper, S.-Y.Y.; collecting the field data and analyzing the statistical data on meteorological factors and pollutants, T.K. and S.H.; managing the research project and contributing to the discussion of wind fields and urban green areas, S.C.; designing the study site and measuring equipment and statistical analyses of all data, C.-R.P. All authors have read and agreed to the published version of the manuscript.

Funding

This research received no external funding.

Acknowledgments

This study was funded by National Institute of Forest Science of Korea, grant number NIFOS FE0000201801.

Conflicts of Interest

The authors declare no conflict of interest.

References

  1. Chen, W.Y.; Jim, C.Y. Assessment and Valuation of the Ecosystem Services Provided by Urban Forests. Ecology, Planning, and Management of Urban Forests; Springer: New York, NY, USA, 2008. [Google Scholar]
  2. Irga, P.J.; Burchett, M.D.; Torpy, F.R. Does urban forestry have a quantitative effect on ambient air quality in an urban environment? Atmos. Environ. 2015, 120, 173–181. [Google Scholar] [CrossRef] [Green Version]
  3. Song, Y.-B. Effect of Green Buffer Zone in Reducing Gaseous Air Pollutants in the Shiwha Industrial Area. J. Korean Inst. Landsc. Archit. 2006, 33, 90–97. [Google Scholar]
  4. Vos, P.E.J.; Maiheu, B.; Vankerkom, J.; Janssen, S. Improving local air quality in cities: To tree or not to tree? Environ. Pollut. 2013, 183, 113–122. [Google Scholar] [CrossRef] [PubMed]
  5. Hwang, K.-I.; Han, B.-H.; Kwark, J.-I.; Park, S.-C. A Study on Decreasing Effects of Ultra-fine Particles (PM2.5) by Structures in a Roadside Buffer Green—A Buffer Green in Songpa-gu, Seoul. J. Korean Inst. Landsc. Archit. 2018, 46, 61–75. [Google Scholar] [CrossRef] [Green Version]
  6. Zheng, D.; Ducey, M.J.; Heath, L.S. Assessing net carbon sequestration on urban and community forests of northern New England, USA. Urban For. Urban Green. 2013, 12, 61–68. [Google Scholar] [CrossRef]
  7. Choi, T.-Y.; Moon, H.-G.; Kang, D.-I.; Cha, J.-G. Analysis of the Seasonal Concentration Differences of Particulate Matter According to Land Cover of Seoul - Focusing on Forest and Urbanized Area -. J. Environ. Impact Assess 2018, 27, 635–646. [Google Scholar]
  8. Janhäll, S. Review on urban vegetation and particle air pollution - Deposition and dispersion. Atmos. Environ. 2015, 105, 130–137. [Google Scholar] [CrossRef]
  9. Nowak, D.J.; Crane, D.E.; Stevens, J.C. Air pollution removal by urban trees and shrubs in the United States. Urban For. Urban Green. 2006, 4, 115–123. [Google Scholar] [CrossRef]
  10. Salmond, J.A.; Williams, D.E.; Laing, G.; Kingham, S.; Dirks, K.; Longley, I.; Henshaw, G.S. The influence of vegetation on the horizontal and vertical distribution of pollutants in a street canyon. Sci. Total Environ. 2013, 443, 287–298. [Google Scholar] [CrossRef]
  11. Pataki, D.E.; Carreiro, M.M.; Cherrier, J.; Grulke, N.E.; Jennings, V.; Pincetl, S.; Pouyat, R.V.; Whitlow, T.H.; Zipperer, W.C. Coupling biogeochemical cycles in urban environments: Ecosystem services, green solutions, and misconceptions. Front. Ecol. Environ. 2011, 9, 27–36. [Google Scholar] [CrossRef]
  12. Hong, S.; Kang, R.; An, M.; Kim, J.; Jung, E. Study on the Impact of Roadside Forests on Particulate Matter between Road and Public Openspace in front of Building Site - Case of Openspace of Busan City hall in Korea -. Korean J. Environ. Ecol. 2018, 32, 323–331. [Google Scholar] [CrossRef]
  13. Shackleton, K.; Bell, N.; Smith, H.; Davies, L. The Role of Shrubs and Perennials in the Capture and Mitigation of Particulate Air Pollution in London; Centre for Environmental Policy: London, UK, 2010. [Google Scholar]
  14. Kim, S. Analytic Model for Concentration Deficit Profile Caused by a Large Vegetated Area. J. Korean Soc. Atmos. Environ. 2000, 16, 539–544. [Google Scholar]
  15. Nowak, D.J.; Hirabayashi, S.; Bodine, A.; Hoehn, R. Modeled PM 2. 5 removal by trees in ten U. S. cities and associated health effects. Environ. Pollut. 2013, 178, 395–402. [Google Scholar] [CrossRef] [PubMed]
  16. Han, D.; Shen, H.; Duan, W.; Chen, L. A review on particulate matter removal capacity by urban forests at different scales. Urban For. Urban Green. 2020, 48, 126565. [Google Scholar] [CrossRef]
  17. Zhang, L.; Zhang, Z.; Chen, L.; McNulty, S. An investigation on the leaf accumulation-removal efficiency of atmospheric particulate matter for five urban plant species under different rainfall regimes. Atmos. Environ. 2019, 208, 123–132. [Google Scholar] [CrossRef]
  18. Korea Environment Institute. Calculation of PM2.5 Contribution Concentrations and Early Deaths due to Operation of Major National Industrial Complexes. Nihon Shoni Arerugi Gakkaishi. Japanese J. Pediatr. Allergy Clin. Immunol. 2018, 22, 1–15. [Google Scholar] [CrossRef]
  19. Choi, J.-W. A Study on Vegetation Changes for 11years and Vegetation Structure in the Green Buffer Zone of Sihwa Industrial Complex. J. Korean Soc. Environ. Restor. Technol. 2018, 21, 81–96. [Google Scholar] [CrossRef]
  20. Chen, J.; Yu, X.; Sun, F.; Lun, X.; Fu, Y.; Jia, G.; Zhang, Z.; Liu, X.; Mo, L.; Bi, H. The concentrations and reduction of airborne particulate matter (PM10, PM2.5, PM1) at shelterbelt site in Beijing. Atmosphere (Basel). 2015, 6, 650–676. [Google Scholar] [CrossRef] [Green Version]
  21. Wu, Y.; Liu, J.; Zhai, J.; Cong, L.; Wang, Y.; Ma, W.; Zhang, Z.; Li, C. Comparison of dry and wet deposition of particulate matter in near-surface waters during summer. PLoS ONE 2018, 13, 1–15. [Google Scholar] [CrossRef]
  22. Cho, B.-Y.; Shin, S.-H.; Jung, C.-S.; Ju, M.-H.; Yoon, M.-H.; Ahn, J.-E.; Bae, G.-S. Characteristics of Particle Size Distribution at the Roadside of Daegu. J. Korean Soc. Atmos. Environ. 2019, 35, 16–26. [Google Scholar] [CrossRef]
  23. Hofman, J.; Bartholomeus, H.; Janssen, S.; Calders, K.; Wuyts, K.; Van Wittenberghe, S.; Samson, R. Influence of tree crown characteristics on the local PM10 distribution inside an urban street canyon in Antwerp (Belgium): A model and experimental approach. Urban For. Urban Green. 2016, 20, 265–276. [Google Scholar] [CrossRef]
  24. Province, G.; Qiu, Y.; Guan, D.; Song, W.; Huang, K. Chemosphere Capture of heavy metals and sulfur by foliar dust in urban Huizhou. Chemosphere 2009, 75, 447–452. [Google Scholar] [CrossRef]
  25. Ottosen, T.B.; Kumar, P. The influence of the vegetation cycle on the mitigation of air pollution by a deciduous roadside hedge. Sustain. Cities Soc. 2020, 53, 101919. [Google Scholar] [CrossRef]
  26. Gugamsetty, B.; Wei, H.; Liu, C.N.; Awasthi, A.; Tsai, C.J.; Roam, G.D.; Wu, Y.C.; Chen, C.F. Source Characterization and Apportionment of PM10, PM2.5 and PM0.1 by Using Positive Matrix Factorization. Aerosol Air Qual. Res. 2012, 12, 476–491. [Google Scholar] [CrossRef]
  27. Väkevä, M.; Hämeri, K.; Puhakka, T.; Nilsson, E.D.; Hohti, H.; Mäkelä, J.M. Effects of meteorological processes on aerosol particle size distribution in an urban background area. J. Geophys. Res. Atmos. 2000, 105, 9807–9821. [Google Scholar] [CrossRef] [Green Version]
  28. Hu, M.; Liu, S.; Wu, Z.-J.; Zhang, J.; Zhao, Y.-L.; Wehner, B.; Wiedensolher, A. Effects of high temperature, high relative humidity and rain process on particle size distributions in the summer of Beijing. Huan Jing Ke Xue Huanjing Kexue 2006, 27, 2293–2298. [Google Scholar] [CrossRef]
  29. Li, Y.; Chen, Q.; Zhao, H.; Wang, L.; Tao, R. Variations in pm10, pm2.5 and pm1.0 in an urban area of the sichuan basin and their relation to meteorological factors. Atmosphere (Basel). 2015, 6, 150–163. [Google Scholar] [CrossRef] [Green Version]
  30. Bathmanabhan, S.; Saragur Madanayak, S.N. Analysis and interpretation of particulate matter-PM10, PM2.5 and PM1 emissions from the heterogeneous traffic near an urban roadway. Atmos. Pollut. Res. 2010, 1, 184–194. [Google Scholar] [CrossRef] [Green Version]
  31. Jayamurugan, R.; Kumaravel, B.; Palanivelraja, S.; Chockalingam, M.P. Influence of Temperature, Relative Humidity and Seasonal Variability on Ambient Air Quality in a Coastal Urban Area. Int. J. Atmos. Sci. 2013, 2013, 1–7. [Google Scholar] [CrossRef] [Green Version]
  32. Laakso, L.; Hussein, T.; Aarnio, P.; Komppula, M.; Hiltunen, V.; Viisanen, Y.; Kulmala, M. Diurnal and annual characteristics of particle mass and number concentrations in urban, rural and Arctic environments in Finland. Atmos. Environ. 2003, 37, 2629–2641. [Google Scholar] [CrossRef]
  33. Kim, J.-A.; Jin, H.-A.; Kim, C.-H. Charateristics of Time Variations of PM10 Concentrations in Busan and Interpreting Its Generation Mechanism Using Meteorological Variables. J. Environ. Sci. 2007, 16, 1157–1167. [Google Scholar]
  34. Ko, J.-C.; Ryu, K.-W.; Park, I.G. The Dispersion Characteristics Analysis of PM10 and PM2.5 In Industrial Complex using Atmospheric Dispersion Model. J. Korean Soc. Environ. Technol. 2018, 19, 366–374. [Google Scholar] [CrossRef]
  35. Kim, H.C.; Kim, S.; Kim, B.; Jin, C.; Hong, S.; Park, R.; Son, S.; Bae, C.; Bae, M.; Song, C.; et al. Recent increase of surface particulate matter concentrations in the Seoul Metropolitan Area, Korea. Sci. Rep. 2017, 1–7. [Google Scholar] [CrossRef] [PubMed] [Green Version]
  36. Lin, J.; Liu, W.; Li, Y.; Bao, L.; Li, Y.; Wang, G.; Wu, W. Relationship between meteorological conditions and particle size distribution of atmospheric aerosols. J. Meteorol. Environ. 2009, 25, 1–5. [Google Scholar]
  37. Shin, M.-K.; Lee, C.-D.; Ha, H.-S.; Choe, C.-S.; Kim, Y.-H. The Influence of Meteorological Factors on PM10 Concentration in Incheon. J. Korean Soc. Atmos. Environ. 2007, 23, 322–331. [Google Scholar]
  38. Seinfeld, J.H.; Pandis, S.N. Atmospheric Chemistry and Physics: From Air Pollution to Climate Change, 3rd ed.; John Wiley & Sons: Hoboken, NJ, USA, 2016. [Google Scholar]
  39. Xu, X.; Kim, J.-O. Planting Design Strategies and Green Space Planning to Mitigate Respirable Particulate Matters - Case Studies in Beijing, China -. J. Korean Inst. Landsc. Archit. 2017, 45, 40–49. [Google Scholar]
  40. Suh, M.; Song, Y.-B. A Study on the Influence of Sihwa Industrial Complex and Air Pollution in Sihwa District; Siheung-si Environmental Technology Development Center: Gyeonggi-do, Korea, 2004. [Google Scholar]
  41. Bae, M.S.; Schauer, J.J.; Lee, T.; Jeong, J.H.; Kim, Y.K.; Ro, C.U.; Song, S.K.; Shon, Z.H. Relationship between reactive oxygen species and water-soluble organic compounds: Time-resolved benzene carboxylic acids measurement in the coastal area during the KORUS-AQ campaign. Environ. Pollut. 2017, 231, 1–12. [Google Scholar] [CrossRef]
  42. Bell, M.L.; Kim, J.Y.; Dominici, F. Potential confounding of particulate matter on the short-term association between ozone and mortality in multisite time-series studies. Environ. Health Perspect. 2007, 115, 1591–1595. [Google Scholar] [CrossRef]
Figure 1. The location of measuring points and national atmospheric environmental research station in Siheung City, Gyeonggi-do, Republic of Korea (modified from map.kakao.com). IC: industrial complex; UG: urban green area; RA: residential area; Airkorea-IC: national atmospheric environmental research station located near IC; Airkorea-RA: national atmospheric environmental research station located near RA.
Sustainability 12 07647 g001
Figure 2. (a) Monthly PM concentration (µg/m3) at measuring points. (b) Monthly PM reduction rate (%). Different lowercase letters indicate significant difference between measuring points at a 5% level. Different uppercase letters indicate significant difference between months at a 5% level. IC: industrial complex; UG: urban green area; RA: residential area.
Sustainability 12 07647 g002
Figure 3. (a) Hourly PM10 concentration (µg/m3) at measuring points. (b) Hourly PM2.5 concentration (µg/m3) at measuring points. (c) Hourly PM reduction rate (%). Different lowercase letters indicate significant difference between measuring points at a 5% level. Different uppercase letters indicate significant difference between hours at a 5% level. IC: industrial complex; UG: urban green area; RA: residential area.
Sustainability 12 07647 g003
Table 1. Seasonal correlation coefficients between PM concentration, meteorological factors, and other air pollutants.
Correlation
Coefficient
PM10PM2.5PM10PM2.5PM10PM2.5
Spring
(April, May)
Summer
(June, July)
Fall
(September, October)
Temperature−0.62−0.60−0.86 **−0.89 **−0.58−0.40
Wind speed−0.95 ***−0.94 ***0.540.58−0.82 **−0.69 *
Humidity0.96 ***0.96 ***0.570.570.67 *0.51
O3−0.93 ***−0.91 ***−0.48−0.48−0.80 **−0.66
NO20.90 **0.88 **0.500.490.96 ***0.88 **
CO0.86 **0.84 **0.670.68 *0.93 ***0.87 **
SO20.400.360.91 ***0.93 ***0.380.50
Note: * p < 0.05, ** p < 0.01, *** p < 0.001.

