Article

Sustainability of Transport System of Large Russian City in the Period of COVID-19: Methods and Results of Assessment

by
Artur I. Petrov
1,* and
Daria A. Petrova
2
1
Department of Road Transport Operation, Industrial University of Tyumen, Volodarskogo str., 38, 62500 Tyumen, Russia
2
The Institute of Natural Sciences and Mathematics, Ural Federal University named after the first President of Russia B.N. Yeltsin, Mira str., 19, 620002 Ekaterinburg, Russia
*
Author to whom correspondence should be addressed.
Sustainability 2020, 12(18), 7644; https://doi.org/10.3390/su12187644
Submission received: 23 July 2020 / Revised: 3 September 2020 / Accepted: 14 September 2020 / Published: 16 September 2020
(This article belongs to the Collection Sustainable Transport Economics, Behaviour and Policy)

Abstract

:
In spring 2020 the whole world went through the “black swan”—COVID-19 pandemic. The healthcare systems of all countries and the world economy, in general, became very stressed. The extraordinary decline of activity in all spheres, except healthcare, led to a drop in the demand for transport services, including city public transport. It was important for city management to support the sustainability of the local transport system. The article presents fundamental approaches to assessing the sustainability of a transport service, particularly city passenger public transport (CPPT), for the example of the large Russian city Tyumen (size of population—nearly 807 thousand people). Methods of analysis of the sustainability of the transport process in conditions of negative environmental impact (COVID-19 pandemic) are considered. During the period from 30.03.2020 to 31.05.2020 (nine weeks—the acute phase of COVID-19 pandemic) structural sustainability of the CPPT system in Tyumen kept a high level. By changing the parameters of the planned characteristics of the CPPT system state, an attempt to adapt the transport service supply to a sharp decrease in transport demand was made. In the period of “self-isolation”, the demand for the CPPT transport service reduced more than the transport service supply. Sustainability of CPPT functioning was evaluated by calculating the elasticity of the transport supply (number of trips) in relation to the actual demand (actual volume of transportations). Calculation of the elasticity index of the CPPT system of Tyumen during nine weeks of April–May 2020 (duration of “self-isolation“) is provided. A conclusion was made from the results of the research. In particular, it was found that the foreground target function of city management was the maintenance of a high level of transportation processes to the detriment of the transportations’ effectiveness. Such a policy led to contradictory results—the additional financial expenses at the rate of 135–150 million rubles and quite a high level of contentment of the Tyumen population with the quality of the CPPT work (sociological research established that 80–85% of respondents were satisfied with the quality of the transport service in April–May 2020).

1. Introduction

The COVID-19 pandemic was a big surprise for the whole world. The danger of this infection was not recognized immediately. Only at the end of February did the majority of the European countries institute a quarantine policy. Russia introduced a quarantine later. On the 30th of March, 2020 the regime of “self-isolation” was instituted in all large cities of Russia. This regime is equivalent to the quarantine in other countries. This event dramatically changed the lifestyle of city citizens. Quality of life drastically changed, people’s mobility, especially transport mobility, decreased. Transport mobility of the population consists of individual vehicle transport and city passenger public transport (CPPT). In Russia, the share of trips on public transport reaches 50–60% of all transport trips [1,2]. Such a situation is explained by a set of specific-for-Russia reasons. The main reasons are weakly developed street-road networks that do not match the demands of actual automobilization [1] and quite a high level of property inequality in the Russian population [2]. This fact and the institution of the “self-isolation” regime led to changes in the CPPT system functioning. Authors, specialists in CPPT [3,4,5,6,7], claim that the main characteristics of passenger transportation are a high degree of uncertainty of demand on transport service and not always qualitative and precise demand meeting by transport supply. V.R. Vuchic [3,4,5] thinks that transport problems are the main reason behind the modern crisis of urbanization. He also specifies that these problems are determined by a lag of reaction by the city administration to the transformation of transportation demand and actual imbalance between transport demand and supply. P. Miller [6] and O.J. Ibarra-Rojas et al. [7] have the same opinion. The demand for CPPT depends on dozens of dynamically changing environmental factors [8,9,10,11,12]. In some cases, the level of CPPT development significantly depends on the land-use policy of city authorities [8]. Sometimes environmental consciousness has a huge impact on the priority of CPPT usage over individual transport [9,10]. However, mostly the choice between CPPT and individual transport is determined by a wide set of socioeconomic factors and the selfish aspiration for increasing personal comfort [11,12] that leads to the neglect of public transport.
The search for instruments to increase the accuracy of forecasts of the demand for transportation and the improvement of the balance between the demand and supply of a transport service are the main tasks of the transport service organization and management [13,14,15]. M. Abouhassan specifies in [13] that it is extremely difficult to provide a balance between the demand of a large city population and the supply of transport services. The achievement of this balance can take years of searching. A.A. Ganin et al. [14] explain this fact by the stochasticity of the processes of development of city territory and transport routes. It causes a negative impact on the spatial heterogeneity of transport service quality. K. Lucas [15] thinks that CPPT is an instrument of social politics and encourages the improvement of the transport service system because it is one of the most important directions for the growth of the population’s quality of life.
Consequently, any deviation of the CPPT system functioning from the long-standing functioning regime leads to decreasing effectiveness and quality and the occurrence of risks of deformation and even full destruction. In spring 2020, these risks occurred due to the spread of the COVID-19 pandemic and its negative impact on the population. All over the world, including Russia, quarantine events were instituted. Accordingly, population transport activeness decreased and the CPPT system faced a crisis.
Consequently, in February–July 2020, managers of the city transport service faced the challenge of searching for a new balance between the decreased demand for the CPPT service and the need to maintain transport service quality.
This article presents methods and results of an assessment of the CPPT service sustainability in the period of the COVID-19 pandemic in the large Russian city, Tyumen (size of population—nearly 807 thousand people).

2. Materials and Methods

2.1. Historical Digression-Dynamics of COVID-19 Development

COVID-19 came into the human population on 17.12.2019 according to an article by Chinese biologists/evolutionists that was published in the online-library bioRxiv.
The first disease case was registered on 31.12.2019 in Wuhan (China). The last sample of a 2019-nCoV evolution was gathered on 18–19.01.2020. From this point, the coronavirus pneumonia, COVID-19 started to grow as an epidemic. A month and a half later, it achieved the status of a pandemic. The first 25 victims of the coronavirus were registered by 23.01.2020. From 8.03.2020, the disease growth process quickened and became global.
On 11.03.2020, the general director of the World Health Organization (WHO), T. Ghebreyesus, announced the beginning of the COVID-19 pandemic. By this moment, people with COVID-19 were identified in 114 countries. A week later, on 18.03.2020 the coronavirus was found in 167 countries. The high scale of this disease was the main reason for announcing it as a pandemic.
In March 2020, the majority of political leaders incited their citizens to take the fact of coronavirus spread seriously and minimize contact with the external world.
For example, on 18.03.2020, the Chancellor of Germany, Angela Merkel, made an official appeal about the danger of the epidemic. One of the main theses of her appeal was the fact that according to experts, 60–70% of the European population can get the coronavirus in case of the absence of vaccination and qualitative treatment.
Despite the accepted precautionary measures, spread activeness continues growing. By the beginning of July 2020, people with COVID-2019 were identified in 209 countries.
As of 8.07.2020, according to Johns Hopkins University (JHU), 12 million people were infected with coronavirus, including 544,163 already dead. Estimations of the world COVID-19 development dynamics conclude that this process is still in the stage of development.
These facts make it clear that COVID-19 is quite a dangerous disease and it will not end in the near future. All life support systems, including the transport service system, should be restructured [16,17,18]. At first, researches [16] showed the uniqueness of the COVID-19 virus and the abnormality of the disease course, difficult treatment, and high mortality, especially for senior citizens. Results of simulation modeling, held by Australian specialists W. McKibbin et al. [17], predicted terrifying possibilities of infection spread. Analysis of the time series of COVID-19 mortality [18] indicated an exponential model of disease development. In March 2020, it was clear that a quarantine regime is required in the whole world. This regime was supposed to solve the problem of the exponential growth of COVID-19 morbidity. The main question was about the required period of quarantine events.
At the same time, society is incapable of living in emergency conditions for a longtime [19]. According to [20], public consciousness can adapt to a dramatic change in environment for a limited period, nearly 30–90 days. After that period, public life will gradually return to the usual sustainable state [21,22,23]. O’Neill et al. [22] and J. Randers et al. [23] give convincing examples that human society resists changes in the usual lifestyle and strives to return to homeostasis. Conclusions made in [21,22,23] can be extended to the specific situation of the restriction of public activity in spring 2020.

2.2. Purpose, Problems, and Methods of Research

The purpose of the survey is to research the sustainability of the transport service system of the large Russian city, Tyumen, in the conditions of the sharp unexpected impact of a negative environmental factor (“black swan” in the interpretation of N. Taleb [24,25]). The negative impact is expressed as the high decline in citizens’ transport mobility because of the “self-isolation” regime applied by regional and municipal authorities.
Problems that were solved during the research are presented below:
  • The identification of a “sustainability” concept regarding the CPPT system and its functioning in the environment. Choosing the elasticity index as a sustainability characteristic.
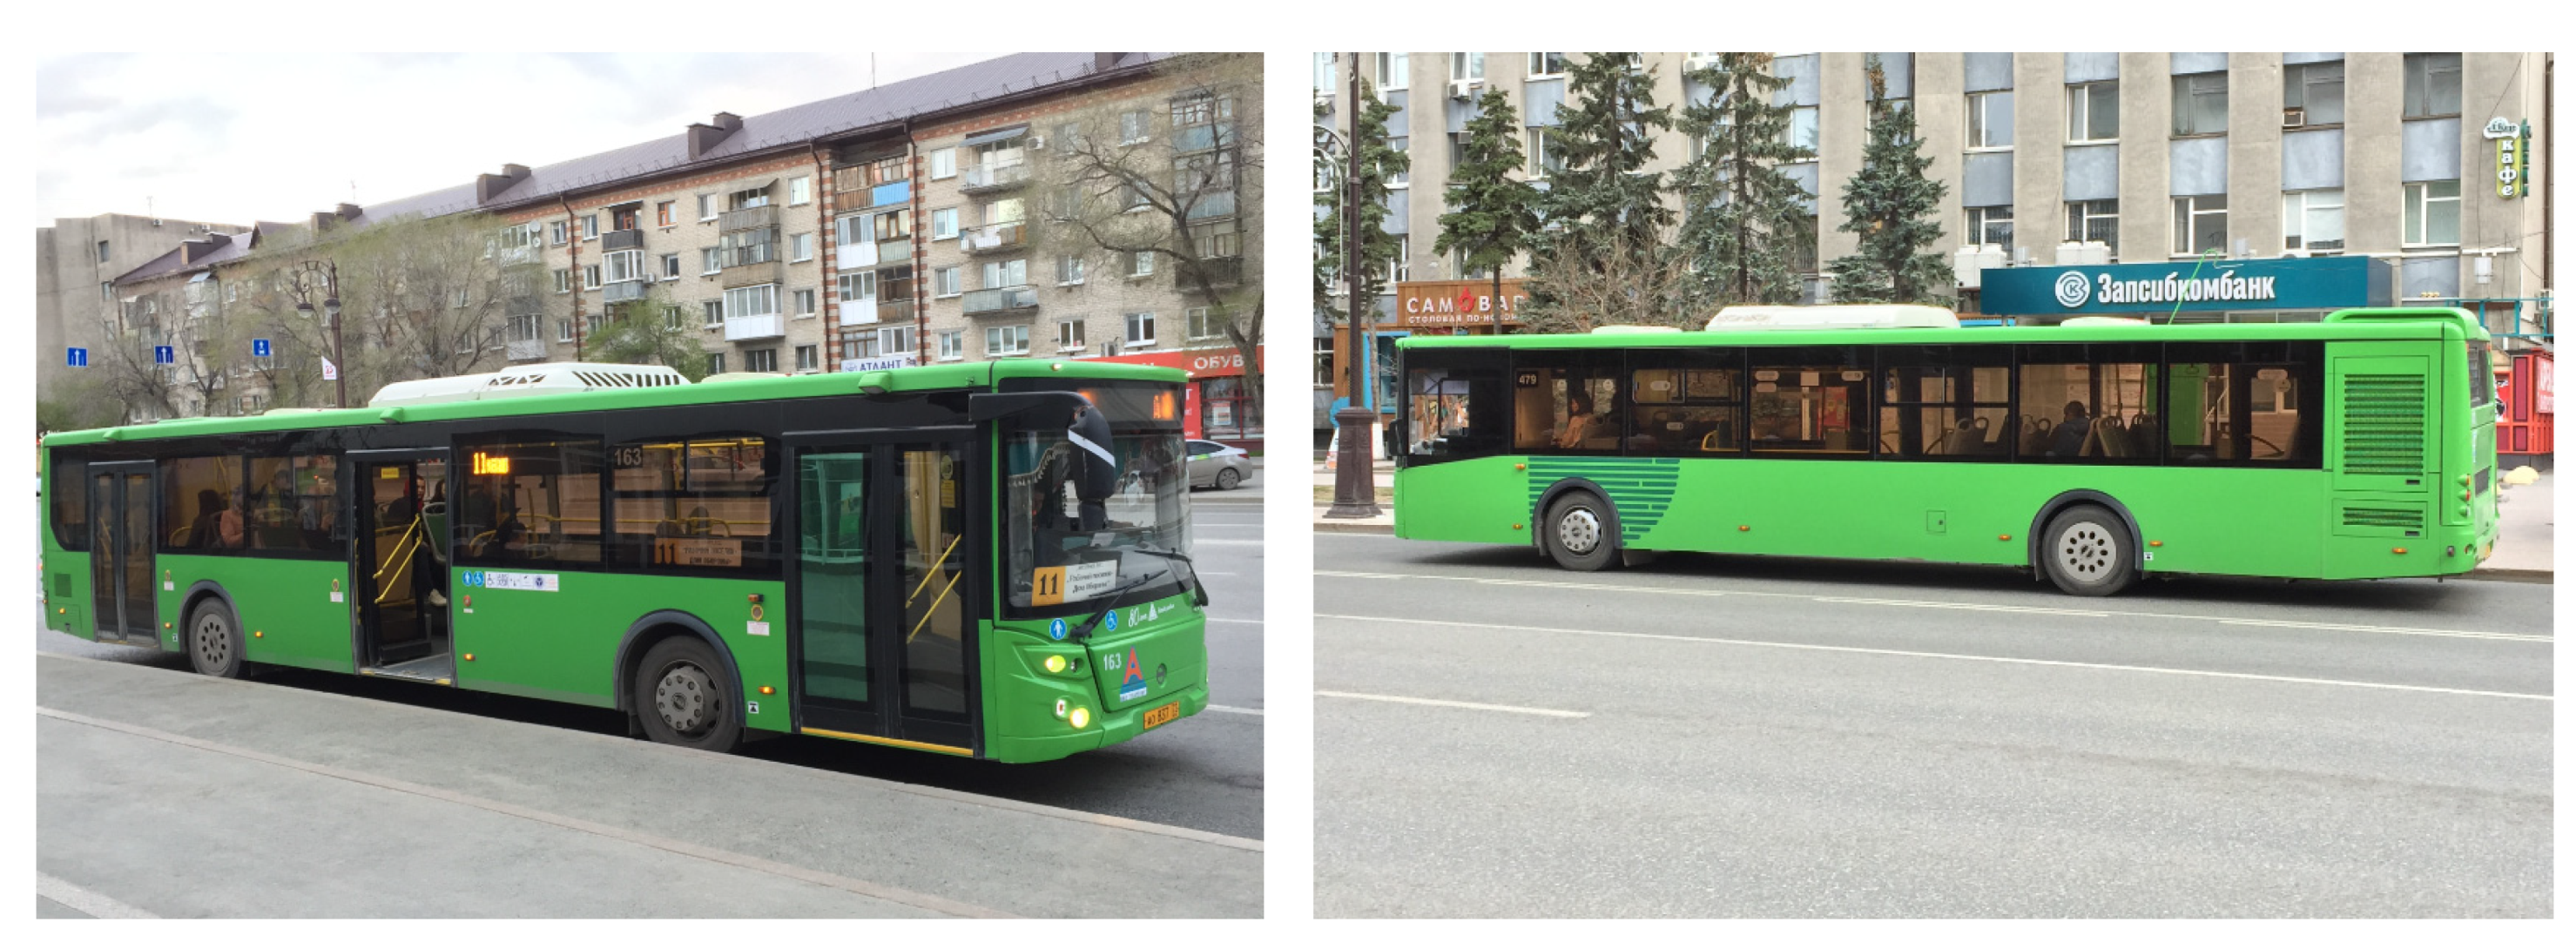
  • Mining and analyzing statistics on the changes of the parameters of CPPT system functioning in a large Russian city (on the example of Tyumen, with a population size equal to 807 thousand people) in emergency conditions (acute stage of COVID-19 pandemic).
  • The development of an evaluation method and the calculation of the CPPT system sustainability indicator.
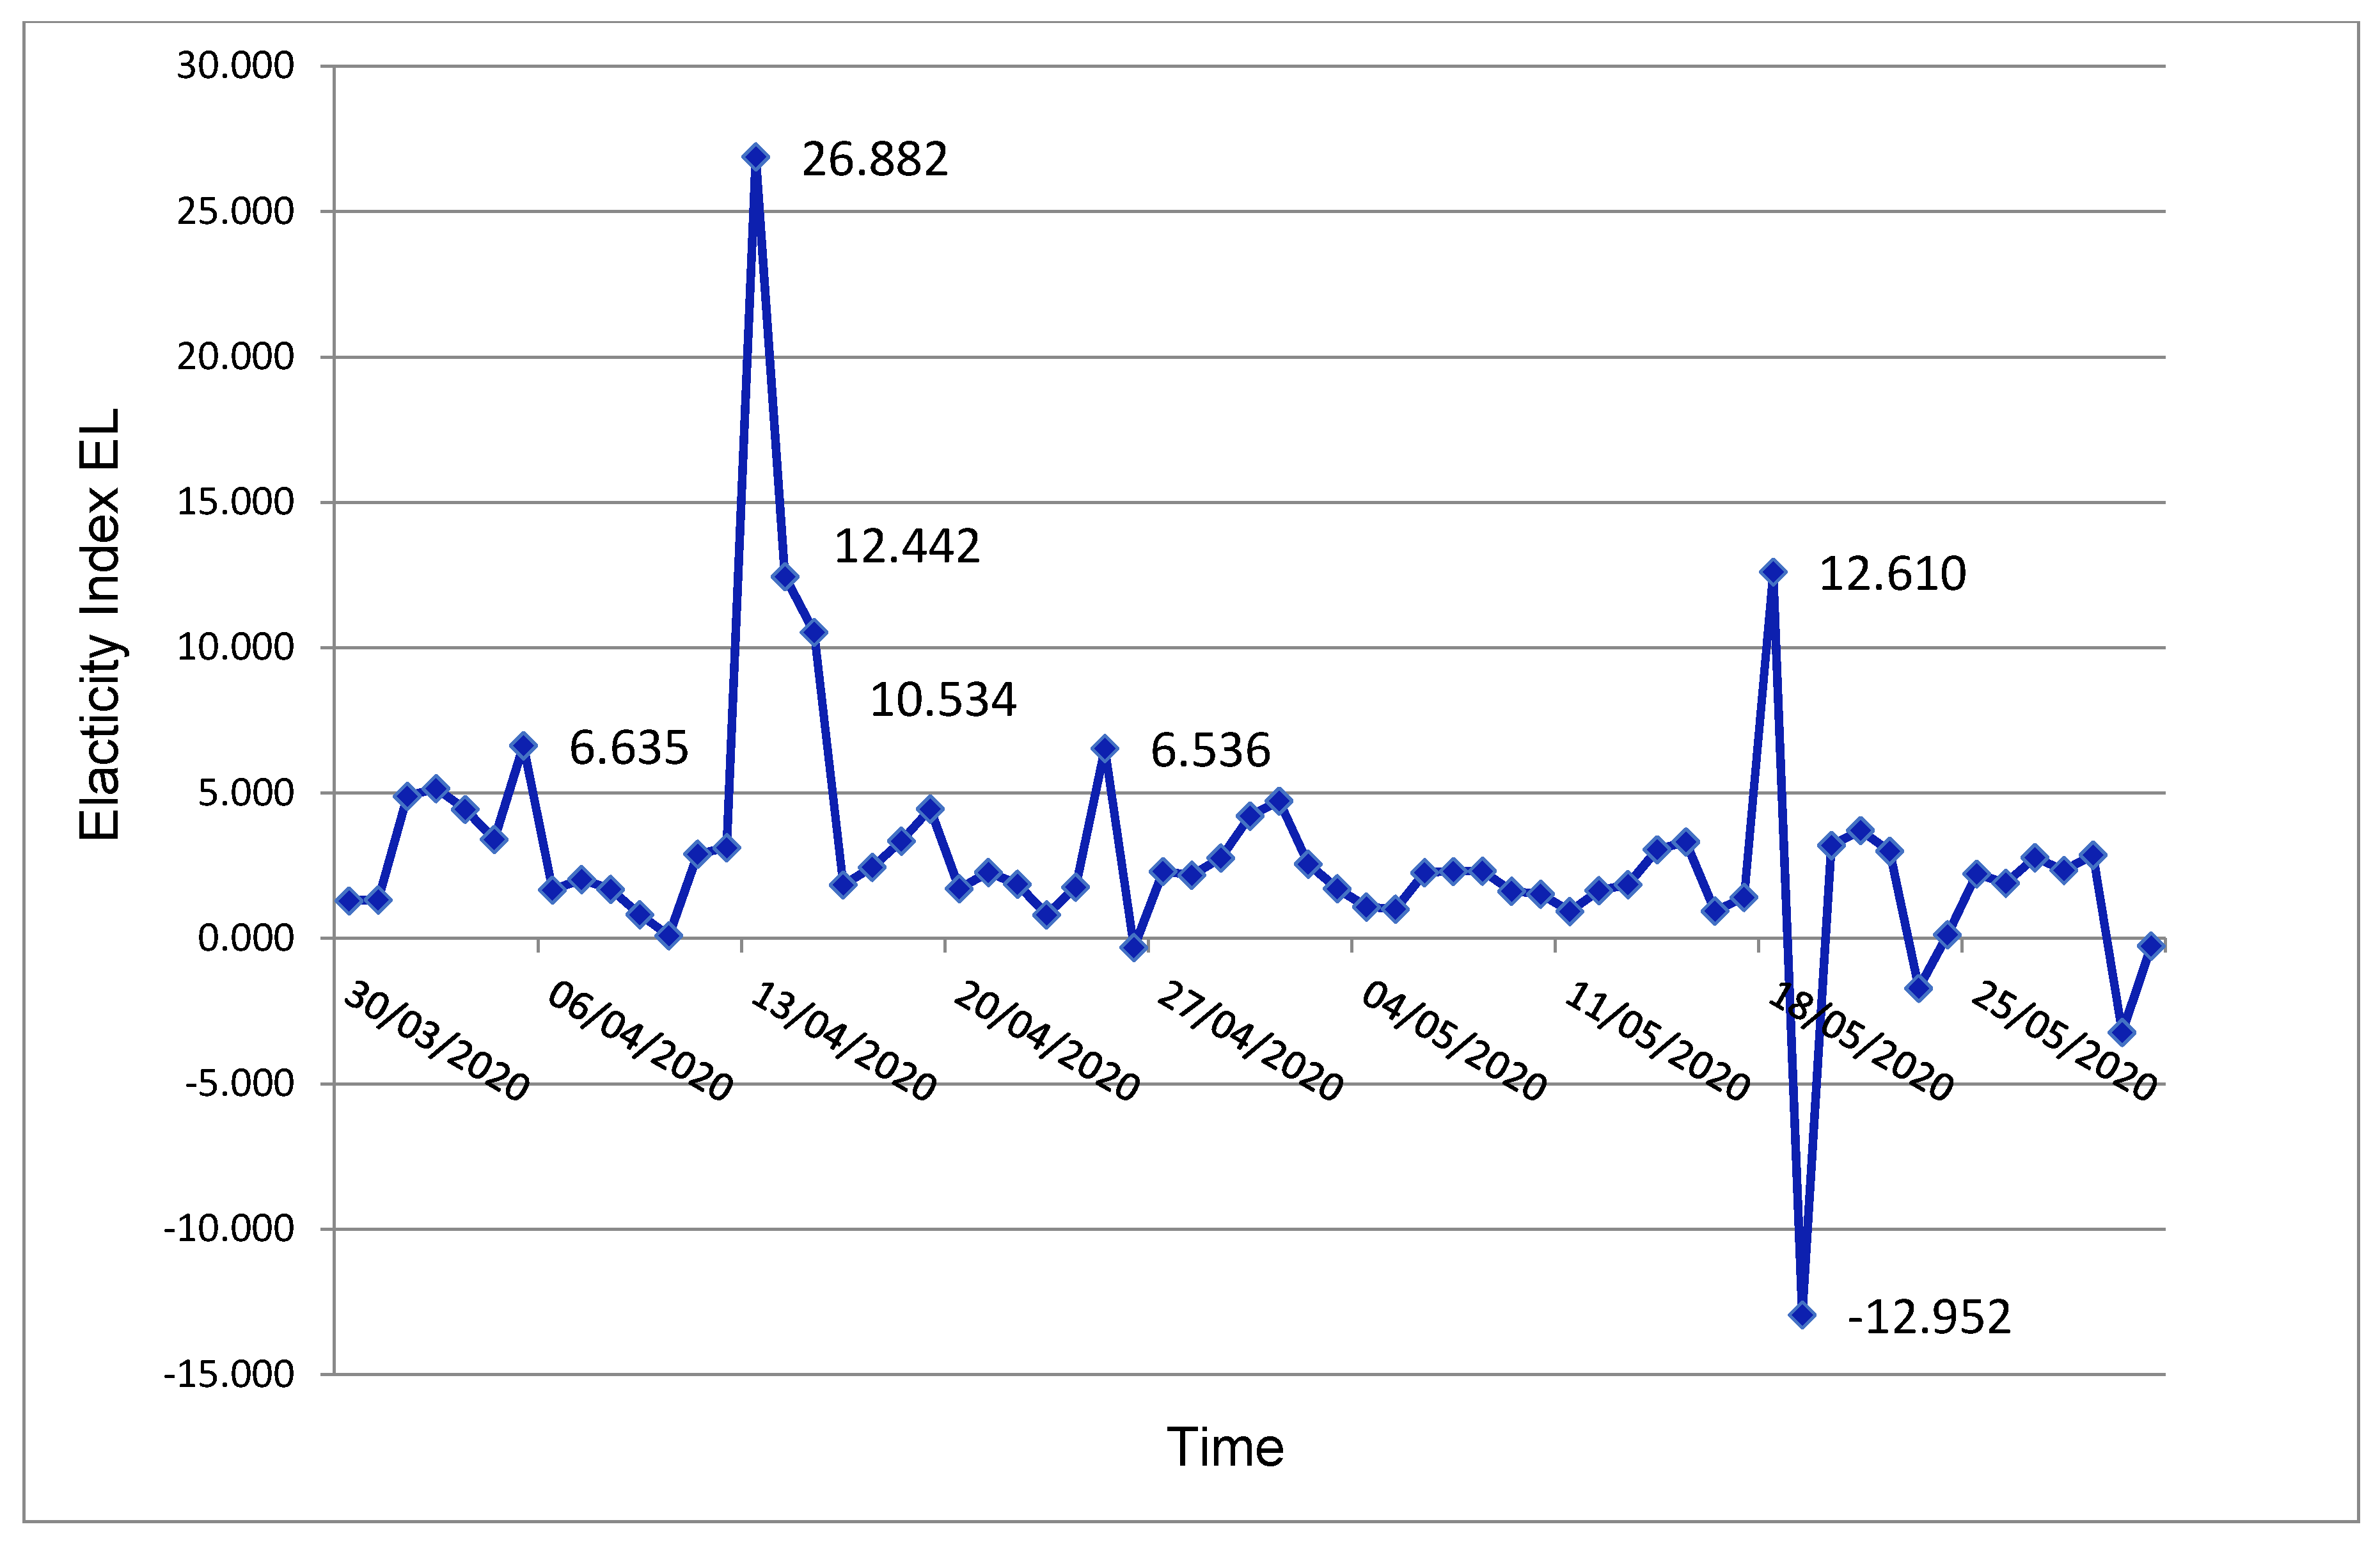
  • Modeling a time series of changes in the elasticity index EL of the Tyumen CPPT system during the acute phase of the COVID-19 pandemic (30.03.2020–31.05.2020).
  • The development of a CPPT system sustainability classification in a period of significant negative environmental impact.
  • The final assessment of the Tyumen CPPT system management quality in the period of the acute phase of the COVID-19 pandemic.
Methods of research correspond to the provided tasks and use approaches developed by V.D. Gerami [26] and implemented on the practice of organizing passenger transportation in Tyumen.

2.3. Identification of a “Sustainability” Concept Regardingthe CPPT System and Elasticity as a Sustainability Characteristic

The notion of “sustainability”, especially in regard to socio-technical systems, does not have a common explanation, and it can be interpreted differently in literature. However, all interpretations have a common part in the definitions, which is that sustainability is a system characteristic that saves the current state under the influence of external effects. Within this definition, balance and homeostasis are particular characteristics of a sustainable system. Viability is one more example of a sustainability manifestation for an autonomous system.
In literature [27,28,29,30], the “sustainability” concept is relative and can be used for different economic objects and categories: market sustainability, economic sustainability, the economics of sustainability, sustainability of economic growth, industrial–technological sustainability, financial sustainability, ecological sustainability, and others. The works of A. Werbach [27] and C. Kazem et al. [28] have examples of business process sustainability; M. Christopher [29] and H. Aronsson et al. [30] consider sustainability the most important fundamental characteristic of transport–logistic systems.
According to [31], sustainability should be classified into structural sustainability and functional-parametric sustainability. Structural sustainability is a system’s capacity for self-preservation, self-reproduction, and saving its own integrity in negative environmental conditions.
Functional-parametric sustainability is a system’s ability to adapt to disturbing impacts.
CPPT systems have high structural sustainability. During the acute phase of COVID-19, the structure of the CPPT system in Tyumen was saved. As for the functional-parametric aspect, an attempt to adapt the supply of the transport service to the sharp decline in the transport demand from the city population by changing parameters of the CPPT system state characteristics was made.
The identification of system sustainability is possible by the evaluation of its elasticity. Elasticity is the ability of a social-technological system to neutralize external perturbations, experiencing at the same time “deformations” (losses) in achieving targets but not to the full extent. Instruments of system elasticity are managerial flexibility and maneuverability of the manager’s organizational decisions.
The concept of elasticity was brought to economic analyses by A. Marshall [32]. Elasticity is the measurement of the percentage change in one economic variable in response to a change in another. Value Y depends on X, this dependence can be described as the function, Y = f(X). If we label the index of elasticity of variable Y, the change in response to a change in variable X, as E L x y and use the definition of derivatives, then (1):
E L x y = lim Δ X 0 Δ Y Δ X X Y ,
and (2):
E L x y = f ( x ) X Y .

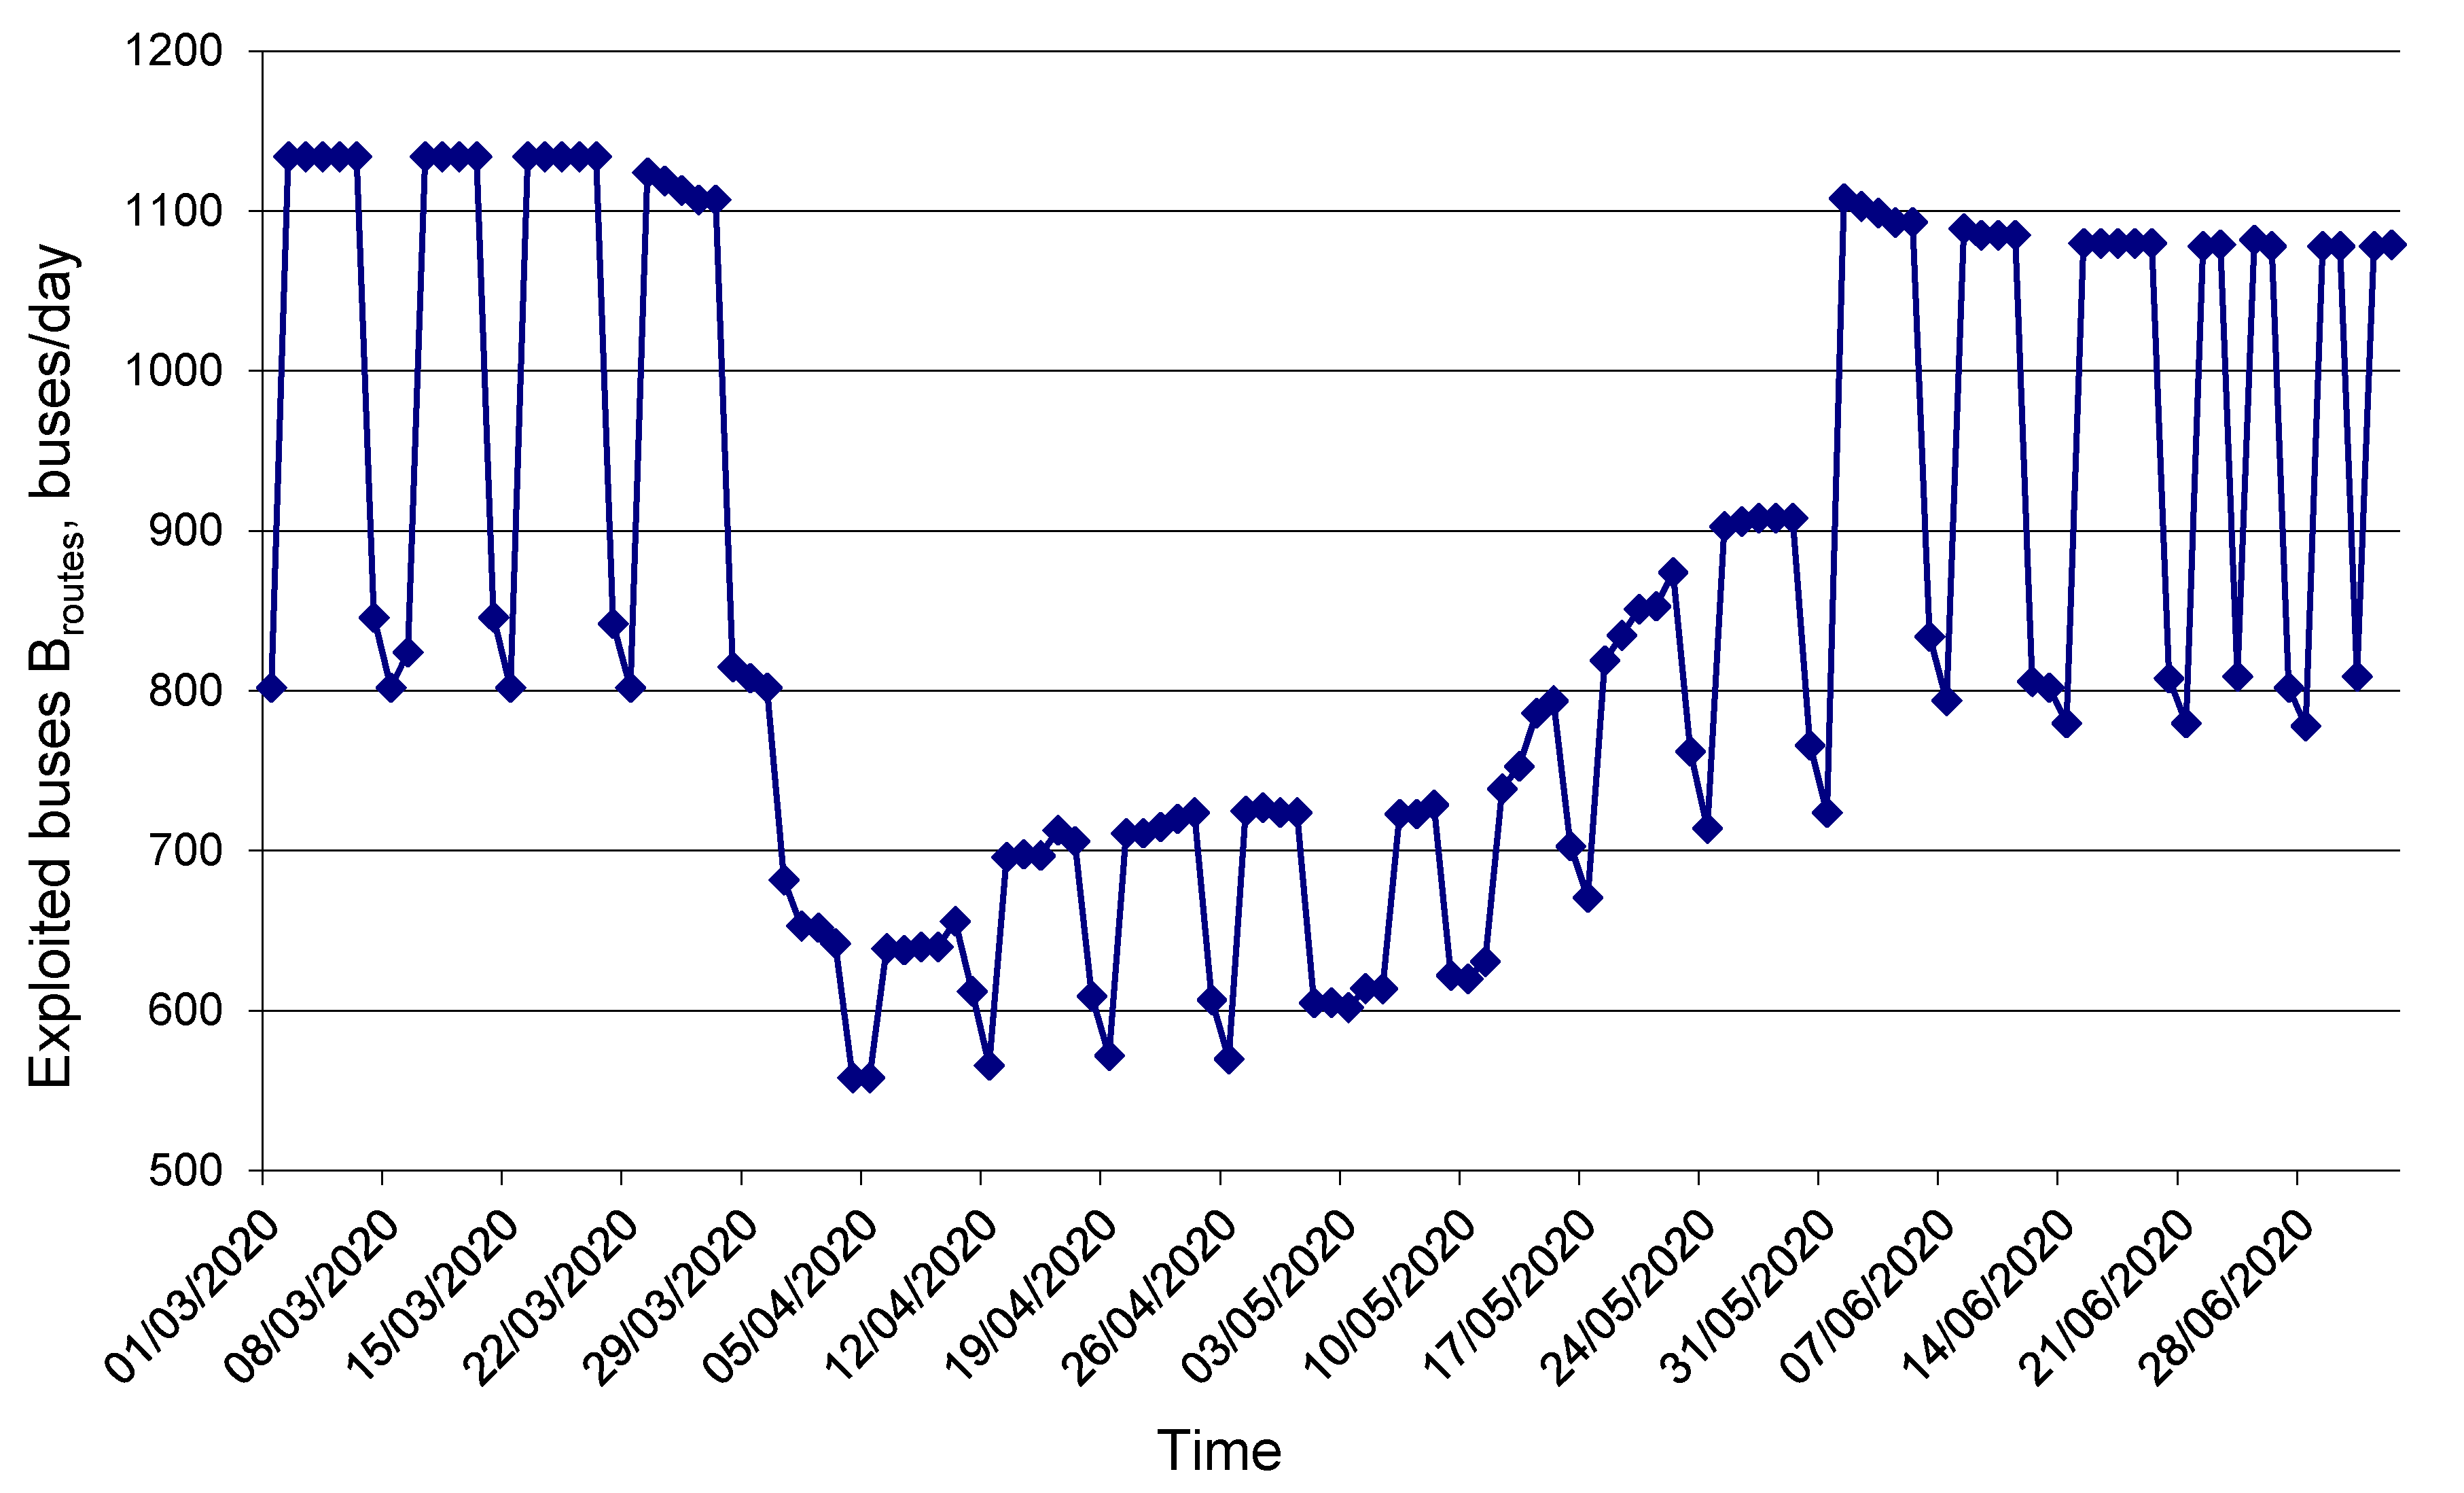
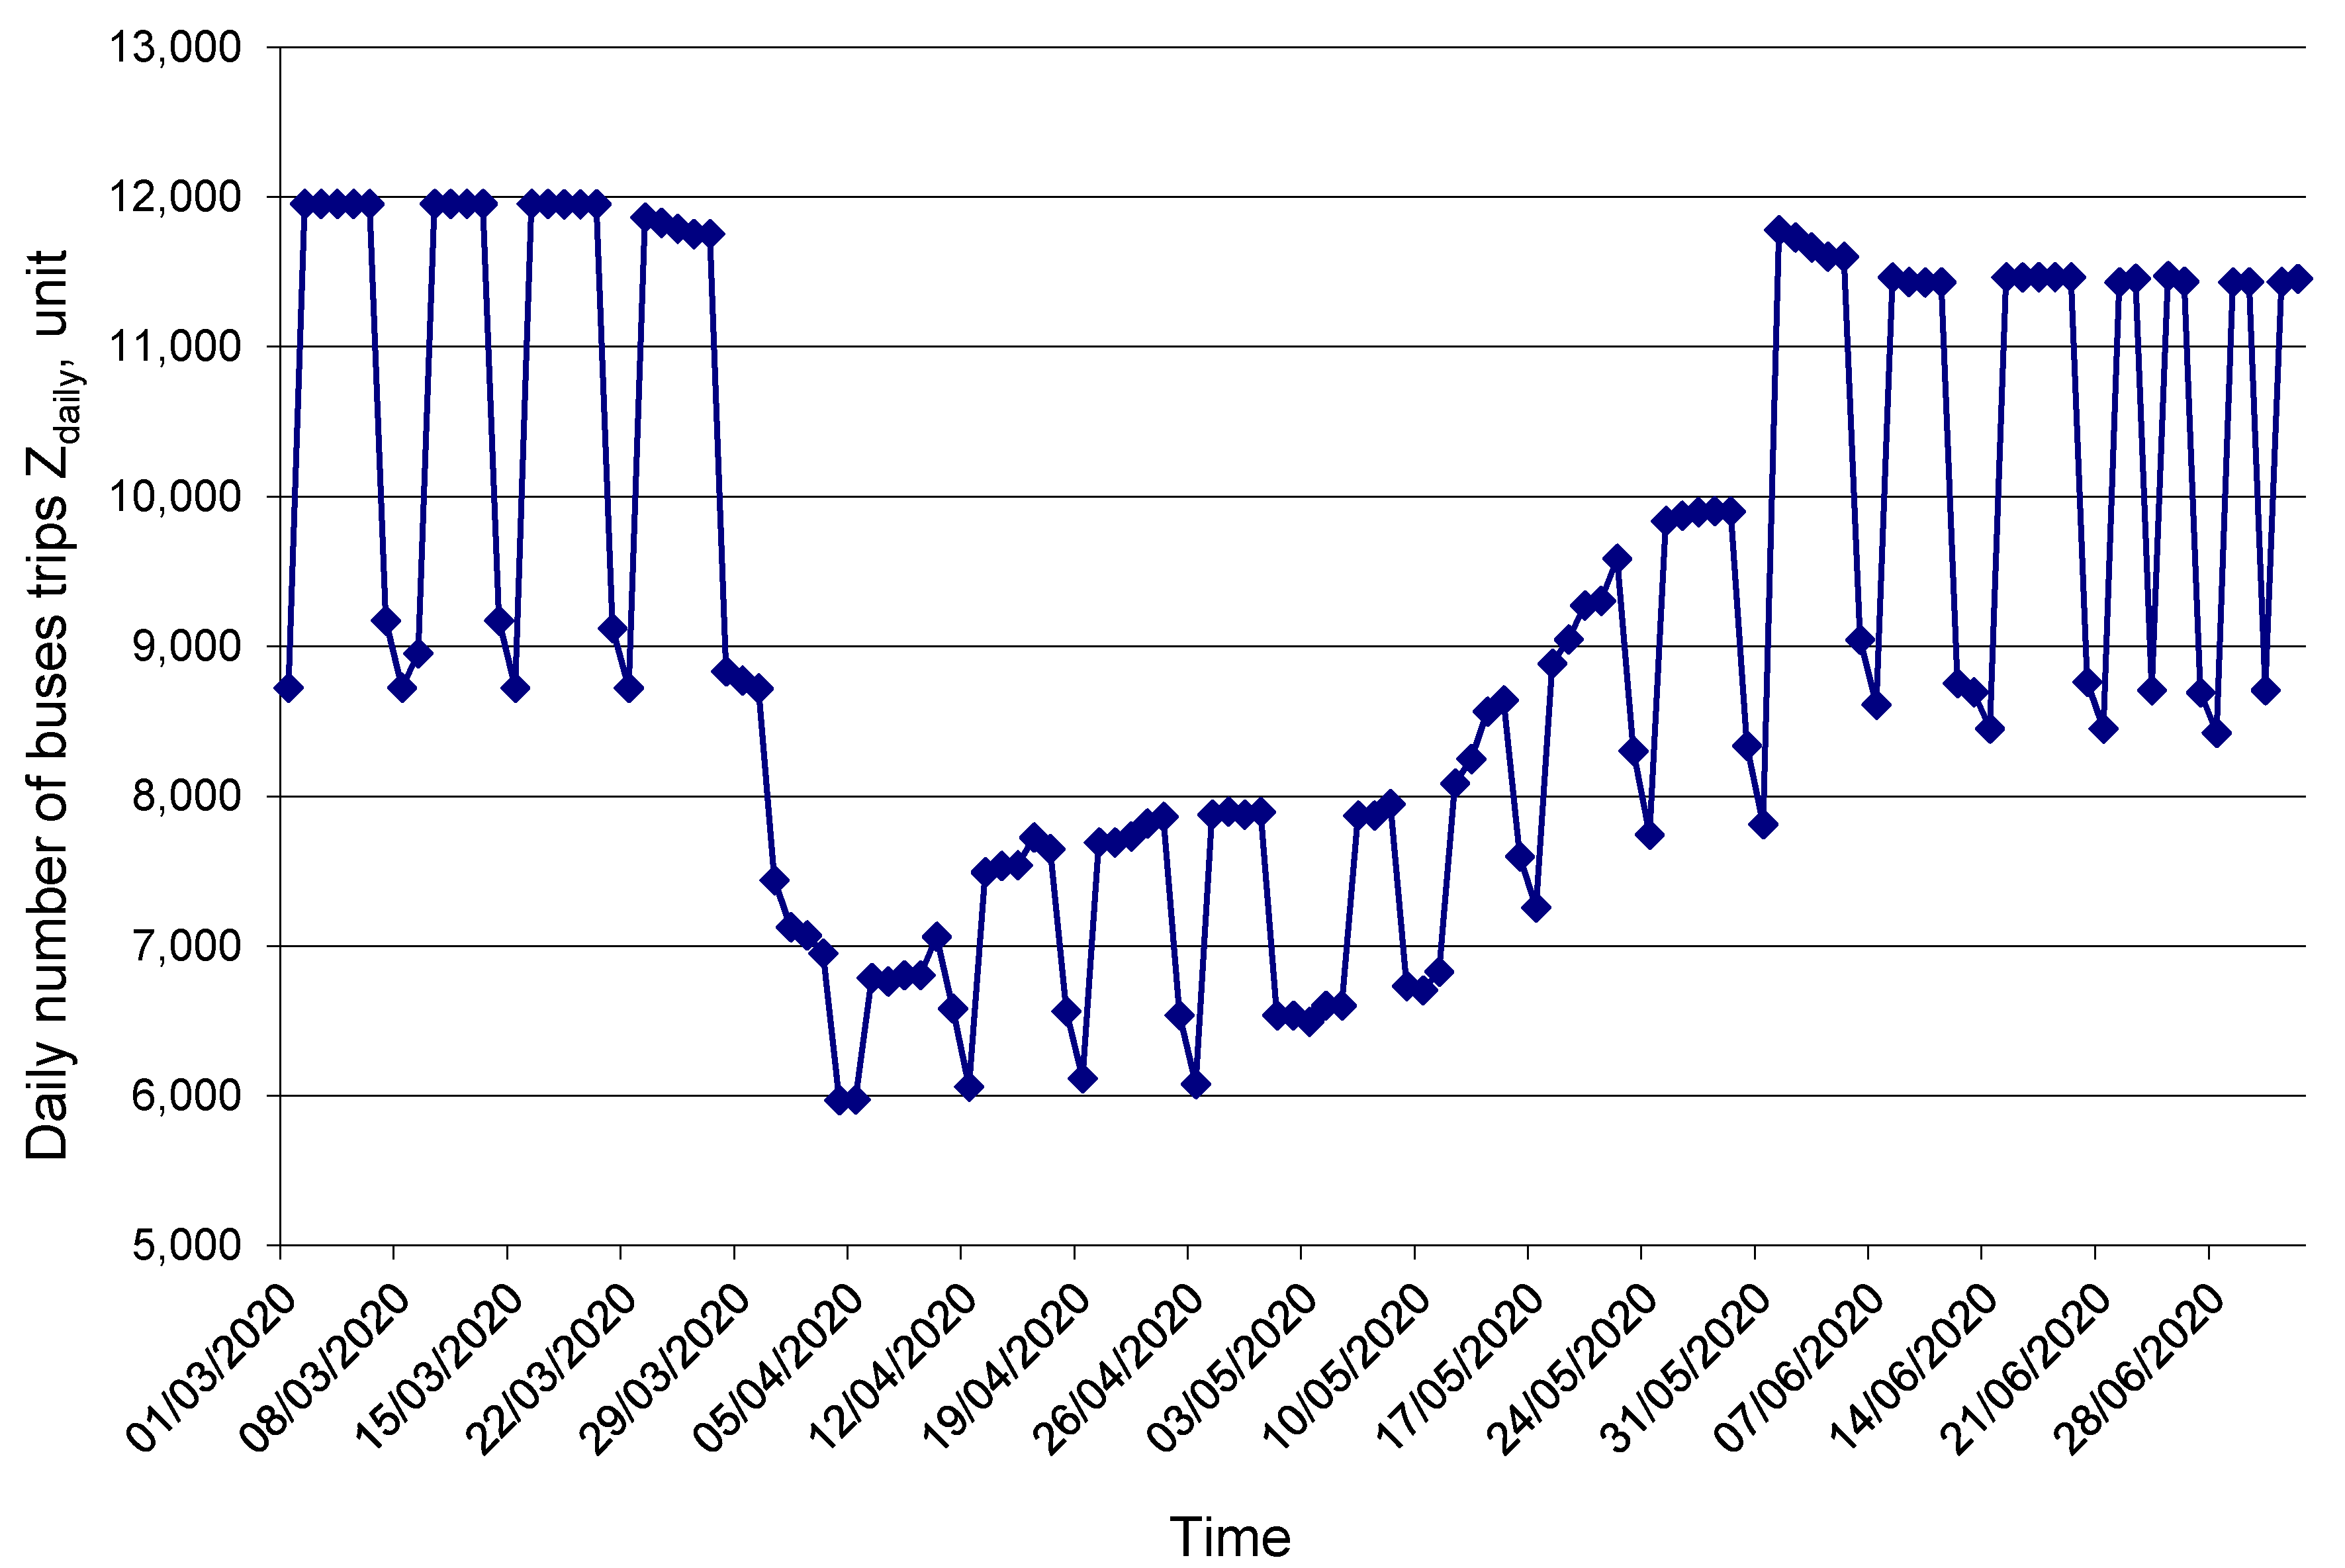
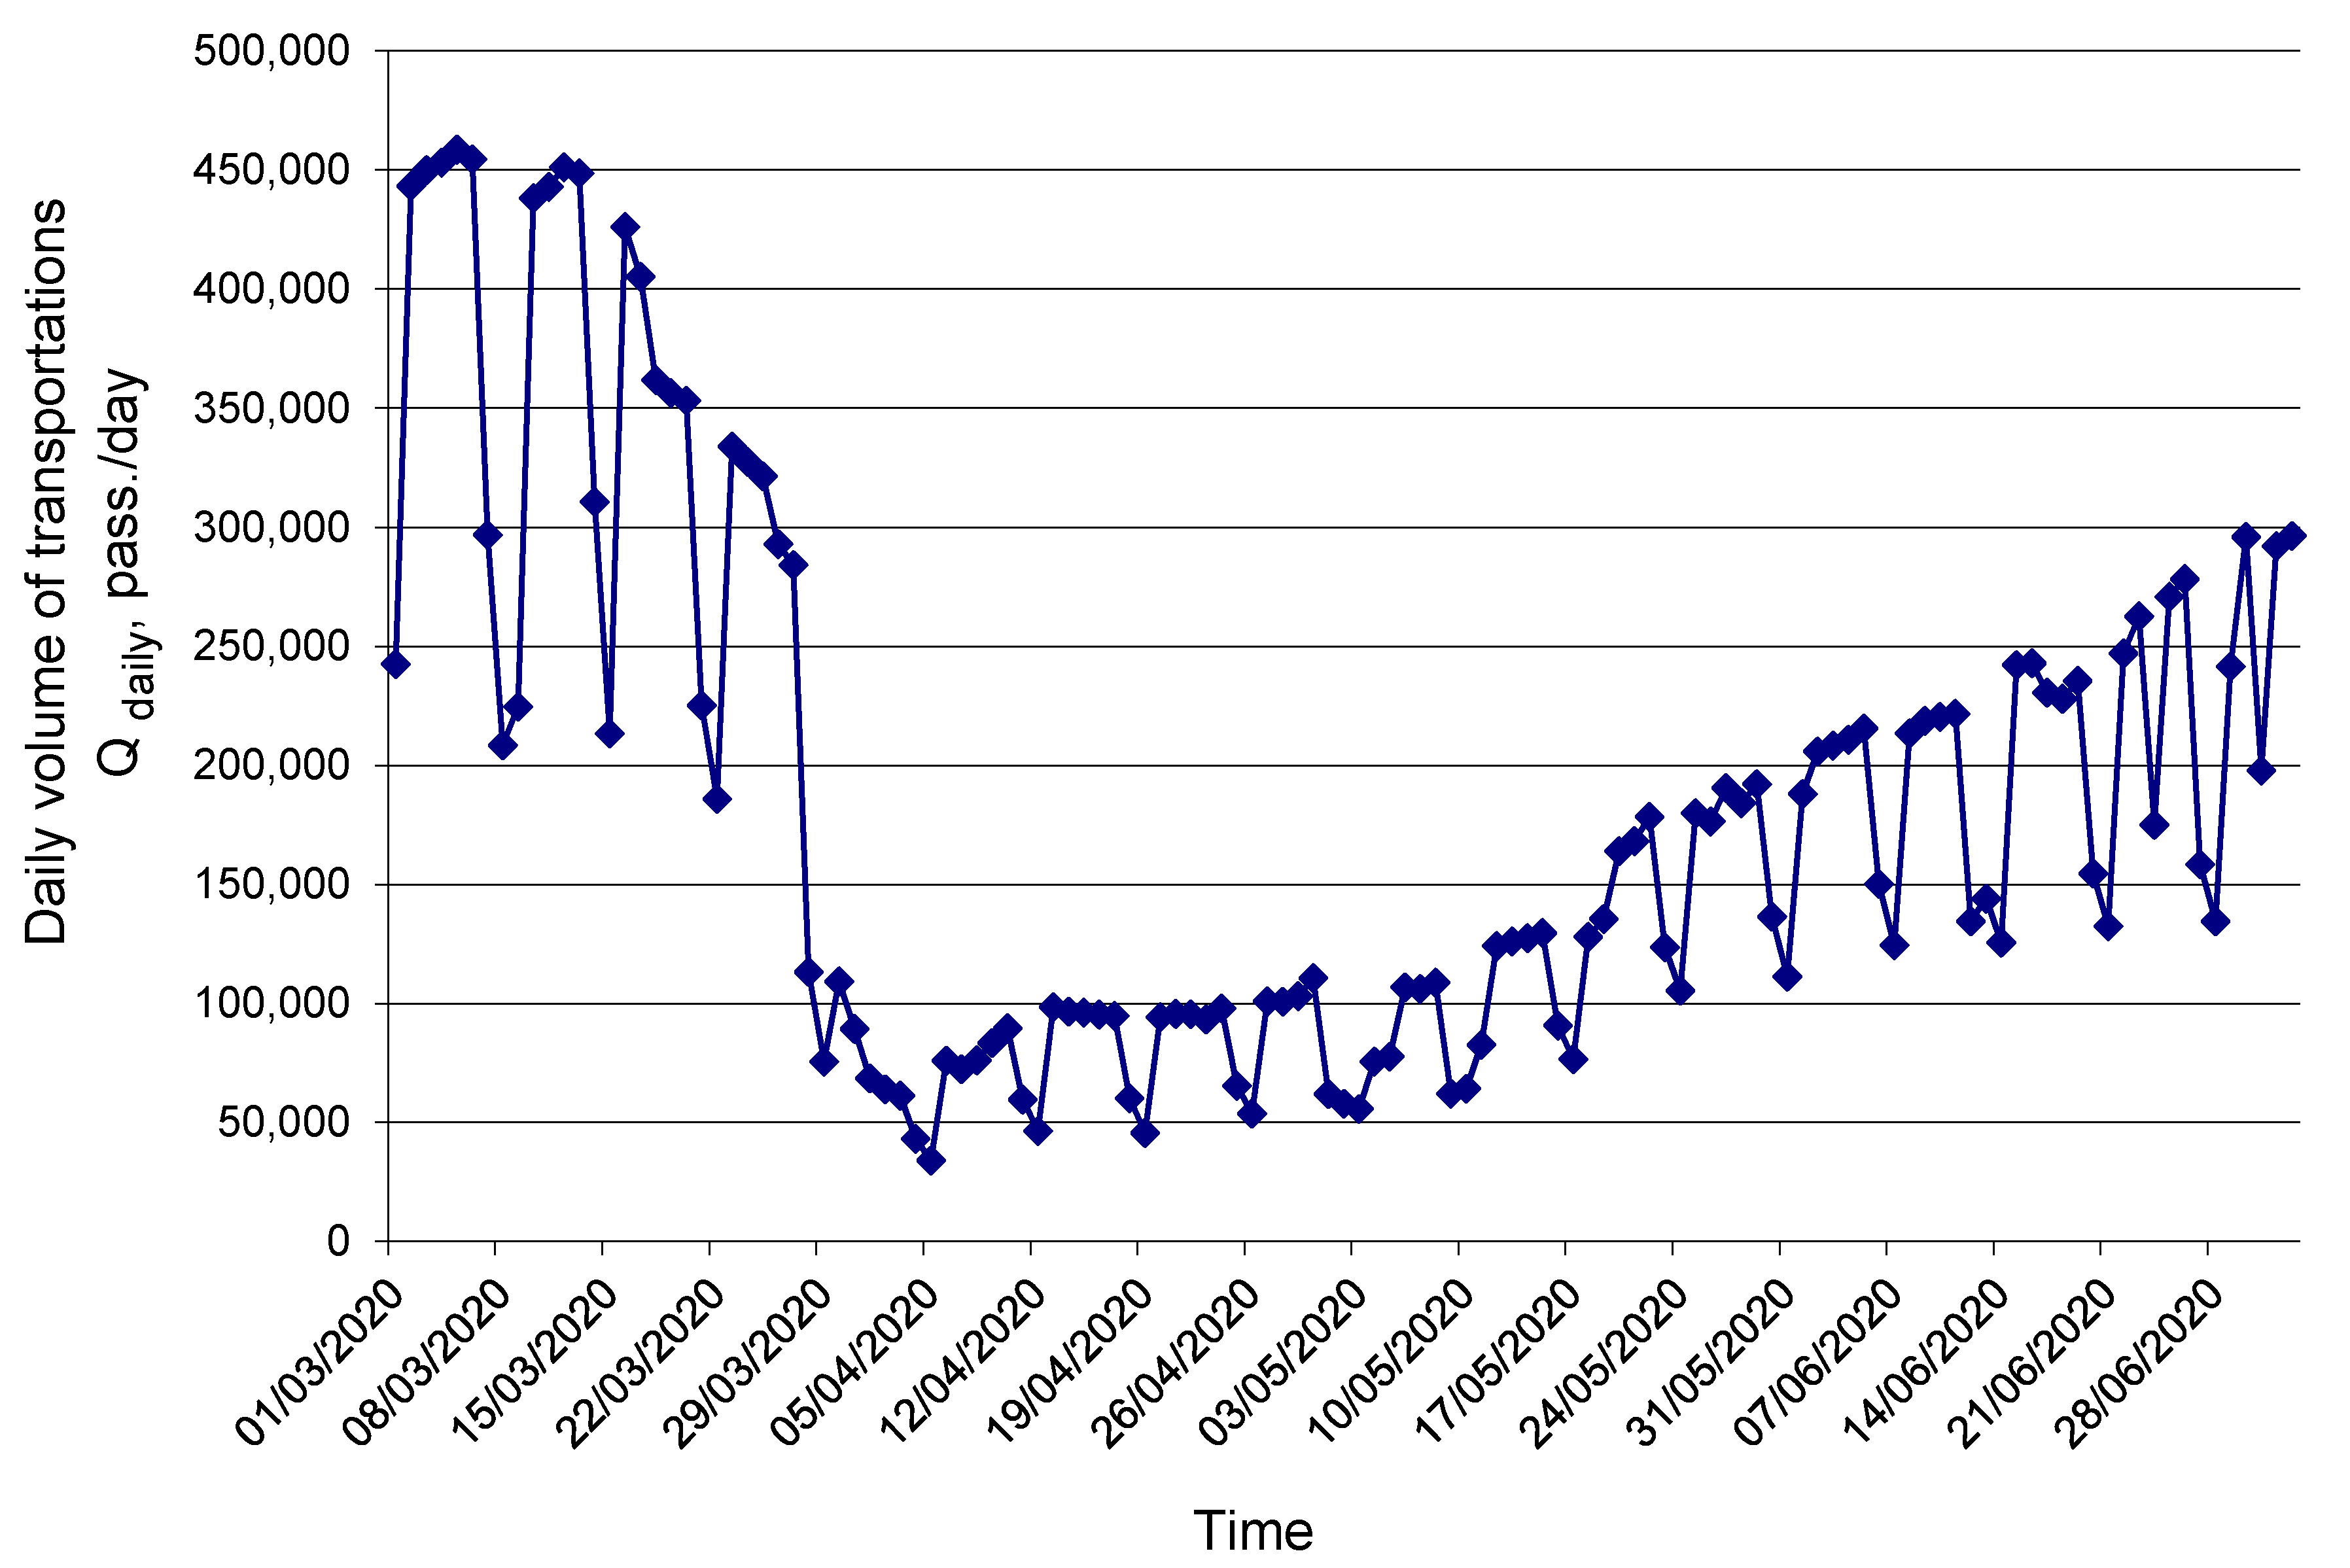
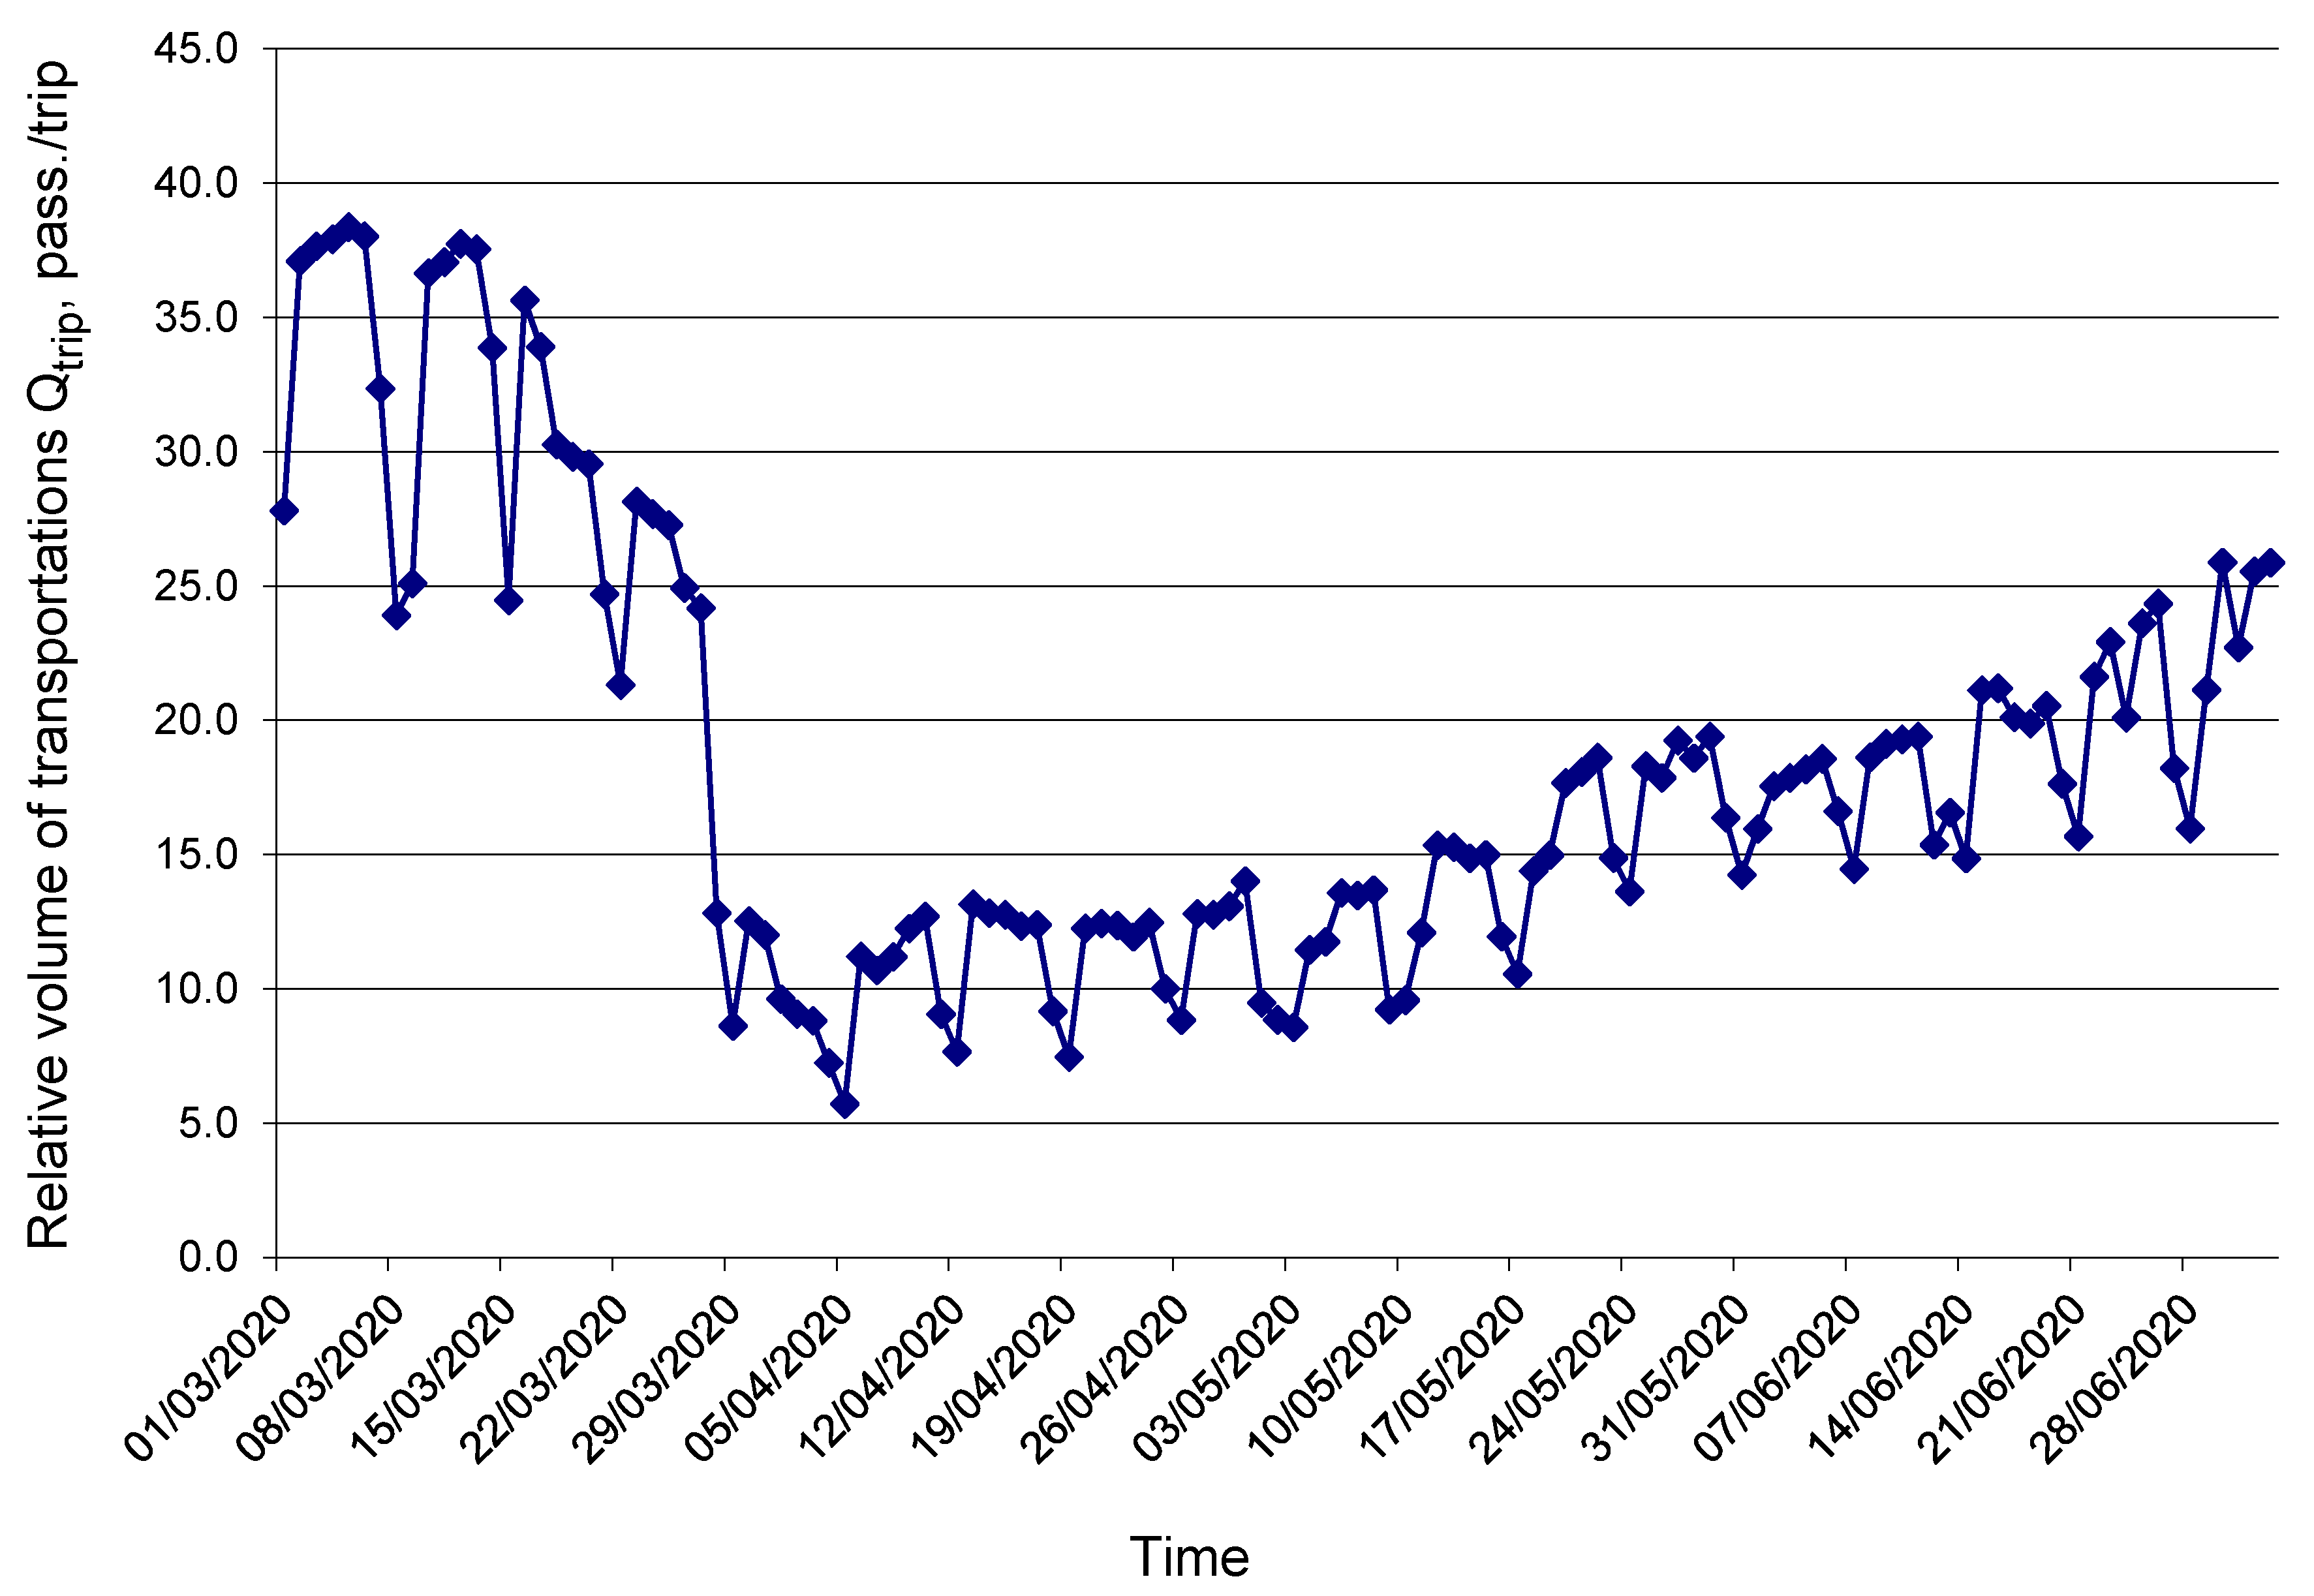
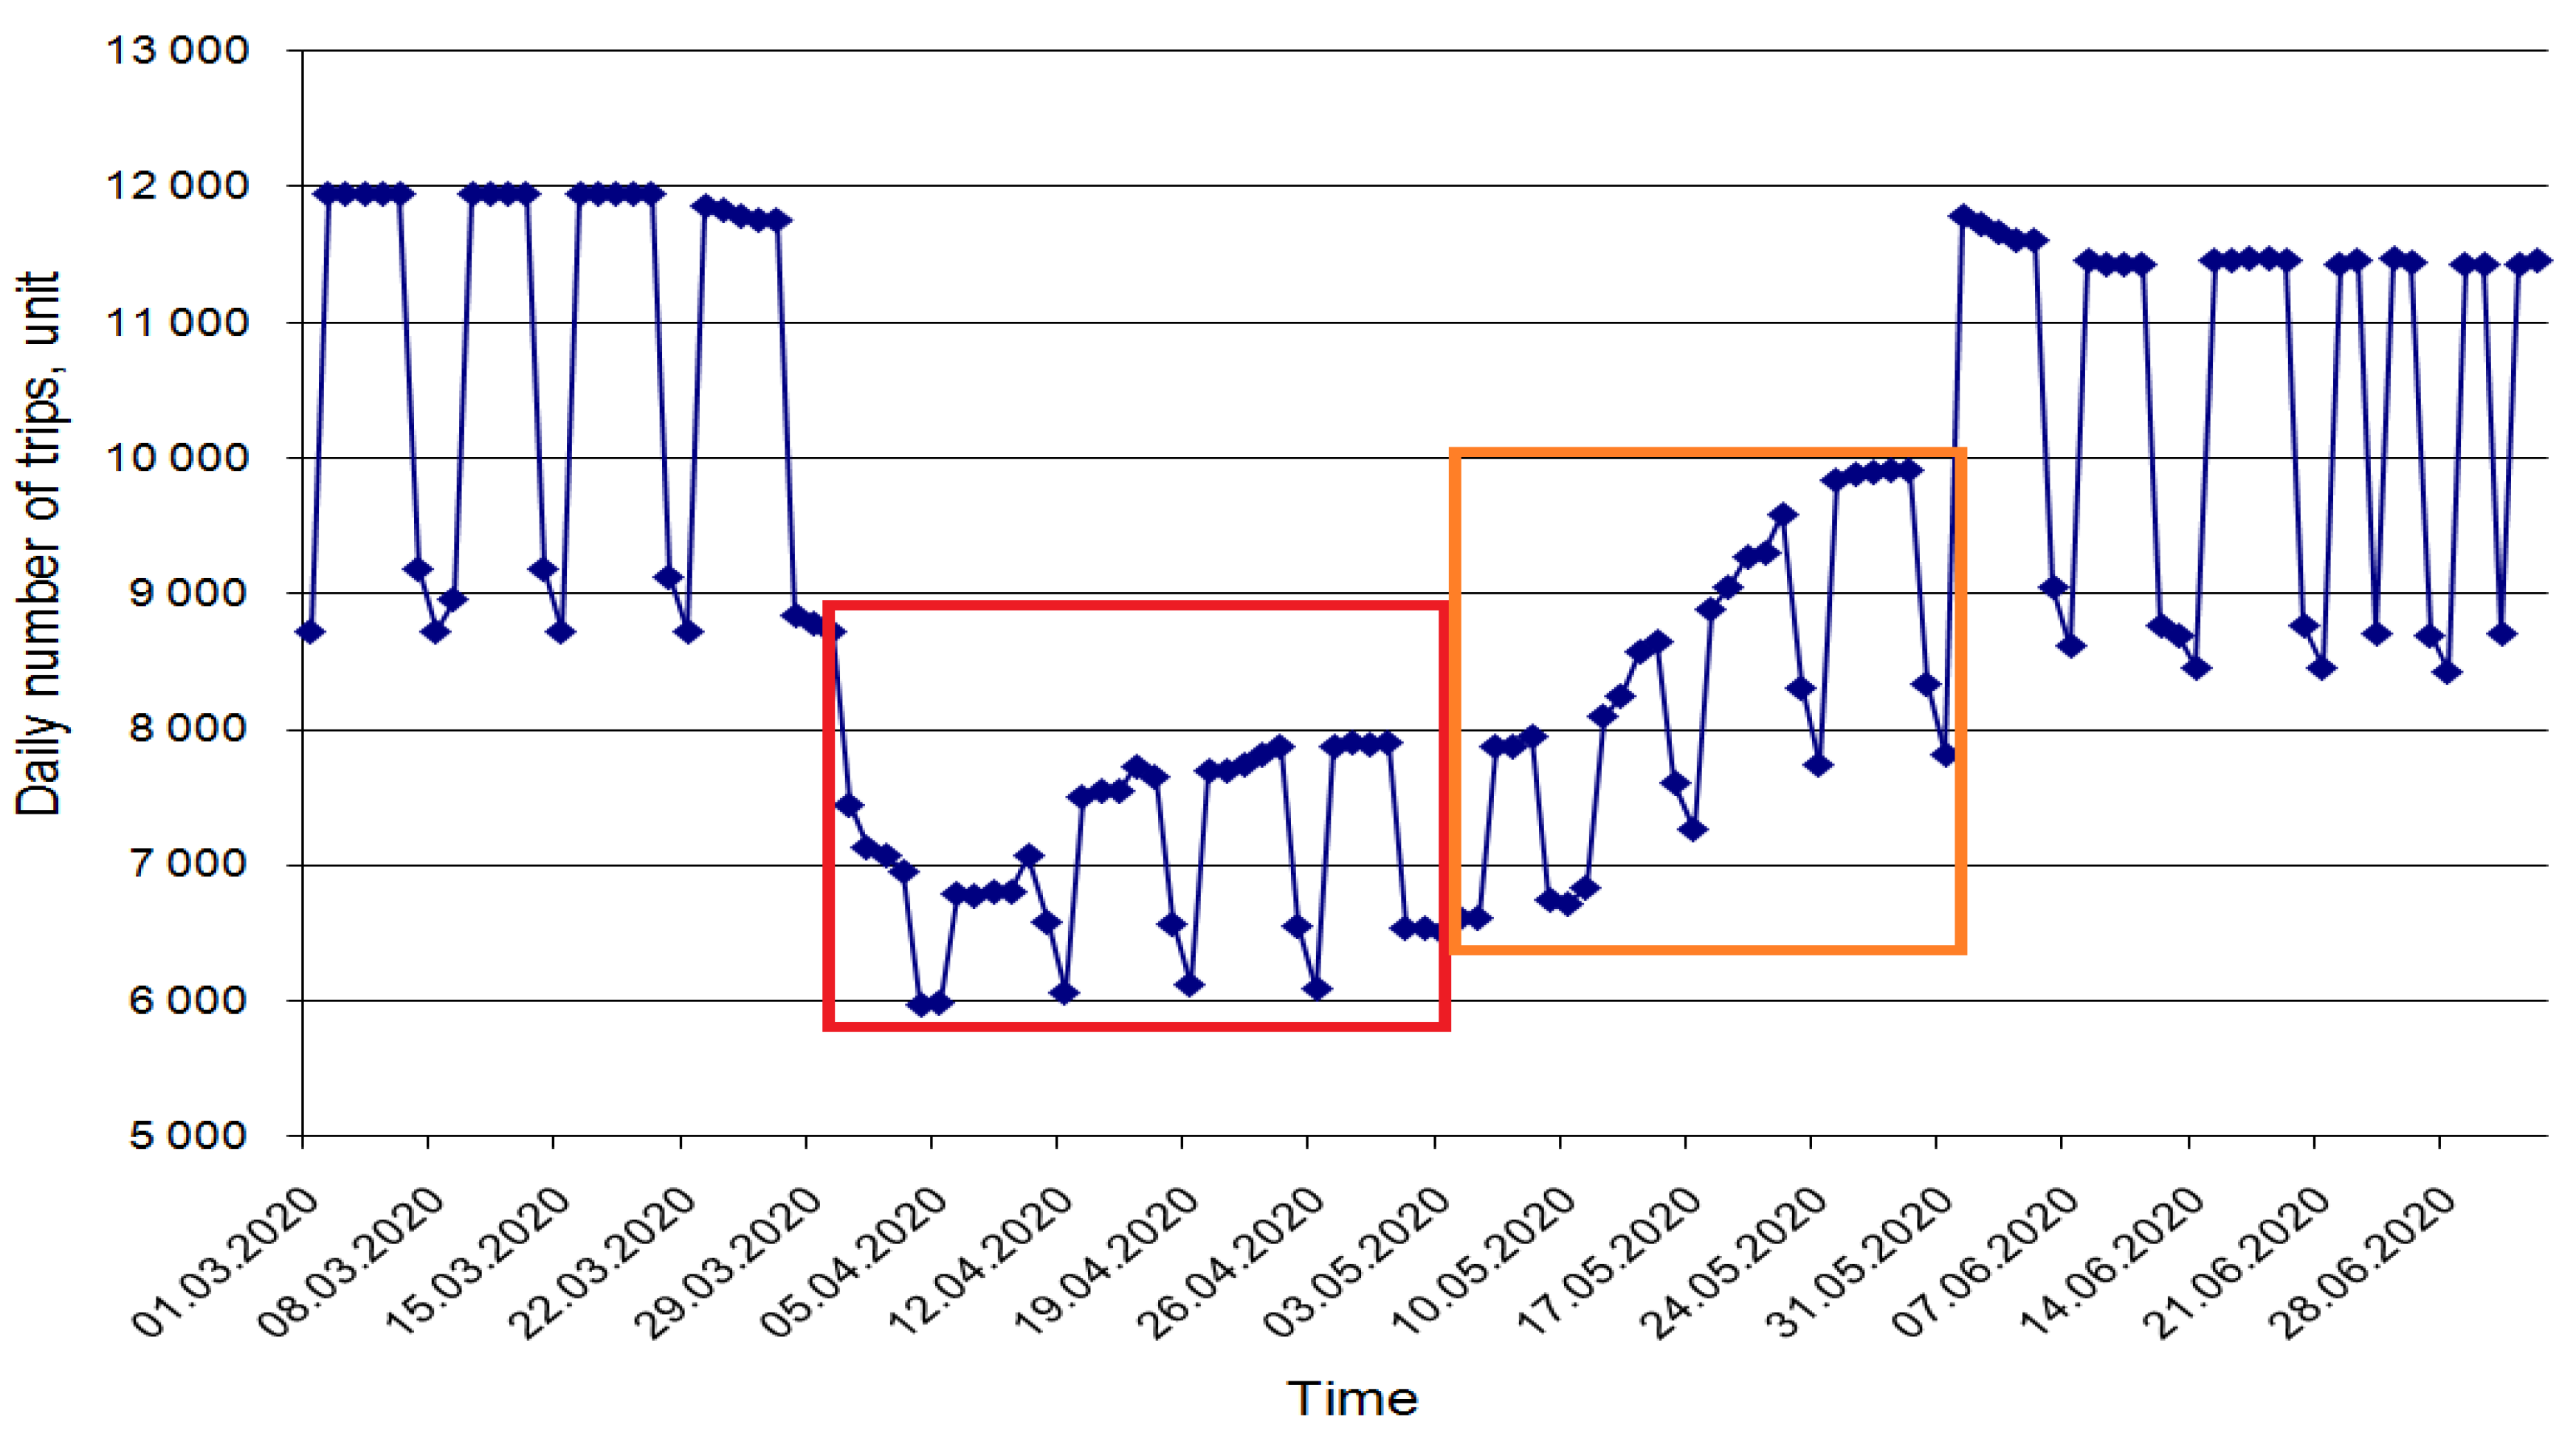
2.4. Data onthe Situation in the Transport Service Sphere of Tyumen in March–June 2020

The city passenger public transport of Tyumen consists only of buses. There is noelectric transport in the city. The transport demand of the Tyumen population is met by nine transport operators that have the status of transport companies [33]. Formally, all nine of them are private but two of them are owned by the city administration. All transport companies in total own 1300 buses of different capacities. Buses work on 109 municipal routes on winter and summer schedules. The scheduled number of buses working on municipal routes in winter is 1134 on weekdays, 846 and 802 on Saturdays and Sundays. In summer, these numbers equal 1078, 808, and 778 [34].
The scheduled number of bus trips on municipal routes in winter is 11,955 on weekdays and 9173 and 8724 on Saturdays and Sundays. In summer, these numbers equal 11464, 8756, and 8453 [34].
In recent years, the Tyumen CPPT system has functioned sustainably, reliably, and without disruption of bus trips. The rolling stock reservation system contributed to this result [35]. The regularity of bus trip execution in Tyumen achieves 99% [34] which is the highest rate in the world.
From the end of March 2020,a special regime for Tyumen CPPT system functioning was instituted. The number of working buses sharply decreased, 650–800 on weekdays, 550–650 on weekends. A diagram of the change in the number of buses on the Tyumen CPPT routes in the period from 1.03.2020 to 5.07.2020 is presented in Figure 1.
The dynamics of the number of executed bus trips Zdaily in the period of March–June 2020 are presented in Figure 2. Formally, the Tyumen CPPT system switched to a special regime, due to the COVID-19 pandemic on 30.03.2020. This emergency regime continued until 31.05.2020. Therefore, it lasted for nine weeks.
The time series of the patterns Broutes = f(Time) and Zdaily = f(Time) have identical silhouettes. This means that buses used during April–May 2020 (in the period of the acute phase of COVID-19) continued working on a schedule and implemented the planned program, but plans were changed by organizations.
The number of bus trips was reduced by a third. That was an acceptable solution to the problem of searching for a new balance between the sharply declined demand for CPPT services and the supply from transport operators. Note that the city municipality decided to return normal parameters of transport service on 1.06.2020. The criteria for the success of the managerial decisions of transport companies include indicators such as the absolute and relative volume of transportations, the ratio of expenses to profit of transport operators, the size of profit, and the size of losses.
Figure 3 and Figure 4 show diagrams of change in absolute Qdaily and relative Qtrip (as for average bus trips) volume of transportations for the Tyumen CPPT routes in the period from 1.03.2020 to 5.07.2020.
Table 1 shows the correlation with significance levels linking the variables shown in Figure 1, Figure 2, Figure 3 and Figure 4.
Figure 5 shows the matrix plot of the dependencies between variables that characterize the transportation process of the Tyumen CPPT during the period 1.03.2020–5.07.2020.
A sharp fourfold decrease (from Qdaily ≈ 450 thousand people to Qdaily ≈ 100 thousand people) of transportation volume on weekdays was not compensated by the respective decline of executed buses trips (ΔZdaily ≈ −35%). It had a significant impact on the decrease in the effectiveness of the transport operators’ work. Values of relative volumes of transportation Qtrip decreased in the period of the acute phase of COVID-19 from Qtrip= 37–38 passengers per trip to Qtrip = 13–15 passengers per trip. This indicates a significant drop (2,5–3 times) in transport companies’ effectiveness.
The attitudes of Russian citizens towards the danger of COVID-19 in the period of April–May 2020 has changed from an awareness of the lethal danger of the coronavirus and the tendency to follow the authorities’ instructions to an almost total rejection of “self-isolation” (at the end of May 2020). This fact had an impact on the actions of the Tyumen Transport Department. Starting with 10.05.2020 the number of used buses Broutes (from ≈ 720 to ≈ 900 or 25% growth) and the number of executed buses trips Zdaily (from ≈ 8000 to ≈ 10,000 or 20% growth) progressively increased.
On the one hand, the daily number of transported passengers increased from 100 thousand people to 200 thousand people. On the other hand, daily transportation volume still has not reached the normal value of 450 thousand people. Relative volume, Qtrip, increased insignificantly from Qtrip ≈ 13 passengers per trip to Qtrip ≈ 19 passengers per trip and has not reached the normal value of Qtrip ≈ 37 passengers per trip.
Silhouette photos of bus cabin filling on Tyumen city routes in the period of the acute phase of COVID-19 in April 2020 (Figure 6) fully demonstrate the situation. The coefficient of bus cabin filling in the first 2–3 weeks of the “self-isolation” regime was less than γ = 0.1 even in rush hours.

3. Methods

3.1. Principal Approaches to the Evaluation of the City Transport System Sustainability in the Conditions of COVID-19

M. Kahn [36] writes that the paradigm of sustainable development described in Agenda 21, in fact, rests on three conceptual pillars. These pillars are “economic sustainability”, “social sustainability”, and “environmental sustainability”. Social sustainability closely connects to economic sustainability—the foundation for the formation and structuring of society. The main principles of the formation of the three main parts of CPPT system sustainability are presented below.
From the perspective of social sustainability, the CPPT system has to:
-
provide transport accessibility for the realization of the main activity types necessary for life support;
-
be financially acceptable for a wide segment of the population;
-
be safe and reliable.
From the position of economic sustainability, the CPPT has to be able to provide sufficient funding to recreate the main funds.
Environmental sustainability is usually considered from the position of minimization of damage to the environment and humans.
In this article, the sustainability of the city transport system in the period of COVID-19 was considered only from the positions of economic sustainability, not in terms of the financial operations of transporters but from the perspective of the relation between the supply and demand of a transport service, and the stability and dynamics of the changes in this relationship during the period of “self-isolation”.

3.2. Method of Evaluation and Indicator of the Sustainability of the City Passenger Public Transport in the Period of the COVID-19 Pandemic

The sustainability of the CPPT system is its ability to save the current system state under the influence of external effects. In our case, the system state is a balance between the demand for transport services and the supply from the transport operators. We can identify this balance by the elasticity index, that is, the measurement of the percentage change in one variable in response to a change in another. Another approach to assessing the CPPT system sustainability is modeling the changes in the relative characteristics of the transport system functioning effectiveness in response to changes in environmental parameters. An example of the second approach is the evaluation of the relative effectiveness indicator Qtrip (Figure 4). However, in this article, for the evaluation of the Tyumen CPPT system sustainability in the period of the pandemic, we use the CPPT system elasticity index EL, that is defined as (3):
E L = ( Δ Y Y Δ X X )
where X, Y—predictor and resultant respectively; ΔX—change in predictor value; ΔY—change in resultant value.
We are interested in the elasticity of the transportation volume Qdaily in response to the change in the number of bus trips Zdaily executed by transport operators. The elasticity index E L Q daily is defined as (4):
E L Q daily = ( Δ Q daily   i   Q   average   daily   over   the   period Δ Z daily   i   Z average   daily   over   the   period )
where ΔQdaily i—deviation of daily transportation volume; Qaverage daily over the period —average daily transportation volume over the period; ΔZdaily i—deviation of daily number of buses trips; Zaverage daily over the period—average daily number of buses trips.
Figure 7 shows that the nine-week-long period of “self-isolation” in Tyumen can be divided into two subperiods—five weeks in April and four weeks in May. In April, the demand for transport services was minimal, in May it slightly increased. The Tyumen Transport Department and Tyumen transport companies took into account this tendency and increased the number of used buses. Table 2 demonstrates data on daily average indicators: number of transportations Zaverage daily and transportation volume Qaverage daily, typical for the two subperiods of “self-isolation”.
For example, there were Z6.04.2020 = 6789 bus trips per day in Tyumen when Zaverage daily over the period = 7492 bus trips per day. This means that ΔZ6.04.2020 = −703 buses trips per day.
Q6.04.2020 was equal to 76064 passengers per day when Qaverage daily over the period 90181 passengers per day. This means that ΔQ6.04.2020 = −14117 passengers per day.
The elasticity index of transportation volume E L Q d aily for 6.04.2020 is defined as (5):
E L Q daily 6.04.2020 = ( 14117   90181 703 7492 ) = 0.15654 0.09383 = 1.668
Similarly, elasticity indices E L Q daily are calculated for the whole period of the acute phase of COVID−19 (63 days).

3.3. Classification of Levels of Sustainability of the CPPT System in the Period of Significant Negative Environmental Impact

Theoretically, the elasticity index E L Q daily can be changed in the range ] ; + [ . This range of E L Q daily values should be divided into sustainability classes. The boundary (or close to them) values of the elasticity index are possible in conditions of full desynchronization between the transport demand and the transport supply. In real life, it is almost impossible. However, an absolute balance between demand and supply is also unlikely. In the classification, there will be two boundary classes—extreme left ] ;   X i ] and extreme right [ X n ; + [ . Other intermediate classes will be placed between them. The “optimal” number of intermediate classes will be known by using a heuristic Sturgess’s Equation (6) [37]:
k   =   1   +   3.322 lg ( 63 )   = 1   +   3.322   1.7993   =   6.998     7  
In [38] it is recommended to calculate the number of intervals by using Equation (7):
k   = N =   63 = 7.93     8
Thereby, for the total sample with N = 63, it is recommended to use from seven to eight intervals.
S.A. Ayvazyan [39] recommends an odd number of intervals. In our case, all theoretical ranges of the elasticity index values will be divided into seven classes.
In fact, possible values of the elasticity index E L Q daily rarely get into boundary classes—First (extreme left) and Seventh (extreme right)—but theoretically it can happen in moments of sudden bifurcation change in the transport system state. The most probable range of the elaticity index E L Q daily values is the interval ]−10; 10[. This interval consists of 20 units and it should be divided in to five classes. Therefore, the size of one class equals to 20/5 = 4.
The CPPT system has maximal sustainability when E L Q daily → 0, in other words when it belongs to class 4 (High level of system sustainability), within the interval [−2; 2].
We pair classes 1 and 7, 2 and 6, and 3 and 5—identical from the position of imbalance between supply and demand but different from the point of deficiency element (supply or demand). For this reason, the index (1 or 2) defines the qualitative characteristics of the CPPT system sustainability (note of Table 3).
The classification of the CPPT system sustainability in the period of a significant impact of the environment is presented in Table 3.

4. Results and Discussion

4.1. Results of the Evaluation of the CPPT System Sustainability in the Period of the COVID-19 Pandemic

Figure 8 shows the diagram of changes in the elasticity index E L Q daily of the Tyumen CPPT system during the nine weeks of the acute phase of the COVID-19 pandemic (30.03.20–31.05.20).
During 63 days of the acute phase of the COVID-19 pandemic (30.03.20–31.05.20), the elasticity index E L Q daily of the Tyumen CPPT system most frequently was in the range [0; 5], which means high and medium levels of system sustainability.

4.2. Distribution of Data by Class

Table 4 presents data on the class distribution of the Tyumen CPPT system state in the period of the acute phase of the COVID-19 pandemic (30.03.20–31.05.20) from the view of transport process sustainability.

4.3. Contentment of Tyumen Population with the Transport Service Quality in the Period of “Self-Isolation”

The level of CPPT system sustainability in Tyumen in the period of “self-isolation” in April–May 2020 is identified (Figure 8 and Table 4). The principal conclusion is that the CPPT system sustainability in Tyumen can be characterized as quite high. However, apart from formal assessments of the transport system state, it is important to carry out emotional evaluations of the actions taken by the transport departments of the city administration. It is necessary to know how extreme anti-crisis managerial actions in the sphere of transport service were perceived by the city population. One of the possible methods of identification of the quality of the Tyumen CPPT system management in the period of “self-isolation” and the system’s sustainability in the conditions of sharp decrease in demand for transport service is sociological research. The simplest solution is carrying out surveys of active users of the CPPT on the subject of contentment with the actions of the municipality taken for the organization of the anti-crisis work regime in April–May 2020. A survey was carried out during the first three weeks of June 2020. The main principles of the formation of a stratified respondent sample are presented as follows. Firstly, the overall sample volume should be sociologically correct. Secondly, the most important features (gender and age) of the sample should be proportional to the structure of the CPPT service users in the city. Thirdly, it is important to formulate single-value questions that can be answered only with “yes” or “no”. During 20 days of June 2020, students of the Tyumen Industrial University carried out such a survey. A total of 1582 respondents were questioned with two questions: “Did you use the CPPT service during the period of “self-isolation”?” and “Are you satisfied with the quality of the CPPT functioning in Tyumen during the period of “self-isolation?” The gender–age distribution of the respondents matches the actual situation in the period of “self-isolation” and is presented in Table 5. Table 5 also presents the distribution of answers for the given questions.
The respondent sample consists of 538 men and 1044 women. According to the results of the survey, 1317 respondents (83.2%) are satisfied with the transport service quality. The level of contentment among men is 79.9% (430 out of 538) and among women is 84.9% (887 out of 1044). The age category of 61–64 years has the opposite opinions—a maximal share of men (84.1%) and minimal share of women (only 67.8%) are satisfied with the transport service quality during the acute phase of the COVID-19 pandemic. Summarizing the results, it should be noted that 80–85% satisfied respondents are quite a good result. The usual level of contentment with transport service quality in 2015–2019 was nearly 70–78%.

4.4. Analysis of Results

An analysis of the results (Figure 8 and Table 4) allowed us to make the next conclusions.
  • For 26 out of 63 days, the Tyumen CPPT system functioning process was highly sustainable (EL = [−2; 2]). For another 30 days, the level of CPPT system sustainability was on medium level (EL= ]−6; −2] and [2; 6[). Almost 90% of the time, transport operators successfully coped with balancing between demand and supply of transport service.
  • Despite the conclusion about the high level of balance between the demand and supply of transport service, imbalance also took place. Classes EL = [0; 2] and EL = [2; 6[ took place more frequently than other classes. It means that transportation managers decreased the supply of transport service to a lesser degree than the demand for transportation itself decreased. The managerial decision was aimed at maintaining the quality of transport service at some expense of transportation effectiveness.
  • On specific days, a sharp imbalance between the demand and supply of the transport service occurred. There were seven imbalanced days out of 63: 5.04.2020 (the announcement of a vacation week for all of the country’s population); 13.04.2020–15.04.2020 (a sharp increase of transport supply in the situation of demand for transport stagnation); 25.04.2020 (a weekend day with adverse weather conditions); 18.05.2020–19.05.2020 (no explanation of imbalance was found).
  • It should be noted that transportation operators professionally and quickly coped with balancing the demand and supply in the conditions of the acute phase of COVID-19. It was not easy in light of the necessity of the operational modification of a whole work plan of transport services for the population of a large city with 807 thousand citizens. From the citizens’ side, there were no complaints addressed to transport operators during the whole period of the acute phase of COVID-19 (nine weeks of April–May 2020).
  • Simultaneously, with the positive effects mentioned in paragraphs 1–4, we should note the negative situation of the growth of relative expenses for the execution of transportations in Tyumen in the period of the acute phase of the COVID-19 pandemic. In the period of 30.03.20–31.05.20, the financial expenses of transporters significantly increased. These could lead to the bankruptcy of transport companies. Nearly 135–150 million rubles were spent on the functioning of the Tyumen CPPT system during April–May 2020.
  • It should be noted that at the moment (spring–summer 2020), Russian authorities are paying serious attention to increasing the sustainability of economic and sociopolitical processes. Such a position formed under the impact of past events in the post-soviet space. Today, in Russia, a lot of events are held to minimize the negative system impact of sudden negative events on society.

4.5. Discussion

It should be noted that many authors are interested in issues of transport system sustainability. System sustainability is analyzed from different aspects. Past works on this topic that we should note are J. Eldijk et al. [40], K. Gharehbaghi et al. [41], M. Kurth et al. [42]. We will consider the main theses of these works and their intersections with the conclusions of this article.
J. van Eldijk et al. [40] consider transport system sustainability from the impact of barrier effects of transport infrastructure, especially relief features, on the transport accessibility of different city districts. Barrier effects of transport infrastructure have a negative impact on transport economics and the time spent by the population on transportation. The authors of [40] suggested quantifying the barrier effects of transport infrastructure on local accessibility with the usage of four local accessibility indicators of direct barrier effects—travel time, choice, catchment, and service efficiency.
K. Gharehbaghi et al. [41] consider issues of Australian public transport sustainability (for the example of the Sydney metro). They note that in the process of CPPT system development it is important to consider possible problems of negative transport impact on the environment. The authors describe six elements to reducing the environmental impacts of the Sydney Metro: material implications, logistics and planning optimization, intelligent compaction, re-establishing vegetation, network management (operations), maintenance optimization (infrastructure). Authors [41] highlight that logistics and planning optimization are the most important instruments of a city transport system’s sustainability growth.
M. Kurth et al. [42] consider the economic consequences of disorders in transport system sustainability. Authors accurately observe that disruptions to transportation networks are inevitable. Another important note in this work [42] is: enhancing resilience can help in mitigating consequences of disruptions but requires a financial investment that is difficult to justify, given that low probability events may not materialize. Consequently, transportation organizations should search for a compromise between the inevitable expenses during the increase of CPPT system sustainability and the desire to provide reliable transport system functioning. Authors of [42] found out that in American cities (Atlanta, Detroit, Houston, San Francisco, Los Angeles, and so on), expenses on transport system functioning in the condition of disrupted road-transport infrastructure can increase significantly (in some cases up to 50%). At the same time, authors note a large variability in expense growth for different cities. Economic impacts of transportation disruption are most pronounced in San Francisco, where 5% disruption results in a 51% increase in transportation costs, while similar disruption in Los Angeles results in only a 9% increase [42, Table 1].
In this article, we consider the sustainability of the transport system of a large city in another way—from the position of balance between the supply of a transport service and sharply decreased demand for that service in a period of emergency. Emergency situations, similar to the COVID-19 pandemic, fortunately, happen rarely. However, there should be prepared algorithms for the work of representatives of the City Transport Department in case of such situations. One of the main insights of this experience is understanding the necessity of resource reservation in case of an emergency situation. The availability of 135–150 million rubles reserved in the municipality budget supported the high quality of the transport service in Tyumen in the period of the COVID-19 pandemic and allowed the city administration to overcome the crisis.

5. Conclusions

System sustainability can be considered from different views, for example, from the view of manageability and adaptability. System adaptability is differentiated by economic reliability (risk-sustainability) and cumulative effectiveness. These characteristics and system sustainability are formed by the flexibility and maneuverability of industrial–technological process management.
Analysis of the CPPT system sustainability of a large Russian city, Tyumen (size of population—nearly 807 thousand people) in the period of the acute phase of COVID-19 shows that the management of the transport sphere coped with external impacts, particularly, the limited transport mobility of the population.
At the same time, the Transport Department has solved such contradictory problems as:
-
provision of risk-sustainability to the whole city transport service system;
-
provision of effective transport supply in conditions of decreased demand;
-
support of the balance between the demand and supply of transport service.
The performed CPPT sustainability analysis shows that the main priority of management was the support of the high quality of transport process at the expense of transportation effectiveness. The losses of the Tyumen CPPT operators will be compensated using the city and region budget during the next half of the year. A preliminary assessment of losses is nearly 135–150 million rubles.
Sociological research of population satisfaction of the CPPT work quality shows that 80–85% of respondents are satisfied with public transport work during the regime of “self-isolation”. This indicator is one more confirmation of the high level of the Tyumen CPPT system sustainability during the acute phase of COVID-19.

Author Contributions

A.I.P.: formal analysis, D.A.P.: investigation, A.I.P., D.A.P.: project administration, A.I.P.: methodology, A.I.P.: supervision and validation, D.A.P.: data curation, A.I.P.: writing—review and editing. All authors have read and agreed to the published version of the manuscript.

Funding

This research was funded by Russian Ministry of Education and Science through grant No. 0825-2020-0014, 2020-2022.

Acknowledgments

The authors are grateful Russian Ministry of Education and Science. The article was prepared as part of the implementation of a state assignment in the field of science for scientific projects carried out by teams of researchers in scientific laboratories of higher educational institutions subordinate to the Russian Ministry of Education and Science on the project: New patterns and solutions for the functioning of urban transport systems in the paradigm “Transition from owning a personal car to mobility as a service” (No. 0825-2020-0014, 2020-2022).

Conflicts of Interest

The authors declare no conflict of interest.

References

  1. Solodkij, A.; Gorev, A. System approach to elimination of traffic jams in large cities in Russia. World Appl. Sci. J. 2013, 23, 1112–1117. [Google Scholar] [CrossRef]
  2. Leonidova, E.G. Stimulating final consumption within the reduction of regional inequality. Econ. Soc. Chang. Facts Trends Forecast 2020, 13, 59–73. [Google Scholar] [CrossRef]
  3. Vuchic, V.R. Urban Public Transportation Systems and Technology; Prentice-Hall: Englewood Cliffs, NJ, USA, 1981. [Google Scholar]
  4. Vuchic, V.R. Transportation for Livable Cities. New Brunswick; CUPR, Rutgers University: Newark, NJ, USA, 1999. [Google Scholar]
  5. Vuchic, V.R. Transport systems and policies for sustainable cities. Therm. Sci. 2008, 12, 7–17. [Google Scholar]
  6. Miller, P. Sustainability and Public Transportation: Theory and Analysis; Department of Civil Engineering, University of Calgary: Calgary, AB, Canada, 2014. [Google Scholar]
  7. Ibarra-Rojas, O.J.; Delgado, F.; Giesen, R.; Muñoz, J.C. Planning, operation, and control of bus transport systems: A literature review. Transp. Res. Part B Methodical 2015, 77, 38–75. [Google Scholar] [CrossRef]
  8. Currie, G.; De Gruyter, C. Exploring links between the sustainability performance of urban public transport and land use in international cities. J. Transp. Land Use 2018, 11, 325–342. [Google Scholar] [CrossRef] [Green Version]
  9. Qian, Y.; Ding, L.; Wang, W.; Qiao, G. Green level and sustainability evaluation with bus enterprises. CICTP 2017: Transportation Reform and Change—Equity, Inclusiveness, Sharing, and Innovation 2018. In Proceedings of the 17th COTA International Conference of Transportation Professionals, Shanghai, China, 7–9 July 2017; pp. 3032–3041. [Google Scholar]
  10. Dinesh, M.; Geetam, T. Sustainable Transport Systems: Linkages between Environmental Issues, Public Transport, Non-Motorised. Econ. Political Wkly. 1999, 34, 1589–1596. [Google Scholar]
  11. Holmgren, J. A strategy for increased public transport usage—The effects of implementing a welfare maximizing policy. Res. Transp. Econ. 2014, 48, 221–226. [Google Scholar] [CrossRef] [Green Version]
  12. Holmgren, J. Meta-analysis of public transport demand. Transp. Res. Part A Policy Pract. 2007, 41, 1021–1035. [Google Scholar] [CrossRef] [Green Version]
  13. Abouhassan, M. Urban Transport System Analysis. Urban Transp. XXIII 2017, 176, 57–68. [Google Scholar] [CrossRef] [Green Version]
  14. Ganin, A.A.; Kitsak, M.; Marchese, D.; Keisler, J.M.; Seager, T.; Linkov, I. Resilience and efficiency in transportation networks. Sci. Adv. 2017, 3, 1701079. [Google Scholar] [CrossRef] [Green Version]
  15. Lucas, K. Transport and social exclusion: Where are we now? Transp. Policy 2012, 20, 105–113. [Google Scholar] [CrossRef]
  16. Lippi, G.; Plebani, M. Laboratory abnormalities in patients with COVID-2019 infection. Clin. Chem. Lab. Med. 2020, 3. [Google Scholar] [CrossRef] [PubMed] [Green Version]
  17. McKibbin, W.; Fernando, R. The First Economic Modelling of Coronavirus Scenarios is Grim for Australia, the World. The Conversation, 3 March 2020. 12.19 am GMT. Available online: https://theconversation.com/the-first-economic-modelling-of-coronavirus_scenarios-is-grim-for-australia-the-world-132759 (accessed on 10 April 2020).
  18. Benvenuto, D.; Giovanetti, M.; Vassallo, L.; Angeletti, S.; Ciccozzi, M. Application of the ARIMA model on the COVID-2019 epidemic dataset, Data in Brief. Preprint 2020. [Google Scholar] [CrossRef]
  19. Coronavirus Will Change the World Permanently. Here’s How. Politico Magazine. March 19, 2020. 07.30 pm GMT. Available online: https://www.politico.com/news/magazine/2020/03/19/coronavirus-effect-economy-life-society-analysis-covid-135579 (accessed on 15 April 2020).
  20. Musinov, E.A.; Ovsyannikova, O.V. Psychology of behavior of people in emergency situation. Colloquium-Journal 2019, 3, 5–8. Available online: file:///C:/Users/E8E5~1/AppData/Local/Temp/psychology-of-behavior-of-people-in-emergency-situations.pdf (accessed on 14 July 2020).
  21. Sustainable Lifestyles: Today’s Facts & Tomorrow’s Trends. Available online: https://www.sustainable-lifestyles.eu/publications/publications.html (accessed on 11 July 2020).
  22. O’Neill, D.W.; Fanning, A.L.; Lamb, W.F.; Steinberger, J.K. A good life for all within planetary boundaries. Nat. Sustain. 2018, 1, 88–95. [Google Scholar] [CrossRef] [Green Version]
  23. Randers, J.; Golüke, U.; Wenstøp, F.; Wenstøp, S. A user-friendly earth system model of low complexity: The ESCIMO system dynamics model of global warming towards 2100. Earth Syst. Dyn. 2016, 7, 831–850. [Google Scholar] [CrossRef] [Green Version]
  24. Taleb, N. The Black Swan: The Impact of the Highly Improbable; Random House Trade Paperback Edition Inc.: New York, NJ, USA, 2010; p. 472. [Google Scholar]
  25. Callahan, G. Nassim Nicholas Taleb: The black swan: The impact of the highly improbable. Rev. Austrian Econ. 2008, 21, 361–364. [Google Scholar] [CrossRef]
  26. Gerami, V.D.; Colic, A.V. Management of Transport Systems. Transport Logistics Support; Urait: Moscow, Russia, 2014; p. 510. (In Russian) [Google Scholar]
  27. Werbach, A. Strategy for Sustainability: A Business Manifesto; Harvard Business Press: Boston, MA, USA, 2009. [Google Scholar]
  28. Kazem, C.; Richard, L. Sustainable Competitive Advantage: Towards a Dynamic Resource-Based Strategy. Manag. Decision. 1999, 37, 45–50. [Google Scholar] [CrossRef] [Green Version]
  29. Christopher, M. Logistics and Supply Chain Management. Creating Value-Adding Networks, 3rd ed.; Financial Times/Prentice Hall: Horlow, UK, 2005. [Google Scholar]
  30. Aronsson, H.; Brodin, M.H. The environmental impact of changing logistics structures. Int. J. Logist. Manag. 2006, 17, 394–415. [Google Scholar] [CrossRef]
  31. Lotfabadi, P.; Alibaba, H.F.; Arfaei, A. Sustainability; as a combination of parametric patterns and bionic strategies. Renew. Sustain. Energy Rev. 2016, 57, 1337–1346. [Google Scholar] [CrossRef]
  32. Marshall, A. Principles of Economic Science; Progress: Moscow, Russia, 1993; Volume 1, p. 414. (In Russian) [Google Scholar]
  33. Tyumen City Transport. Tyumencitytrans. Official Site. Available online: https://tgt72.ru/ (accessed on 7 July 2020).
  34. Department of Road Infrastructure and Transport of Tyumen City Administration. Official Site. Available online: http://www.tyumen-city.ru/ekonomika/transport/ (accessed on 7 July 2020).
  35. Ryzkov, A.Y.; Zyuzin, P.V. Urban Public Transport Development in Russia: Trends and Reforms. 2016. Available online: https://wp.hse.ru/data/2016/12/06/1113069366/05URB2016.pdf (accessed on 18 July 2020).
  36. Kahn, M. Concepts, definitions, and key issues in sustainable development: The outlook for the future. In Proceedings of the 1995 International Sustainable Development Research Conference, Manchester, UK, 27–28 March 1995; Keynote Paper. pp. 2–13. [Google Scholar]
  37. Sturgess, H.A. The choice of class intervals. J. Am. Stat. Assoc. 1926, 21, 65–66. Available online: esalq.usp.br›departamentos…LCE0216/Sturges1926.pdf (accessed on 20 July 2020). [CrossRef]
  38. Heinhold, I.; Gaede, K.W. Ingeniur Statistic; Springler Verlag: München, Germany; Wien, Austria, 1964; p. 352. [Google Scholar]
  39. Ayvazyan, S.A.; Enyukov, I.S.; Meshalkin, L.D. Applied Statistics. Fundamentals of Modeling and Primary Data Processing; Finance and statistics: Moscow, Russia, 1983; p. 471. (In Russian) [Google Scholar]
  40. Eldijk, J.; Gil, J.; Kuska, N.; Patro, R. Missing links—Quantifying barrier effects of transport infrastructure on local accessibility. Transp. Res. Part D Transp. Environ. 2020, 85, 102410. [Google Scholar] [CrossRef]
  41. Gharehbaghi, K.; McManus, K.; Robson, K. Minimizing the environmental impacts of mega infrastructure projects: Australian public transport perspective. J. Eng. Des. Technol. 2019, 17, 736–747. [Google Scholar] [CrossRef]
  42. Kurth, M.; Kozlowskim, W.; Ganin, A.; Mersky, A.; Leung, B.; Dykes, J.; Kitsak, M.; Linkov, I. Lack of resilience in transportation networks: Economic implications. Transp. Res. Part D Transp. Environ. 2020, 86, 102419. [Google Scholar] [CrossRef]
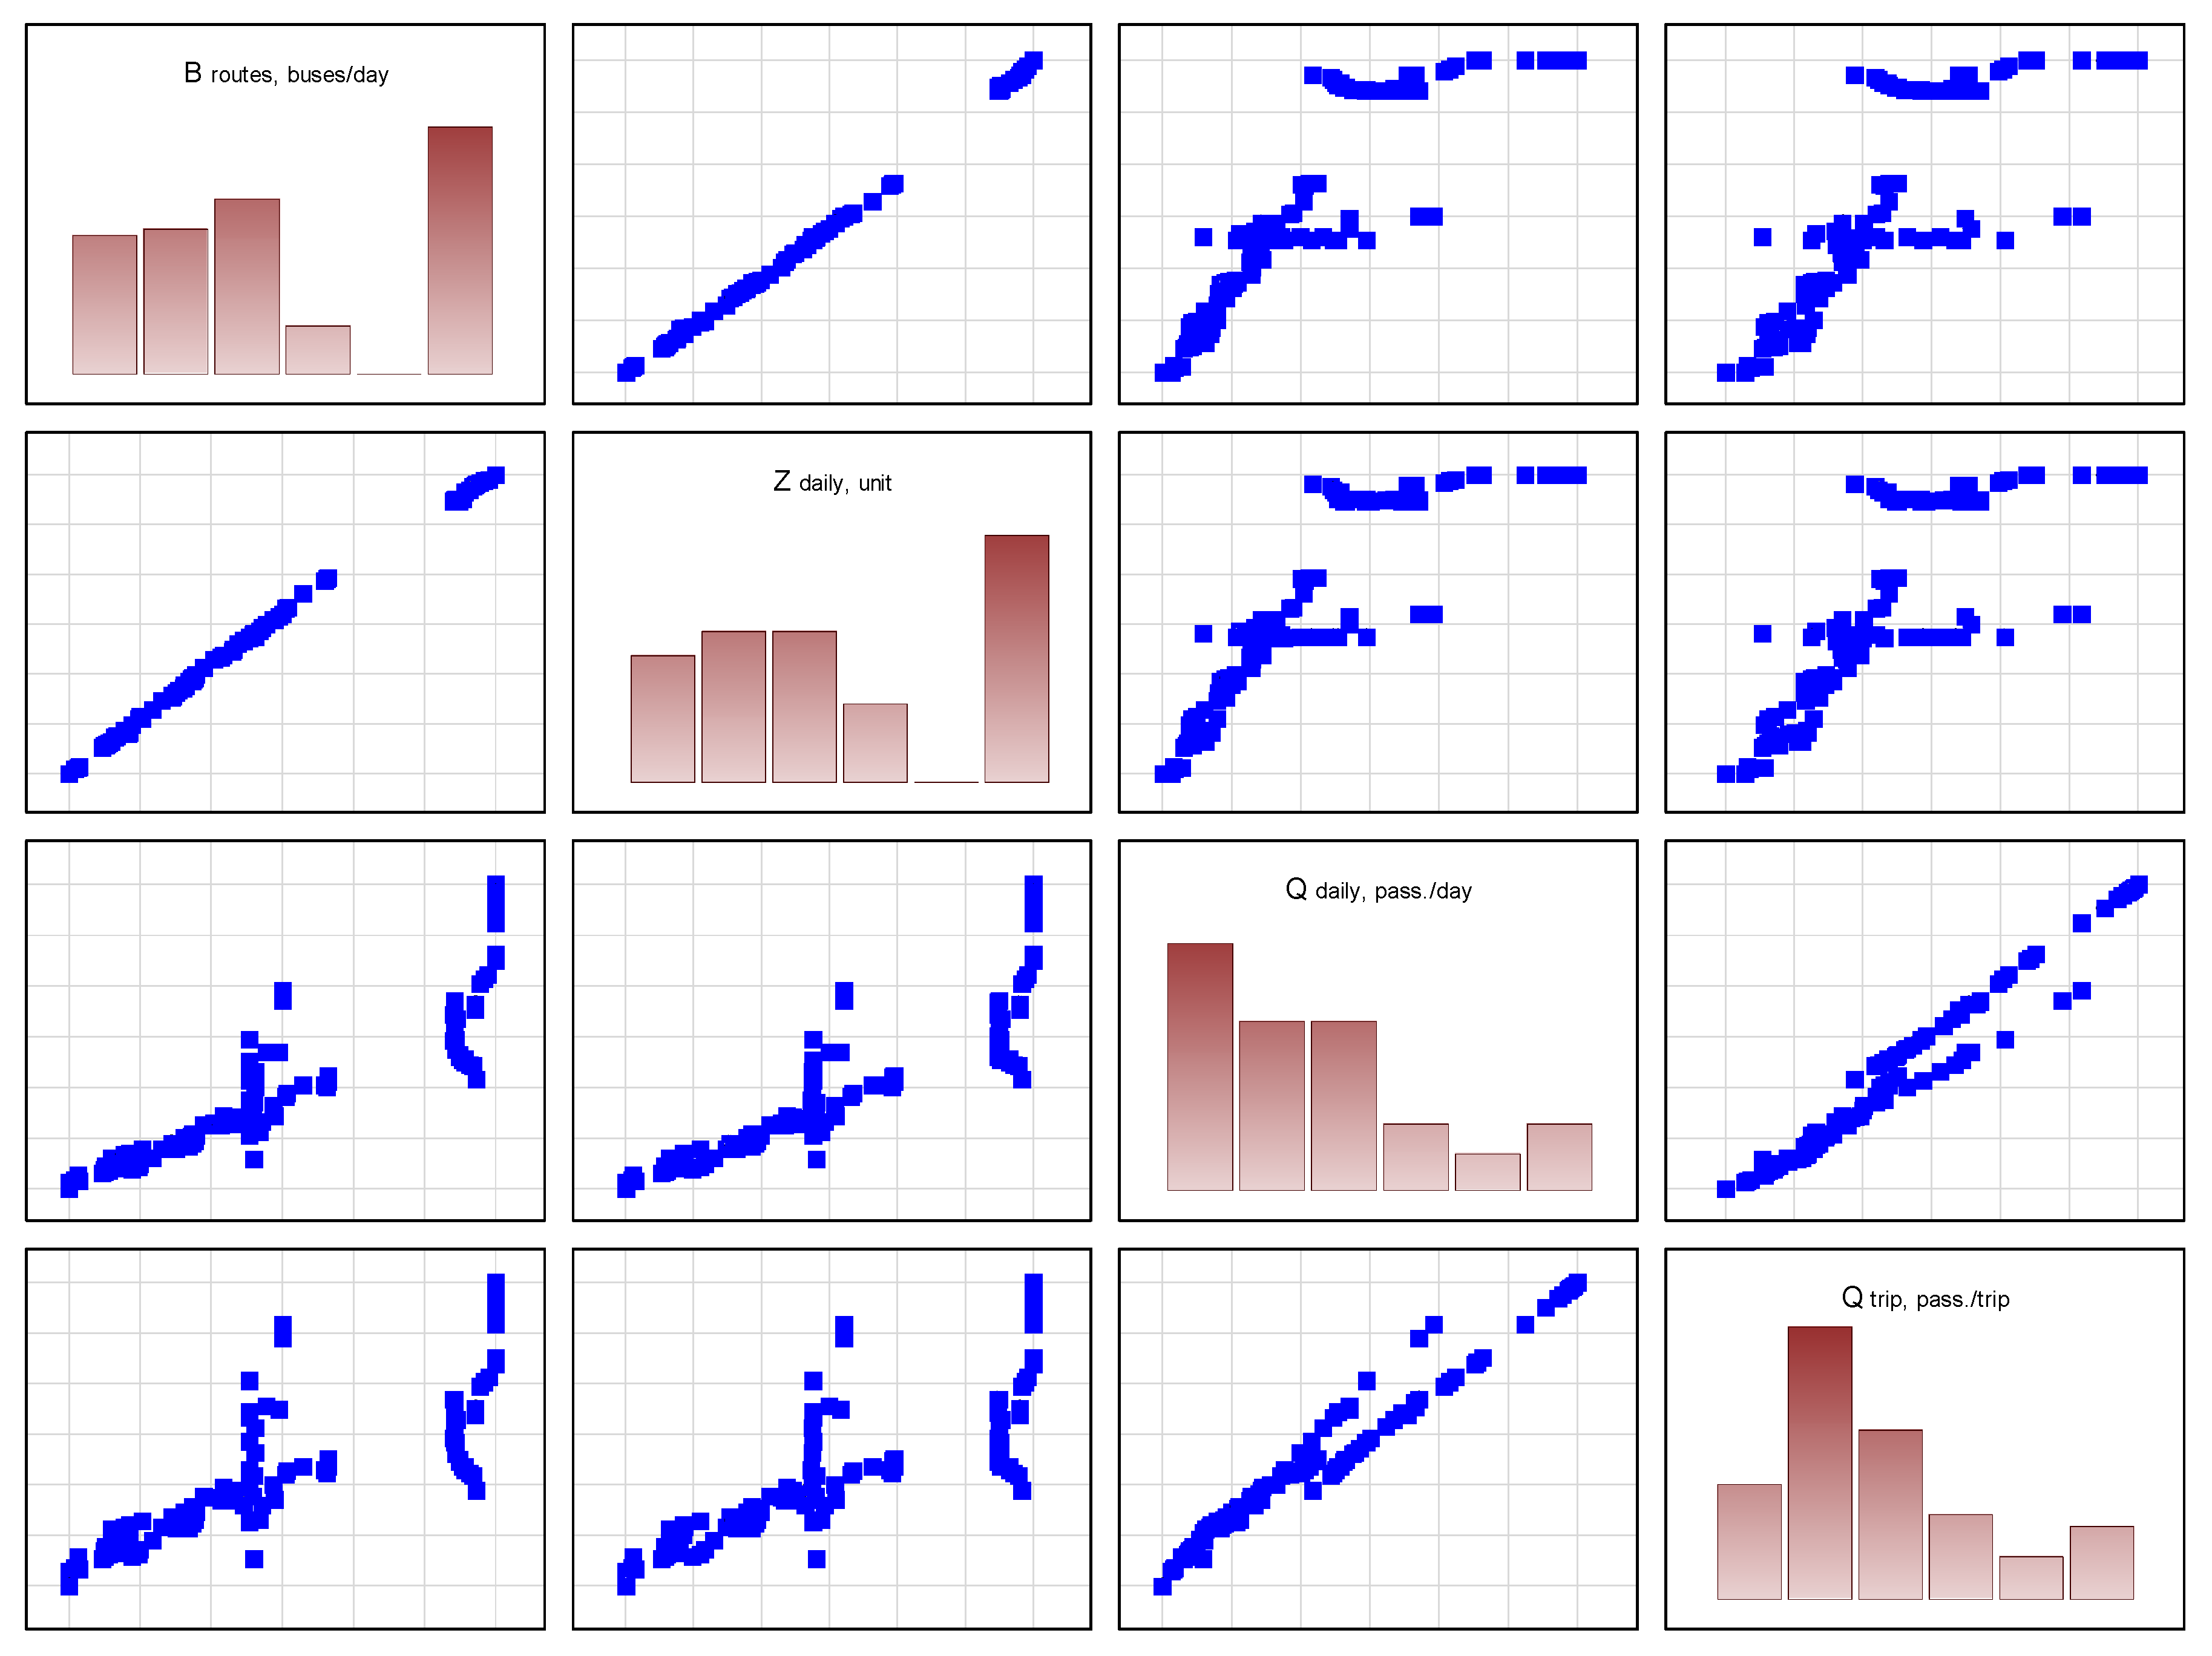
Figure 1. Diagram of the change in the number of buses on the Tyumen CPPT routes in the period from 1.03.2020 to 5.07.2020.
Sustainability 12 07644 g001
Figure 2. Diagram of the change in executed buses trips on the Tyumen CPPT routes in the period from 1.03.2020 to 5.07.2020.
Sustainability 12 07644 g002
Figure 3. Diagram of the change in the cumulative daily volume of transportations executed by buses on the Tyumen CPPT routes in the period from 1.03.2020 to 5.07.2020.
Sustainability 12 07644 g003
Figure 4. Diagram of change in relative volume of transportations Qtrip (as for average bus trips)on the Tyumen CPPT routes in the period from 1.03.2020 to 5.07.2020.
Sustainability 12 07644 g004
Figure 5. Matrix Plot Xi/Yi.
Sustainability 12 07644 g005
Figure 6. Silhouette photos of bus cabin filling on Tyumen city routes in the period of the acute phase of COVID-19 in April 2020.
Sustainability 12 07644 g006
Figure 7. Dividing the acute phase of “self-isolation” of the Tyumen population (nine weeks) in to two parts—five weeks (30.03.20–3.05.20) and four weeks (4.05.20–31.05.20).
Sustainability 12 07644 g007
Figure 8. Changes in the elasticity index E L Q d aily = f(Time of the acute phase of the COVID-19 pandemic).
Sustainability 12 07644 g008
Table 1. Correlation table with significance levels linking the variables shown in Figure 1, Figure 2, Figure 3 and Figure 4
X/YY1-BroutesY2-ZdailyY3-QdailyY4-Qtrip
X1-Broutes-0.9990.8870.814
X2-Zdaily0.999-0.8820.813
X3-Qdaily0.8870.882-0.983
X4-Qtrip0.8140.8130.983-
Table 2. Daily average values of the Tyumen CPPT system functioning indicators in the period of the acute phase of the pandemic.
Day TypeZaverage daily over the period,
Number of Trips per Day
Qaverage daily over the period,
Passengers per Day
Period 30.03.2020–3.05.2020 (5 weeks)
Weekday749290181
Weekend631453092
Period 4.05.2020–31.05.2020 (4 weeks)
Weekday8985148589
Weekend732091492
Table 3. Classification of the CPPT system sustainability.
ClassClass NameValues of ELCPPT System State
1Very low level
of system sustainability 1
]−∞; −10]The demand for the CPPT service changed to become less than the transport service supply
2Low level
of system sustainability 1
]−10; −6]
3Medium level
of system sustainability 1
]−6; −2]
4High level
of system sustainability
[−2; 2]Changes in the demand for the CPPT service and the transport service supply are balanced
5Medium level
of system sustainability 2
[2; 6[The demand for the CPPT service changed to become more than the transport service supply
6Low level
of system sustainability 2
[6;10[
7Very low level
of system sustainability 2
[10; +∞[
Note. Class index means the following: 1—an excess of demand over the supply of the transport service; 2—an excess of supply over the demand for the transport service.
Table 4. Class distribution of the Tyumen CPPT system state in the period of the acute phase of the COVID-19 pandemic (30.03.20–31.05.20) from the view of transport process sustainability.
ClassClass NameValues of ELNumber of Days in Current State
1Very low level of system sustainability 1]−∞; −10]1
2Low level of system sustainability 1]−10; −6]0
3Medium level of system sustainability 1]−6; −2]1
4High level of system sustainability[−2; 2]26
5Medium level of system sustainability 2[2; 6[29
6Low level of system sustainability 2[6;10 [2
7Very low level of system sustainability 2[10; +∞[4
Table 5. Distribution of respondents of the survey on the issue of transport service quality in the period of “self-isolation” by gender and age.
Respondents’ GenderRespondents’ Age Groups
18–2526–4041–5051–6061–64
Male86/65154/118132/110122/10044/37
Female62/50426/364441/38187/7328/19
Note: 1. In the period of the acute phase of the COVID-19 pandemic (30.03.2020–31.05.2020) children under 18 and senior people over 65 had to be in strict “self-isolation” and they were forbidden to use public transport service. 2. The numerator of each fraction denotes the number of respondents in a specific category. The denominator of each fraction is the number of respondents satisfied with transport service quality in the period of “self-isolation”.

