Article

Sustainability of Tourism Development in the Mediterranean—Interregional Similarities and Differences

Department of Tourism and Economy, Faculty of Economics, Business and Tourism, University of Split, 21000 Split, Croatia
*
Author to whom correspondence should be addressed.
Sustainability 2020, 12(18), 7641; https://doi.org/10.3390/su12187641
Submission received: 31 July 2020 / Revised: 3 September 2020 / Accepted: 8 September 2020 / Published: 16 September 2020
(This article belongs to the Special Issue Tourism, Smart Specialization and Sustainable Development)

Abstract

:
This study adjusts the Driving forces–Pressures–State–Impact–Response framework (DPSIR) to analyze the interregional similarities and differences with regard to sustainable tourism development in selected Mediterranean (MED) regions. The study involved three steps. The first step was a critical reflection on sustainable tourism indicators and DPSIR as a grouping approach. The analysis yielded 29 sustainability indicators distributed within four components of the DPSR framework. The data were collected for 54 NUTS 2 level MED regions. In the second step, an exploratory factor analysis (EFA) followed by a cluster analysis (CA) were performed to group homogenous regions and generate the Med Regions Cluster Matrix (MRCM). The investigation revealed that although countries in the Mediterranean share many characteristics in terms of tourism development and impacts, universal policies in mitigating the pressures are not appropriate. The main contributions of the study are (1) the application of the DPSIR model in the sustainable tourism context (2) and the analysis of the similarities and differences regarding the sustainability of tourism development in the selected MED regions. The conclusions of the analysis may stimulate the debate on mutual responses and sustainable tourism policy responses in the MED region.

1. Introduction

The twenty-first century has brought new challenges and opportunities for tourism development, including environmental issues, growing concerns about social justice and income equity, funding and the capacity of valuable resources and expectations of tourism as a panacea for economic and social ills [1]. Sustainability has become a key variable in the competitiveness of tourist destinations and, consequently, a primary objective for public managers. However, making tourism sustainable is not easy, with a part of the reason lying in the imprecise nature of the sustainability concept [2]. The conventional definitions of sustainable tourism often put it at the intersection of activities that are at the same time environmentally appropriate, socially acceptable and economically viable. Thus, in the last two decades, the exploration of positive and negative environmental impacts of tourism development has become a primary research interest.
The United Nations Environmental Programme (UNEP) and World Tourism Organization (UNWTO) [3] view sustainable tourism as something that takes full account of its current and future economic, social and environmental impacts, addressing the needs of visitors, the industry, the environment and host communities. However, the history of sustainable tourism is one of two parallel stories, each with several threads, embedded within a broader context of social change, large-scale experimentation with development concepts and initiatives and a growing academic interest in tourism [4]. The rising interest in tourism is a consequence of the tremendous growth of tourism as a social and economic phenomenon and its potential cultural and economic consequences and concerns. On the other hand, sustainability arose from four initially separate but eventually converging themes: the impact of human activity on the environment; international interest in development; notion of “Quality of life” and changes in models of governance. Sustainable development, including the subconcept of sustainable tourism, is one term among several, which has emerged in an attempt to reconcile conflicting value positions concerning the environment [5]. The growing contribution of tourism to environmental change, including climate change, coupled with tourism simultaneously being promoted as a means of economic growth, suggests that sustainable tourism development is a significant policy problem [6]. Thus, many authors stress the need to develop methods for evaluating impacts, so that objective criteria can be established to regulate sustainability and tools designed to support public policies, i.e., destination responses [7,8].
Within the communication “Europe, the world’s No. 1 tourist destination—A new political framework for tourism in Europe” [9], the European Commission (EC) has recognised that competitiveness of tourism is closely linked to its sustainability, as the quality of destinations is strongly influenced by their natural and cultural environment and their integration into the local community. However, the responses from tourism business across Europe to concerns about sustainability have varied widely, which suggests that finding mutual answers to pressures induced by excessive tourism development in the Mediterranean, the most vibrant European tourism area, will not be an easy task. Furthermore, the authors of [10] stressed that the coordination of sustainable tourism activities of a large group of stakeholders remains a challenge at the EC’s intergovernmental level.
The adverse impacts of tourism on sustainability are often at the local scale and require national tailor-made policy responses. For example, the authors of [11] discuss tourism degrowth policies implemented in Barcelona to address the escalating social protests and unrests. However, some challenges that tourism faces are mutual, and thus, it is reasonable to look for joint responses. This has been acknowledged with a recently published [12] report on overtourism, in which the authors proposed eleven different strategies and 68 measures to manage visitor growth in urban destinations.
This study responded to the call for further research on the sustainability of tourism development of individual EU member states [10] with a particular focus on the Mediterranean region. The study aims to reveal interregional similarities and differences and foster the discussion on mutual policy responses. We outline the development of Mediterranean (MED) Regions Cluster Maps (MRCMs) to explore the heterogeneity, drivers and sustainability of tourism development, using NUTS 2 level data for 54 Mediterranean regions. The MRCM is a crucial component of the publicly available participative decision support system (PDSS), the main output of the ShapeTourism project (http://www.shapetourism.eu/), consisting of a system of tools designed to analyze data and provide intelligence for decision making in the Mediterranean.
In the subheadings below, we discuss the selection of the indicators to analyze the sustainability of tourism development in MED regions, and finally, the development of an MRCM and implications for policymakers.

2. The Need for Indicators of Sustainable Tourism Development
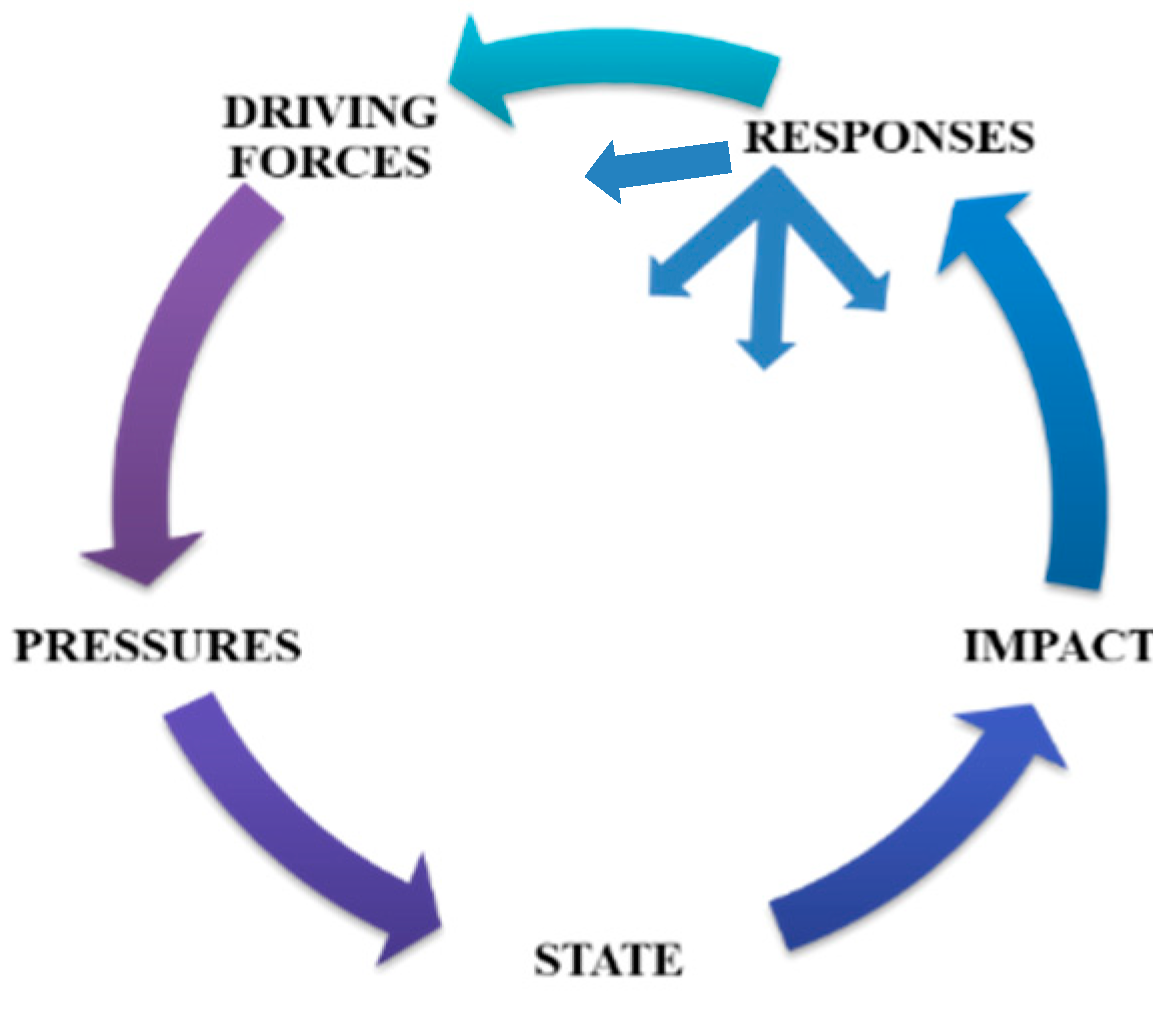
Despite the traditional lack of data, the tourism industry has a long tradition of monitoring destination performance using conventional tourism indicators such as arrival numbers, length of stay and tourism expenditure [13]. However, monitoring sustainable tourism development in a destination is a complex process, which requires a comprehensive approach. In the early 1990s and after the Rio Earth Summit, many organizations led by the UN began to develop indicators as tools for monitoring the progress made towards the broad goals of sustainable development [14]. The indicators play a key role as main quantitative instruments used to parameterize activities and their sustainability. Their vital contribution to the decision-making process, related to public management and planning, derives from their ability to describe and measure the reality of a specific area in terms of objective parameters [2]. However, the indicators cannot create sustainable tourism—they are a tool, not the solution and a technical approach to a very human problem [13], and public policies are required to move activities in a sustainable direction.
The World Tourism Organization (UNWTO) defines an indicator as a “quantitative, synthetic instrument that facilitates analysis and assessment of information in such a way that when used in combination with other types of instruments, it enables decision-makers to reduce the likelihood of inadvertently making poor decisions” [15]. Thus, the UNWTO [16] argues that tourism sector decision-makers need to know the links between tourism and the natural and cultural environments, including the effects of environmental factors on tourism and the impacts of tourism on the environment. Although institutions such as the UN, UNWTO, EC and Organization for Economic Co-operation and Development OECD have developed sustainable development-related indicators, an increasing number of tourism researchers stress the need for the development of more comprehensive sustainable tourism indicators that make the critical connection between tourism and broader economic, environmental and social processes in a destination [17]. McCool et al. [18] question how can we know if tourism development is contributing to sustainability without a set of indicators to measure progress. The emphasis is not only on the development of new indicators but also on using and combining the existing ones and building indicator systems to broaden the understanding of sustainable tourism development [19,20,21,22]. An indicator system is a set of simple indicators that are structured within the framework of a specific scheme, reflecting the purpose of the metric and the study objectives to generate a new, different perspective of the phenomenon studied [2]. In most cases, various indicators related to certain phenomena are grouped, i.e., organized in a specific manner. The indicator systems facilitate the interpretation of relationships between the variables that can potentially result in a proposition of qualitative responses to address destination challenges. In this study, a comprehensive indicator system is used to analyze the challenges of sustainable tourism development and potential public responses in selected MED (NUTS 2 level) regions.

DPSIR Framework

Given that indicators are more than discreet variables considered separately, it is vital to test only logically organized indicators. Miller and Twining-Ward [17] suggest three basic approaches to construct a clear and logical indicator framework: (1) Building indicator categories, (2) Driving forces–Pressure–State–Impact–Response (DPSIR) and (3) Goal–matrix framework. This study applies the adjusted DPSIR approach.
This grouping system has significantly evolved in the last three decades. The earlier antecedent for DPSIR was the Pressure–State–Response (PSR) framework developed by the OECD in 1994 [23]. It provided a means of organizing and assessing the interconnections among environmental pressures, the state of the environment and environmental responses as cause and effect relationships that can be represented by indicators [24]. The focus of PSR on anthropocentric pressures and responses in its evaluation of environmental problems proved to be problematic [25]. Therefore, the UN Commission on Sustainable Development [26] attempted to address this problem by expanding the PSR with a Driving force–State–Response (DSR) framework. Addressing the remaining criticism has resulted in the development of the final framework for an integrated assessment, i.e., the DPSIR. The framework can be used for assessing the causes, consequences and responses to change holistically [27]. After it was adopted by the European Environmental Agency in 1999, the DPSIR framework has become a commune approach to analyze the genesis and persistence of environmental problems at scales ranging from global to local. In its essence, the concept is at the same time simple, comprehensive and evolving, limited only by the boundaries of researchers’ understanding and specifics of phenomena explored.
Under the DPSIR framework (Figure 1), drivers (Ds) refer mostly to fundamental social processes (such as the distribution of wealth) which shape the human activities that have a direct impact on the environment [23]. Drivers are highly dependent upon phenomenon explored, which is the same as other dimensions of the framework. They lead to human activities that exert pressures (ps) on the environment as a result of production or consumption processes [28]. The state is mostly seen as the condition of the environment—the quality of various environmental compartments [29]. It is a reflection of the current state and environmental trends as well. The changes in a state may have an environmental or economic impact (I) on the functioning of ecosystems, their life-supporting abilities, human health and the economic and social performances of society [28]. Responses (Rs) generally refer to institutional efforts to address changes in states as prioritized by impacts [23]. It usually results from the understanding of impacts generated by the driving forces.
Due to its comprehensiveness, the DPSIR framework is commonly used in sustainable development literature. Koundouri et al. [30] used the DPSIR framework as a basis for the development of sustainable environmental and socioeconomic management of freshwater ecosystem services. Bidone and Lacerda [31] applied similar focus and also evaluated sustainability in coastal areas within the DPSIR framework integrating natural and socioeconomic indicators. Odermatt [32] delivers a meta-analysis of sustainability in the mountain regions and focuses on the identification of critical responses that were implemented through more than 100 case studies conducted in mountain regions. Research findings suggest that tourism is one of five key response categories in the context of sustainable development. Atkins et al. [27] focus on the management of the marine environment and identify social and economic development changes as critical drivers measured throughout different indicators. In their research emphasis is on the treatment of ecosystem services and societal benefits within the overall framework of the ecosystem approach. Haberl et al. [29] used the DPSIR framework and socioeconomic metabolism approach to focus on the improvement of understanding socioeconomic biodiversity pressures and drivers. Svarstad et al. [33] argue that the DPSIR framework has evolved as an interdisciplinary tool to provide and communicate knowledge on the state and causal factors regarding environmental issues. Their findings suggest that the framework is most compatible with the preservationist discourse type and thus tends to favor the conservationist position over other positions. The authors conclude that DPSIR is characterized by a lack of communication between researchers and stakeholders and policymakers. The framework has also been applied in tourism research, among others, to assess the risks associated to wildlife tourism [34] and nature-based tourism development [35], estimate the sustainability of traditional mass tourism destinations [36] and sustainable tourism planning and adaptation to climate change [37].
The DPSIR framework has been criticized for several shortcomings. One of the common criticisms is that the framework creates a set of stable indicators that serve as a basis for analysis that may not take into account the changing dynamics of the system in question. Therefore, the framework cannot capture trends except by repeating the study on the same indicators at regular intervals [23]. Critiques toward the DPSIR approach are often directed at the mechanic oversimplification of the scheme, scheme linearity and the difficulty in handling parameters that may act as both a response and driving force [38]. Ness et al. [39] stress the problem of the scheme’s ability to encompass the multidimensional and multilevel relationships of problems. Tscherning et al. [40] have highlighted that criticism of the framework mainly refers to its implicit hierarchical structure. In that manner, Carr et al. [23] argued that this structure causes a hierarchy of elements as well as of actors, individuals and groups who are affected by social and environmental changes, and who have only the potential to address impacts. According to Carr et al. [23], most of the criticism rests on a misunderstanding of DPSIR, both by critics of the framework and by those trying to apply it to their research. Just as its predecessors, DPSIR is not a model, but a means of categorizing and disseminating information related to particular environmental challenges. As pointed out by Karageorgis et al. [41], to be able to understand the cause-effect relationship associated with a specific environmental issue, one must focus on the links between the different categories (DPSIR). In this focus, the application of particular social science with physical science models becomes appropriate. Finally, the framework may serve as a tool that enhances the assessment and monitoring function concerning the activity, evaluates the performance of tourism planning and supports the sustainable management of a tourism destination and the development of spatial (regional) policies by considering the overall impacts. In other words, it enables policymakers to respond appropriately [37].

3. The Empirical Analysis

3.1. Methodology

In this study, we use the adjusted DPSIR framework to analyze the challenges of sustainable tourism development in 54 MED NUTS 2 level regions within Cyprus, Spain, France, Greece, Croatia, Italy, Malta, Slovenia and Portugal. This convenient sample of Mediterranean regions leading in tourism was primarily conditioned by the aim and scope of the project and data availability and the fact that NUTS 2 units are the basis of EU regional policy and eligible for support from cohesion policy [42]. In the analysis, each NUTS 2 level region was considered individually (for example, each region in Spain as a separate unit) to enable interregional comparisons and reduce the potential bias which might appear when viewing regions as parts of countries. Due to the nature of the investigation and the theoretical discrepancies concerning the distribution of indicators among the state and impact categories, we have followed [26] and decided to omit the impacts component and to rely on a reduced DPSR framework.
We have selected and grouped the adequate indicators into four comprehensive interdependent model components, i.e., driving forces, pressures, state, responses. Following [39], when explaining the correlation between the different dimensions of sustainability, the first step is to reduce the indicator number to the smallest number of uncorrelated factors. To do so, we have used an Explanatory Factor analysis (EFA), which analyses the structure of correlations among a large number of variables by defining sets of variables that are highly interrelated and represent the dimensions within the data, known as factors [43]. The general purpose of an EFA is to summarize the information contained in several original variables into a smaller set of new, composite dimensions of factors with a minimum loss of information [43,44]. We have used an EFA to create factors within each category of the DPSR framework. Furthermore, we have extracted their factor scores and used them in a cluster analysis (CA) to generate MED Regions Cluster Maps (MRCMs). The purpose of this procedure was to obtain clusters of homogenous regions in the four model components and analyze if and to what extent clusters (i.e., their membership) match in the four model components. An MRCM was used to analyze and compare regional differences and to broaden the understanding of challenges of sustainable tourism development within MED regions by comparing factor scores to each cluster’s mean [45] and by map visualizations using Geographic Information System (GIS) software.

3.2. Choice of Indicators and the Research Sample

The concept of sustainable tourism development is widely explored [46] and recently the focus has been on “measuring” sustainability by using different indicators [47,48,49]. A comprehensive list of core indicators used to analyze sustainable tourism development is given in [50], based on a meta-analysis of relevant studies published between 2000 and 2015 that proposed sustainable tourism dimensions and indicator themes. The conclusions on key sustainability dimensions were an essential guideline in the process of selecting indicators in this study. Furthermore, special attention was given to the adequacy of the indicators chosen within each component of the DPSR framework and data availability. The indicator list (Table 1) resulted from a comprehensive analysis of available indicators. Before the final analysis, the indicator list was presented and discussed with a panel of experienced sustainable tourism researchers from Ca’ Foscari University of Venice, Italy; The University of the Algarve, School of management, hospitality and tourism, Portugal; University of Split, Faculty of economics, business and tourism, Croatia; CCEIA, Cyprus Center for European and International Affairs, Cyprus; ZRC SAZU, Research Center of Slovenian Academy of Science and Arts, Anton Melik Geographical Institute, Slovenia; Council of European Municipalities and Regions (CEMR), Italy; University of Malaga, Department of Economics and Management, Spain.
The driving forces were analyzed using ten indicators, pressures using six, the state using five and responses using eight. The data for the analysis were retrieved from the World Economic Forum (WEF), Eurostat, ESPON Programme database and TOURMEDASSETS project database. Data for all indicators for 54 MED regions were collected at the level of NUTS 2 for the year 2015 (Table 2). Wherever possible, regional level indicators were used (indicated by the subscript “r”). In other cases, national-level indicators were used. This was especially the case with RESPONSES as they can be created and implemented mostly by national-level policies. To maintain comparability across regions, the country-level indicators retrieved from the WEF were regionalized using NUTS 2 data for the population/area or calculated as a percentage of the totals. In this way, regional weights were constructed and standardized between 0 (the region does not possess the given characteristics) and 1 (the region which has the maximum value for the given characteristic). Finally, each regional and country-level indicator was standardized between 1 (lowest value) and 7 (highest value) while indicators with a negative effect on competitiveness were standardized using a reverse scale. The use of national-level data and their regionalization for the analysis are a limitation of the research as well as an indication of how monitoring sustainability of tourism development could be improved.
As previously elaborated, the EFA was used to reduce the number of indicators and create factors [43] within each component of the DPSR framework. Within each component of the DPSR framework, two factors and their factor scores were generated. The factor scores were used as inputs in the cluster analysis [43,44,45] within each DPSR component.

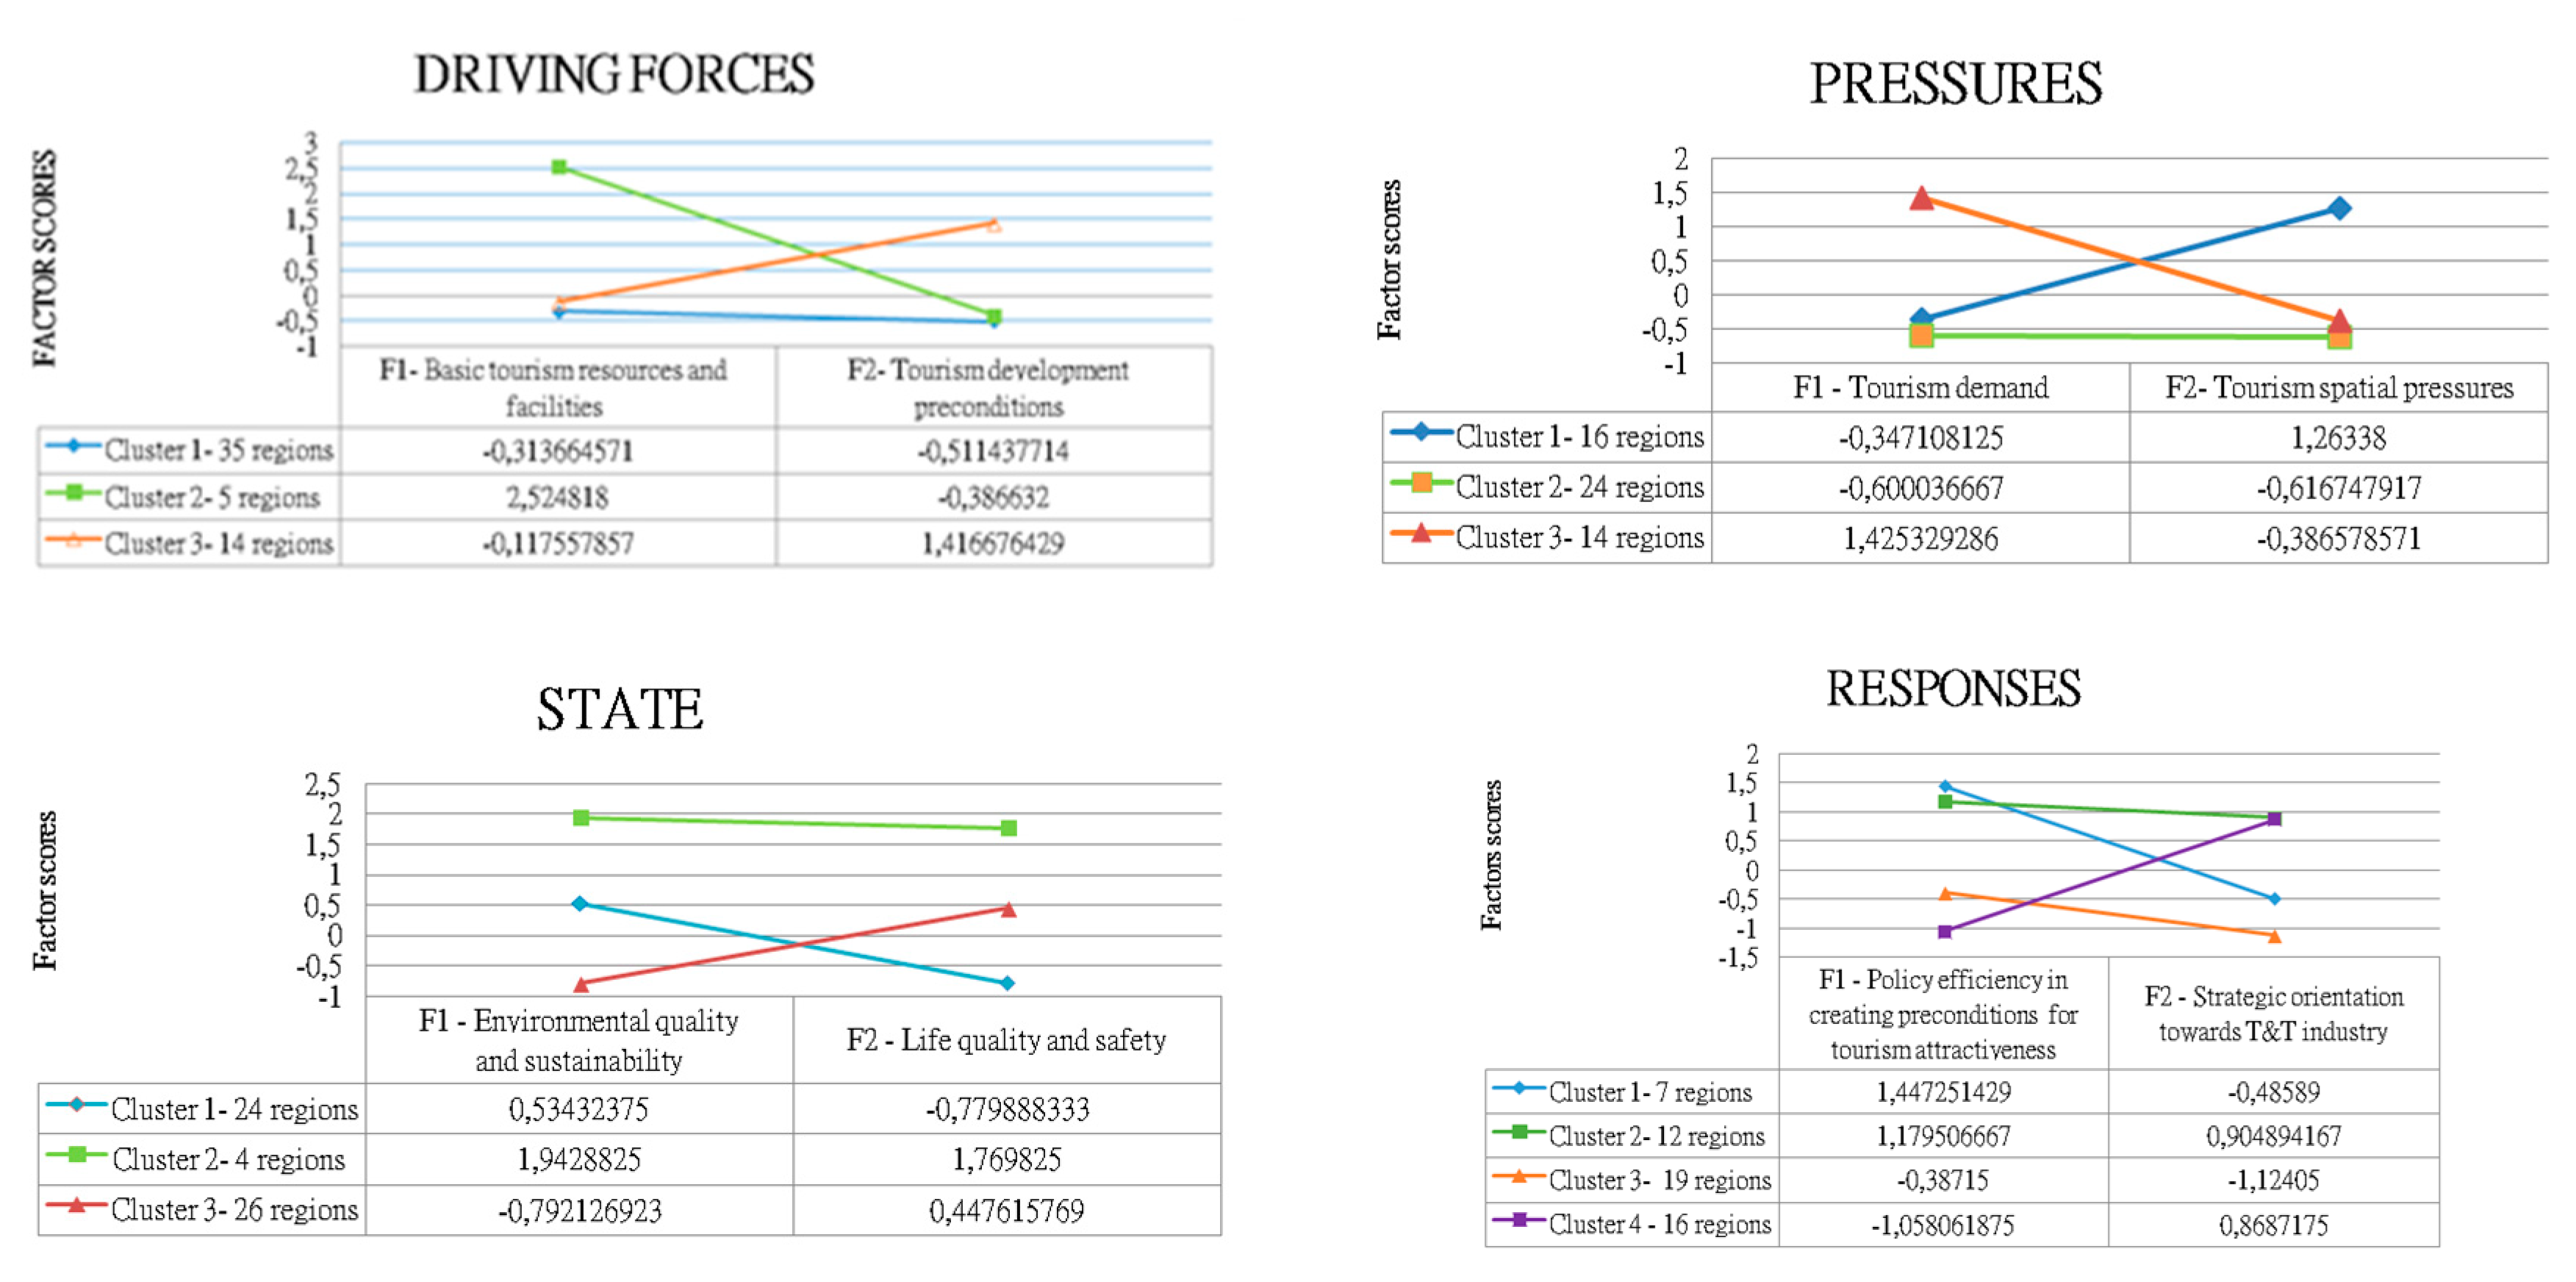
3.3. Factor Analysis

Following the methodological guidelines [43,44], before conducting the EFA for each component of the framework variables (D, P, S, R), the interitem correlation matrix and anti-image correlation matrix were constructed and analyzed. In the correlation matrix, a check for a patterned relationship among variables was performed. Variables with a large number of low correlation coefficients r < ±0.30 were removed as they indicate a lack of patterned relationships. The same applies to correlations above r = ±0.90, which demonstrate the data multicollinearity [51]. As per the anti-image matrix, correlations with measures of sampling adequacy MSA > 0.50, were considered appropriate [44]. Furthermore, in each component, the sample size was appropriate as the number of observations exceeded the 1:5 criteria [43]. For all components, the Kaiser–Meyer–Olkin measure of sampling adequacy [44] and Bartlett’s test of sphericity revealed that data were appropriate for an EFA [52] (Table 3). Thus, all the procedures confirmed that EFA assumptions were met [44].
The Cattell scree test and the “Eigenvalue” criterion were used for determining the number of factors [43]. In each component, two factors were extracted. For the purpose of spreading variability more evenly among factors and enabling the interpretation of the factors [43], the varimax rotation with Kaiser normalization was performed. The factor loading cut-off level of 0.50 was used to determine the items loading to each factor [44]. The resulting percentage of variance explained ranged from 65.31 to 87.01% (Table 4). These values are acceptable [43,44,53] and above the average of variance explained in other studies and metastudies [54,55]. Furthermore, less than 50% of the nonredundant residuals with absolute values were higher than 0.05 [44,51] confirming the solutions’ goodness of fit. This was further validated comparing the reproduced correlation matrix with the original correlation coefficients matrix, revealing small residuals between two [51] in all four components.
The EFA extraction results suggest (Figure 2) that the “Basic tourism resources and facilities” and “Tourism development preconditions” are the driving forces resulting in “Tourist demand” and “Tourism spatial pressures”. These are the causes of “Environment quality and sustainability” as well as “Life quality and safety”, which are in turn the basis for the “Policy efficacy in creating preconditions for tourism attractiveness” and “Strategic orientation towards T&T industry”. The factors extracted are fundamentally rooted in the general tourism development trajectory framework as they highlight the critical tourism development causes and consequences and their mutual interrelations, which support the theoretical as well as the practical validity of the proposed model. This is especially the case for components that “close” the framework circle–responses and driving forces. The fit among them reveals the logic in the economic reality that the policy responses (“Policy efficacy in creating preconditions for tourism attractiveness” and “Strategic orientation towards T&T industry”) determine the essential tourism resources and facilities development as well as other tourism development preconditions.

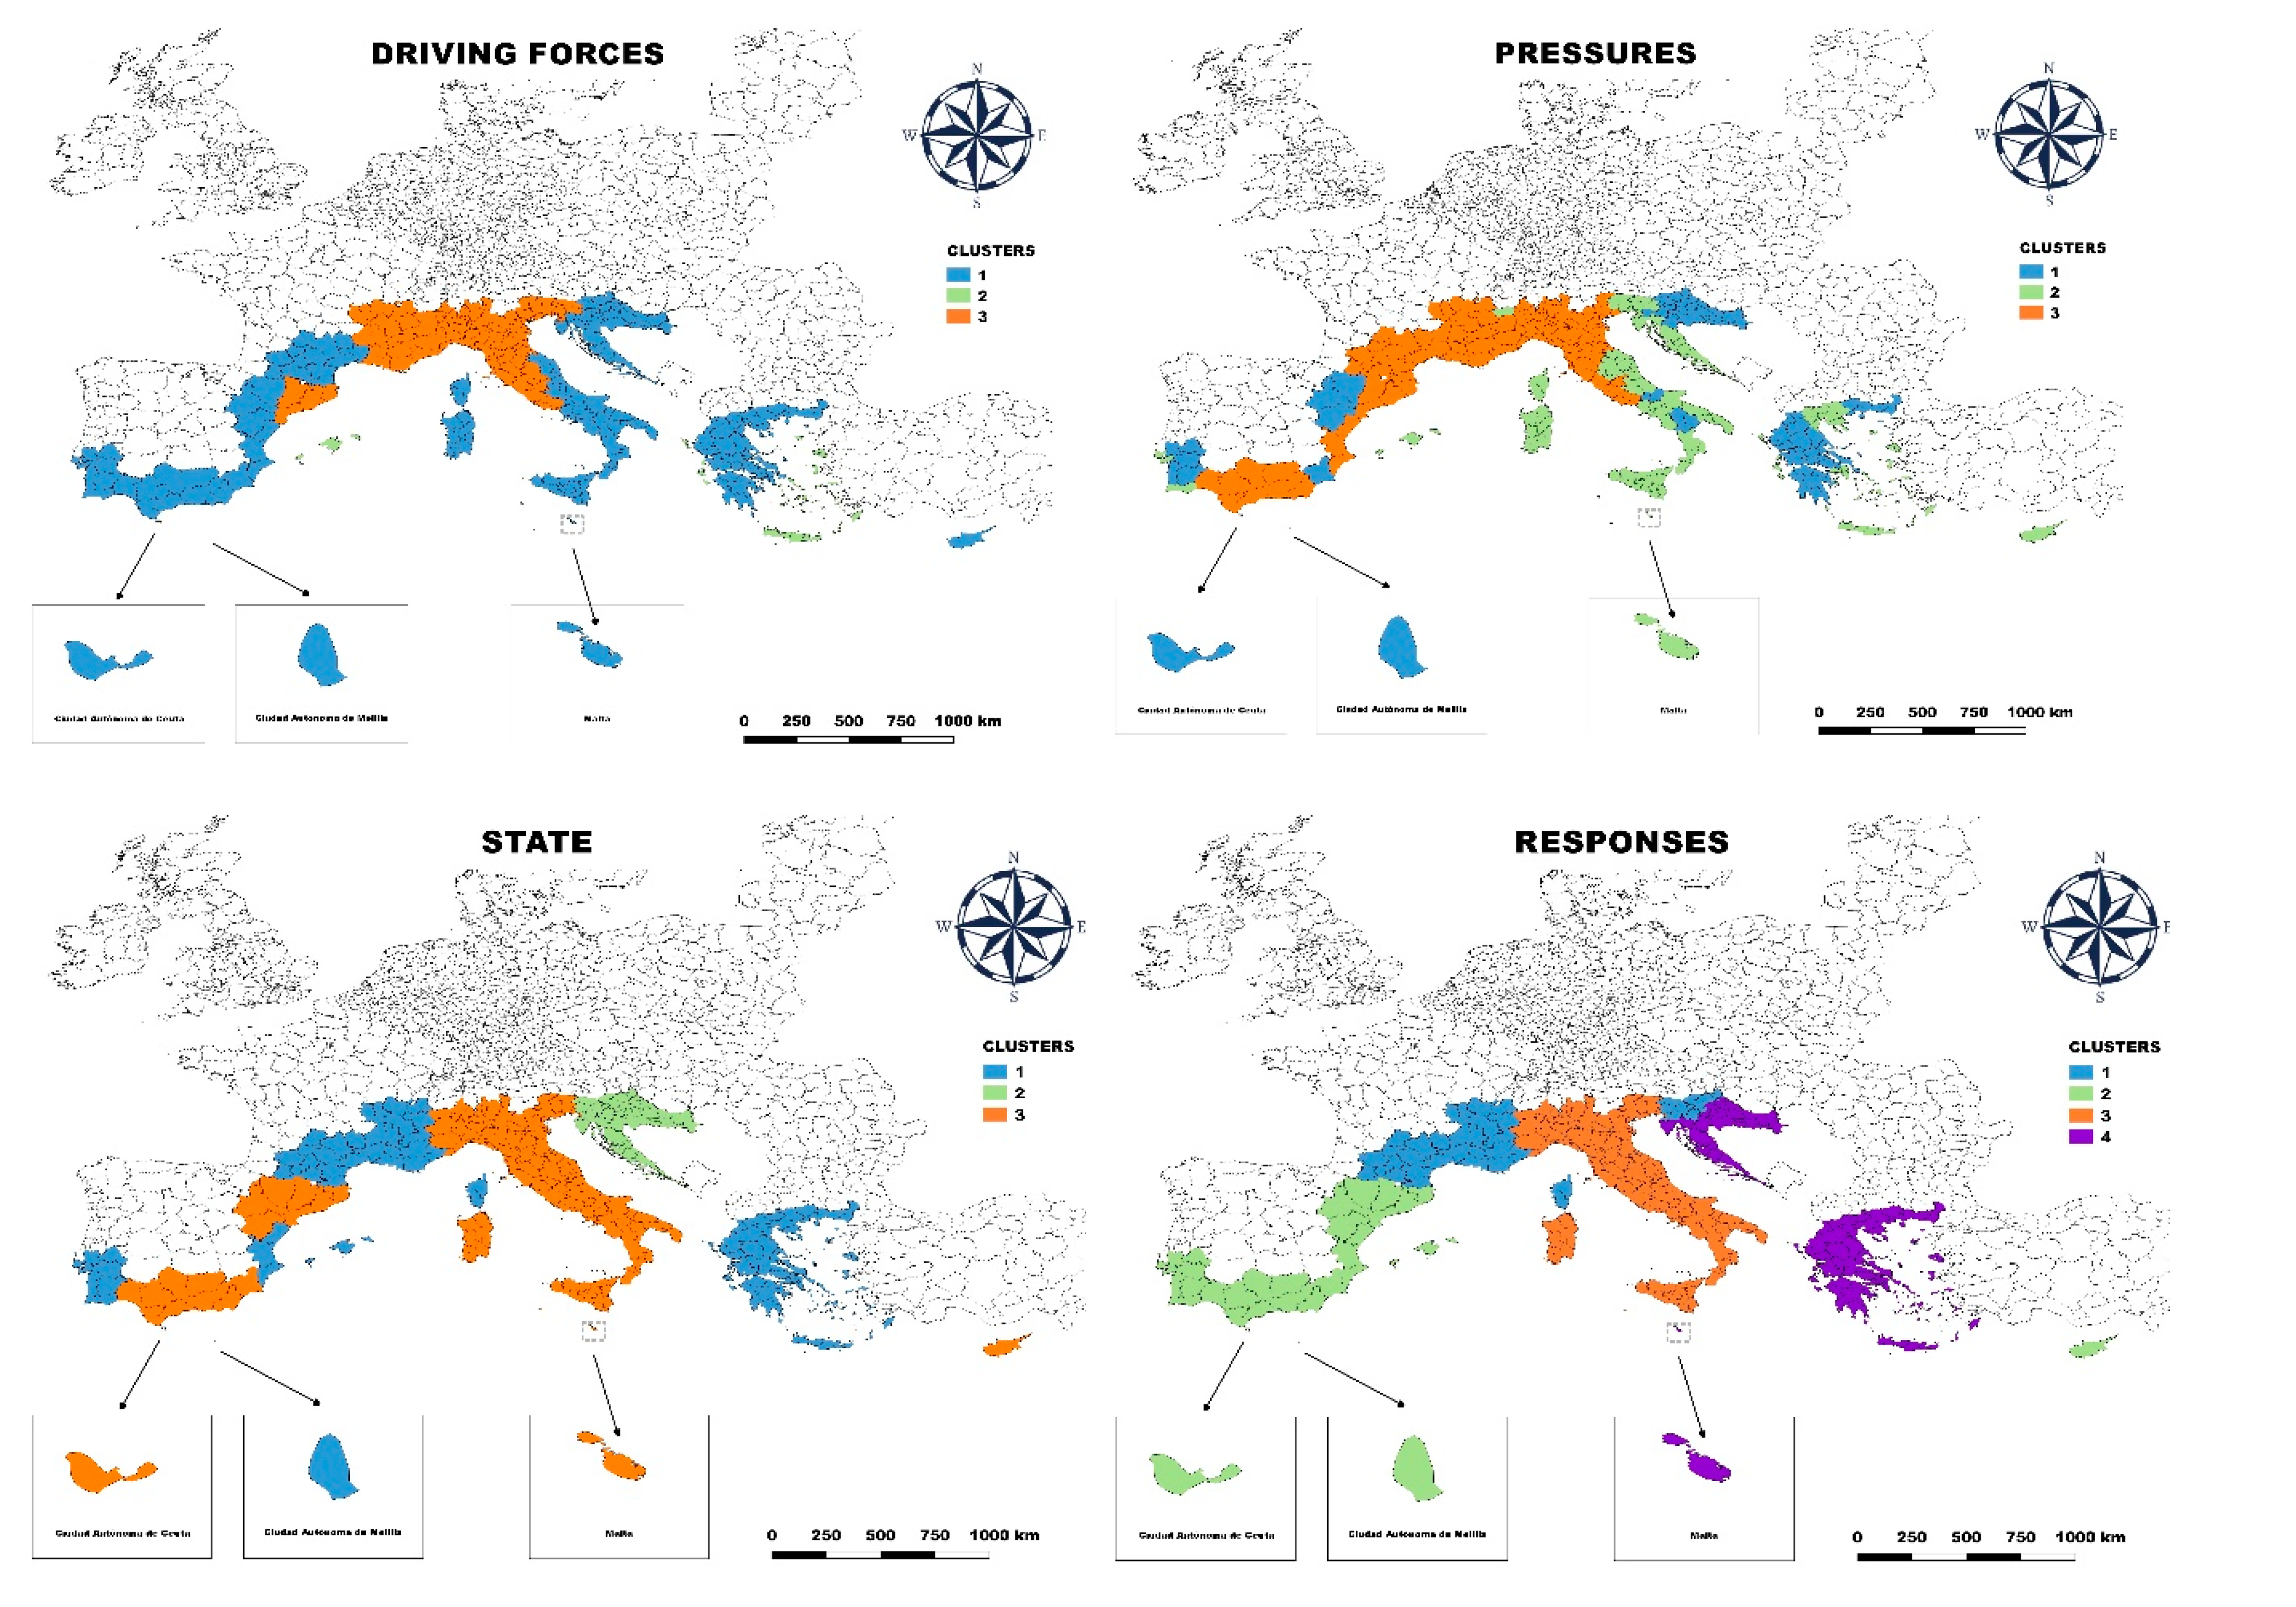
3.4. MED Regions Cluster Maps (MRCMs)

To classify MED regions into homogenous groups and generate an MRCM, we have applied a CA on factor scores for each factor generated [44]. Factor scores represent the degree to which a particular region exhibits the characteristics of a specific factor [44]. More precisely, they represent the degree to which each region scores high on the group of items with high loadings on a factor [43]. Prior to the analysis, factor scores were standardized to have a mean of 0 and standard deviation of 1. Comparing the factor scores with each cluster’s mean [45], a competitive position of each cluster was determined.
Hierarchical agglomerative clustering using the Ward method was applied. The decision on the number of clusters was made based on the dendrograms produced [43]. The CA produced three clusters of regions for the driving forces, pressures and state components and four clusters for responses (Figure 2). The generated cluster solutions were confirmed by a one-way ANOVA for all factors within all four components (p = 0.000) (Table 5).
Within the driving forces, Cluster 1, consisting of 35 regions (Cyprus, Comunidad Valenciana Aragón, Andalucía, Ciudad Autónoma de Melilla, Ciudad Autónoma de Ceuta, Región de Murcia, Languedoc-Roussillon, Corse, Midi-Pyrénées, Attiki Thessalia, Ipeiros, Kentriki Makedonia, Sterea Ellada, Peloponnisos, Atoliki Makedonia, Thraki, Dytiki Ellada, Dytiki Makedonia, Jadranska Hrvatska, Kontinentalna Hrvatska, Campania, Marche, Sardegna, Sicilia, Abruzzo, Molise, Puglia, Calabria, Basilicata, Malta, Área Metropolitana de Lisboa, Algarve, Alentejo, Vzhodna Slovenija), shows a somewhat weaker (negative) relationship with both factor 1 and factor 2 compared to other clusters (Figure 3), meaning that these regions perform weaker in terms of these two factors than the regions in other clusters. The most pronounced level of development of basic tourism resources and facilities (F1) is found in cluster 2 consisting of five EU NUTS 2 regions (Spanish Illes Balears, and Greek regions Notio Aiagaio, Kriti, Ionia Nisia, and Voreio Aiagaio). These regions, situated on islands, are highly dependent on tourism and due to their location, are sparsely populated. As a result, they score the highest in comparison to other regions. Simultaneously, this cluster has a weaker (negative) relationship with the second factor—tourism development preconditions (F2)—as a result of their isolated location (accessibility) and lower GDP per capita. Cluster 3, consisting of the 14 EU NUTS 2 regions (Cataluna, Provence-Alpes Côte d’Azur, Rhone-Alpes, Veneto, Lazio, Toscana, Emiliga-Romagna, Lombardia, Liguria, Piemonte, Umbria, Friuli-Venezia-Giulia, Valle d’Aosta, Zahodna Slovenija), has a positive and relatively intense relationship with factor 2 (F2—tourism development preconditions). As these regions belong to highly developed countries in terms of both general and tourism development and are among the most abundant regions in the world in terms of the number of important and protected monuments and sites, such a result is expected. However, they show a slightly weaker (negative) relationship with factor 1 (basic tourism resources and facilities). The reasons behind this are two-fold: (1) a high population density resulting in lower indicators in relative terms (such as number of beds in hotels and similar establishments per inhabitant and share of employment in wholesale, retail, hotel and restaurants) and (2) economic activity not being exclusively oriented to tourism.
In the pressures component, cluster 1, consisting of 16 regions (Ipeiros, Sterea Ellada, Peloponnisos, Anatoliki Makedonia, Thraki, Dytiki Ellada, Dytiki Makedonia Aragón, Ciudad Autónoma de Melilla, Ciudad Autónoma de Ceuta, Región de Murcia, Thessalia, Kontinentalna Hrvatska, Molise, Basilicata, Alentejo, Vzhodna Slovenija), is characterized by a slightly negative (weak) relationship with the factor 1 tourism demand (Graph 1). In other words, the tourism demand indicators presented in absolute numbers are weaker in this cluster than in others. As some of the regions within this cluster are in continental areas, it is not surprising that the tourism demand is not as intense as in coastal destinations. Furthermore, two out of three indicators for tourism of demand (factor 1) refer to domestic tourists’ arrivals in hotels and other establishments while in most Mediterranean regions, domestic tourism is not as intense as international tourism. On the other hand, cluster 1 shows a positive and moderately intense relationship with factor 2—tourism spatial pressures. This factor represents the density of tourists in a region, i.e., the higher the factor score, the bigger the tourism pressure on the space. Thus, the results indicate that these regions are spatially more saturated by tourism than other MED regions. Cluster 2, consisting of 24 regions (Cyprus, Illes Balears, Corse, Notio Aigaio, Kriti, Attiki, Ionia Nisia, Voreio Aigaio, Kentriki Makedonia, Jadranska Hrvatska, Umbria, Friuil-Venezia Giulia, Campania, Valle d’Aosta/Valléed’Aoste, Marche, Sardegna, Sicilia, Abruzzo, Puglia, Calabria, Malta, Área Metropolitana de Lisboa, Algarve, Zahodna Slovenija), shows a moderately negative relationship with both factor 1 and factor 2. This means that, compared to other clusters, the tourism demand and the resulting spatial pressures are less intense. Cluster 3, consisting of 14 regions (Cataluña, Comunidad Valenciana, Andalucía, Provence-Alpes-Côte d’Azur, Rhône-Alpes, Languedoc-Roussillon, Midi-Pyrénées, Veneto, Lazio, Toscana, Emilia-Romagna, Lombardia, Liguria, Piemonte), shows a positive relationship with factor 1 and a moderately negative relationship with factor 2, indicating relatively lower spatial pressures. As a substantial number of visitors visit regions within this cluster, the lower spatial saturation can be attributed to the surface and population density included in the composite indicator (zB9_03r).
Within the state component, cluster 1, consisting of 24 regions (Illes Balears, Comunidad Valenciana, Ciudad Autónoma de Melilla, Ciudad Autónoma de Melilla, Provence-Alpes-Côte d’Azur, Rhône-Alpes, Languedoc-Roussillon, Corse, Midi-Pyrénées, Notio Aigaio, Kriti, Attiki, Ionia Nisia, Voreio Aigaio, Thessalia, Ipeiros, Kentriki Makedonia, Sterea Ellada, Peloponnisos, Anatoliki Makedonia, Thraki, Dytiki Ellada, Área Metropolitana de Lisboa, Algarve, Alentejo), shows a moderately positive relationship with factor 1—environmental quality and sustainability and slightly negative correlation with the factor 2—life quality and safety (Figure 3). Although these two findings seem to be contradictory, a closer look at the indicators explains this result. Namely, factor 1 indicators relate to either the subjective perception of environmental quality by expert groups or to the officially declared areas of protection which additionally contributes to a region’s attractiveness. As per factor 2, after a certain point, the growing number of tourists in a destination starts to diminish the quality of life and safety in a destination. Cluster 2, consisting of four regions (Jadranska Hrvatska, Kontinentalna Hrvatska, Zahodna Slovenija, Vzhodna Slovenija), shows a positive and intense relationship with both factor 1 and factor 2. These four regions are not very densely populated and are abundant with high-quality environmental resources. Furthermore, they are recognized as very safe destinations and the most pleasant to live in. Cluster 3, consisting of 26 regions (Cyprus, Cataluña, Aragon, Andalucia, Ciudad Autónoma de Ceuta, Región de Murcia, Veneto, Lazio, Toscana, Emiligia Romagna, Lombardia, Liguria, Piemonte, Umbria, Friuli-Venezia Giulia, Campania, Valle d’Aosta/Vallée d’Aoste, Marche, Sardegna, Sicilia, Abruzzo, Molise, Puglia, Calabria, Basilicata, Malta), shows a slightly negative relationship with factor 1 and moderately positive correlation with factor 2. In the first case, a massive number of tourists in most of the regions belonging to this cluster endanger the quality and sustainability of undoubtedly attractive natural resources and sites. At the same time, the quality of life and security seems to be more appealing here than in other regions (which is also an essential motivation for tourists to visit them).
Within the responses component, four clusters have been identified. Cluster 1, consisting of seven regions (Provence-Alpes-Côte d’Azur, Rhône-Alpes, Languedoc-Roussillon, Corse, Midi-Pyrénées, Zahodna Slovenija, Vzhodna Slovenija), is characterized by a relatively intense positive relationship with factor 1—policy efficacy in creating preconditions for tourism attractiveness (Graph 1), meaning that relevant policy measures are successful in improving the attractiveness of these regions. It also shows a slightly negative relationship with factor 2—strategic orientation towards the Travel & Tourism (T&T) industry, indicating that either national level policy of the countries these regions belong to does not take tourism as a strategic orientation or the regions concerned do not accept this orientation as the dominant one. Cluster 2, consisting of 12 regions (Cyprus, Cataluña, Illes Balears, Comunidad Valenciana, Aragón, Andalucía, Ciudad Autónoma de Melilla, Ciudad Autónoma de Ceuta, Región de Murcia, Área Metropolitana de Lisboa Algarve, Alentejo), is characterized by a positive, moderate relationship with both factor 1 and factor 2. These are mostly regions belonging to Portugal, Spain and Cyprus. They are oriented toward tourism as a strategic activity, and their national policies successfully help them enhance their attractiveness through efficient strategies and policies. Cluster 3, consisting of 19 regions (Veneto, Lazio, Toscana, Emilia-Romagna, Lombardia, Liguria, Piemonte, Umbria, Friuli-Venezia Giulia, Campania, Valle d’Aosta/Vallée d’Aoste, Marche, Sardegna, Sicilia, Abruzzo, Molise, Puglia, Calabria, Basilicata), shows a slightly negative relationship with factor 1 and an even more negative one with factor 2. This means that these regions neither stress tourism as a strategic orientation nor put much effort into creating preconditions to enhance their attractiveness. Cluster 4, consisting of 16 regions (Notio Aigaio, Kriti, Attiki, Ionia Nisia, Voreio Aigaio, Thessalia, Ipeiros, Kentriki Makedonia, Sterea Ellada, Peloponnisos, Anatoliki Makedonia, Thraki, Dytiki Ellada, Dytiki Makedonia, Jadranska Hrvatska, Kontinentalna Hrvatska, Malta), is characterized by a moderately negative relationship with factor 1, and a moderately positive correlation with factor 2. Thus, these regions, although oriented towards tourism as a strategic industry, are less efficient in policy measures aiming at tourism attractiveness enhancements. Comparing these results with the T&T competitiveness report [56] for these countries, it is clear that all three are highly leaning on tourism. Thus, Malta, being the 36th in the overall global rank, scored 6.2/7 points for its prioritization of T&T, Greece as 24th scored 5.5 and Croatia as 32nd scored 4.5. Simultaneously, they scored lower on the sustainability dimension, i.e., on average 4.5 points for environmental sustainability, 3.9 points for natural resource quality and 2.5 for cultural resource quality, which indicates inefficient policies in preserving resources and, consequently, a negative impact on the overall competitiveness.

4. Conclusions

The objective of the study is the analysis of interregional similarities and differences in sustainable tourism development in the MED area using the indicator system developed within the adjusted DPSIR framework. The goal was to create an appropriate set of indicators as the basis for the Decision Support System (DSS) that can help identify adequate and possibly universal policies and measures for tourism development in the regions studied. We used an EFA to extract two underlying factors within each of the four DPSR components. The fundamental driving forces affecting sustainable tourism development in the MED region are, as anticipated, primary tourism resources and facilities coupled with the tourism development preconditions in terms of overall economic and infrastructural development. A high number of tourists in the area, resulting in excessive use of infrastructure and local resources, induces the pressures. Both ultimately affect the state of the environment and the local population’s quality of life. As a result, the public sector responds with diverse regulations to preserve/achieve tourism attractiveness, reflecting on its strategic orientation towards tourism development.
The structure of the factors extracted proves the validity of the proposed theoretical model and the interrelations among the four framework components. The findings of our analysis support the conclusion that policy responses are grouped into two factors—“Policy efficacy in creating preconditions for tourism attractiveness” and “Strategic orientation towards T&T industry”—and determined that the tourism driving forces consist of “Basic tourism resources and facilities” and “Tourism development preconditions”.
The study has two major contributions. Firstly, it develops a new application of the DPSIR framework in tourism sustainability based on the original system of indicators. Secondly, the indicator system developed was used to analyze the similarities and heterogeneities among Mediterranian NUTS 2 regions by developing an MRCM. This analysis aimed to investigate the adequacy and potential of setting joint and/or universal policies addressing tourism sustainability. The relevance of the study stems from the fact that the coordination of sustainable tourism activities is an ongoing challenge in the EU and its member states, especially in the most visited world region, the Mediterranean, which was the object of the empirical study.
Besides the validation of the theoretical model, the analysis conducted brings forth two crucial and practical policy-relevant findings. First, we concluded that generating universal policies for similar regions is a complex and hard-to-deliver task. Namely, the analysis based on DPRS components revealed that homogeneity is scattered within the four DPSR model components. In other words, different regions are grouped as homogenous within the four model components. This indicates that different strategies are appropriate for different regions within the four DPSR components and that formulating universal, regional tourism policies that cover various aspects of the DPSR framework would not be effective. The analysis suggests that mutual regional tourism policies would better be suited based on similarities within each of the DPSR components, i.e., regions homogenous within each of the four DPSR components can strive to similar policies and strategies in respective sustainability aspect. However, within other DPSR components, the similarities and consequently common policy-related activities are to be looked for and possibly harmonized with other regions. An exception to this is found for seven Italian regions (Veneto, Lazio, Toscana, Emiglia-Romagna, Lombardia, Liguria and Piemonte), the only ones falling within the same cluster in all the four DPSR components. Thus, these regions can pursue similar tourism policies aiming at all DPSR components. These homogenous regions in Italy are further proof of the second crucial finding of the study—that universal country-level tourism policies are not an optimal solution. Namely, the regional differences in all four DPSR components are very pronounced in the MED area, i.e., 54 EU NUTS 2 regions belonging to nine countries differ significantly in terms of tourism development, among countries but within the same countries as well. This leads to an important conclusion that, even if brought from the macro governance level, the outcomes of different tourism-related policies are always site-specific.
This study, as any other, has its limitations. The first is the choice of indicators. The indicator selection is always heavily determined by data availability, and in this study, was limited by the scope of secondary source indicators at a regional level. In the cases where crucial data were not available at the regional level, national data were regionalized and included—this is the second major study limitation. The third one is the analysis was conducted for one year, imposing limits to the generalization of results.
These limitations are useful for pinpointing the remaining research gaps and possible future research tracks. Thus, an analysis of wider timespan is recommended to validate the results as well as model refinement by additional, regional data. The choice of adequate indicators is the most substantial yet crucial challenge in the analysis of sustainable tourism development. The quest for the relevant indicators is a continuous one. It aims to produce a list of generally useful and useable indicators for evaluating tourism impacts and policies. Developing such a database as a core of regional decision support systems could significantly improve a much-required governance efficiency. Furthermore, future studies should conduct the DPSR analysis on a narrower territory with more similarities—for example, regions within the same country or territories (counties, cities, municipalities) within a region. This, again, is determined by the data availability. Finally, we suggest that future studies focus on the analysis of the relationships among the four components of the DPSR framework in tourism development setting using multivariate data techniques, preferably on more significant samples (for example, the whole EU or the whole of Europe). As DPSR is a conceptual framework primarily used for environmentally related threat-solution analyses, a multivariate model validation would further confirm the framework usefulness in a tourism context. In practical terms, such an investigation could reveal the strongest (and the weakest) links among the DPSR components, and, consequently, the priorities of tourism policies.

Author Contributions

Conceptualization, S.P, L.P. and A.M., methodology, S.P. and A.M., software, A.M., validation, S.P., L.P. and A.M., formal analysis, S.P., L.P. and A.M.; investigation, S.P., resources, A.M.; data curation, A.M., writing—original draft preparation, S.P. and L.P.; writing—review and editing, A.M; visualization, A.M., supervision, S.P., project administration, S.P.; funding acquisition, L.P. and S.P. All authors have read and agreed to the published version of the manuscript.

Funding

This research was funded by European Regional Development Fund, INTERREG MED 2014-2020, Shape Tourism project. The APC was funded by the Faculty of Economics, Business and Tourism, Split.

Conflicts of Interest

The authors are not aware of any affiliations, memberships, funding, or financial holdings that might be perceived as affecting the objectivity of this research and declare no conflicts of interest.

References

  1. McCool, S.F. Sustainable tourism in an emerging world of complexity and turbulence. In Reframing Sustainable Tourism; McCool, S.F., Bosak, K., Eds.; Springer: Dordrecht, The Netherlands, 2015; pp. 3–11. [Google Scholar]
  2. Torres-Delgado, A.; Palomeque, F.L. Measuring sustainable tourism at the municipal level. Ann. Tour. Res. 2014, 49, 122–137. [Google Scholar] [CrossRef]
  3. United Nations Environmental Programme (UNEP); World Tourism Organization (UNWTO). Making Tourism more Sustainable—A Guide for Policy Makers; UNEP: Pari, France; UNWTO: Madrid, Spain, 2005. [Google Scholar]
  4. McCool, S.F. The Changing Meanings of Sustainable Tourism. In Reframing Sustainable Tourism; McCool, S.F., Bosak, K., Eds.; Springer: London, UK, 2016; pp. 13–31. [Google Scholar]
  5. Hall, D.; Gössling, C.M.; Scott, S. (Eds.) The Routledge Handbook of Tourism and Sustainability; Routledge: New York, NY, USA, 2015. [Google Scholar]
  6. Hall, C.M. A typology of governance and its implications for tourism policy analysis. J. Sustain. Tour. 2011, 19, 37–41. [Google Scholar] [CrossRef]
  7. Chapin, F.S.; Folke, C.; Kofinas, G.P. (Eds.) Principles of Ecosystem Stewardship: Resilience—Based Natural Resource Management in a Changing World; Springer: London, UK, 2009. [Google Scholar]
  8. Fernández, J.I.P.; Rivero, M.S. Clustering tourism destinations by means of composite indices of sustainability. In Economics of Sustainable Tourism; Routledge: Oxon, UK, 2011; pp. 129–150. [Google Scholar]
  9. Communication from the Commission to the European Parliament, the Council, the European Economic and Social Committee and the Committee of the Regions: Europe, the world’s No 1 tourist destination—A new political framework for tourism in Europe. Available online: https://ec.europa.eu/growth/content/commission-communication-2010-europe-worlds-no-1-tourist-destination-new-political-0_en (accessed on 2 July 2010).
  10. Estol, J.; Font, X. European tourism policy: Its evolution and structure. Tour. Manag. 2016, 52, 230–241. [Google Scholar] [CrossRef]
  11. Milano, C.; Novelli, M.; Cheer, J.M. Overtourism and degrowth: A social movements perspective. J. Sustain. Tour. 2019, 27, 1857–1875. [Google Scholar] [CrossRef]
  12. United Nations World Tourism Organization (UNWTO), Centre of Expertise Leisure, Tourism & Hospitality; NHTV Breda University of Applied Sciences; NHL Stenden University of Applied Sciences. ‘Overtourism’?—Understanding and Managing Urban Tourism Growth beyond Perceptions; Executive Summary; UNWTO: Madrid, Spain, 2018. [Google Scholar] [CrossRef]
  13. Ceron, J.P.; Dubois, G. Tourism and sustainable development indicators: The gap between theoretical demands and practical achievements. Curr. Issues Tour. 2003, 6, 54–75. [Google Scholar] [CrossRef]
  14. United Nations. Indicators of Sustainable Development: Guidelines and Methodologies; United Nations: New York, NY, USA, 2007. [Google Scholar]
  15. United Nations World Tourism Organization (UNWTO). Pilot Study on Indicators for the Sustainable Management of Tourism: Villa Gesell and Peninsula Valdes; Secretaria de Turismo Argentina and Madrid: Buenos Aires, Argentina, 1995. [Google Scholar]
  16. United Nations World Tourism Organization (UNWTO). Indicators of Sustainable Development for Tourism Destinations: A Guidebook; UNWTO: Madrid, Spain, 2004. [Google Scholar]
  17. Miller, G.; Twining-Ward, L. (Eds.) Monitoring for a Sustainable Tourism Transition: The Challenge of Developing and Using Indicators; CABI Publishing: Oxfordshire, UK, 2005. [Google Scholar]
  18. McCool, S.F.; Moisey, R.N.; Nickerson, N.P. What should tourism sustain? The disconnect with industry perceptions of useful indicators. J. Travel Res. 2001, 40, 124–131. [Google Scholar] [CrossRef]
  19. Blancas, F.J.; Lozano-Oyola, M.; González, M.; Guerrero, F.M.; Caballero, R. How to use sustainability indicators for tourism planning: The case of rural tourism in Andalusia (Spain). Sci. Total Environ. 2011, 412–413, 28–45. [Google Scholar] [CrossRef]
  20. Miller, G. The development of indicators for sustainable tourism: Results of a Delphi survey of tourism researchers. Tour. Manag. 2001, 22, 351–362. [Google Scholar] [CrossRef] [Green Version]
  21. Pérez, V.; Guerrero, F.; González, M.; Pérez, F.; Caballero, R. Composite indicator for the assessment of sustainability: The case of Cuban nature-based tourism destinations. Ecol. Indic. 2013, 29, 316–324. [Google Scholar] [CrossRef]
  22. Twining-Ward, L.; Butler, R. Implementing std on a small island: Development and use of sustainable tourism development indicators in samoa. J. Sustain. Tour. 2002, 10, 363–387. [Google Scholar] [CrossRef]
  23. Carr, E.R.; Wingard, P.M.; Yorty, S.C.; Thompson, M.C.; Jensen, N.K.; Roberson, J. Applying DPSIR to sustainable development. Int. J. Sustain. Dev. World Ecol. 2007, 14, 543–555. [Google Scholar] [CrossRef]
  24. Giupponi, C. From the DPSIR Reporting Framework to a System for a Dynamic and Integrated Decision Making Process. In Proceedings of the European policy and tools for sustainable water management, Venice, Italy, 21–23 November 2002. [Google Scholar]
  25. Bowen, R.E.; Riley, C. Socio-economic indicators and integrated coastal management. Ocean Coast. Manag. 2003, 46, 299–312. [Google Scholar] [CrossRef]
  26. United Nations Division for Sustainable Development (UNDSD). From Theory to Practice: Indicator for Sustainable Development; United Nations: New York, NY, USA, 1997. [Google Scholar]
  27. Atkins, J.P.; Burdon, D.; Elliott, M.; Gregory, A.J. Management of the marine environment: Integrating ecosystem services and societal benefits with the DPSIR framework in a systems approach. Mar. Pollut. Bull. 2011, 62, 215–226. [Google Scholar] [CrossRef] [PubMed]
  28. Kristensen, P. The DPSIR framework. In Proceedings of the Comprehensive/Detailed Assessment of the Vulnerability of Water Resources to Environmental Change in Africa Using River Basin Approach, Nairobi, Kenya, 27–29 September 2004; pp. 1–10. [Google Scholar]
  29. Haberl, H.; Gaube, V.; Díaz-Delgado, R.; Krauze, K.; Neuner, A.; Peterseil, J.; Plutzar, C.; Singh, S.J.; Vadineanu, A. Towards an integrated model of socioeconomic biodiversity drivers, pressures and impacts. A feasibility study based on three European long-term socio-ecological research platforms. Ecol. Econ. 2009, 68, 1797–1812. [Google Scholar] [CrossRef] [Green Version]
  30. Koundouri, P.; Rault, P.K.; Pergamalis, V.; Skianis, V.; Souliotis, I. Development of an integrated methodology for the sustainable environmental and socio-economic management of river ecosystems. Sci. Total Environ. 2016, 540, 90–100. [Google Scholar] [CrossRef] [Green Version]
  31. Bidone, E.D.; Lacerda, L.D. The use of DPSIR framework to evaluate sustainability in coastal areas. Case study: Guanabara Bay basin, Rio de Janeiro, Brazil. Reg. Environ. Chang. 2004, 4, 5–16. [Google Scholar] [CrossRef]
  32. Odermatt, S. Evaluation of Mountain Case Studies by Means of Sustainability Variables. Mt. Res. Dev. 2004, 24, 336–341. [Google Scholar] [CrossRef] [Green Version]
  33. Svarstad, H.; Petersen, L.K.; Rothman, D.; Siepel, H.; Wätzold, F. Discursive biases of the environmental research framework DPSIR. Land Use Policy 2008, 25, 116–125. [Google Scholar] [CrossRef]
  34. Mustika, P.L.K.; Welters, R.; Ryan, G.E.; D’Lima, C.; Sorongon-Yap, P.; Jutapruet, S.; Peter, C. A rapid assessment of wildlife tourism risk posed to cetaceans in Asia. J. Sustain. Tour. 2017, 25, 1138–1158. [Google Scholar] [CrossRef]
  35. Mandić, A. Structuring challenges of sustainable tourism development in protected natural areas with driving force–pressure–state–impact–response (DPSIR) framework. Environ. Syst. Decis. 2020, 1–7. [Google Scholar] [CrossRef]
  36. Rebollo, J.F.V.; Baidal, J.A.I. Measuring sustainability in a mass tourist destination: Pressures, Perceptions and policy responses in torrevieja, Spain. J. Sustain. Tour. 2003, 11, 181–203. [Google Scholar] [CrossRef] [Green Version]
  37. Bonzanigo, L.; Giupponi, C.; Balbi, S. Sustainable tourism planning and climate change adaptation in the Alps: A case study of winter tourism in mountain communities in the Dolomites. J. Sustain. Tour. 2016, 24, 637–652. [Google Scholar] [CrossRef]
  38. Klijn, J.A. (Ed.) Driving Forces behind Landscape Transformation in Europe, from a Conceptual Approach to Policy Options; Springer: Dordrecht, The Netherlands, 2004. [Google Scholar]
  39. Ness, B.; Anderberg, S.; Olsson, L. Structuring problems in sustainability science: The multi-level DPSIR framework. Geoforum 2010, 41, 479–488. [Google Scholar] [CrossRef]
  40. Tscherning, K.; Helming, K.; Krippner, B.; Sieber, S.; y Paloma, S.G. Does research applying the DPSIR framework support decision making? Land Use Policy 2012, 29, 102–110. [Google Scholar] [CrossRef]
  41. Karageorgis, A.P.; Kapsimalis, V.; Kontogianni, A.; Skourtos, M.; Turner, K.R.; Salomons, W. Impact of 100-year human interventions on the deltaic coastal zone of the Inner Thermaikos Gulf (Greece): A DPSIR framework analysis. Environ. Manag. 2006, 38, 304–315. [Google Scholar] [CrossRef] [PubMed]
  42. Darvas, Z.; Mazza, J.; Midoes, C. How to Improve European Union Cohesion Policy for the Next Decade; Breugel: Saint-Josse-ten-Noode, Belgium, 2019. [Google Scholar]
  43. Hair, J.F.; Black, W.C.; Babin, B.J.; Anderson, R. Multivariate Data Analysis, 7th ed.; Pearson Prentice Hall: Upper Saddle River, NJ, USA, 2010. [Google Scholar]
  44. Mooi, E.; Sarstedt, M. A Concise Guide to Market Research: The Process, Data and Methods Using IBM SPSS Statistics; Springer: Berlin/Heidelberg, Germany, 2011. [Google Scholar]
  45. Rašić-Bakarić, I. Uncovering Regional Disparities—The Use of Factor and Cluster Analysis. Croat. Econ. Surv. 2007, 9, 11–34. [Google Scholar]
  46. Rasoolimanesh, S.M.; Ramakrishna, S.; Hall, C.M.; Esfandiar, K.; Seyfi, S. A systematic scoping review of sustainable tourism indicators in relation to the sustainable development goals. J. Sustain. Tour. 2020, 1–21. [Google Scholar] [CrossRef]
  47. Blancas, F.J.; Lozano-Oyola, M.; González, M.; Caballero, R. A dynamic sustainable tourism evaluation using multiple benchmarks. J. Clean. Prod. 2018, 174, 1190–1203. [Google Scholar] [CrossRef]
  48. Farinha, F.; Jos, M.; Silva, E.M.J.; Lança, R.; Pinheiro, M.D.; Miguel, C. Selection Process of Sustainable Indicators for the Algarve Region—Observe Project. Sustainability 2019, 11, 444. [Google Scholar] [CrossRef] [Green Version]
  49. Lozano-Oyola, M.; Contreras, I.; Blancas, F.J. An Operational Non-compensatory Composite Indicator: Measuring Sustainable Tourism in Andalusian Urban Destinations. Ecol. Econ. 2019, 159, 1–10. [Google Scholar] [CrossRef]
  50. Agyeiwaah, E.; McKercher, B.; Suntikul, W. Identifying core indicators of sustainable tourism: A path forward? Tour. Manag. Perspect. 2017, 24, 26–33. [Google Scholar] [CrossRef]
  51. Yong, A.G.; Pearce, S. A Beginner’s Guide to Factor Analysis: Focusing on Exploratory Factor Analysis. Tutor. Quant. Methods Psychol. 2013, 9, 79–94. [Google Scholar] [CrossRef]
  52. Norman, G.; Streiner, D. Biostatistics: The Bare Essentials; BC Decker Inc.: Hamilton, ON, Canada, 1994. [Google Scholar]
  53. Merenda, P.F. A guide to the proper use of factor analysis in the conduct and reporting of research: Pitfalls to avoid. Meas. Eval. Couns. Dev. 1997, 30, 156–164. [Google Scholar] [CrossRef]
  54. Tinsley, H.E.A.; Tinsley, D.J. Uses of Factor Analysis in Counseling Psychology Research. J. Couns. Psychol. 1987, 34, 414–424. [Google Scholar] [CrossRef]
  55. Peterson, R.A. A Meta-Analysis of Variance Accounted for and Factor Loadings in Exploratory Factor Analysis. Mark. Lett. 2000, 11, 261–275. [Google Scholar] [CrossRef]
  56. World Economic Forum. The Travel & Tourism Competitiveness Report 2017; World Economic Forum: Geneva, Switzerland, 2017. [Google Scholar]
Figure 1. A visual representation of the Driving force–Pressure–State–Impact–Response framework, adapted from [28].
Sustainability 12 07641 g001
Figure 2. Visual representation of the cluster analysis.
Sustainability 12 07641 g002
Figure 3. Relationships between the factors of driving forces; pressures; state; responses and cluster means.
Sustainability 12 07641 g003
Table 1. The list of indicators.
CodeIndicatorSource of Data
DRIVING FORCES
B8rPrice competitivenessWEF, own calculation
C10rAir transport infrastructureWEF, own calculation
C11rGround and port infrastructureWEF, own calculation
C12_01rThe capacity of collective tourist accommodationEurostat
D14_03rSport and leisure facilitiesESPON Database
GdpipoGDP per inhabitant PPSTOURMEDASSETS database
AN2_05ipoMonuments and other tourist sightsTOURMEDASSETS database
AN2_15ipoNumber of beds in hotels and similar establishments per inhabitantTOURMEDASSETS database
AN2_23ipoAccessibilityTOURMEDASSETS database
EH2_44ipoShare of employment in wholesale, retail, hotel and restaurantsTOURMEDASSETS database
PRESSURES
arr_nripoArrivals in hotels and similar establishments: nonresidentsTOURMEDASSETS database
arr_ripoArrivals in hotels and similar establishments: residentsTOURMEDASSETS database
arr_r2ipoArrivals in other establishments: residentsTOURMEDASSETS database
MM2_64ipoAirport rankTOURMEDASSETS database
B9_03rArrivals of tourists/km2, Nights spent/km2, Arrivals of tourists/1000 people, Nights spent/1000 peopleEurostat
D14_04rNumber of congresses held in the regionESPON Database
STATE
A2rSafety and securityWEF, own calculation
D13_05Quality of the natural environmentWEF, own calculation
D13_05rQuality of preservation of natural landscape based on Natura 2000 sitesESPON Database
SC2_02ipoSatisfied residentsTOURMEDASSETS
B9_03Sustainability of travel and tourism industry developmentTOURMEDASSETS
RESPONSES
B6_01Government prioritization of the travel and tourism industry WEF, own calculation
B6_02T&T government expenditureWEF, own calculation
B6_03Effectiveness of marketing and branding to attract touristsWEF, own calculation
B6_04The comprehensiveness of annual T&T danaWEF, own calculation
B6_05Timeliness of providing monthly/quarterly T&T danaWEF, own calculation
B6_06Country brand strategy ratingWEF, own calculation
B9_01rThe coverage rate of municipal waste collection by NUTS 2 regions Eurostat (Data were not available for GR and CY, MED area average was used)
B9_02Enforcement of environmental regulationsWEF, own calculation
Table 2. NUTS 2 Mediterranean (MED) regions included in the research.
CODECountryNUTS 2Name of the Region CODECountryNUTS 2Name of the Region
1.CYCyprusCY00Cyprus28.HRCroatiaHR03Jadranska Hrvatska
2.ESSpainES51Cataluña29.HRCroatiaHR04Kontinentalna Hrvatska
3.ESSpainES53Illes Balears30.ITItalyITH3Veneto
4.ESSpainES52Comunidad Valenciana31ITItalyITI4Lazio
5.ESSpainES24Aragón32.ITItalyITI1Toscana
6.ESSpainES61Andalucía33.ITItalyITH5Emilia-Romagna
7.ESSpainES64Ciudad Autónoma de Melilla34.ITItalyITC4Lombardia
8.ESSpainES63Ciudad Autónoma de Ceuta35.ITItalyITC3Liguria
9.ESSpainES62Región de Murcia36.ITItalyITC1Piemonte
10.FRFranceFR82Provence-Alpes-Côte d’Azur37.ITItalyITI2Umbria
11.FRFranceFR71Rhône-Alpes38.ITItalyITH4Friuli-Venezia Giulia
12.FRFranceFR81Languedoc-Roussillon39.ITItalyITF3Campania
13.FRFranceFR83Corse40.ITItalyITC2Valle d’Aosta/Vallée d’Aoste
14.FRFranceFR62Midi-Pyrénées41.ITItalyITI3Marche
15.GRGreeceEL42Notio Aigaio42.ITItalyITG2Sardegna
16.GRGreeceEL43Kriti43.ITItalyITG1Sicilia
17.GRGreeceEL30Attiki44.ITItalyITF1Abruzzo
18.GRGreeceEL62Ionia Nisia45.ITItalyITF2Molise
19.GRGreeceEL41Voreio Aigaio46.ITItalyITF4Puglia
20.GRGreeceEL61Thessalia47.ITItalyITF6Calabria
21.GRGreeceEL54Ipeiros48.ITItalyITF5Basilicata
22.GRGreeceEL52Kentriki Makedonia49.MTMaltaMT00Malta
23.GRGreeceEL64Sterea Ellada50.PTPortugalPT17Área Metropolitana de Lisboa
24.GRGreeceEL65Peloponnisos51.PTPortugalPT15Algarve
25.GRGreeceEL51Anatoliki Makedonia, Thraki52.PTPortugalPT18Alentejo
26.GRGreeceEL63Dytiki Ellada53.SISloveniaSI04Zahodna Slovenija
27. GRGreeceEL53Dytiki Makedonia54.SISloveniaSI03Vzhodna Slovenija
Table 3. Checking the assumptions for Explanatory Factor analysis (EFA).
Number of Items Retained in the Analysis *Kaiser–Meyer–Olkin Measure of Sampling AdequacyBartlett’s Test of Sphericity
Approx. Chi-SquaredfSig.
Driving Forces70.673161.071210.000
Pressures60.779168.954150.000
State50.55175.129100.000
Responses60.557352.540150.000
* After checking the interitem correlation matrix and the anti-image correlation matrix.
Table 4. The summarized EFA results.
FactorsIndicator CodeIndicator DescriptionFactor LoadingsPercentage of Variance Explained
Driving ForcesBasic tourism resources and facilities zC12_01
rzAN2_15ipo
zEH2_44ipo
Tourist service infrastructure
Monuments and other tourist sights
Share of employment in wholesale, retail, hotel and restaurants
0.797
0.908
0.827
66.47
Tourism development preconditionszC11r
zgdpipo
zAN2_05ipo
zAN2_23ipo
Ground and port infrastructure
GDP per capita
Number of beds in hotels and similar establishments per inhabitant
Accessibility
0.500
0.797
0.742
0.709
PressuresTourist demand zarr_nripo
zarr_ripo
zarr_r2ipo
zD14_04r
Arrivals in hotels and similar establishments: nonresidents
Arrivals in hotels and similar establishments: residents
Arrivals in other establishments: residents
Sport and leisure facilities
0.659
0.918
0.854
0.780
76.17
Tourism spatial pressures zMM2_64ipo
zB9_03r
Airport rank
Arrivals of tourists/km2, Nights spent/km2, Arrivals of tourists/1000 people, Nights spent/1000 people
0.747
0.902
StateEnvironment quality and sustainabilityzD13_05r
zB9_03 –
zD13_05
Quality of preservation of natural landscape based on Natura 2000 sites
Sustainability of travel and tourism industry development
Quality of the natural environment
0.878
0.668
0.933
65.31
Life quality and safetyzA2r
zSC2_02ipo
Safety and security
Satisfied residents
0.750
0.721
ResponsesPolicy efficacy in creating preconditions for tourism attractivenesszB6_05
zB6_06
zB9_02
Timeliness of providing monthly/quarterly T&T data
Country brand strategy rating
Enforcement of environmental regulations
0.891
0.894
0.916
87.01
Strategic orientation towards T&T industryzB6_01
zB6_02
zB6_03
Government prioritization of the travel and tourism industry
T&T government expenditure
Effectiveness of marketing and branding to attract tourists
0.960
0.853
0.867
Table 5. One-way ANOVA results for Driving forces–Pressures–State–Response (DPSR) components.
COMPONENT Sum of SquaresdfMean SquareFSig.
DRIVING FORCESF1Between Groups35,510217,75551,775000
Within Groups17,48951343
Total53,00053
F2Between Groups38,000219,00064,600000
Within Groups15,00051294
Total53,0005317,755
PRESSURESF1Between Groups35,510217,75551,775000
Within Groups17,48951343
Total53,00053
F2Between Groups38,000219,00064,600000
Within Groups15,00051294
Total53,00053
STATEF1Between Groups38,265219,13366,222000
Within Groups14,73551289
Total53,00053
F2Between Groups32,336216,16839,903000
Within Groups20,66451405
Total53,00053
RESPONSESF1Between Groups52,116317,372983,320000
Within Groups88350018
Total53,00053
F2Between Groups47,560315,853145,708000
Within Groups544050109
Total53,00053

