Exploiting the Scientific Literature for Performing Life Cycle Assessment about Transportation


Abstract

1. Introduction
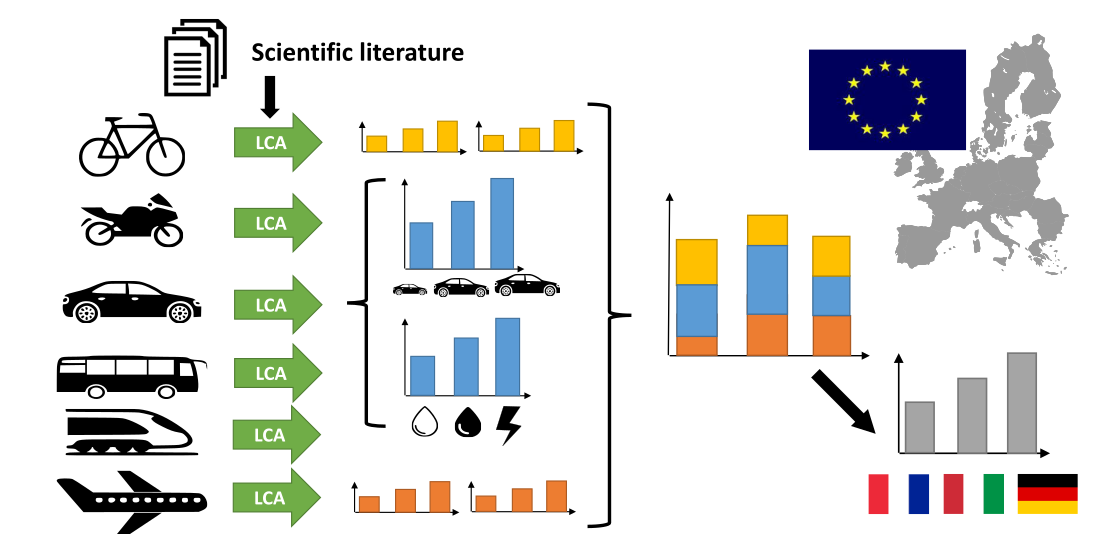
2. Methodology
- Definition of the goal and scope of the study, or the identification of the technical system to be analyzed, the definition of the functional unit and operative scenario, and the formulation of the motivations of the LCA in order to circumscribe the domain of validity of the study.
- Collection of the sources of impacts, i.e., the inventory of all the items of the analysis during the product life cycle, e.g., the types of materials and the masses of the components, the auxiliary and consumable materials, and the energy spent in the realization, transport, functioning, and disposal. This phase can be carried out through direct or indirect measurement with an appropriate resource allocation criterion. To reduce the onerousness of this phase, approximations respecting the "cut-off" criteria established by the normative reference can also be introduced. Finally, in this phase, calculation methods and datasets containing the specific impact coefficients of materials and energy are also gathered.
- Environmental impacts assessment is carried out through the calculation according to the standardized environmental indicators, which quantify the deterioration of ecosystems, direct impacts on human health, and resource depletion by exploiting the data, methods, and tools collected during the second phase of the LCA.
- Interpretation of the results to be presented in the study consist in their hierarchization based on the magnitude of the environmental impacts, in their discussion, preferably in comparison with the previous literature and considerations about economic and legal aspects, and in the sensitivity analysis to quantify the weight of uncertainties on the overall results.
3. Goal and Scope Reformulation
3.1. Products (Transportation Means) Description
3.2. Functional Unit
3.3. Selection of the Sources
3.4. System Boundaries
3.5. Impact Calculation Procedure
3.6. Identifcation of the Limitations
4. Inventory Data
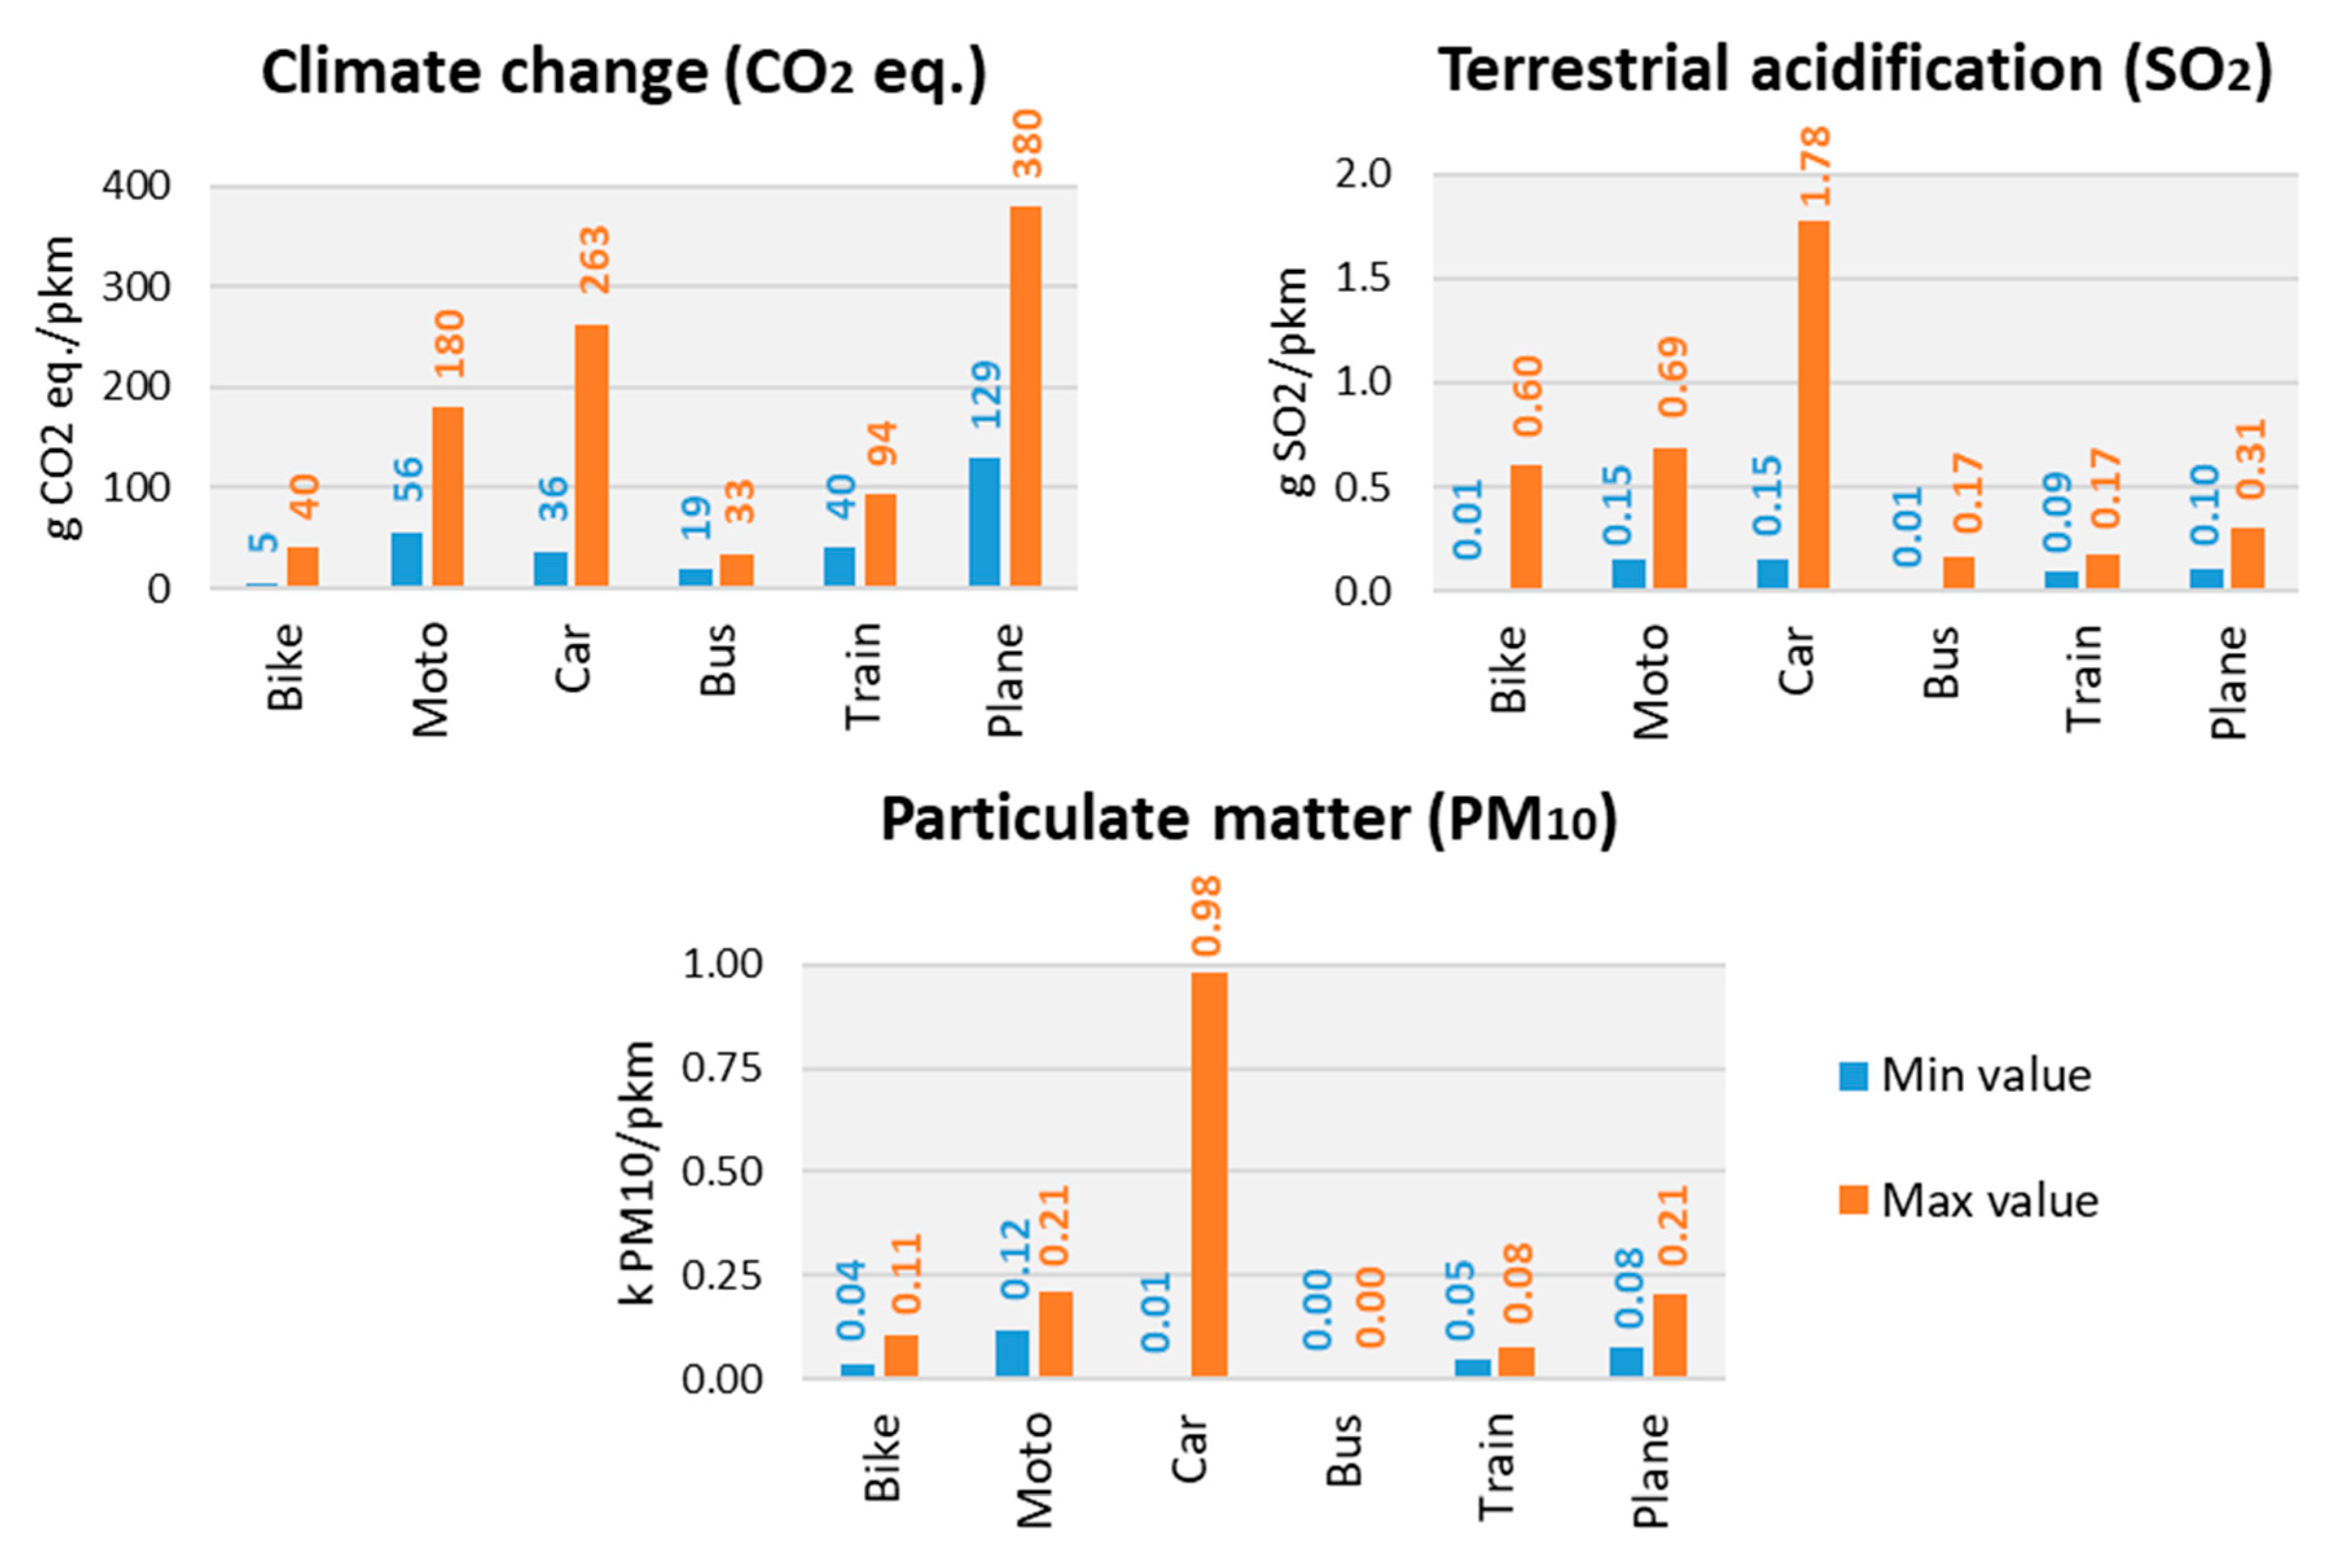
- The overall environmental impacts during the life cycle of each vehicle in terms of global warming potential, terrestrial acidification, and particulate matter formation, along with those of each phase, e.g., pre-manufacturing, manufacturing, use, and end-of-life.
- The criteria considered by the authors of the respective publications for the determination of these impacts: type and size of the vehicle, total distance travelled during the life cycle, operative use scenario including the geographical characteristics of the route and the energy mix for electric vehicles, and the average carried weight. These last criteria were used to normalize the overall environmental impacts of each vehicle according to the functional unit of this study in order to allow the comparison between them.
5. Results and Discussion
5.1. Baseline Scenario
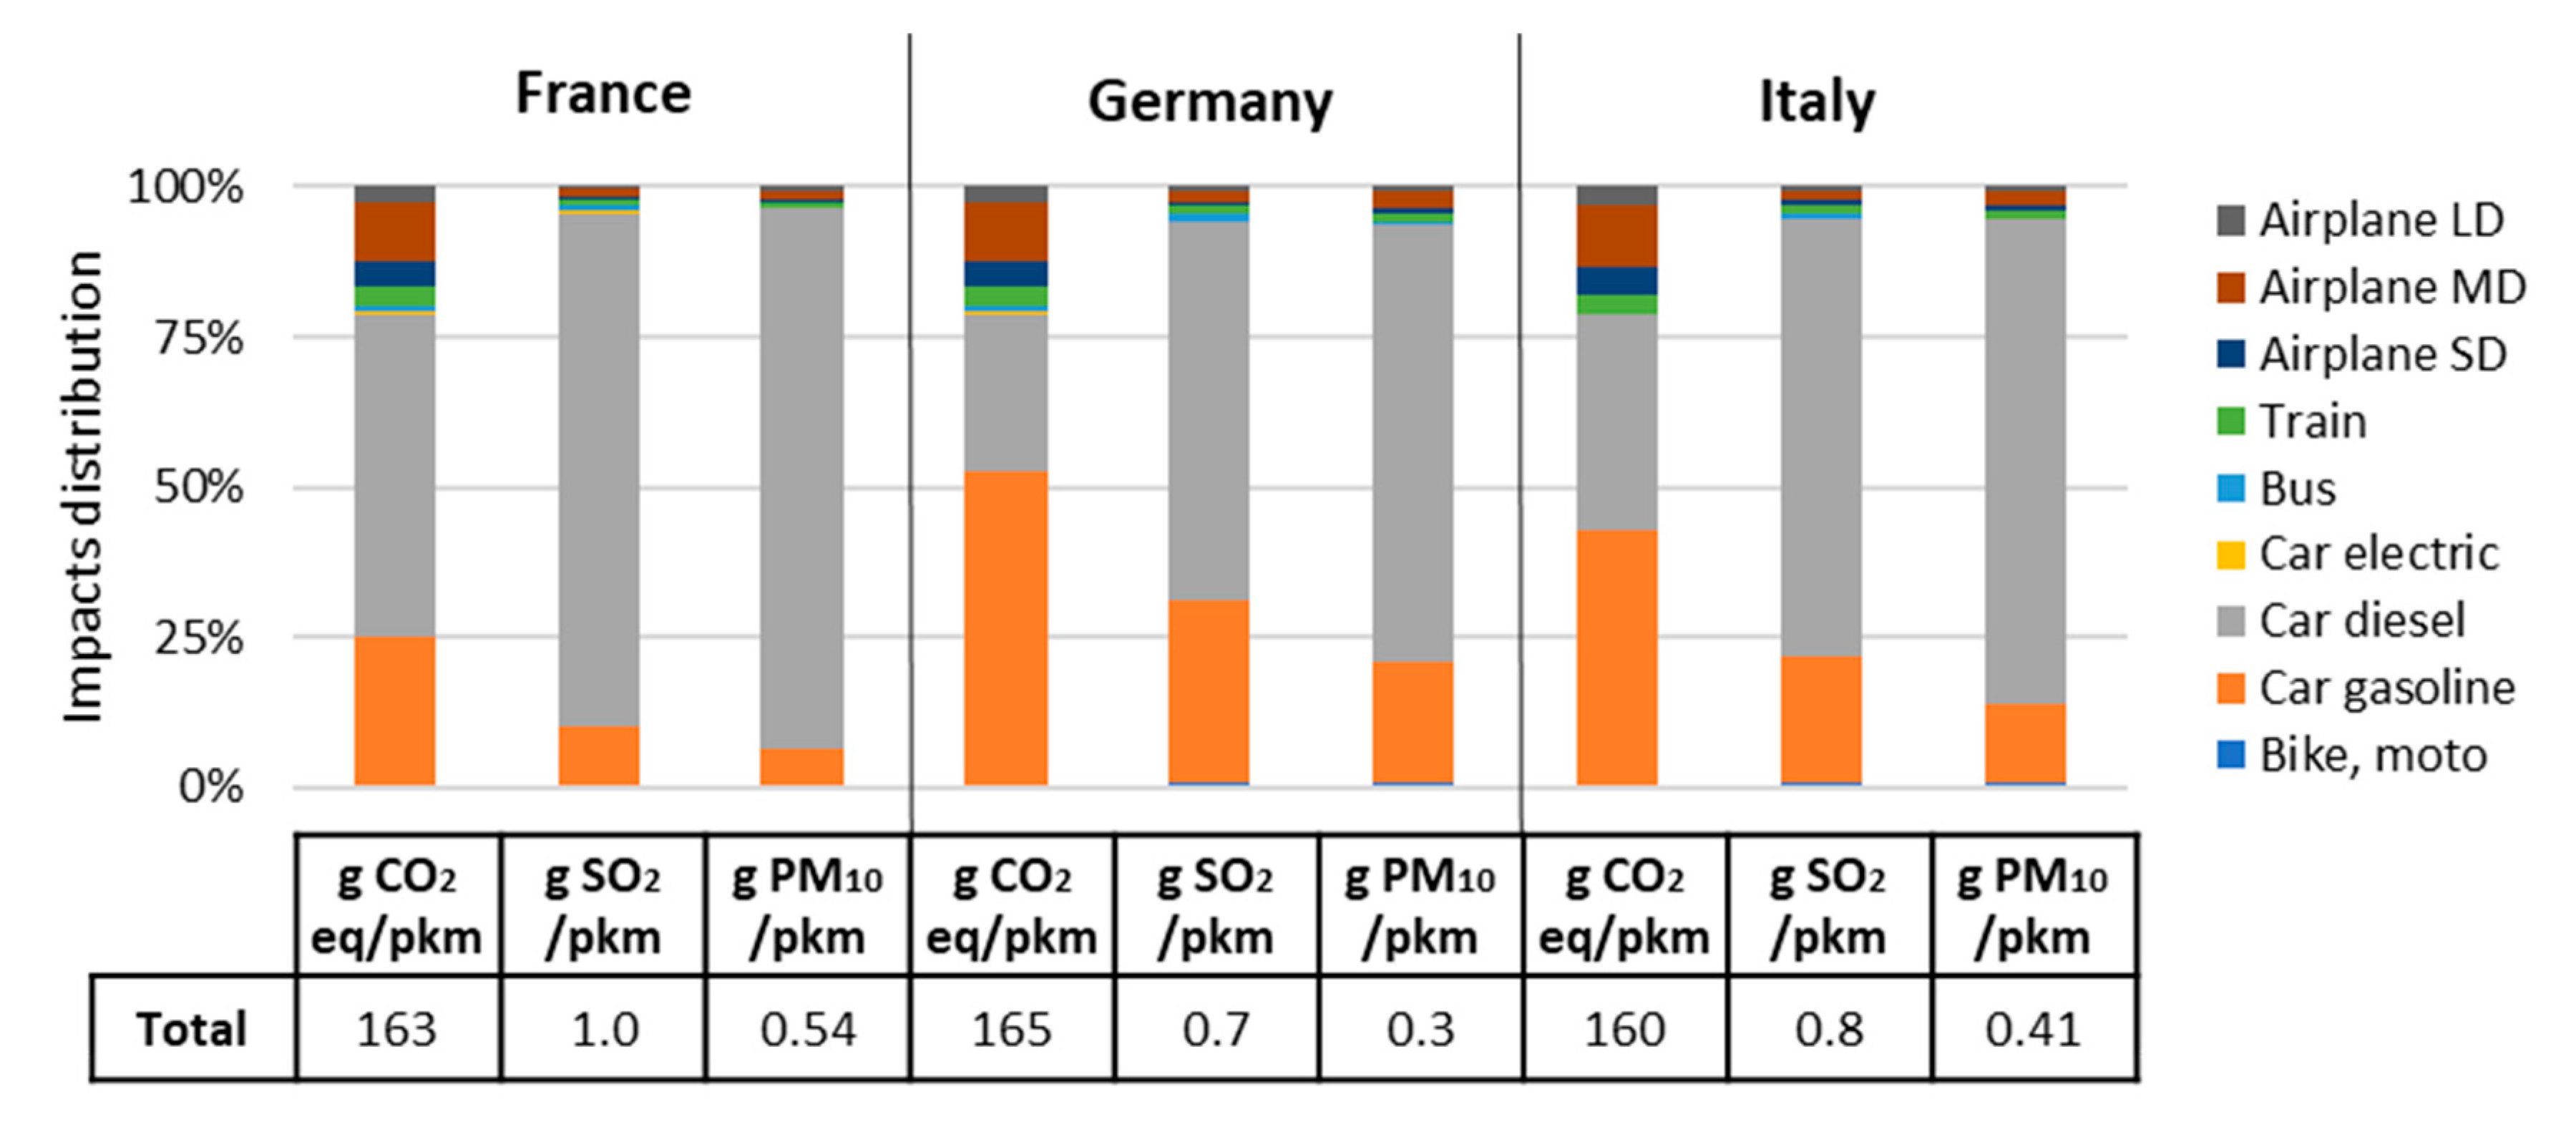
5.2. Overall European Scenario
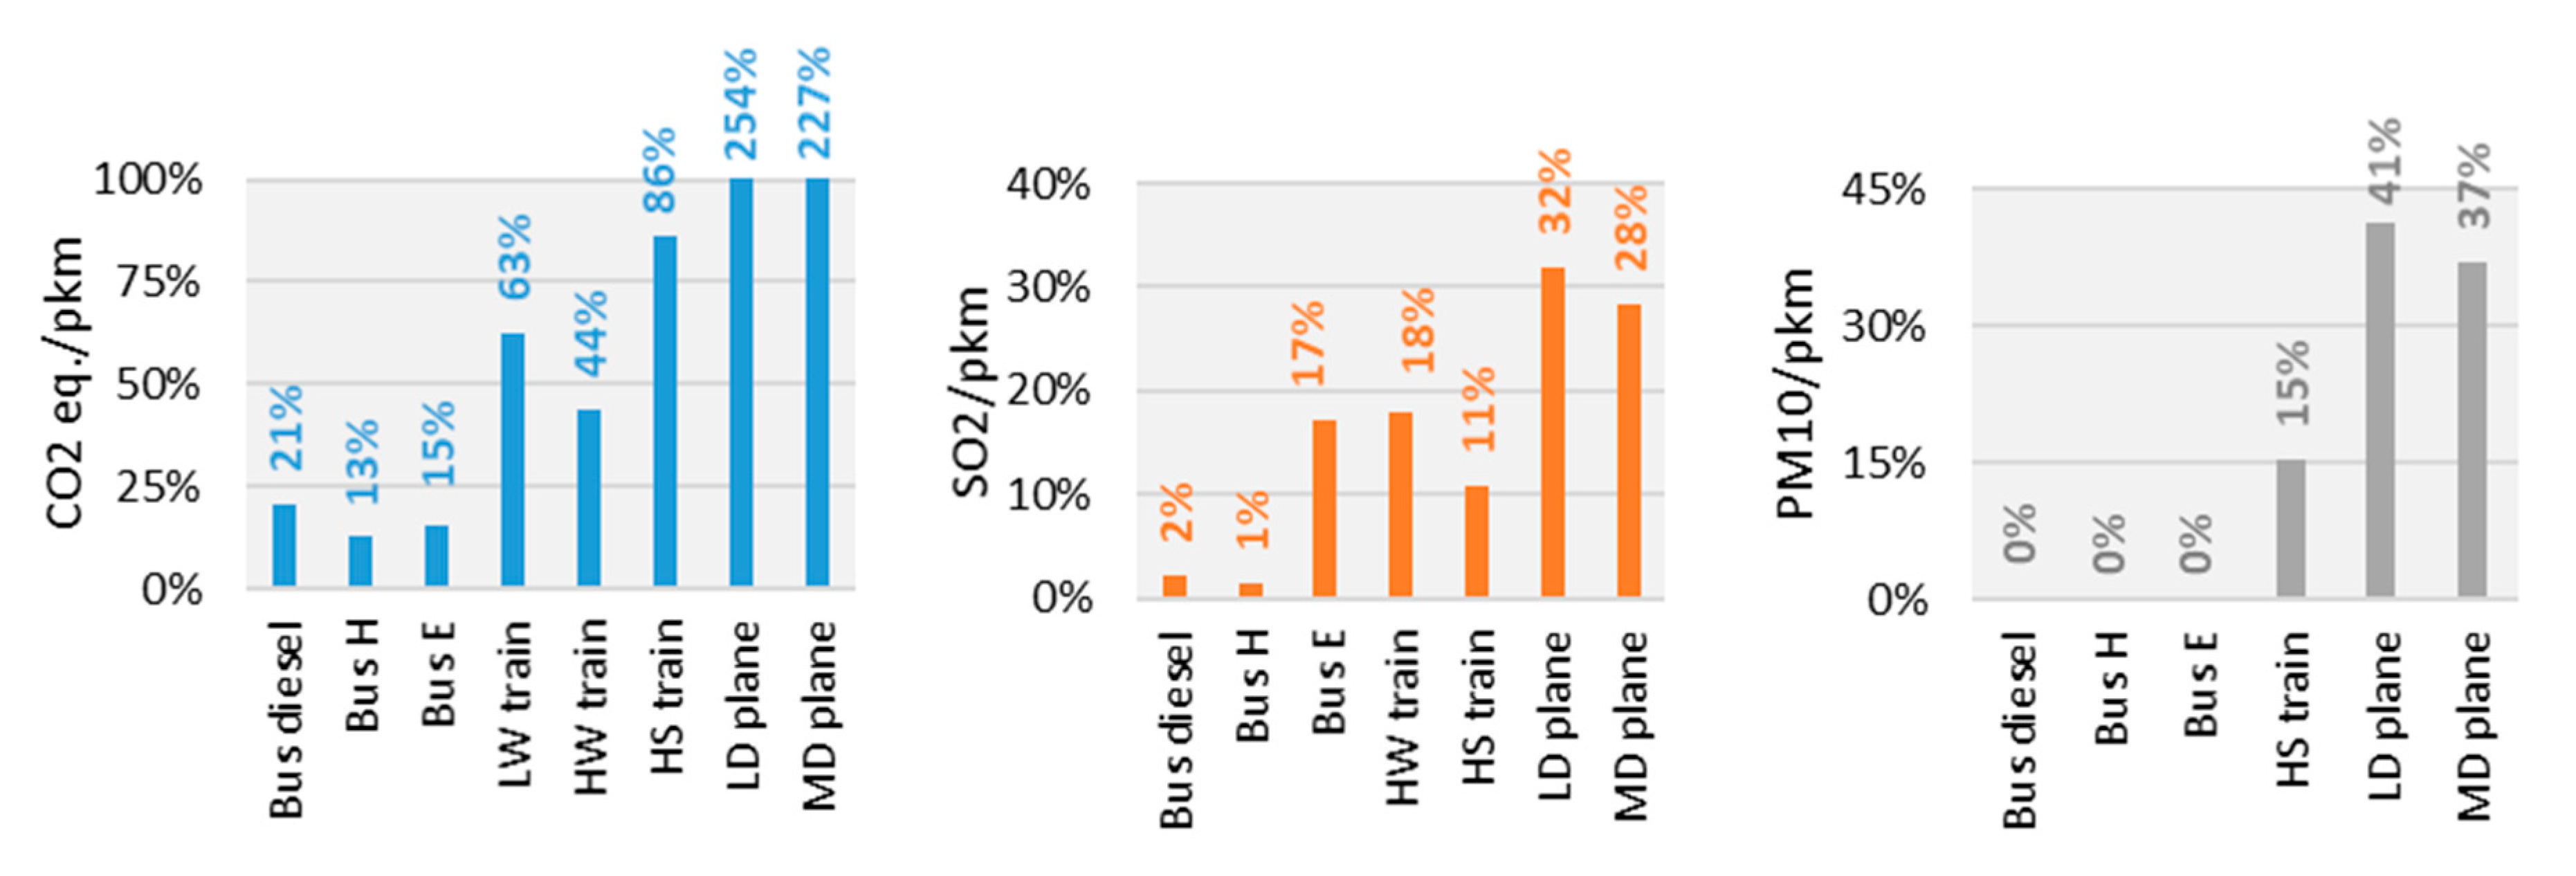
5.3. Sensitivity Analysis
5.3.1. Variations of the Number of Passengers
5.3.2. Variations of the Electricity Mix
5.3.3. Variations of the Vehicle Use Distribution
5.4. Improvements
6. Conclusions
Author Contributions
Funding
Conflicts of Interest
References
- International Energy Association. Summary for Policymakers. 2014. Available online: https://www.ipcc.ch/site/assets/uploads/2018/02/ipcc_wg3_ar5_summary-for-policymakers.pdf (accessed on 13 September 2020).
- Suleiman, A.; Tight, M.R.; Quinn, A.D. Assessment and prediction of the impact of road transport on ambient concentrations of particulate matter PM10. Transp. Res. Part D Transp. Environ. 2016, 49, 301–312. [Google Scholar] [CrossRef]
- Khalili, S.; Rantanen, E.; Bogdanov, D.; Breyer, C. Global Transportation Demand Development with Impacts on the Energy Demand and Greenhouse Gas Emissions in a Climate-Constrained World. Energies 2019, 12, 3870. [Google Scholar] [CrossRef]
- Litman, T.; Burwell, D. Issues in sustainable transportation. Int. J. Glob. Environ. Issues 2006, 6, 331–347. [Google Scholar] [CrossRef]
- Kellner, F. Generating Greenhouse Gas Cutting Incentives when Allocating Carbon Dioxide Emissions to Shipments in Road Freight Transportation. 2020. Available online: https://link.springer.com/article/10.1007/s11367-016-1244-0 (accessed on 13 September 2020).
- Pehnt, M. Assessing future energy and transport systems: The case of fuel cells. Int. J. Life Cycle Assess. 2003, 8, 283. [Google Scholar] [CrossRef]
- Del Pero, F.; Delogu, M.; Pierini, M.; Bonaffini, D. Life Cycle Assessment of a heavy metro train. J. Clean. Prod. 2015, 87, 787–799. [Google Scholar] [CrossRef]
- Jones, H.; Moura, F.; Domingos, T. Life cycle assessment of high-speed rail: A case study in Portugal. Int. J. Life Cycle Assess. 2017, 22, 410–422. [Google Scholar] [CrossRef]
- Girardi, P.; Gargiulo, A.; Brambilla, P.C. A comparative LCA of an electric vehicle and an internal combustion engine vehicle using the appropriate power mix: The Italian case study. Int. J. Life Cycle Assess. 2015, 20, 1127–1142. [Google Scholar] [CrossRef]
- Mellino, S.; Petrillo, A.; Cigolotti, V.; Autorino, C.; Jannelli, E.; Ulgiati, S. A Life Cycle Assessment of lithium battery and hydrogen-FC powered electric bicycles: Searching for cleaner solutions to urban mobility. Int. J. Hydrogen Energy 2017, 42, 1830–1840. [Google Scholar] [CrossRef]
- Cox, B.L.; Mutel, C.L. The environmental and cost performance of current and future motorcycles. Appl. Energy 2018, 212, 1013–1024. [Google Scholar] [CrossRef]
- Chester, M.V.; Horvath, A. Environmental assessment of passenger transportation should include infrastructure and supply chains. Environ. Res. Lett. 2009, 4, 024008. [Google Scholar] [CrossRef]
- Allen, J.; Piecyk, M.; Piotrowska, M.; McLeod, F.; Cherrett, T.; Ghali, K.; Nguyen, T.; Bektas, T.; Bates, O.; Wise, S.; et al. Understanding the impact of e-commerce on last-mile light goods vehicle activity in urban areas: The case of London. Transp. Res. Part D Transp. Environ. 2018, 61, 325–338. [Google Scholar] [CrossRef]
- Nordelöf, A.; Messagie, M.; Tillman, A.M.; Söderman, M.L.; Van Mierlo, J. Environmental impacts of hybrid, plug-in hybrid, and battery electric vehicles—What can we learn from life cycle assessment? Int. J. Life Cycle Assess. 2014, 19, 1866–1890. [Google Scholar] [CrossRef]
- Timmis, A.J.; Hodzic, A.; Koh, L.; Bonner, M.; Soutis, C.; Schäfer, A.W.; Dray, L. Environmental impact assessment of aviation emission reduction through the implementation of composite materials. Int. J. Life Cycle Assess. 2015, 20, 233–243. [Google Scholar] [CrossRef]
- Bamberg, S.; Schmidt, P. Incentives, morality, or habit? Predicting students’ car use for university routes with the models of Ajzen, Schwartz, and Triandis. Environ. Behav. 2003, 35, 264–285. [Google Scholar] [CrossRef]
- Helmers, E.; Dietz, J.; Hartard, S. Electric car life cycle assessment based on real-world mileage and the electric conversion scenario. Int. J. Life Cycle Assess. 2017, 22, 15–30. [Google Scholar] [CrossRef]
- Johanning, A.; Scholz, D. A First Step towards the Integration of Life Cycle Assessment into Conceptual Aircraft Design; Deutsche Gesellschaft für Luft-und Raumfahrt-Lilienthal-Oberth eV: Bonn, Germany, 2014. [Google Scholar]
- Puhe, M.; Schippl, J. User perceptions and attitudes on sustainable urban transport among young adults: Findings from Copenhagen, Budapest and Karlsruhe. J. Environ. Policy Plan. 2014, 16, 337–357. [Google Scholar] [CrossRef]
- Van Fan, Y.; Perry, S.; Klemeš, J.J.; Lee, C.T. A review on air emissions assessment: Transportation. J. Clean. Prod. 2018, 194, 673–684. [Google Scholar] [CrossRef]
- ISO 14040:2006. Environmental Management—LCA—Principles and Framework; ISO: Geneva, Switzerland, 2006. [Google Scholar]
- ISO 14044:2006. Environmental Management—LCA—Requirements and Guidelines; ISO: Geneva, Switzerland, 2006. [Google Scholar]
- Chester, M.V. Life-Cycle Environmental Inventory of Passenger Transportation in the United States. Ph.D. Thesis, University of California, Berkeley, Berkeley, CA, USA, 2008. [Google Scholar]
- Li, T.Z.; Qian, F.; Su, C. Energy consumption and emission of pollutants from electric bicycles. In Applied Mechanics and Materials; Trans Tech Publications Ltd.: Stafa-Zurich, Switzerland, 2014; Volume 505, pp. 327–333. [Google Scholar]
- Hollingsworth, J.; Copeland, B.; Johnson, J.X. Are e-scooters polluters? The environmental impacts of shared dockless electric scooters. Environ. Res. Lett. 2019, 14, 084031. [Google Scholar] [CrossRef]
- Leuenberger, M.; Frischknecht, R. Life Cycle Assessment of Two Wheel Vehicles; ESU-Services Ltd.: Uster, Switzerland, 2010. [Google Scholar]
- Kerdlap, P.; Gheewala, S.H. Electric motorcycles in Thailand: A life cycle perspective. J. Ind. Ecol. 2016, 20, 1399–1411. [Google Scholar] [CrossRef]
- Nanaki, E.A.; Koroneos, C.J. Comparative LCA of the use of biodiesel, diesel and gasoline for transportation. J. Clean. Prod. 2012, 20, 14–19. [Google Scholar] [CrossRef]
- Yasar, A.; Haider, R.; Tabinda, A.B.; Kausar, F.; Khan, M. A comparison of engine emissions from heavy, medium, and light vehicles for CNG, diesel, and gasoline fuels. Pol. J. Environ. Stud. 2013, 22, 1277–1281. [Google Scholar]
- Lombardi, L.; Tribioli, L.; Cozzolino, R.; Bella, G. Comparative environmental assessment of conventional, electric, hybrid, and fuel cell powertrains based on LCA. Int. J. Life Cycle Assess. 2017, 22, 1989–2006. [Google Scholar] [CrossRef]
- Kemp, N.J.; Keoleian, G.A.; He, X.; Kasliwal, A. Life cycle greenhouse gas impacts of a connected and automated SUV and van. Transp. Res. Part D Transp. Environ. 2020, 83, 102375. [Google Scholar] [CrossRef]
- Szumska, E.; Pawełczyk, M.; Pistek, V. Evaluation of the Life Cycle Costs for urban buses equipped with conventional and hybrid drive trains. Archiwum Motoryzacji 2019, 83, 73–86. [Google Scholar]
- Lajunen, A.; Lipman, T. Lifecycle cost assessment and carbon dioxide emissions of diesel, natural gas, hybrid electric, fuel cell hybrid and electric transit buses. Energy 2016, 106, 329–342. [Google Scholar] [CrossRef]
- Cooney, G.; Hawkins, T.R.; Marriott, J. Life cycle assessment of diesel and electric public transportation buses. J. Ind. Ecol. 2013, 17, 689–699. [Google Scholar] [CrossRef]
- Chester, M.V.; Horvath, A.; Madanat, S. Comparison of life-cycle energy and emissions footprints of passenger transportation in metropolitan regions. Atmos. Environ. 2010, 44, 1071–1079. [Google Scholar] [CrossRef]
- Chester, M.; Horvath, A. High-speed rail with emerging automobiles and aircraft can reduce environmental impacts in California’s future. Environ. Res. Lett. 2012, 7, 034012. [Google Scholar] [CrossRef]
- Cox, B.; Jemiolo, W.; Mutel, C. Life cycle assessment of air transportation and the Swiss commercial air transport fleet. Transp. Res. Part D Transp. Environ. 2018, 58, 1–13. [Google Scholar] [CrossRef]
- Yap, M.; Cats, O.; van Arem, B. Crowding valuation in urban tram and bus transportation based on smart card data. Transp. A Transp. Sci. 2020, 16, 23–42. [Google Scholar] [CrossRef]
- EN 15663. Railway Applications - Definition of Vehicle Reference Masses; CEN: Bruxelles, Belgium, 2009. [Google Scholar]
- Allacker, K.; Mathieux, F.; Pennington, D.; Pant, R. The search for an appropriate end-of-life formula for the purpose of the European Commission Environmental Footprint initiative. Int. J. Life Cycle Assess. 2017, 22, 1441–1458. [Google Scholar] [CrossRef]
- Wanke, P.; Chen, Z.; Zheng, X.; Antunes, J. Sustainability efficiency and carbon inequality of the Chinese transportation system: A Robust Bayesian Stochastic Frontier Analysis. J. Environ. Manag. 2020, 260, 110163. [Google Scholar] [CrossRef] [PubMed]
- Alpkokin, P.; Black, J.A.; Iyinam, S.; Kesten, A.S. Historical analysis of economic, social and environmental impacts of the Europe-Asia crossings in Istanbul. Int. J. Sustain. Transp. 2016, 10, 65–75. [Google Scholar] [CrossRef]
- Winkel, R.; Weddige, U.; Johnsen, D.; Hoen, V.; Papaefthimiou, S. Shore side electricity in Europe: Potential and environmental benefits. Energy Policy 2016, 88, 584–593. [Google Scholar] [CrossRef]
- Focas, C.; Christidis, P. Peak car in Europe? Transp. Res. Procedia 2017, 25, 531–550. [Google Scholar] [CrossRef]
- European Environment Agency. Overview of Electricity Production and Use in Europe. 2016. Available online: https://www.eea.europa.eu/data-and-maps/indicators/overview-of-the-electricity-production-2/assessment-4 (accessed on 13 September 2020).
- Dong, X.; Wang, B.; Yip, H.L.; Chan, Q.N. CO2 emission of electric and gasoline vehicles under various road conditions for China, Japan, Europe and world average—Prediction through year 2040. Appl. Sci. 2019, 9, 2295. [Google Scholar] [CrossRef]
- Hijazi, O.; Munro, S.; Zerhusen, B.; Effenberger, M. Review of life cycle assessment for biogas production in Europe. Renew. Sustain. Energy Rev. 2016, 54, 1291–1300. [Google Scholar] [CrossRef]
- Antrop, M. Landscape change and the urbanization process in Europe. Landsc. Urban Plan. 2004, 67, 9–26. [Google Scholar] [CrossRef]
- Cherry, C.R.; Weinert, J.X.; Xinmiao, Y. Comparative environmental impacts of electric bikes in China. Transp. Res. Part D Transp. Environ. 2009, 14, 281–290. [Google Scholar] [CrossRef]
- Zhang, Y.; Mi, Z. Environmental benefits of bike sharing: A big data-based analysis. Appl. Energy 2018, 220, 296–301. [Google Scholar] [CrossRef]
- Shaheen, S.A.; Zhang, H.; Martin, E.; Guzman, S. China’s Hangzhou public bicycle: Understanding early adoption and behavioral response to bikesharing. Transp. Res. Rec. 2011, 2247, 33–41. [Google Scholar] [CrossRef]
- Ricci, M. Bike sharing: A review of evidence on impacts and processes of implementation and operation. Res. Transp. Bus. Manag. 2015, 15, 28–38. [Google Scholar] [CrossRef]
- Vasic, A.M.; Weilenmann, M. Comparison of real-world emissions from two-wheelers and passenger cars. Environ. Sci. Technol. 2006, 40, 149–154. [Google Scholar] [CrossRef] [PubMed]
- Hawkins, T.R.; Gausen, O.M.; Strømman, A.H. Environmental impacts of hybrid and electric vehicles—A review. Int. J. Life Cycle Assess. 2012, 17, 997–1014. [Google Scholar] [CrossRef]
- Platt, S.M.; El Haddad, I.; Pieber, S.M.; Zardini, A.A.; Suarez-Bertoa, R.; Clairotte, M.; Daellenbach, K.R.; Slowik, J.G.; Baltensperger, U.; Temime-Roussel, B.; et al. Gasoline cars produce more carbonaceous particulate matter than modern filter-equipped diesel cars. Sci. Rep. 2017, 7, 1–9. [Google Scholar]
- Jenn, A.; Springel, K.; Gopal, A.R. Effectiveness of electric vehicle incentives in the United States. Energy Policy 2018, 119, 349–356. [Google Scholar] [CrossRef]
- Jochem, P.; Doll, C.; Fichtner, W. External costs of electric vehicles. Transp. Res. Part D Transp. Environ. 2016, 42, 60–76. [Google Scholar] [CrossRef]
- Sierzchula, W.; Bakker, S.; Maat, K.; Van Wee, B. The influence of financial incentives and other socio-economic factors on electric vehicle adoption. Energy Policy 2014, 68, 183–194. [Google Scholar] [CrossRef]
- Mersky, A.C.; Sprei, F.; Samaras, C.; Qian, Z.S. Effectiveness of incentives on electric vehicle adoption in Norway. Transp. Res. Part D Transp. Environ. 2016, 46, 56–68. [Google Scholar] [CrossRef]
- Browne, M.; Allen, J.; Nemoto, T.; Patier, D.; Visser, J. Reducing social and environmental impacts of urban freight transport: A review of some major cities. Procedia-Soc. Behav. Sci. 2012, 39, 19–33. [Google Scholar] [CrossRef]
- Efthymiou, D.; Antoniou, C.; Tyrinopoulos, Y.; Skaltsogianni, E. Factors affecting bus users’ satisfaction in times of economic crisis. Transp. Res. Part A Policy Pract. 2018, 114, 3–12. [Google Scholar] [CrossRef]
- Grenier, A.; Page, S. The impact of electrified transport on local grid infrastructure: A comparison between electric cars and light rail. Energy Policy 2012, 49, 355–364. [Google Scholar] [CrossRef]
- D’Alfonso, T.; Jiang, C.; Bracaglia, V. Air transport and high-speed rail competition: Environmental implications and mitigation strategies. Transp. Res. Part A Policy Pract. 2016, 92, 261–276. [Google Scholar] [CrossRef]
- Givoni, M. Environmental benefits from mode substitution: Comparison of the environmental impact from aircraft and high-speed train operations. Int. J. Sustain. Transp. 2007, 1, 209–230. [Google Scholar] [CrossRef]
- Román, C.; Martín, J.C. Integration of HSR and air transport: Understanding passengers’ preferences. Transp. Res. Part E Logist. Transp. Rev. 2014, 71, 129–141. [Google Scholar] [CrossRef]
- Teske, S. Achieving the Paris Climate Agreement Goals; Springer International: Berlin/Heidelberg, Germany, 2019. [Google Scholar]
- EU. Eurostat Passenger Transport Statistics. 2019. Available online: https://ec.europa.eu/eurostat/statistics-explained/index.php/Passenger_transport_statistics (accessed on 13 September 2020).
- EU. Eurostat Transport Equipment Statistics. 2019. Available online: https://ec.europa.eu/eurostat/statistics-explained/index.php?title=Transport_equipment_statistics&oldid=436544#Road_transport_equipment (accessed on 13 September 2020).
- Jonson, J.E.; Borken-Kleefeld, J.; Simpson, D.; Nyíri, A.; Posch, M.; Heyes, C. Impact of excess NOx emissions from diesel cars on air quality, public health and eutrophication in Europe. Environ. Res. Lett. 2017, 12, 094017. [Google Scholar] [CrossRef]
- McKinsey, A.R.F. EVolution Electric Vehicles in Europe: Gearing up for a New Phase? Amsterdam Round Table: Amsterdam, The Netherland, 2014. [Google Scholar]
- Thiel, C.; Nijs, W.; Simoes, S.; Schmidt, J.; van Zyl, A.; Schmid, E. The impact of the EU car CO2 regulation on the energy system and the role of electro-mobility to achieve transport decarbonisation. Energy Policy 2016, 96, 153–166. [Google Scholar] [CrossRef]
- Del Pero, F.; Delogu, M.; Pierini, M. The effect of lightweighting in automotive LCA perspective: Estimation of mass-induced fuel consumption reduction for gasoline turbocharged vehicles. J. Clean. Prod. 2017, 154, 566–577. [Google Scholar] [CrossRef]
- Garmendia, M.; Ribalaygua, C.; Ureña, J.M. High speed rail: Implication for cities. Cities 2012, 29, S26–S31. [Google Scholar] [CrossRef]
- Nurdden, A.; Rahmat, R.A.O.K.; Ismail, A. Effect of transportation policies on modal shift from private car to public transport in Malaysia. J. Appl. Sci. 2007, 7, 1013–1018. [Google Scholar]
- Friman, M.; Larhult, L.; Gärling, T. An analysis of soft transport policy measures implemented in Sweden to reduce private car use. Transportation 2013, 40, 109–129. [Google Scholar] [CrossRef]
- Ayalon, O.; Flicstein, B.; Shtibelman, A. Benefits of reducing air emissions: Replacing conventional with electric passenger vehicles. J. Environ. Prot. 2013, 4, 1035. [Google Scholar] [CrossRef]
- Collins, G. China’s Evolving Oil Demand: Slowing Overall Growth, Gasoline Replacing Diesel as Demand Driver, Refined Product Exports Rising Substantially; Working Paper; Rice University: Houston, TX, USA, 2016. [Google Scholar]


© 2020 by the authors. Licensee MDPI, Basel, Switzerland. This article is an open access article distributed under the terms and conditions of the Creative Commons Attribution (CC BY) license (http://creativecommons.org/licenses/by/4.0/).
Share and Cite
Spreafico, C.; Russo, D. Exploiting the Scientific Literature for Performing Life Cycle Assessment about Transportation. Sustainability 2020, 12, 7548. https://doi.org/10.3390/su12187548
Spreafico C, Russo D. Exploiting the Scientific Literature for Performing Life Cycle Assessment about Transportation. Sustainability. 2020; 12(18):7548. https://doi.org/10.3390/su12187548
Chicago/Turabian StyleSpreafico, Christian, and Davide Russo. 2020. "Exploiting the Scientific Literature for Performing Life Cycle Assessment about Transportation" Sustainability 12, no. 18: 7548. https://doi.org/10.3390/su12187548
APA StyleSpreafico, C., & Russo, D. (2020). Exploiting the Scientific Literature for Performing Life Cycle Assessment about Transportation. Sustainability, 12(18), 7548. https://doi.org/10.3390/su12187548