Article

The Impacts of Conservation Agriculture on Water Use and Crop Production on the Loess Plateau: From Know-What to Know-Why

College of Surveying and Geo-informatics, North China University of Water Resources and Electric Power, Zhengzhou 450046, China
*
Author to whom correspondence should be addressed.
Sustainability 2020, 12(18), 7449; https://doi.org/10.3390/su12187449
Submission received: 5 August 2020 / Revised: 7 September 2020 / Accepted: 8 September 2020 / Published: 10 September 2020

Abstract

:
Due to the scarce irrigation water supply in the Loess Plateau, efficient use of rainwater is critical for the improvement of sustainable crop production. Conservation agriculture (CA) has been regarded as an ideal field management strategy to profoundly benefit water use and therefore crop production. However, it remains unclear as to how crop production and water use respond to annual precipitation and how CA practices affect crop production through regulating water use. In this study, a meta-analysis based on field observations was conducted to investigate the relationship between water use and crop production. The results showed that annual precipitation of 300 mm yr−1 is a threshold to ensure relatively high crop production and water use efficiency (WUE), and 600 mm yr−1 is the most favorable rainfall level for crop production and WUE. Evapotranspiration (ET) was linearly related to annual precipitation, except that it was not the lowest when annual rainfall <300 mm yr−1. Although straw mulching is more important than tillage reduction, tillage reduction is still necessary to combine with straw mulching to obtain a higher production of crop. Crop production, ET, and WUE kept increasing as experimental duration increased, indicating that extending CA term is essential to further improve water use and crop production. We further proposed mathematical equations to prove that the increase in transpiration plays a critical role in water use and crop production improvement. WUE is not necessarily related to the increase in yield, and, therefore, higher transpiration rather than increased WUE should be the target for crop production improvement. The results also suggest that evaporation and transpiration are not presented separately, which limits investigation of the effective use of water by identifying transpiration. Overall, annual precipitation is essential for the levels of crop production, ET, and WUE on the Chinese Loess Plateau. Reasonable CA practices, especially long-term application, could improve water use and crop production through increasing transpiration. However, a better future understanding of the relationship between crop production and water use needs more detailed information about the effective use of water at field scales.

1. Introduction

The scarce available water for crop use represents one of the key limiting factors largely constraining agricultural production in arid and semi-arid areas [1,2]. Rain-fed farming land in China accounts for nearly 25 Mha, mainly in the Chinese Loess Plateau [3]. In addition to the low annual precipitation, spatial distribution of the long-term precipitation is imbalanced across the Loess Plateau, ranging from below 300 mm yr−1 in the northern part to around 600 mm yr−1 in the southern part [4]. Furthermore, climate change has resulted in a decline in precipitation but a steady rise in temperature in the past five decades in the Loess Plateau [5]. The intensive evaporation and low rainwater supply has been worsening as an essential constraint to crop production in dry land [6,7,8]. Moreover, because of the inconsistency between the growing season and rainy season of the dominant crops such as wheat and maize, further limits are imposed on the crop productivity that heavily depends on rain storage [4,9]. Given water as the key limiting factor to increasing crop productivity, management strategies that can significantly improve water use play a critical role in crop production increase and food security [2,8,10,11,12,13].
Conservation agriculture (CA), as a package of no-tillage, straw mulching, and crop rotation, has been extensively investigated and shown to have many benefits, such as carbon sequestration [14,15], reduction of soil erosion [16,17], and improvement of soil physical and chemical properties [18,19,20]. The improvement of soil physical and chemical properties can lead to the increase of crop production [21,22,23,24]. Based on the data obtained from the field experiments, several meta-analyses have compared the impacts of different tillage practices on determining crop production, evapotranspiration (ET), and water use efficiency (WUE) [13,23,25,26,27]. The most frequently investigated tillage management strategies include different degrees of tillage reduction and residue retention [23,28]. For instance, previous studies reported that crop production and WUE could be largely sustained and improved by a range of CA solutions in the semi-arid Loess Plateau area [4,5]. Some studies not only compared the optimum tillage practices but also established correlations among crop production, WUE, and ET [3,10,29]. Although these reports improved our understanding of the impacts of CA on water use and crop yield improvement, several uncertainties remain unresolved. Firstly, rainfall is the only water supply in most areas of the water-limited Loess Plateau. A previous study has examined the relationship between rainfall and crop yield in the Chinese Loess Plateauc [7], but, to the best of our knowledge, the investigation of the relationships between rainfall and ET or WUE is currently lacking. It is necessary to fully assess the role of annual rainfall in terms of determining water use and thus crop production, which can provide basic information to set a proper goal for water conservancy and crop production improvement. Secondly, it is particularly important to identify the beneficial improvement of water use and crop productivity in the Loess Plateau by adopting CA. However, an agreement regarding the relative effectiveness of CA managements in this region has not yet been achieved [7,30], which indicates that further study on the impacts of CA on yield and water use in this area is needed. Thirdly, the effectiveness of various CA practices in terms of water use and crop production has been the focus of previous studies and widely investigated [10,12,22,31], but more essentially, it requires us to understand how the different tillage practices regulate water use processes and consequently impact crop production in the long term. However, the interpretation of the relationship between WUE and crop production is still limited [32]. Therefore, comprehensively and accurately assessing the relationship of water use and grain production, or at least a full recognition of the shortcomings of current studies reporting relationships of water use and agricultural production, is helpful to improve our understanding of how water use impacts the sustainable development of agriculture.
In this study, a meta-analysis was conducted by compiling published data regarding the changes in yield, water use efficiency, and water storage to the conversion from conventional tillage (CT) to CA in the Loess Plateau. The aim was to (1) investigate the role of annual precipitation in impacting crop production, ET, and WUE; (2) investigate the effects of CA practices on water use and yield in the long term; (3) identify the relationship between water use and crop production after the adoption of CA and discuss how water use should be investigated in the future.

2. Materials and Methods
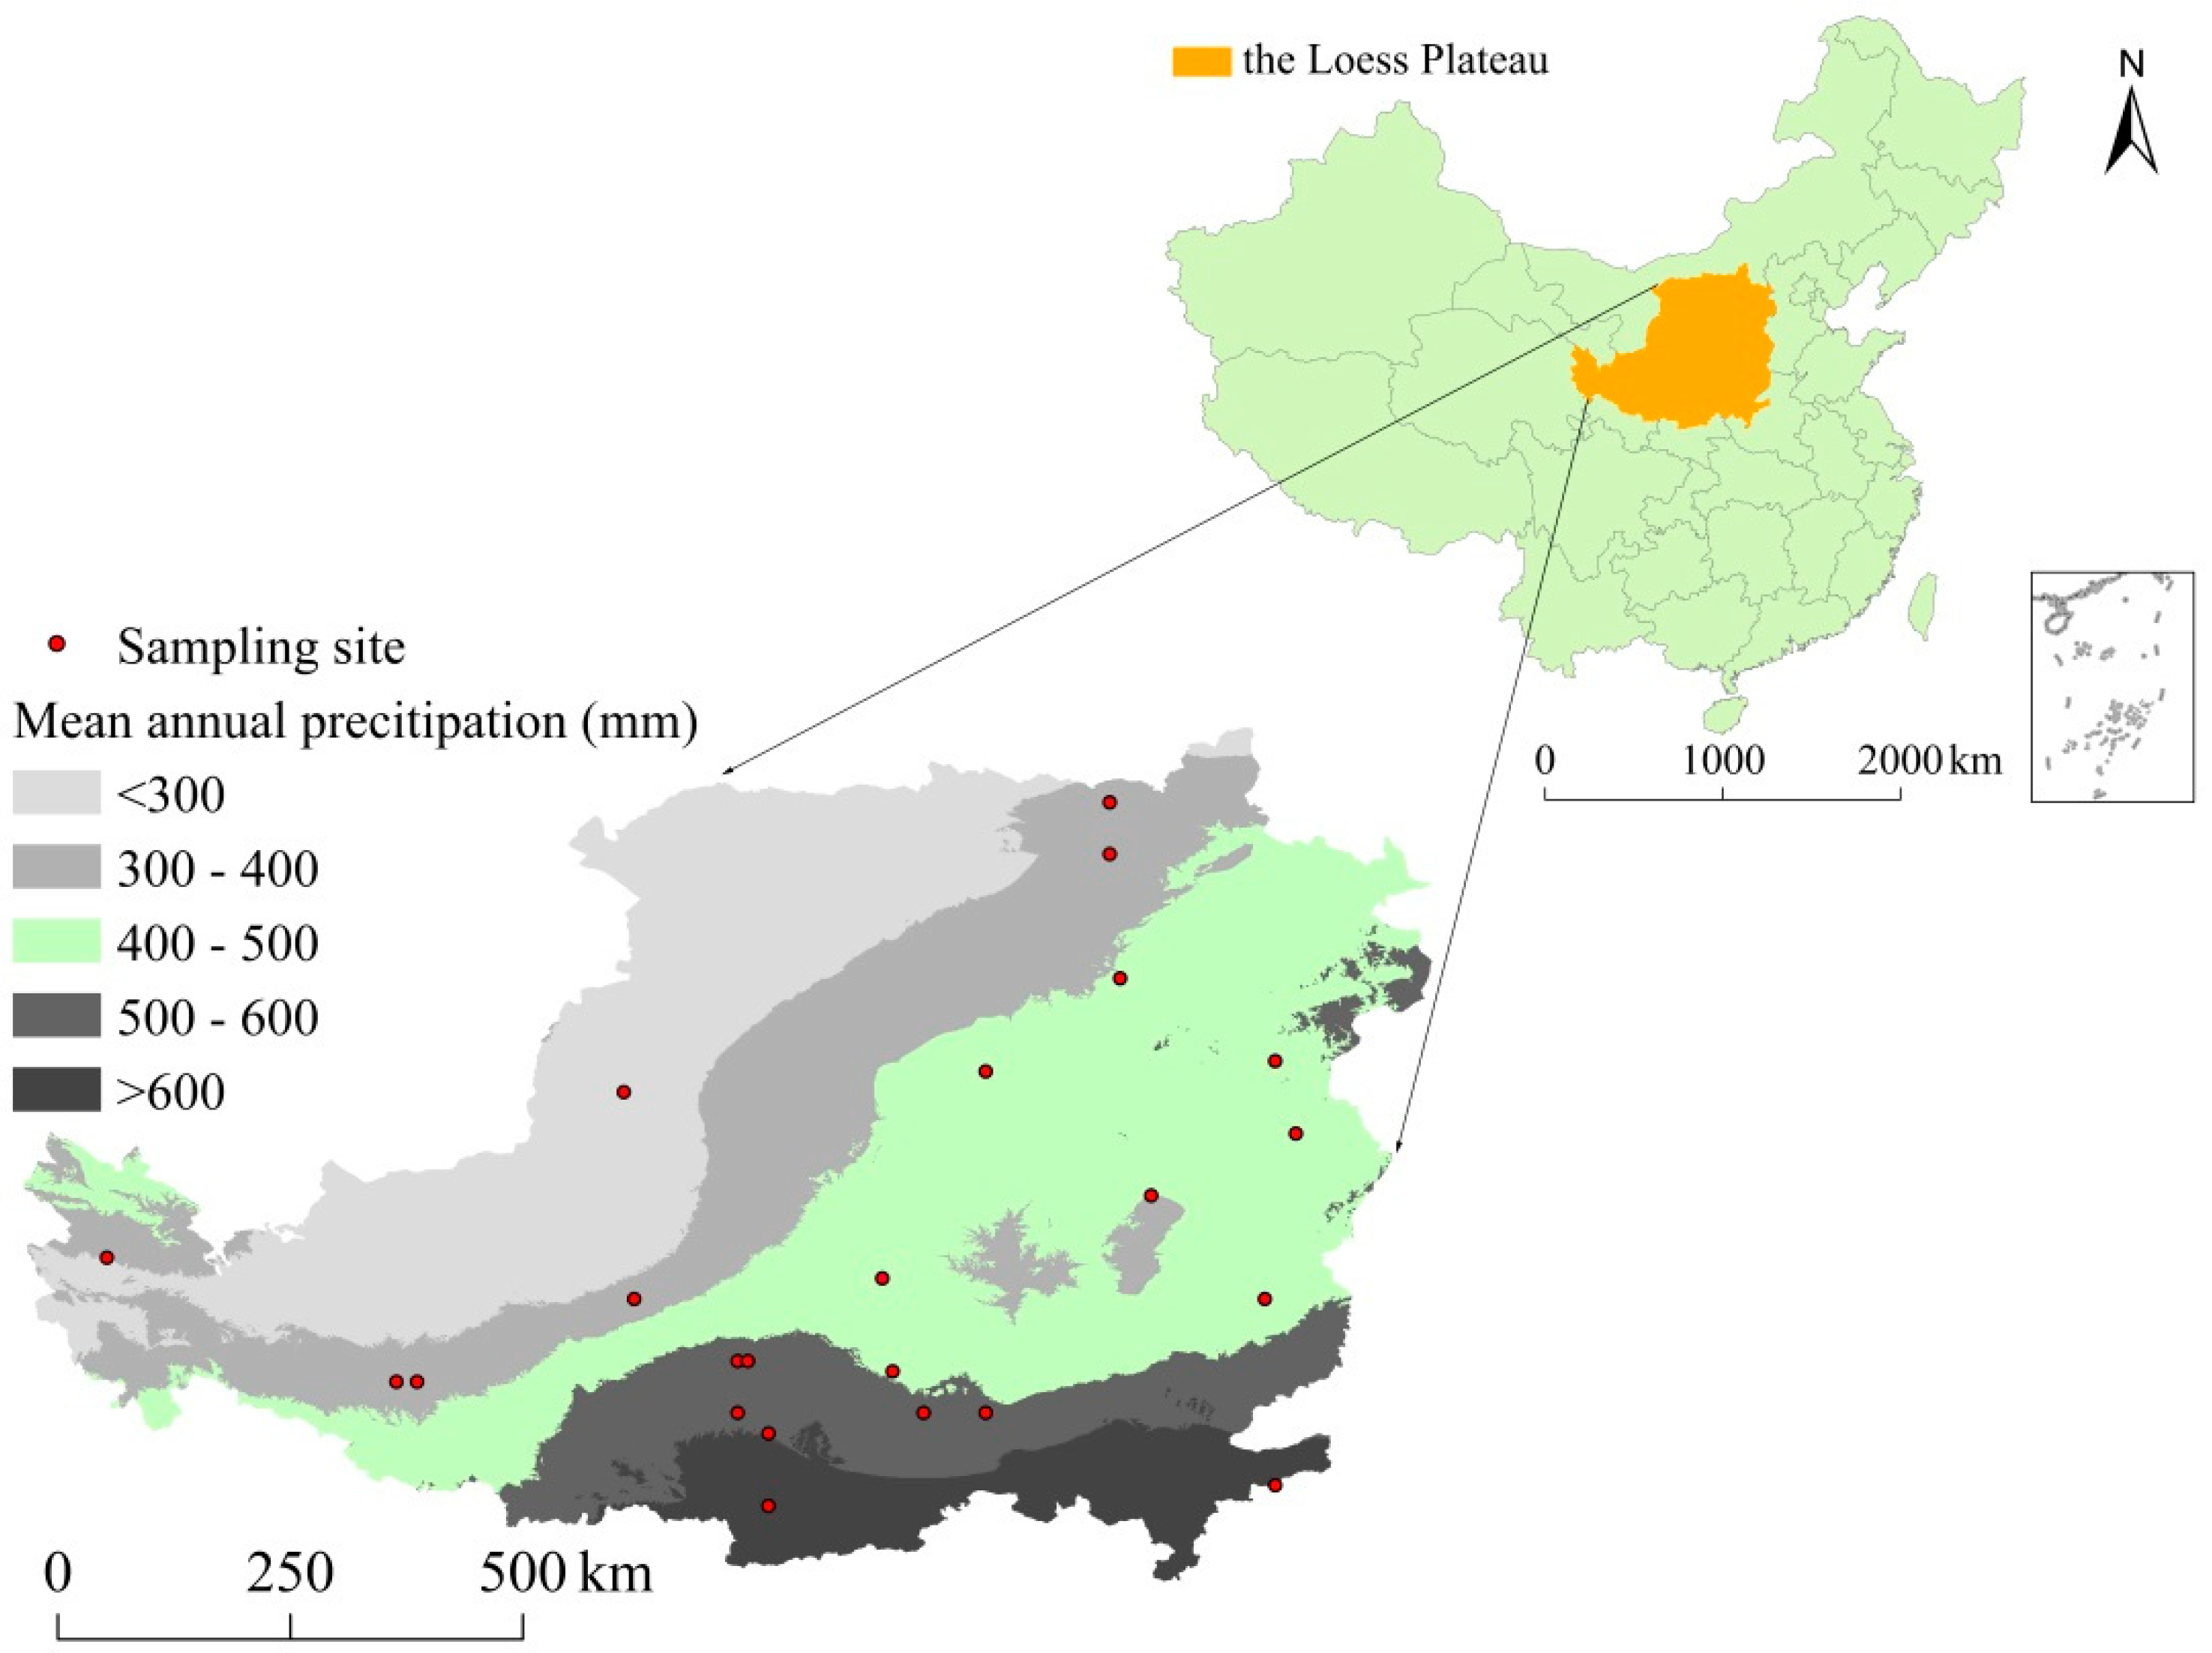
2.1. Data Sources

In order to systematically investigate crop production and water use improvement under CA in the Chinese Loess Plateau, we carried out reference searches with keywords of “conservation tillage” and “Loess Plateau” mainly in two databases: Web of Science for papers in English and CNKI for papers in Chinese, as described by Xiao, Zhao, and Kuhn [30]. Finally, 49 sets of data from 42 papers were identified, covering seven tillage practices including conventional tillage (CT), conventional tillage with straw mulching (CTs), no tillage (NT), no tillage with straw mulching (NTs), reduced tillage (RT), reduced tillage with straw mulching (RTs), and subsoiling with straw mulching (Ss) (Figure 1, Supplementary Materials Table S1). Three key indicators of crop management were first collected, including yield (kg), actual ET (mm), and actual WUE (kg mm−1), during the growth season. Although the unit of ET could be either mm [33] or kg water [34], we used mm because most references adopted mm with regard to the Loess Plateau. In addition, the experimental duration, i.e., the observation length of experiment (year), annual precipitation (mm), and water storage (mm) at planting time, were also collected from references in case the data were available. The data of annual precipitation and experimental duration would allow us to investigate the responses of crop production to different precipitation levels and long-term application of CA, whereas the data of water storage was regarded as supplementary to ET and WUE to investigate water use of CA practices. The data on crop production, ET, WUE, precipitation, and water storage were directly obtained from the tables or indirectly digitized from graphs by Get Data software (www.getdata-graph-digitizer.com), as commonly used in most meta-analyses.

2.2. Data Analyses

In order to evaluate the potential influences of CA on crop production and water use, the changes in yield, WUE, ET, and water storage were calculated based on Equation (1):
C h a n g e   o f   t r a i t   ( % )   = ( T r a i t CA T r a i t CT ) / T r a i t CT
where trait indicates crop production, ET, WUE, and water storage under CA or CT.
Each of the CA practices was compared to CT. Such calculations provided basic information regarding changes in crop production and water use of each CA practice as obtained in previous studies [30]. However, as the key aim was to evaluate how CA changes crop production through regulating the use of water rather than assess the changes in yield and water use caused by the adoption of CA, further analyses were essential to expand the scope of this study. First, we plotted raw data of crop production, ET, and WUE against annual precipitation, which enabled us to directly illustrate how annual precipitation impacted yield and water use. Annual precipitation was divided into three classes, i.e., <300, 300–600, >600 mm yr−1, corresponding to three climate conditions of arid, semi-arid, and wet. Second, the impacts of experimental duration on crop production, WUE, and ET were assessed by dividing the duration into four classes, i.e., <3, 4–6, 7–9, and >9 years. Third, the changes in crop production, changes in ET, and changes in WUE after adopting CA were plotted against each other. Theoretically, it is only reasonable to plot yield against ET (see Discussion section below). However, in order to illustrate the problematic explanations as for the relationship of crop production and water use in current studies, we still performed the correlations among yield, WUE, and ET, following the same procedure as conducted in many meta-analyses (e.g., Wang and Shangguan [3]).

2.3. Statistical Analyses

One sample t-tests or Wilcoxon signed rank tests were conducted to determine if the relative changes calculated above were significant from zero, depending on the normality of the datasets [30]. The differences among various CA groups, different rainfall levels, or different experimental duration classes were tested by one-way ANOVA least significant difference (LSD). Furthermore, correlation and regression analyses were performed to identify how annual precipitation is related to crop production and water use. Regression analyses were also adopted to investigate how experimental duration affects changes in yield, ET, WUE, and water storage.

3. Results

3.1. Relationships between Precipitation and Crop Production, WUE, and ET

Annual precipitation recorded in these paired experiments ranged from 160 to 1180 mm yr−1 and had remarkable impacts on crop production under all tillage practices (Figure 2). Basically, crop production increased with increasing annual precipitation and reached a stable phase when annual precipitation was >600 mm yr−1. According to annual precipitation, the increase in yield could be further divided into three phases, i.e., relatively slowly increasing phase of precipitation class of <300 mm, sharply increasing phase of 300–600 mm yr−1, and slowly decreasing phase of >600 mm yr−1. For the precipitation class of <300 mm yr−1, the mean crop production of all tillage practices was 1.276 Mg ha−1, which was significantly lower than 3.146 Mg ha−1 of the 300–600 mm yr−1 class and 4.545 Mg ha−1 in the >600 mm yr−1 class (Table 1). The correlation between crop production and annual precipitation decreased as annual precipitation increased, with R2 ranging from 0.451 under annual precipitation <300 mm yr−1 to 0.290 under annual precipitation of 300 to 600 mm yr−1 and further down to 0.067 under annual precipitation of >600 mm yr−1 (Table 1). The correlation between annual rainfall and crop production was only insignificant for the class of annual precipitation >600 mm yr−1. ET also generally increased with increasing annual precipitation. The highest ET was found in the precipitation class of >600 mm yr−1, and the lowest ET was found in the precipitation class of 300–600 mm yr−1 rather than the lowest precipitation class of <300 mm yr−1 (Figure 2, Table 1). Significantly positive correlations were observed between annual precipitation and ET for all three precipitation classes, with R2 decreasing from the <300 to >600 mm yr−1 class (Table 1). The decreased R2 indicates that the changes in yield, ET, and WUE are more sensitive to the changes in annual precipitation, and natural precipitation is critical to crop growth and yield improvement under dry climatic conditions. Notably, for precipitation class <300 mm yr−1, ET increased more sharply than crop production with increasing annual precipitation (Figure 2). The highest WUE was found in the precipitation class of 300–600 mm yr−1, which was significantly higher than that of the <300 and >600 mm yr−1 classes (Table 1). WUE decreased slightly when annual precipitation was <300 mm yr−1, after which WUE increased sharply to a rather high level and then decreased. The relationship between annual rainfall level and WUE was not as clear as that between annual rainfall and crop production (Figure 2). For precipitation classes of <300 and >600 mm yr−1, the correlations between WUE and annual precipitation were significant, whereas it was insignificant for the precipitation class of 300–600 mm yr−1 (Table 1).

3.2. Crop Production and Water Use Changes under CA

For all CA tillage practices, the increase in yield was in the order of NTs> RTs > Ss> CTs > RT > NT. NT and RT were the only two CA management strategies which caused yield decline (Figure 3a). Notably, production improvements in NTs were not significantly different from those of RTs and Ss (p > 0.05) but were significantly higher compared to CTs (p < 0.05). CA practices generally caused neutral (NT, CTs, RTs) to positive changes (NTs, Ss) for ET, except that a significant reduction was observed for RT (p < 0.05, Figure 3b). The increase in ET was in the order of RTs > NTs > Ss > CTs > NT > RT. WUE under NT decreased compared with CT, while CTs, NTs, and Ss improved WUE significantly (p < 0.05, Figure 3c). Although WUE under RTs was higher than that under RT, both were not significantly different from CT (p > 0.05). The increase in WUE was in the order of NTs > CTs > Ss > RTs > RT > NT (Figure 3a).

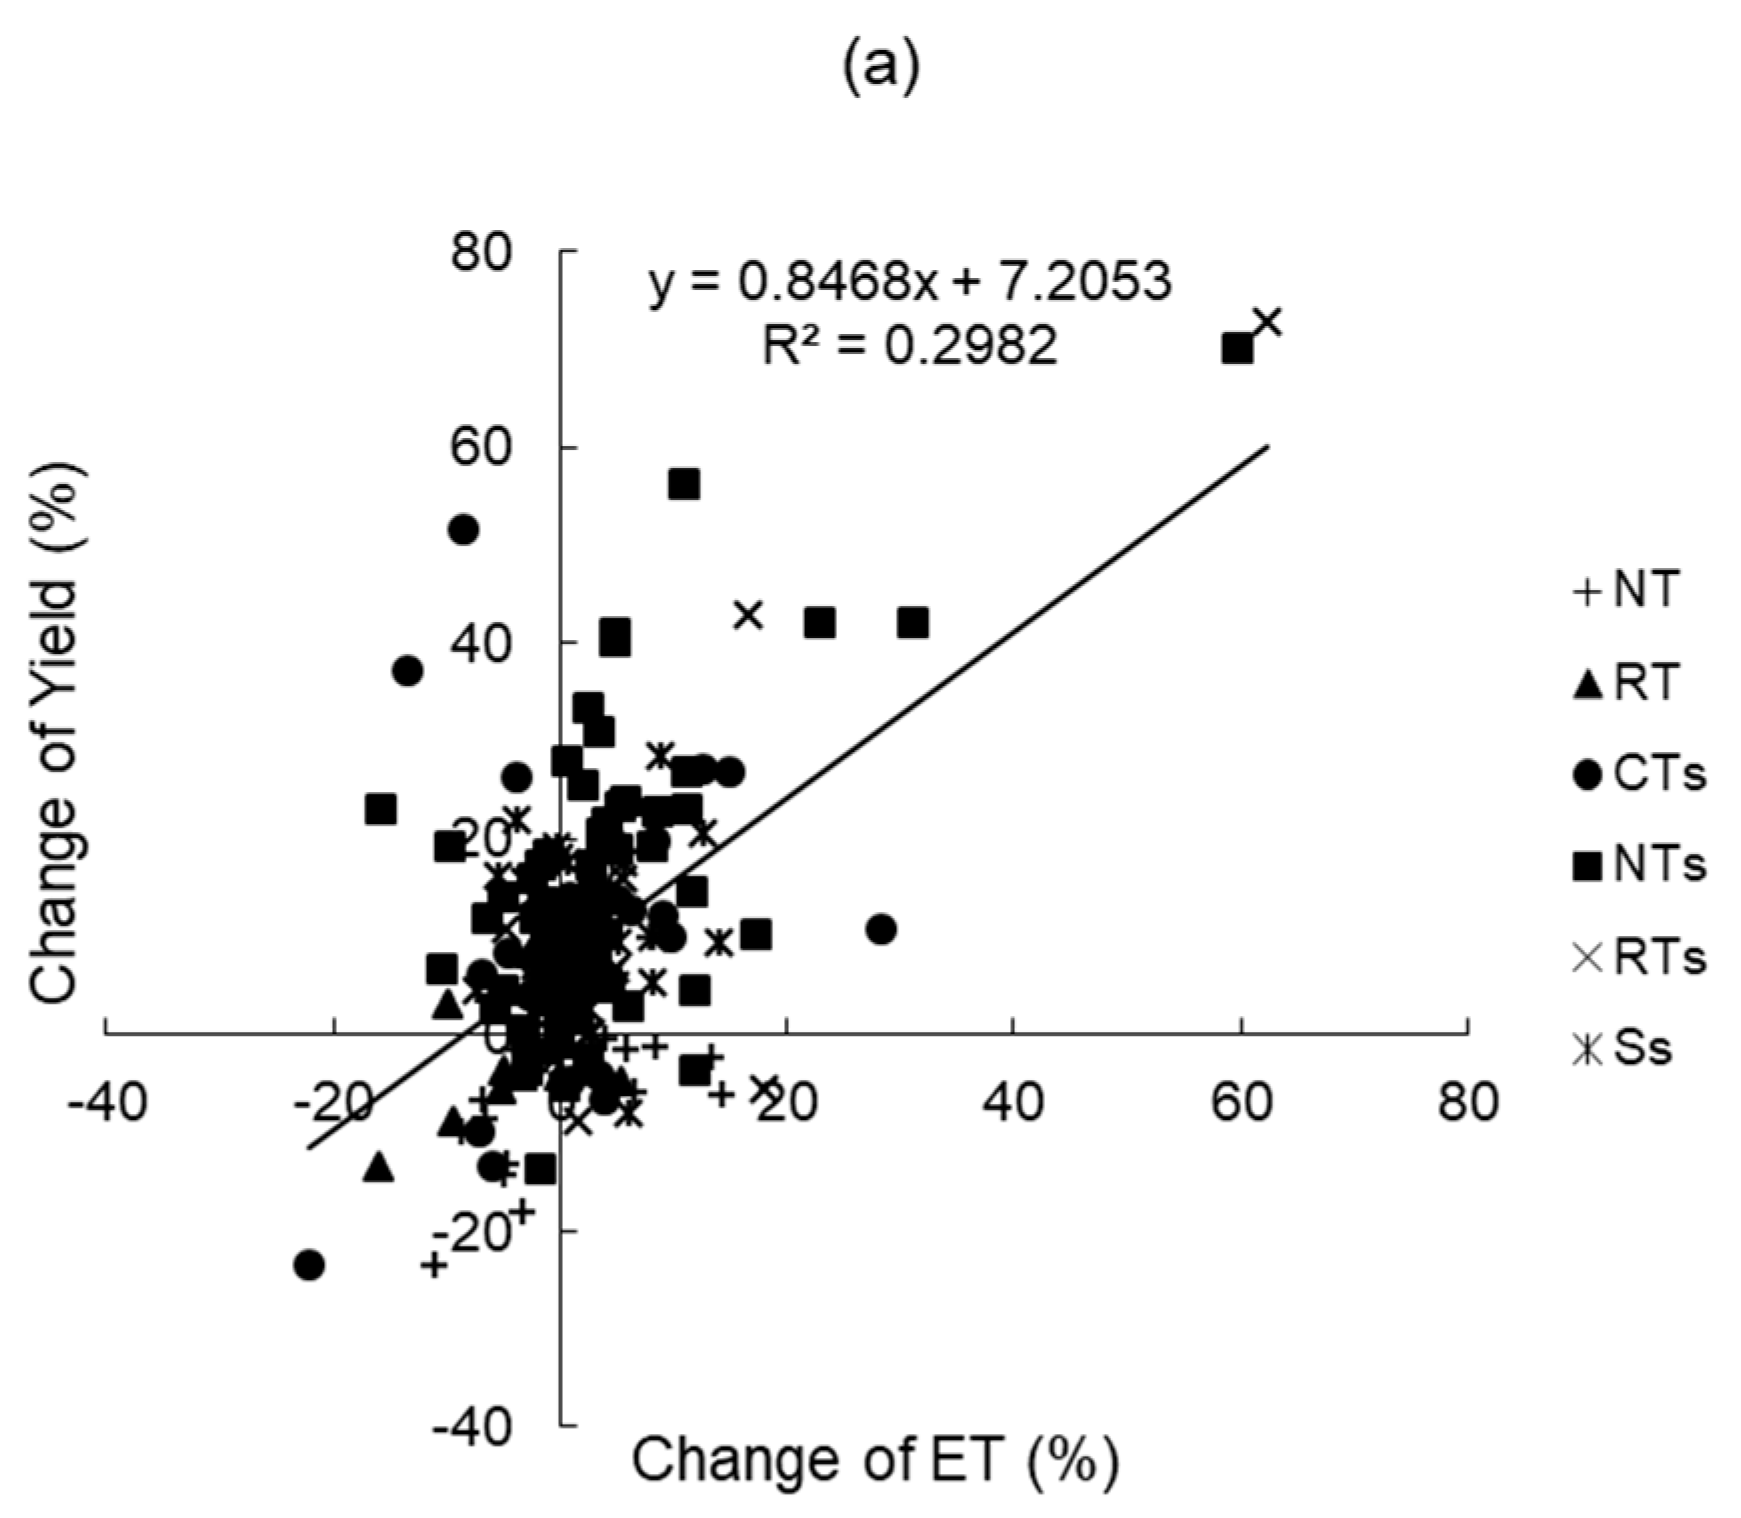
3.3. Relationships of Changes of Yield, WUE, ET under CA Practices

Changes in ET were plotted against changes in crop production (Figure 4a). It was found that there was a weak but significant correlation (p < 0.05). When the changes in WUE were plotted against changes in yield (Figure 4b), a significantly positive relationship was observed (p < 0.001). No significant relationship was found for changes in ET and changes in WUE (p > 0.05). The R2 of the correlation between ET and yield is 0.30, indicating that the changes of yield can only partially be explained by ET. The R2 of correlation between yield and WUE is 0.50, which is much higher than that between ET and WUE (0.008, Figure 4). Such results are generally in line with a previous study in this area [3]. It appears that the impact of yield on changes in WUE is more important than ET, because the overall changing range of yield is wider than that of ET (Figure 2).

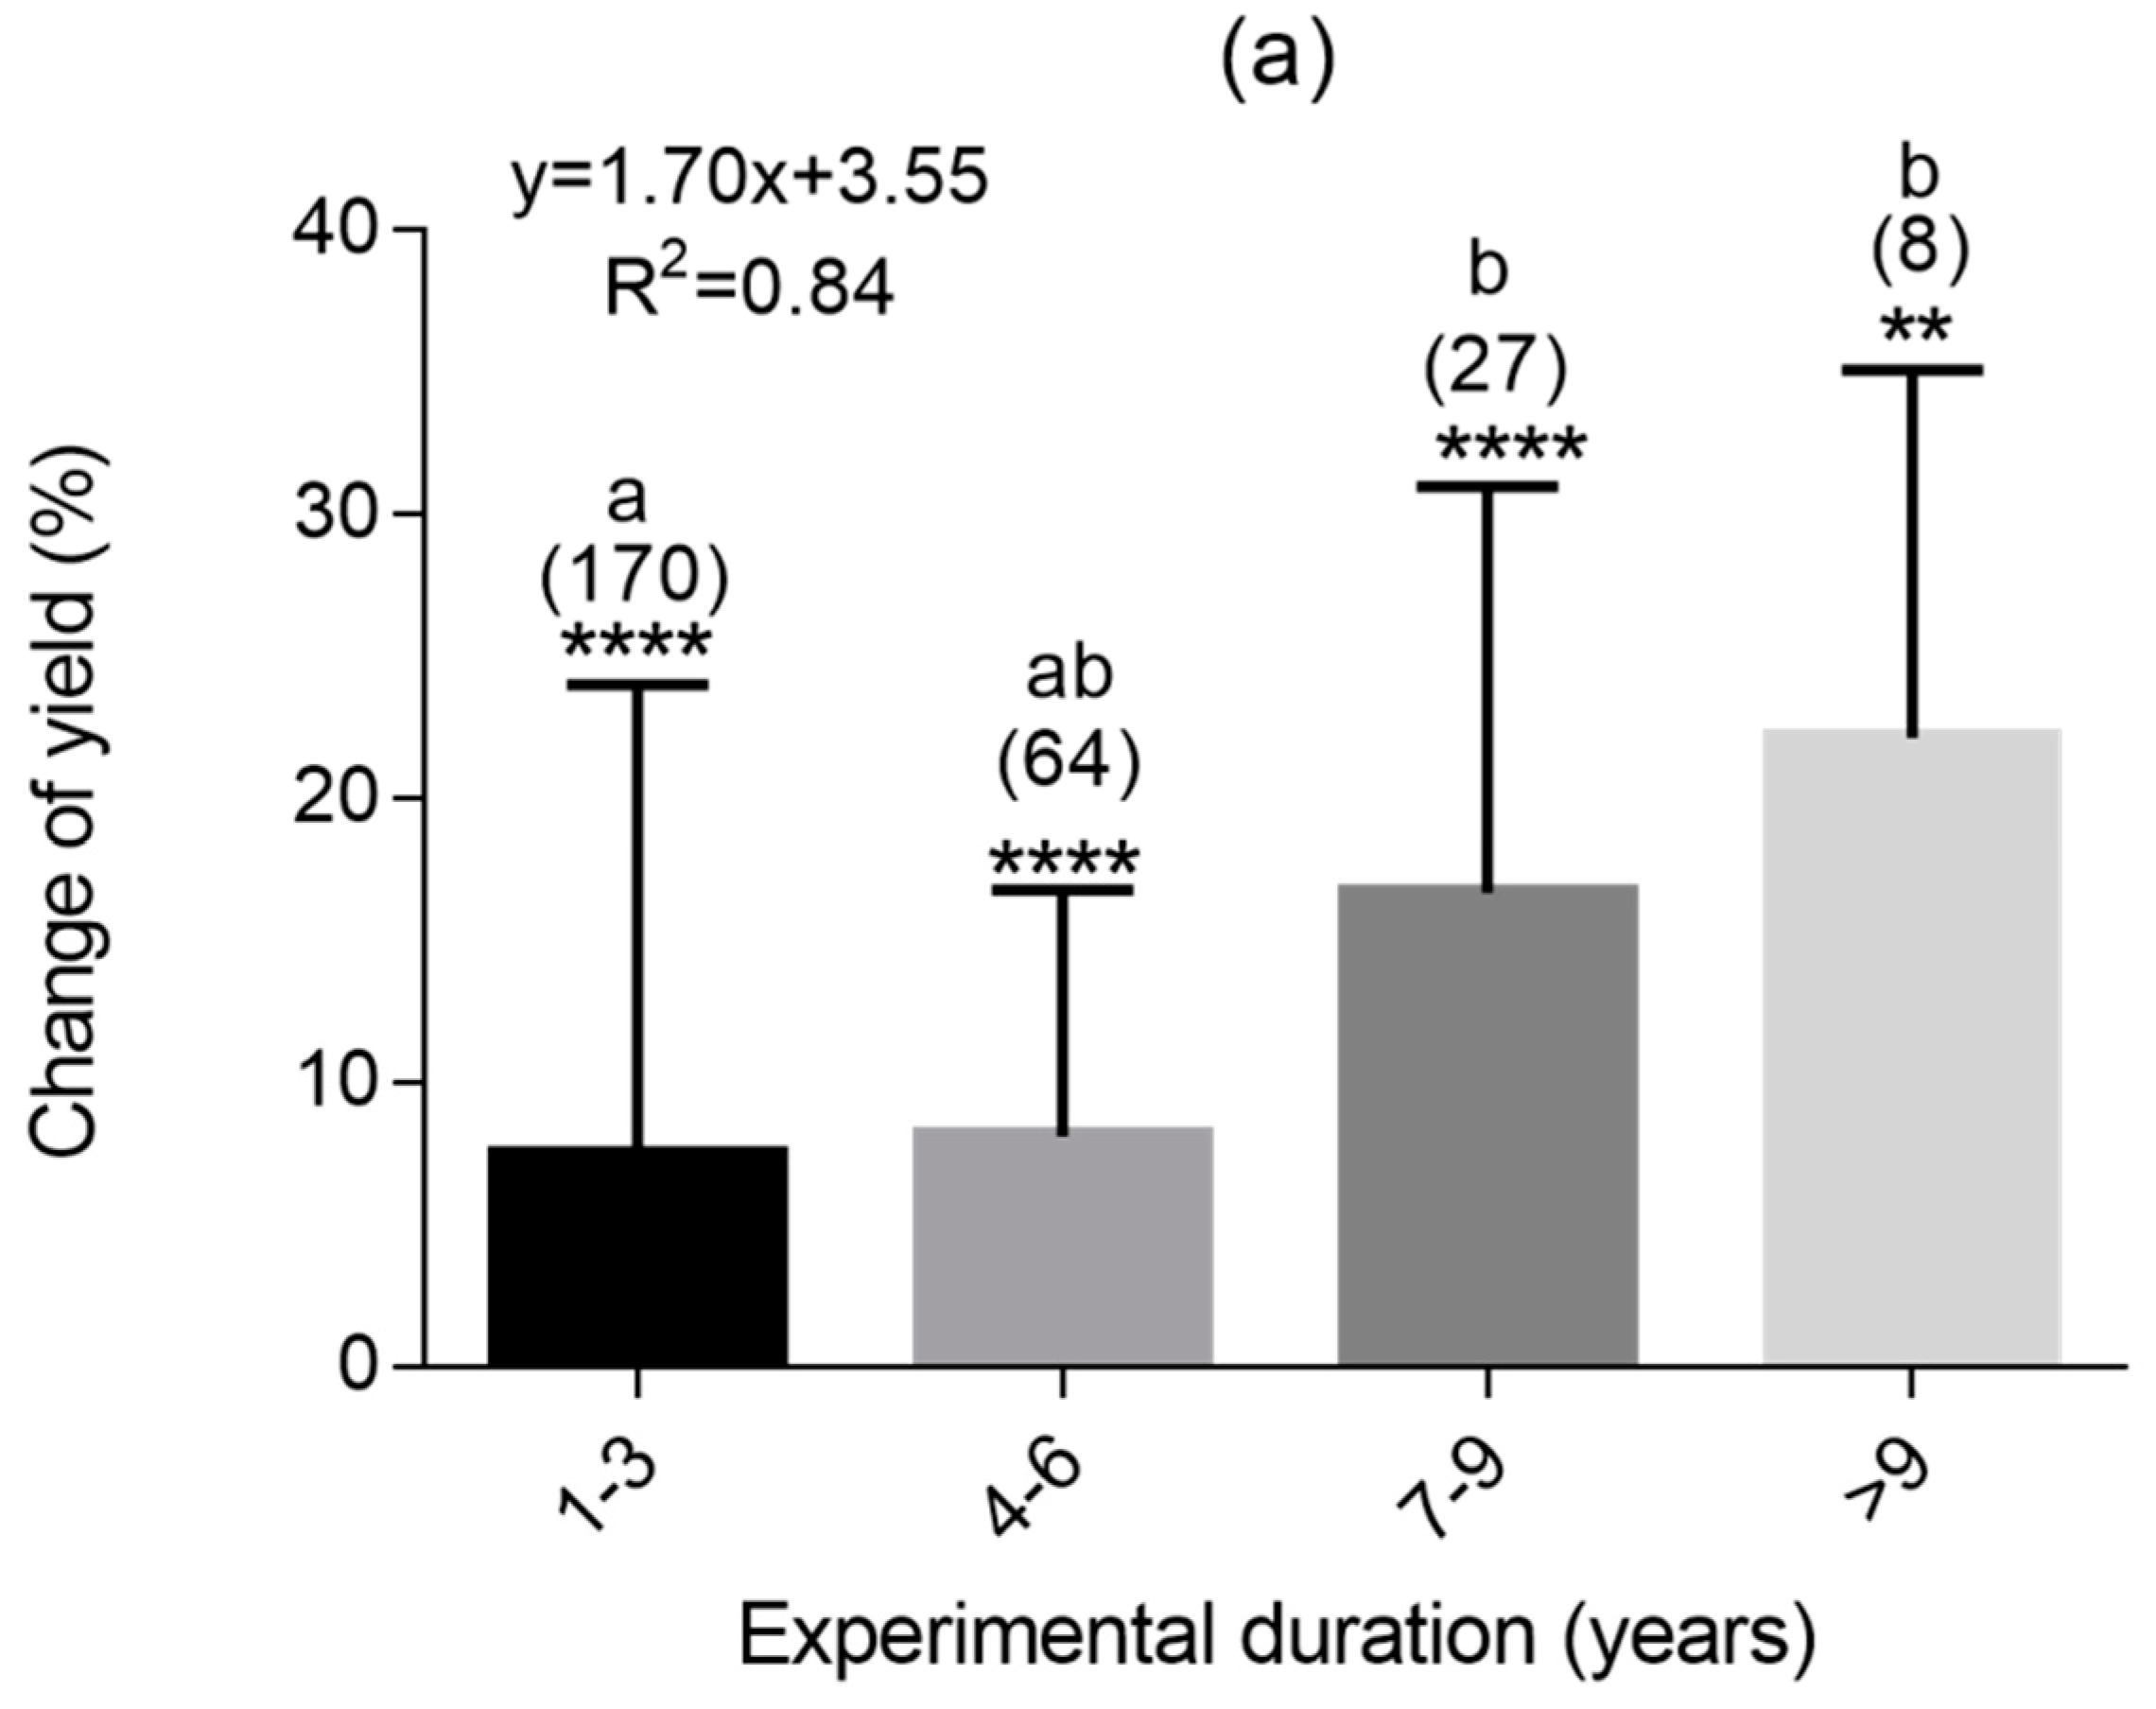
3.4. Effects of Water Storage and Tillage Duration on Crop Production

The water storage under CA was significantly higher than CT (p < 0.001), and the changes in water storage were positively correlated to changes in crop production ((p < 0.001, Figure 5). Positive impacts of experimental duration on crop production, ET, and WUE were observed as duration increased (Figure 6). However, statistical tests suggested that increases were not significantly different for WUE and ET (p > 0.05). For crop production, the increase in crop production with durations of >6 years was significantly higher compared to those with durations < 3 years (p < 0.05). Furthermore, the fitted slope of the regression function was in the order of yield > WUE > ET (Figure 6).

4. Discussion

4.1. Role of Annual Precipitation in Crop Production and Water Use

Separating precipitation into different classes allowed us to investigate the changing trends of crop production as well as water use in different climate conditions in the Loess Plateau. Crop production was closely related to annual precipitation in the Loess Plateau. These results illustrate that rainfall is the main constraint factor for crop production, and annual precipitation is critical in crop production [5,7]. For the precipitation class of <300 mm yr−1, crop production increased slightly. However, as the precipitation increased from 300 to 600 mm yr−1, the crop production increased significantly. The result suggests that 300 mm yr−1 of annual precipitation is the threshold to avoid extremely low crop production in the Chinese Loess Plateau. For areas with precipitation >600 mm yr−1, crop production reaches the peak of the Loess Plateau and decreases insignificantly as precipitation continues to increase (Figure 2a, Table 1), indicating that the continuous increase in annual precipitation could not lead to further improvement of crop production. One possible reason is that the high precipitation in some of the regions of the Loess Plateau may lead to water logging and thus inhibit the root respiration [35], which further limits crop growth and crop production. Therefore, the most favorable annual precipitation level in the Loess Plateau for better crop production is around 600 mm yr−1 and the highest crop production recorded in the study is around 5.5 Mg ha−1 under Ss and CTs.
Generally, ET was positively related to precipitation, indicating that annual precipitation plays an important role in determining ET. The higher ET in areas/years with more annual precipitation could be attributed to the higher water storage and thus the higher evaporation and transpiration [28,36]. Notably, the lowest ET was observed in the precipitation class of 300–600 mm yr−1, rather than the precipitation class of <300 mm yr−1. Considering the fact that ET is composed of evaporation and transpiration, it indicates that a large part of water stored in soil is evaporated rather than transpired during growth seasons in the regions with the precipitation class of <300 mm yr−1 [4,5]. The evaporation in these regions is likely much higher than that of regions with a precipitation class of 300–600 mm yr−1, leading to an overall higher ET. Due to the dry climate conditions, the higher evaporation but lower transpiration in regions with the precipitation class of <300 mm yr−1, however, consequently decreases the crop production [5]. The relationship between WUE and precipitation varied as the precipitation increased. For the precipitation class of <300 mm yr−1, a decline in WUE was observed as precipitation increased. The negative relationship between WUE and precipitation is due to the increase in crop production is much less compared to the increase in ET with increasing annual precipitation in these areas (Figure 2). The contrasting trends of increased yield and decreased WUE indicate that WUE is not always positively related to crop production. In addition, the areas with the highest crop production had the highest WUE, but the WUE could be very low for areas with the highest precipitation and ET. The low WUE is because crop yield stabilizes or even declines at high rainfall levels but ET continues to increase. The relative stability of crop yield could be attributed to the fact that the yield reached the maximum productivity potential [5,7], and the slight decrease in yield is possibly due to water logging in some wet regions, such as the southeastern part of the Loess Plateau [35]. The lower sunlight availability might also be a possible reason for the lower productivity in the wet regions [37]. The increase in ET with increasing precipitation might be attributed to the fact that annual precipitation is positively related to average annual temperature in the Loess Plateau [38,39]. For regions with high precipitation, the high temperature may lead to higher evaporation and therefore ET. Overall, crop yield declines but ET keeps increasing in high precipitation scenarios and, consequently, WUE as the ratio of yield to ET becomes relatively low.

4.2. Crop Production and Water Use under CA Practices

Tillage practices with straw mulching generally had better performance in terms of crop production and WUE compared to that without straw mulching in the Loess Plateau (Figure 3a). This illustrates that straw mulching should be applied first in order to gain more grains in this area [30]. Furthermore, crop production by adopting CTs was significantly higher than that of two tillage practices without residue retention, i.e., CT and RT, but was significantly lower than NTs that combined tillage reduction and residue retention (Figure 3a). This indicates that tillage reduction of NT is still necessary to combine with straw mulching to obtain a higher production of crop, despite the relative importance of straw mulching being higher than tillage reduction [26,30]. NTs and Ss were the only two practices that had positive effects on ET. Notably, ET is composed of evaporation and transpiration but crop production is tightly related to transpiration rather than evaporation [32,40]. The improvement of crop production in dry-farming systems is achieved by maximizing available soil water to transpiration, and the most essential target for crop production increase in water limited environment is to divert soil moisture capture for transpiration which has been regarded as the key part of water use for crop growth and production improvement [32]. We can infer that NTs and Ss could increase ET through increasing transpiration rather than evaporation (Equations (2) and (3)).
W U E 1 = Y i e l d ET = m W U E , T T E + T
W U E 2 = b m W U E , T T a E + b T
where WUE1 is the WUE of CT and WUE2 is the WUE of CA when comparing different tillage practices. WUE1 and WUE2 could also represent WUE during the initial period of the experiment and after a long-term experiment when investigating duration impact on WUE changes. mWUE,T is a factor for transpiration to determine the yield according to Sinclair et al. [41]. E is evaporation and T is transpiration. The partition of ET to E and T follows the equation proposed by Gilbert and Hernandez (2019). a (>0) and b (>0) are parameters representing the changes in E and T after the adoption of CA or over a long-term experiment.
Assuming that b is >1 (increase):
  • If a = b, then WUE1 = WUE2, indicating no change in WUE due to the equal increase in E and T;
  • If a > b, then WUE1 > WUE2, indicating a decrease in WUE due to the greater increase in E than T;
  • If a < b, then WUE1 < WUE2, indicating an increase in WUE due to the greater increase in T than E.
In all these cases, the increase in transpiration (b > 1) will lead to the increase in crop production. However, if b < 1 (decrease), the changes in WUE are still decided by the relationship of a and b listed above, but crop production will decline in any scenario. Particularly, although WUE may be greater after the adoption of CA or after a long-term experiment, crop production will decline due to the decreased transpiration (a< b < 1).
The theoretical analysis could be used to help investigate how CA affects water use and thus crop production. Indeed, we observed that the adoption of CTs, NTs, and Ss significantly increased WUE, whereas NT significantly decreased WUE. Considering that CTs, NTs, and Ss led to an increase in crop production, it suggests that CTs, NTs, and Ss have enormous benefits for regulating E/T ratio by increasing transpiration (b > 1), which further leads to increases in ET, yield, and WUE. Several processes may be involved in the changes in E/T. Firstly, the application of straw mulching can profoundly improve soil water content compared to CT by reducing water loss in the form of runoff [24,42,43]. Secondly, straw mulching can significantly reduce the evaporation compared to the bare surface of CT (a < 1), especially during the initial growth stage when the canopy is not well developed [9,44]. Thirdly, mulching can increase the crop canopy and the root depth through preserving water and nutrients, which further diverts available water in deep soil layers towards productive transpiration [40,45]. Increased ET on the one hand and increased yield (b > 1) and WUE (a < b) on the other illustrate that the greater increase in productive transpiration than evaporation plays a critical role in terms of increasing ET under CTs, NTs, and Ss, which further causes beneficial changes in crop production. Despite the insignificant increase in ET under CTs and RTs (Figure 3b), the increased crop production indicates that both tillage practices can increase the productive transpiration (b > 1) because the yields were increased under the two tillage practices; the increase in transpiration is possibly not as high as that under NTs and Ss though. RT was the only practice that had a significantly negative impact on ET. Although we could not identify how RT regulates E/T ratios, we speculate that RT has negative impact on changes in transpiration (b < 1) due to its poor water storage ability [46], which further leads to the decrease in crop production (Figure 2a).

4.3. Impacts of Prolonged Duration on Yield and Water Use

Actually, previous studies have investigated the changes in crop production with increasing experimental duration [22,30]. However, the responses of water use such as ET and WUE to increased duration, to the best of our knowledge, are still lacking. Assessing responses of yield and water use to long-term application of CA simultaneously may provide an opportunity to identify how water use impacts yield improvement. Crop production changes after adopting CA increased with increasing experimental duration, which is in good accordance with a previous study [22]. By adopting one-way ANOVA, we further demonstrate that the increase in crop production for experiments with durations >6–9 years was significantly higher than experiments with durations <3 years, and the increase in yield for experiments with durations >9 years was also higher than that <3 years (Figure 6). This indicates that, although the adoption of CA has an immediate beneficial impact on crop production, continuous application of CA is needed to obtain a further increase in crop production on the basis of the initial crop production increase [26]. ET and WUE were positively related to the experimental duration. However, the changes were not significant among different experimental duration classes. One possible reason is that the number of data of ET and WUE was not enough to support them to pass statistical tests. Nevertheless, the trends of continuous increases in ET and WUE in the long term deserve more attention [22]. From the perspective of mathematics, considering that WUE is calculated as yield/ET, the simultaneous increase in all three indexes with increasing experimental duration, particularly the increase in WUE, indicates that the increase in crop production is greater than that of ET in the long term. Indeed, our results confirm the hypothesis that the fitted slope of the regression function of yield and experimental duration would be steeper than that of ET and experimental duration (1.70 for crop production vs. 0.44 for ET, Figure 6). Since the increasing rate of yield was greater than that of ET over the long-term experiment, it consequently leads to the increase in WUE. We can also infer that the increase in ET should probably be attributed to the greater increase in productive transpiration compared to non-productive evaporation [32]. Otherwise, if the increase in non-productive evaporation was greater, the slope of the regression function between yield and experimental duration would be no steeper than that of ET, and WUE would decrease rather than increase over the long-term experiment (see Equations (2) and (3)).
Overall, in addition to the previously reported increase in yield over the prolonged experimental duration, the results further demonstrate the positive impact of duration on water use. The results indicate that, very likely, the application of long-term CA practice may significantly increase transpiration, which represents a critical role in the increase in ET, yield, and WUE.

4.4. Limitations of Understanding Relationship of Water Use and Crop Production

The changes in crop production are closely related to the changes in WUE, which seems simply to point toward the conclusion that CA practices can increase crop production through increasing WUE or vice versa (Figure 4a). The higher correlation between WUE and crop yield than that between WUE and ET was maybe due to the coupling of yield and ET, because ET is closely related to stomatal conductance/stomatal closure [47]. However, productivity and therefore crop yield may be limited by a variety of factors [48] and does not necessarily respond directly to an instantaneous change in stomatal conductance/closure. A similar conclusion has been reported based on the relationship between WUE and yield in other studies [3]. However, it should be noted that WUE is the ratio of crop production and ET. Plotting grain yield versus WUE that is calculated from yield and ET means that the X axis values and Y axis values shared the same data of yield, which can mathematically result in spurious correlations [49]. Similarly, it would also cause spurious correlations by plotting ET and WUE, which share the same component of ET. It is only reasonable to plot crop production to ET, which was identified separately and did not share the yield data. We found a significant relationship between changes in ET and changes in yield. However, the R2 is less than 0.3, indicating that the change in ET cannot ideally explain the change in crop production.
It should be noted that, as the decisive factor, increased transpiration leads to increased yield and vice versa, but increased WUE does not necessarily relate to increased yield [32]. As mentioned above, if evaporation and transpiration both decrease but the decrease in evaporation is greater than transpiration, it will lead to an increased WUE but a decreased yield. Moreover, if evaporation and transpiration both increase but the increase in evaporation is greater than transpiration, it will lead to a decrease in WUE but an increase in crop production (Equations (2) and (3)). The second assumption has been verified by the changes in yield, ET, and WUE when annual rainfall is <300 mm yr−1 in this study (Figure 2). Although we could not identify changes in evaporation and transpiration separately from Figure 2, we can infer that the increase in transpiration is lower than evaporation when annual precipitation is < 300 mm yr−1: the increasing rate of yield with increasing annual precipitation could be regarded as the increasing rate of transpiration (Equation (2)), which is much lower than that of ET. Only a greater increase in evaporation than ET can result in a higher increasing rate of ET than transpiration, i.e., if a > 0, b > 1, b < c, a × E + b × T > c × ET, then a > c > b, where c represents the increase in ET and the meaning of a, b, E, T could be found in Equations (2) and (3).
Overall, considering the inconsistent changes in yield and WUE in certain scenarios, rather than increased WUE, a higher transpiration that is directly related to crop production should be the target of tillage management.
Although the relationship between ET and crop production changes has been widely investigated [2,3,50,51], the interpretation of such a relationship must be cautious. For example, the insignificant increase in ET under the combination of straw mulching with CT and RT (i.e., CTs, RTs) does not mean that the influences of residue retention through ET on increasing production are negligible (Figure 3b). Rather, the application of straw mulching is very likely to increase crop production through affecting ET, i.e., regulating the ratio between evaporation and transpiration [4]. Even though ET does not change significantly, the adoption of straw mulching efficiently transforms the evaporation into transpiration and thus increases effective water use and grain yield [40]. Unfortunately, this important progress could not be reflected by the use of ET. Although Equations (2) and (3) provide a new perspective to analyze how CA regulates transpiration, they fail to verify how evaporation changes after the adoption of CA. The decreased evaporation under CA such as NTs and Ss is based on speculations rather than solid data. Therefore, it is urgently necessary to quantitatively separate transpiration and evaporation in order to clearly demonstrate the mechanisms of how different tillage practices affect crop production. Although transpirational water use is not that easily identified at field scales, it would be very useful to deepen our assessment of how water use determines crop production [49]. There are also alternative indexes to evaluate water use level such as total available water or soil water storage. Unlike the widely recorded WUE in most studies [3,28,46], there were not too many studies that reported the changes in water storage after conversion from CT to CA in the Loess Plateau. The data collected from limited studies illustrate that NTs has beneficial impacts on water storage, and consequently, the increased water storage results in crop production improvement [52]. It seems that water storage should be given more credit in addition to the investigation of ET and WUE, because water stored in soil is the basis for evaporation and transpiration.

4.5. Limitations of This Study

Although WUE and ET are the most frequently investigated indexes regarding water use in the Loess Plateau, the lack of data related directly to transpiration prevented us from obtaining a more solid relationship between effective use of water and crop yield. Furthermore, WUE and ET were controlled by a range of factors including climate, crop type, hydrology, soil type, duration of CA, etc. [48,53,54]. Due to the lack of relevant data, we only investigated the impacts of precipitation and experimental duration on WUE and ET. The other factors should be investigated systematically in the future when more data are available. In addition, the Loess Plateau can only represent the arid and semi-arid climatic conditions in China. Whether the conclusions obtained from this area could be applied to other regions deserves more attention and further investigation by compiling more data at a national or even global scale.

5. Conclusions

Annual precipitation represents a critical factor determining crop production, ET, and WUE in the semi-arid Loess Plateau. Basically, the most favorable precipitation for crop production is around 600 mm yr−1 and annual precipitation of 300 mm yr−1 is the threshold to obtain relatively high crop production in this area. Considering that rainwater is very limited in this area, efficiently using water represents an essential aspect to gain more grains by adopting reasonable CA management strategies. This study illustrates that although straw mulching is more critical than tillage reduction in this area, tillage reduction of NT is still necessary to combine with straw mulching to obtain a higher production of crop. Furthermore, crop production and water use level continued to increase as experimental duration increased, indicating that longer term of application of CA is necessary for better use of water and further improvement of crop production. The increase in transpiration is critical for crop production improvement. We argue that WUE cannot be directly related to crop production due to the fact they are not independent in terms of mathematic calculation. Higher transpiration rather than increased WUE should be the target for crop production, because an increase in WUE does not necessarily lead to an increase in yield. ET positively but weakly impacts crop production, which indicates that it is not an ideal indicator to reflect the mechanism of how CA regulates E/T. This study highlights the necessity to obtain water use information including ET, WUE, and, more importantly, that directly related to effective use of water, such as transpiration.

Supplementary Materials

The following are available online at https://www.mdpi.com/2071-1050/12/18/7449/s1, Table S1: Summary of experiment information of studies used for the meta-analysis.

Author Contributions

Conceptualization, L.X. and R.Z. (Rongqing Zhao); methodology, L.X.; software, R.Z. (Ruiming Zhu); validation, L.X., M.D. and R.Z. (Rongqing Zhao); formal analysis, L.X.; investigation, L.X.; resources, L.X.; data curation, L.X.; writing—original draft preparation, L.X.; writing—review and editing, L.X., R.Z. (Rongqing Zhao), M.D., C.W., R.Z. (Ruiming Zhu); visualization, L.X.; supervision, R.Z. (Rongqing Zhao); project administration, L.X.; funding acquisition, L.X., R.Z. (Rongqing Zhao). All authors have read and agreed to the published version of the manuscript.

Funding

This research was funded by the Key Scientific Research Project of Colleges and Universities of Henan Province of China (21A210026) and the National Natural Science Foundation of China (41971241). And The APC was funded by the National Natural Science Foundation of China (41971241).

Acknowledgments

We thank two anonymous referees for their highly constructive comments.

Conflicts of Interest

The authors declare no conflict of interest.

References

  1. Austin, A.T. Has water limited our imagination for aridland biogeochemistry? Trends Ecol. Evol. 2011, 26, 229–235. [Google Scholar] [CrossRef]
  2. Sadras, V.O.; Angus, J.F. Benchmarking water-use efficiency of rainfed wheat in dry environments. Aust. J. Agric. Res. 2006, 57, 847–856. [Google Scholar] [CrossRef]
  3. Wang, L.F.; Shangguan, Z.P. Water-use efficiency of dryland wheat in response to mulching and tillage practices on the Loess Plateau. Sci. Rep. UK 2015, 5, 12225. [Google Scholar] [CrossRef]
  4. Zhang, S.L.; Sadras, V.; Chen, X.P.; Zhang, F.S. Water use efficiency of dryland maize in the Loess Plateau of China in response to crop management. Field Crops Res. 2014, 163, 55–63. [Google Scholar] [CrossRef]
  5. Zhang, S.L.; Sadras, V.; Chen, X.P.; Zhang, F.S. Water use efficiency of dryland wheat in the Loess Plateau in response to soil and crop management. Field Crops Res. 2013, 151, 9–18. [Google Scholar] [CrossRef]
  6. Zhang, J.; Jiang, H.; Song, X.; Jin, J.; Zhang, X. The responses of plant leaf CO2/H2O exchange and water use efficiency to drought: A meta-analysis. Sustainability 2018, 10, 551. [Google Scholar] [CrossRef] [Green Version]
  7. Kuhn, N.J.; Hu, Y.; Bloemertz, L.; He, J.; Li, H.; Greenwood, P. Conservation tillage and sustainable intensification of agriculture: Regional vs. global benefit analysis. Agric. Ecosyst. Environ. 2016, 216, 155–165. [Google Scholar] [CrossRef]
  8. Cook, H.F.; Valdes, G.S.; Lee, H.C. Mulch effects on rainfall interception, soil physical characteristics and temperature under Zea mays L. Soil Tillage Res. 2006, 91, 227–235. [Google Scholar] [CrossRef]
  9. Su, Z.; Zhang, J.; Wu, W.; Cai, D.; Lv, J.; Jiang, G.; Huang, J.; Gao, J.; Hartmann, R.; Gabriels, D. Effects of conservation tillage practices on winter wheat water-use efficiency and crop yield on the Loess Plateau, China. Agric. Water Manag. 2007, 87, 307–314. [Google Scholar] [CrossRef]
  10. Lal, R.; Stewart, B.A. Soil Water and Agronomic Productivity; CRC Press: Boca Raton, FL, USA, 2012. [Google Scholar]
  11. Ogle, S.M.; Swan, A.; Paustian, K. No-till management impacts on crop productivity, carbon input and soil carbon sequestration. Agric. Ecosyst. Environ. 2012, 149, 37–49. [Google Scholar] [CrossRef]
  12. Rusinamhodzi, L.; Corbeels, M.; Van Wijk, M.T.; Rufino, M.C.; Nyamangara, J.; Giller, K.E. A meta-analysis of long-term effects of conservation agriculture on maize grain yield under rain-fed conditions. Agron. Sustain. Dev. 2011, 31, 657. [Google Scholar] [CrossRef] [Green Version]
  13. Van den Putte, A.; Govers, G.; Diels, J.; Gillijns, K.; Demuzere, M. Assessing the effect of soil tillage on crop growth: A meta-regression analysis on European crop yields under conservation agriculture. Eur. J. Agron. 2010, 33, 231–241. [Google Scholar] [CrossRef]
  14. Lal, R. Soil carbon sequestration impacts on global climate change and food security. Science 2004, 304, 1623–1627. [Google Scholar] [CrossRef] [Green Version]
  15. Baker, J.M.; Ochsner, T.E.; Venterea, R.T.; Griffis, T.J. Tillage and soil carbon sequestration—What do we really know? Agric. Ecosyst. Environ. 2007, 118, 1–5. [Google Scholar] [CrossRef]
  16. Leys, A.; Govers, G.; Gillijns, K.; Poesen, J. Conservation tillage on loamy soils: Explaining the variability in interrill runoff and erosion reduction. Eur. J. Soil Sci. 2007, 58, 1425–1436. [Google Scholar] [CrossRef]
  17. Xiong, M.; Sun, R.; Chen, L. Effects of soil conservation techniques on water erosion control: A global analysis. Sci. Total Environ. 2018, 645, 753–760. [Google Scholar] [CrossRef]
  18. He, J.; Wang, Q.; Li, H.; Tullberg, J.; McHugh, A.; Bai, Y.; Zhang, X.; McLaughlin, N.; Gao, H. Soil physical properties and infiltration after long-term no-tillage and ploughing on the Chinese Loess Plateau. N. Z. J. Crop Hortic. Sci. 2009, 37, 157–166. [Google Scholar] [CrossRef] [Green Version]
  19. Martínez, E.; Fuentes, J.-P.; Silva, P.; Valle, S.; Acevedo, E. Soil physical properties and wheat root growth as affected by no-tillage and conventional tillage systems in a Mediterranean environment of Chile. Soil Tillage Res. 2008, 99, 232–244. [Google Scholar] [CrossRef]
  20. Neugschwandtner, R.W.; Kaul, H.-P. Sowing ratio and N fertilization affect yield and yield components of oat and pea in intercrops. Field Crops Res. 2014, 155, 159–163. [Google Scholar] [CrossRef]
  21. Powlson, D.S.; Stirling, C.M.; Jat, M.L.; Gerard, B.G.; Palm, C.A.; Sanchez, P.A.; Cassman, K.G. Limited potential of no-till agriculture for climate change mitigation. Nat. Clim. Chang. 2014, 4, 678–683. [Google Scholar] [CrossRef]
  22. Zheng, C.; Jiang, Y.; Chen, C.; Sun, Y.; Feng, J.; Deng, A.; Song, Z.; Zhang, W. The impacts of conservation agriculture on crop yield in China depend on specific practices, crops and cropping regions. Crop J. 2014, 2, 289–296. [Google Scholar] [CrossRef] [Green Version]
  23. Pittelkow, C.M.; Liang, X.Q.; Linquist, B.A.; van Groenigen, K.J.; Lee, J.; Lundy, M.E.; van Gestel, N.; Six, J.; Venterea, R.T.; van Kessel, C. Productivity limits and potentials of the principles of conservation agriculture. Nature 2015, 517, 365–368. [Google Scholar] [CrossRef]
  24. Kader, M.; Senge, M.; Mojid, M.; Ito, K. Recent advances in mulching materials and methods for modifying soil environment. Soil Tillage Res. 2017, 168, 155–166. [Google Scholar] [CrossRef]
  25. Alvarez, R.; Steinbach, H. A review of the effects of tillage systems on some soil physical properties, water content, nitrate availability and crops yield in the Argentine Pampas. Soil Tillage Res. 2009, 104, 1–15. [Google Scholar] [CrossRef]
  26. Zhao, X.; Liu, S.; Pu, C.; Zhang, X.; Xue, J.; Ren, Y.; Zhao, X.; Chen, F.; Lal, R.; Zhang, H. Crop yields under no-till farming in China: A meta-analysis. Eur. J. Agron. 2017, 84, 67–75. [Google Scholar] [CrossRef]
  27. Edreira, J.I.R.; Guilpart, N.; Sadras, V.; Cassman, K.G.; van Ittersum, M.K.; Schils, R.L.; Grassini, P. Water productivity of rainfed maize and wheat: A local to global perspective. Agric. For. Meteorol. 2018, 259, 364–373. [Google Scholar] [CrossRef]
  28. He, J.; Li, H.; McHugh, A.; Ma, Z.; Cao, X.; Wang, Q.; Zhang, X.; Zhang, X. Spring wheat performance and water use efficiency on permanent raised beds in arid northwest China. Soil Res. 2008, 46, 659–666. [Google Scholar] [CrossRef]
  29. Rockström, J.; Lannerstad, M.; Falkenmark, M. Assessing the water challenge of a new green revolution in developing countries. Proc. Natl. Acad. Sci. USA 2007, 104, 6253–6260. [Google Scholar] [CrossRef] [Green Version]
  30. Xiao, L.; Zhao, R.; Kuhn, N.J. Straw mulching is more important than no tillage in yield improvement on the Chinese Loess Plateau. Soil Tillage Res. 2019, 194, 104314. [Google Scholar] [CrossRef]
  31. Zhang, H.; Oweis, T. Water–yield relations and optimal irrigation scheduling of wheat in the Mediterranean region. Agric. Water Manag. 1999, 38, 195–211. [Google Scholar] [CrossRef]
  32. Blum, A. Effective use of water (EUW) and not water-use efficiency (WUE) is the target of crop yield improvement under drought stress. Field Crops Res. 2009, 112, 119–123. [Google Scholar] [CrossRef]
  33. Liu, S.; Luo, G.; Wang, H. Temporal and Spatial Changes in Crop Water Use Efficiency in Central Asia from 1960 to 2016. Sustainability 2020, 12, 572. [Google Scholar] [CrossRef] [Green Version]
  34. Aguilos, M.; Stahl, C.; Burban, B.; Hérault, B.; Courtois, E.; Coste, S.; Wagner, F.; Ziegler, C.; Takagi, K.; Bonal, D. Interannual and seasonal variations in ecosystem transpiration and water use efficiency in a tropical rainforest. Forests 2019, 10, 14. [Google Scholar] [CrossRef] [Green Version]
  35. Li, P.; Qian, H. Water resource development and protection in loess areas of the world: A summary to the thematic issue of water in loess. Environ. Earth Sci. 2018, 77, 796. [Google Scholar] [CrossRef]
  36. Jin, K.; Sleutel, S.; Buchan, D.; De Neve, S.; Cai, D.; Gabriels, D.; Jin, J. Changes of soil enzyme activities under different tillage practices in the Chinese Loess Plateau. Soil Tillage Res. 2009, 104, 115–120. [Google Scholar] [CrossRef]
  37. Gao, X.; Gu, F.; Mei, X.; Hao, W.; Li, H.; Gong, D.; Li, X. Light and water use efficiency as influenced by clouds and/or aerosols in a rainfed spring maize cropland on the loess plateau. Crop Sci. 2018, 58, 853–862. [Google Scholar] [CrossRef]
  38. Zhou, L.-M.; Li, F.-M.; Jin, S.-L.; Song, Y. How two ridges and the furrow mulched with plastic film affect soil water, soil temperature and yield of maize on the semiarid Loess Plateau of China. Field Crops Res. 2009, 113, 41–47. [Google Scholar] [CrossRef]
  39. Liang, H.; Xue, Y.; Li, Z.; Wang, S.; Wu, X.; Gao, G.; Liu, G.; Fu, B. Soil moisture decline following the plantation of Robinia pseudoacacia forests: Evidence from the Loess Plateau. For. Ecol. Manag. 2018, 412, 62–69. [Google Scholar] [CrossRef]
  40. Ding, D.; Zhao, Y.; Feng, H.; Hill, R.L.; Chu, X.; Zhang, T.; He, J. Soil water utilization with plastic mulching for a winter wheat-summer maize rotation system on the Loess Plateau of China. Agric. Water Manag. 2018, 201, 246–257. [Google Scholar] [CrossRef]
  41. Sinclair, T.R.; Tanner, C.; Bennett, J. Water-use efficiency in crop production. Bioscience 1984, 34, 36–40. [Google Scholar] [CrossRef]
  42. Prosdocimi, M.; Tarolli, P.; Cerdà, A. Mulching practices for reducing soil water erosion: A review. Earth-Sci. Rev. 2016, 161, 191–203. [Google Scholar] [CrossRef]
  43. Barton, A.; Fullen, M.; Mitchell, D.; Hocking, T.; Liu, L.; Bo, Z.W.; Zheng, Y.; Xia, Z.Y. Effects of soil conservation measures on erosion rates and crop productivity on subtropical Ultisols in Yunnan Province, China. Agric. Ecosyst. Environ. 2004, 104, 343–357. [Google Scholar] [CrossRef]
  44. Li, J.; Tan, Z.; Ding, Z.; Zhang, J.; Wu, J.; Yang, N.; Yao, Y. Study on wheat and corn yields, soil carbon and water under ridge culture with straw mulch. J. Henan Agric. Sci. 2012, 41, 68–72. [Google Scholar]
  45. Dunin, F.; Passioura, J. Prologue: Amending agricultural water use to maintain production while affording environmental protection through control of outflow. Aust. J. Agric. Res. 2006, 57, 251–255. [Google Scholar] [CrossRef] [Green Version]
  46. Jin, K.; Cornelis, W.M.; Schiettecatte, W.; Lu, J.; Yao, Y.; Wu, H.; Gabriels, D.; De Neve, S.; Cai, D.; Jin, J. Effects of different management practices on the soil–water balance and crop yield for improved dryland farming in the Chinese Loess Plateau. Soil Tillage Res. 2007, 96, 131–144. [Google Scholar] [CrossRef] [Green Version]
  47. Shen, Y.; Kondoh, A.; Tang, C.; Zhang, Y.; Chen, J.; Li, W.; Sakura, Y.; Liu, C.; Tanaka, T.; Shimada, J. Measurement and analysis of evapotranspiration and surface conductance of a wheat canopy. Hydrol. Process. 2002, 16, 2173–2187. [Google Scholar] [CrossRef]
  48. Xiao, L.; Zhao, R.; Zhang, X. Crop cleaner production improvement potential under conservation agriculture in China: A meta-analysis. J. Clean. Prod. 2020, 269, 122262. [Google Scholar] [CrossRef]
  49. Gilbert, M.E.; Hernandez, M.I. How should crop water-use efficiency be analyzed? A warning about spurious correlations. Field Crops Res. 2019, 235, 59–67. [Google Scholar] [CrossRef]
  50. Zhang, H.; Wang, X.; You, M.; Liu, C. Water-yield relations and water-use efficiency of winter wheat in the North China Plain. Irrig. Sci. 1999, 19, 37–45. [Google Scholar] [CrossRef]
  51. Molden, D.; Oweis, T.; Steduto, P.; Bindraban, P.; Hanjra, M.A.; Kijne, J. Improving agricultural water productivity: Between optimism and caution. Agric. Water Manag. 2010, 97, 528–535. [Google Scholar] [CrossRef]
  52. Wang, Q.; Hao, C.; Hongwen, L.; Wenying, L.; Xiaoyan, W.; McHugh, A.; Jin, H.; Huanwen, G. Controlled traffic farming with no tillage for improved fallow water storage and crop yield on the Chinese Loess Plateau. Soil Tillage Res. 2009, 104, 192–197. [Google Scholar]
  53. Mbava, N.; Mutema, M.; Zengeni, R.; Shimelis, H.; Chaplot, V. Factors affecting crop water use efficiency: A worldwide meta-analysis. Agric. Water Manag. 2020, 228, 105878. [Google Scholar] [CrossRef]
  54. Hanks, R. Yield and water-use relationships: An overview. In Limitations to Efficient Water Use in Crop Production; American Society of Agronomy: Madison, WI, USA, 1983; pp. 393–411. [Google Scholar]
Figure 1. Location of the Loess Plateau in China and sampling sites and mean annual precipitation distributions across the Loess Plateau. Precipitation data were obtained from http://www.resdc.cn.
Sustainability 12 07449 g001
Figure 2. Relationships between precipitation and crop production (a), evapotranspiration (ET) (b), and water use efficiency (WUE) (c). Seven tillage practices are conventional tillage (CT), conventional tillage with straw mulching (CTs), no tillage (NT), no tillage with straw mulching (NTs), reduced tillage (RT), reduced tillage with straw mulching (RTs), and subsoiling with straw mulching (Ss).
Sustainability 12 07449 g002
Figure 3. Changes in crop production (a), evapotranspiration (ET) (b), and water use efficiency (WUE) (c) under various conservation agriculture (CA). Six CA practices are conventional tillage with straw mulching (CTs), no tillage (NT), no tillage with straw mulching (NTs), reduced tillage (RT), reduced tillage with straw mulching (RTs), and subsoiling (Ss). Significant differences among different CA practices are indicated by different lowercase letters. Bars represent standard deviation. Data numbers are shown in parentheses. Asterisks and ns represent significant and insignificant differences for each CA practice, respectively.
Sustainability 12 07449 g003aSustainability 12 07449 g003b
Figure 4. Relationships between changes in evapotranspiration (ET) and crop production (a), changes in water use efficiency (WUE) and crop production (b), and changes in ET and WUE (c) after the adoption of conservation agriculture (CA) practices. Six CA practices are conventional tillage with straw mulching (CTs), no tillage (NT), no tillage with straw mulching (NTs), reduced tillage (RT), reduced tillage with straw mulching (RTs), and subsoiling (Ss).
Sustainability 12 07449 g004aSustainability 12 07449 g004b
Figure 5. Relationships between changes in water storage and crop production after the adoption of conservation agriculture (CA) practices.
Sustainability 12 07449 g005
Figure 6. Changes in crop production (a), evapotranspiration (ET) (b), and water use efficiency (WUE) (c) of different experimental duration classes. Significant differences among duration classes are noted by different lowercase letters. Bars represent standard deviation. Data numbers are shown in parentheses. Asterisks and ns represent significant and insignificant differences, respectively. Equations represent regressions between experimental duration and changes in crop production, ET, and WUE.
Sustainability 12 07449 g006aSustainability 12 07449 g006b
Table 1. Statistics of crop production, evapotranspiration (ET), and water use efficiency (WUE) for three precipitation classes. SD represents standard deviation. Equations indicate regressions of annual precipitation and crop production, ET, and WUE for each precipitation class. R2 indicates the coefficient of determination between annual precipitation and crop production, ET, and WUE in each precipitation class. p indicates the confidence level of the correlation. N indicates the number of data. Different lowercase letters indicate significant differences in yield, ET, and WUE among three precipitation classes (p < 0.05).
Precipitation Class<300 mm yr−1300–600 mm yr−1>600 mm yr−1
StatisticsMeanSDR2pNMeanSDR2pNMeanSDR2pN
Yield (Mg ha−1)1.276a0.1260.451<0.001273.146b1.1230.290<0.0011404.545c0.5030.067>0.0540
Regressiony = 0.0018x + 0.8782y = 0.0069x − 0.0267y = −0.007x + 5.1665
WUE (kg ha−1 mm−1)4.437a0.4380.460<0.0012711.19b4.2620.000>0.051018.083c3.4670.148<0.0530
Regressiony = −0.0063x + 5.8357y = −0.0005x + 11.424y = −0.0073x + 14.157
ET (mm)290.3a40.340.954<0.00127258.9a77.580.174<0.001101400.1b89.990.160<0.0530
Regressiony = 0.8347x + 104.78y = 0.3663x + 96.031y = 0.1969x + 235.92

