Article

Energy Management Optimization of Series Hybrid Electric Bus Using an Ultra-Capacitor and Novel Efficiency Improvement Factors

1
Department of Mechanical Engineering, Myongji University, Building 1, Room 212, 116 Myongji-ro, Yongin-si, Gyeonggi-do 17058, Korea
2
Devision of Mechanical and Electronics Engineerin, Hansung University, 116, Samseongyo-ro 16-gil, Seongbuk-gu, Seoul 02876, Korea
*
Authors to whom correspondence should be addressed.
Sustainability 2020, 12(18), 7354; https://doi.org/10.3390/su12187354
Submission received: 18 July 2020 / Revised: 28 July 2020 / Accepted: 29 July 2020 / Published: 8 September 2020
(This article belongs to the Collection Sustainable Development of Electric Vehicle)

Abstract

:
The existing series hybrid electric bus (SHEB) uses an ultra-capacitor (UC) to extend battery life, mitigate vehicle weight, and reduce cost. However, previous studies did not clearly identify the operation timing and load of the UC for efficiency improvement in an SHEB. This paper proposes novel efficiency improvement factors, with their application criteria for the ideal operation timing and load of the UC in an SHEB. The factors are the threshold of the required power of the motor (TRPM), slope of the power split ratio (SPSR), and y-axis intercept of the power split ratio (YPSR). The TRPM determines the duration of using just the battery. The SPSR or YPSR determine the most efficient load ratio between the battery and UC. The criteria for using them are set using particle swarm optimization. Manhattan, Braunschweig, and Orange County driving cycles were used to reflect various road load conditions. The results showed that the proposed factors and their setting criteria guarantee a significant reduction in the fuel consumption and more energy-efficient SHEBs.

1. Introduction

Global issues, such as the exhaust gas generated by internal combustion engines (ICEs), have a significant impact on environmental pollution and the human body. Although developers of electric vehicles (EVs) are focusing on becoming emission-free, they are taking considerable time to address the vehicles’ disadvantages, such as the construction of charging infrastructure, limited driving distance, and long charging/waiting time. To overcome these barriers, hybrid electric vehicles (HEVs) offer realistic and practical solutions and have been studied worldwide. HEVs use multiple energy sources and are divided into three categories according to their structures and characteristics: series, parallel, and series-parallel types. They usually use motors, generators, batteries, and ICEs to operate the automobile, meeting the energy requirements of each component. In particular, a series hybrid electric vehicle (SHEV) can operate the engine most efficiently, regardless of the traction motor status; additionally, high regenerative energy absorption caused by the large traction motor is available [1]. In the SHEV, electrical energy flows from the generator to the motor through the battery. The effect of the resistance in the battery is significant, as it determines the charging and discharging efficiency of the battery; specifically, a high battery resistance decreases the charging and discharging efficiencies, leading to high losses in the energy flow of the SHEV. However, the effect of battery resistance and efficiency on the energy flow in a SHEV is typically ignored in previous studies because the SHEV structure is simple and the energy flow inside the SHEV appears straightforward. To address this problem, new approaches are required and this paper suggests the use of an ultra-capacitor (UC) with advanced concepts to prevent unnecessary losses when the energy generated from the engine/generator passes through the battery to the traction motor [2].
Energy distribution is a very important research topic [3,4,5,6,7] and some studies have considered the adoption of UCs in green cars. A study was conducted on EVs using only UCs and no battery; however, going on a long and heavy trip without a battery in a bus becomes a burden [8]. Research on weight and cost reductions by downsizing the hybrid energy storage system (HESS) equipped with the battery and UC was also conducted. Using the battery and UC simultaneously reduced the total weight of the energy storage system (ESS) by 20–40% [9], and the branch and cell numbers in the battery and UC were optimized for cost minimization [10]. However, these studies overlooked vehicle fuel efficiency improvement. Furthermore, using a UC alongside the battery in an HEV helped to extend battery life [11,12,13,14,15], a new DC/DC converter for the battery and UC was proposed for improving the system efficiency, and a UC parameter matching design for an electric bus was considered [16,17]. However, clear standards of when and how much the UC is to be used were not suggested in these studies. In addition, various algorithms have recently been adopted to solve UC or city bus optimization problems. Dynamic programming (DP) has been applied when a UC is used in an HEV; a reduction in calculation time while maintaining accuracy was examined in the offline backward SHEV, and an abstracting control algorithm using DP for a plug-in HEV was also considered [18,19]. Energy storage system (ESS) sizing in the EV or the network problem of EV transit buses was solved using a particle swarm optimization (PSO) algorithm [10,20,21]. Moreover, energy management, when using a UC in a fuel-cell electric vehicle, adopted a genetic algorithm and fuzzy logic to optimize the energy flow between the ESSs [22,23]. However, the more advanced the optimization algorithm becomes, the harder it is to apply them to real-time applications.
The contributions of this study are: (1) finding novel efficiency improvement factors that have been unexplored in previous research but are very significant in determining the ideal usage timing and load of the UC in the series hybrid electric bus (SHEB), and (2) defining their clear application criteria based on the ESS efficiency and loads to maximize the fuel efficiency of the SHEB. These criteria are applicable to the real-time energy management strategy (EMS) and were optimized using the PSO algorithm; the effectiveness was tested on various bus driving cycles in Manhattan, Braunschweig, and Orange County to reflect different load and road conditions. As a result, a more energy-efficient SHEB was developed and verified in this study.
This study is composed of six sections. Section 2 introduces the powertrain and ESS modeling of the SHEB. Section 3 explains the EMS applied to the SHEB. Section 4 applies the PSO algorithm to the efficiency improvement factors and, in Section 5, the simulation results are compared to the conventional SHEB and discussed. Finally, the conclusions of this study are presented in Section 6.

2. SHEB Modeling

2.1. Powertrain Modeling

The proposed SHEB was developed using MATLAB/Simulink and Amesim co-simulation and consists of an engine, generator, traction motor, battery, and UC [24,25,26]. Figure 1 shows the forward simulation model of the SHEB powertrain and Table 1 presents the bus specification parameters used in this study where SOC means state of charge. The SHEB has advantages in frequent stopping and starting, and the system efficiency directly depends on the characteristics of each component, such that power distribution can be performed more effectively depending on the management of each component [27,28].
To evaluate the energy efficiency of the vehicle, the longitudinal vehicle dynamics model was used, as shown in Figure 2. The tractive resistance consists of rolling, air, gradient, and driving acceleration resistances [29].
Rolling resistance is the force acting opposite to the running direction when the vehicle moves on the road. The friction force is generated by tire hysteresis and the condition of the road surface; it is calculated by:
F r = μ N
where N is the normal force acting on the center of the vehicle, and μ is the rolling resistance coefficient. When a slope θ is applied to the system, the normal force direction changes, and N is replaced by N cos θ as:
F r = μ N cos θ
Air resistance is the frictional force generated by air. As the speed of the vehicle v increases, the air resistance increases and can be calculated by:
F a = 1 2 ρ A f C D ( v v w ) 2
where ρ is the air density, A f is the vehicle front area, C D is the air resistance coefficient, and v w is the wind speed. The third resistance is the gradient resistance caused by the slope of the road and is calculated by:
F g = N sin θ
Adding the accelerating resistance of the vehicle in the running direction to the previous resistances, the longitudinal dynamics equation of the total tractive resistance can be obtained as follows:
F t = ( F r + F a + F g ) + M d v d t
where the effects of the rotational inertia of the motor, wheel, and transmission are neglected as their influences are negligible considering the mass of the vehicle [30]. As a result, the tractive resistance power of the vehicle can be calculated by multiplying the total tractive resistance with the vehicle speed, as follows:
P t = F t v
To overcome the tractive resistance of the vehicle, the output torque of the motor can be calculated by:
τ m = 1 1 + t f s τ b
where t f is the first-order lag and τ b is the torque determined by the motor torque limitations [31]. The speed of the motor, ω m , multiplied by the output motor torque, becomes the output power of the motor, and its relationship with (6) is expressed as follows:
P m = τ m ω m = P t / η f
where η f is the efficiency of the final gear between the motor and wheel. Then, the vehicle speed v can be expressed as:
v = r w m g f
where r is the radius of the wheel, and g f is the final gear ratio between the motor and wheel.
To drive a wheel, the energy originates from the engine, and the total fuel consumption of the engine during the simulation can be calculated by:
f c t o t a l = 0 t f f c ( ω e , τ e ) d t
where f c is the instant fuel consumption, based on the engine map in Figure 3a, ω e is the engine speed, τ e is the engine torque, and t f is the total simulation time. The engine is mechanically connected to the generator via gears, and its operational status depends on the EMS. The output power of the generator is defined as follows:
P g = η g ( ω e g g e , τ e / g g e ) η g e P e
where g g e is the gear ratio between the generator and engine, η g is the efficiency of the generator, η g e is the efficiency of the gear, and P e denotes the output power of the engine.

2.2. ESS Modeling

The SHEB uses the ESS of the battery and UC connected in parallel. The battery usually demonstrates an advantage in energy density over the UC; conversely, the power density of the UC is more advanced than the battery [2,32]. UCs are well known for their high capacitance and semi-permanent lifetime [33]. Unlike batteries, which are based on chemical reactions, UCs are charged by simple ion transfers between electrodes, making it feasible to charge and discharge rapidly, with high efficiencies. Moreover, over-charging and over-discharging do not influence the lifetime decrement, unlike batteries. Consequently, UCs are widely used as an ESS, especially as secondary batteries [33,34]. This makes them the core technology of the next generation of ESSs; however, the usage timing and output power of UCs are not clearly presented for improving vehicle efficiency; this study defines them with optimization to take full advantage of the UC. In this study, a resistor and capacitor (RC) model was used for the UC; the steady-state output voltage of the UC can be calculated by [35]:
V u = Q u C + R u I u
where Q u is the UC charge, C is the capacitance of the UC, R u is the internal resistance of the UC, and I u is the input current of the UC [2,13]. The amount of charge withdrawn from the UC can be calculated by:
d Q u d t = I u
and the SOC of the UC is expressed by:
S O C u = Q i Q Q m × 100
where Q i , Q , and Q m are the initial charge, existing charge, and maximum charge of the UC, respectively.
The battery must maintain adequate SOC conditions, and the appropriate battery SOC is set to 40–60%, considering the charging/discharging efficiencies and battery energy shortage/overflow [29,36,37]. We adopted the internal resistance equivalent circuit to create the battery model shown in Figure 4, and the battery output power P b was calculated using (15).
P b = V o c I b I b 2 R b
where R b and V o c are the internal resistance of the battery and open circuit voltage of the battery, respectively, and the battery current I b can be obtained by:
I b = V o c V o c 2 4 R b P b 2 R b
The SOC of the battery, S O C b , can also be calculated using (14), where the charge values of the battery, rather than the UC, should be used. When ESS charging occurs, the charging energy is saved first to the UC and then to the battery to take full advantage of the UC, which is more efficient than the battery. In addition, when the SOC of both the battery and UC reaches the minimum allowance level, the UC is not used; using it during this period can cause power supply failure, considering its energy density. Accordingly, the engine/generator and battery are used in this case to satisfy the required power of the motor. Finally, hybrid electric vehicles have a linkage point for combining power sources. DC/DC converters are used for proper control of the ESS terminal voltages and the efficiencies are assumed to be 95% [25,29,38,39].

3. Energy Management Strategy

In this study, we adopted a practical and robust thermostat control strategy (TCS) as the EMS of the SHEB. The benefits of this strategy are: (1) the efficiency of the vehicle becomes very high as it uses the most efficient operating point of the engine; (2) estimating the energy consumption minimization via ESSs is feasible because we can use the vehicle in the EV mode; and (3) eliminating the effects of other interferences is possible because it uses a single-engine operating point. With other complex EMSs, the developed efficiency improvements can be deduced from other efficiency improvement interferences, such as engine/generator operating conditions.
With this EMS, evaluating the efficiency increment by the UC itself is feasible because the engine/generator is only used for the ESS charger when the SOC reaches the minimum allowance level [24]. However, considering the application principle of the efficiency improvement factors in the next section, the proposed concept is also applicable to other real-time EMSs [40,41,42,43]. The TCS algorithm is given from (17) to (19), where S e , S O C h , and S O C l , represent the engine/generator on/off switching, upper limitation of the battery SOC, and lower limitation of the battery SOC, respectively [28].
S e ( t ) = { 0 { i f , S O C b > S O C h o r S O C h S O C b S O C l a n d S e ( t ) = 0 } 1 { i f , S O C b < S O C l o r S O C l S O C b S O C h a n d S e ( t ) = 1 } }
The output power of the generator in (11) is modified by TCS as:
P g = η g ( ω e , O O P g g e , τ e , O O P / g g e ) η g e P e S e ( t )
where τ e , O O P and ω e , O O P  are the optimal operating points of the engine torque and speed, respectively. Therefore, the required power of the motor, P r (electric input power of the motor), supplied by the battery, UC, and generator is expressed as follows:
P r = P m / η m = P b + P u + P g
where η m and P u denote the efficiency of the motor and output power of the UC, respectively. However, the relation between P b and P u , which is very significant for vehicle efficiency, is not yet clearly defined and is explained in the next section.

4. Optimization of Efficiency Improvement Factors

4.1. Efficiency Improvement Factors

To maximize the efficiency of the SHEB, the UC was adopted, and novel fuel efficiency improvement factors are suggested. The first factor determines whether to use just the battery or not. The second and third factors define the load sharing ratio when simultaneously using the battery and UC.

4.1.1. Required Power of the Motor

The required power of the motor, Pr, indicates the input power of the traction motor, and it becomes P b in (19) when a battery alone supplies that power. A large P b indicates a high current in (16), considering the almost constant values of V o c and R i . The battery efficiency is [27]
V o c I b I b 2 R V o c I b = V o c I b R V o c = 1 I b R V o c
and a high current decreases the efficiency. Accordingly, the threshold of the required power of the motor (TRPM), over which the use of the battery is not allowed, needs to be defined; this is the first efficiency improvement factor. Below the threshold, the battery is very efficient with a small power requirement such that using just the battery as an ESS is reasonable, as shown on the left hill of Figure 5a.

4.1.2. Power Split Ratio between the ESSs

The large power requirement indicates that the traction motor consumes considerable energy, and the required current in the motor is high. Therefore, the efficiency of using just the battery significantly decreases; however, because the UC efficiency is much better than that of the battery, it is capable of significantly reducing energy loss [2,44]. As the participation rate of the UC increases, the charging/discharging loss in the process of passing through the battery is reduced, improving the efficiency of the SHEB. However, an excessive sharing ratio to the UC causes the power supply failure mentioned in Section 2, and the battery should only cover the huge power requirement of the motor, despite the poor efficiency of the battery-only mode. Accordingly, the criteria of the power-split ratio between the battery and UC should be defined as the second and third efficiency improvement factors. The power-split ratio is defined as a linear function to reflect its variation to the motor power requirement, and the slope and y-axis intercept are selected as the second and third efficiency improvement factors, respectively. They are named the slope of the power split ratio (SPSR) and y-axis intercept of the power split ratio (YPSR). Consequently, the power proportion of the UC, r s p l i t , becomes:
r s p l i t = S P S R · P r + Y P S R
In Figure 5b, the power split ratio of the UC and battery are r s p l i t and 1 r s p l i t ,respectively, when the required power of the motor is above the first improvement factor. This is also valid on the right side of Figure 5a. As soon as the required power of the motor passes over the first efficiency improvement factor, the power supply is conducted using the UC and battery simultaneously, where the proportions of r s p l i t  and 1 r s p l i t change as per the required power of the motor. Therefore, the following equations are used for power supply between the UC and battery:
P u = P r r s p l i t
P b = P r ( 1 r s p l i t )

4.2. Particle Swarm Optimization

As mentioned above, TRPM, SPSR, and YPSR require adjusting and hence we adopted the PSO algorithm in Figure 6a; the calculation burden and speed of the PSO algorithm are more advantageous than other global searching algorithms, such as the genetic algorithm (GA). The PSO algorithm is a modern heuristic optimization technique, inspired by the swarm intelligence of birds and ants. A group using swarm intelligence shares the best optimal solution information of both the individual and the group. They interact with each other and help individuals modify their search path such that global and local searches can be conducted [45,46,47]. Recent research has used the PSO algorithm in energy management and the cost optimization of eco-friendly vehicles owing to its powerful performance and ease of implementation [10,48,49].
To verify the effectiveness of the proposed efficiency improvement factors, the particles calculate the objective function for each factor (design variable) and build a personal database. By sharing these data with other particles, the PSO algorithm updates the global best ( G b e s t ) and personal best ( P b e s t ) solutions in the group. Based on the global and personal best solutions, the particle determines the next movement and each particle moves according to the principle of vector sum, as shown in Figure 6b. The particle equations of the velocity v p t and position x p t of (TRPM, SPSR, YPSR) at time t are expressed as follows:
v p t + 1 = ω p t v p t + r 1 c 1 ( P b e s t x p t ) + r 2 c 2 ( G b e s t x p t )
x p t + 1 = x p t + v p t + 1
The inertia weight coefficient, ω p t , acceleration coefficients, c 1 and c 2 , and random numbers, r 1 and r 2 , are used in the process of determining the velocity of the particles. The inertia weight coefficient is multiplied by the velocity of the previous step, which determines the magnitude of the inertia velocity. At this time, the velocity and position of the particles are individually determined by the data of the previous step and coefficients. In addition, a linear decreasing weight (LDW) is used for the damping definition such that ω p t decreases with time, as follows [50,51]:
ω p t = ( ω s t a r t ω e n d ) ( 1 t i t e r max ) + ω e n d
where ω s t a r t and ω e n d indicate the initial inertia and final inertia weights, respectively, and i t e r max is the maximum number of iterations. The gradual decrease in damping ratio makes it possible to determine global and local searching. As a result, particles are searched by iterating the calculations; the PSO algorithm repeats this until the optimum is satisfied. The coefficients and parameters applied to the problem are summarized in Table 2 [52,53,54,55,56].

4.3. Problem Formulation

To apply PSO algorithm, the objective function is defined by the total fuel consumption, f c t o t a l , in (10) for minimization and the efficiency improvement factors, TRPM, SPSR, and YPSR, are selected as the design variables. The problem formulation with the constraints is as follows:
M i n i m i z e f c t o t a l ( T R P M , S P S R , Y P S R )
subject to
{ 0   kW T R P M 250   kW 0 S P S R 0 Y P S R 1 0.4 S O C b 0.6 0.5 S O C u 1.0 540   V V O C 552   V 259   V V u 518   V
where TRPM is set to 250 kW or less considering the required power of the motor, which is determined with test cycles. SPSR is defined as positive to increase the participation rate of the UC, regarding the motor power requirement. YPSR is defined between 0 and 1, considering the proportion of the UC. Other variables are used in the powertrain and ESS model in Section 2.

5. Simulation Results and Discussion

The simulation was performed based on the Manhattan, Braunschweig, and Orange County cycles, as shown in Figure 7. These are realistic urban bus driving cycles; the Manhattan cycle shows a low average speed, the Braunschweig cycle shows frequent bus stops and high average speed, and the Orange County cycle shows relatively irregular and medium speed driving patterns [57].

5.1. Optimization Results

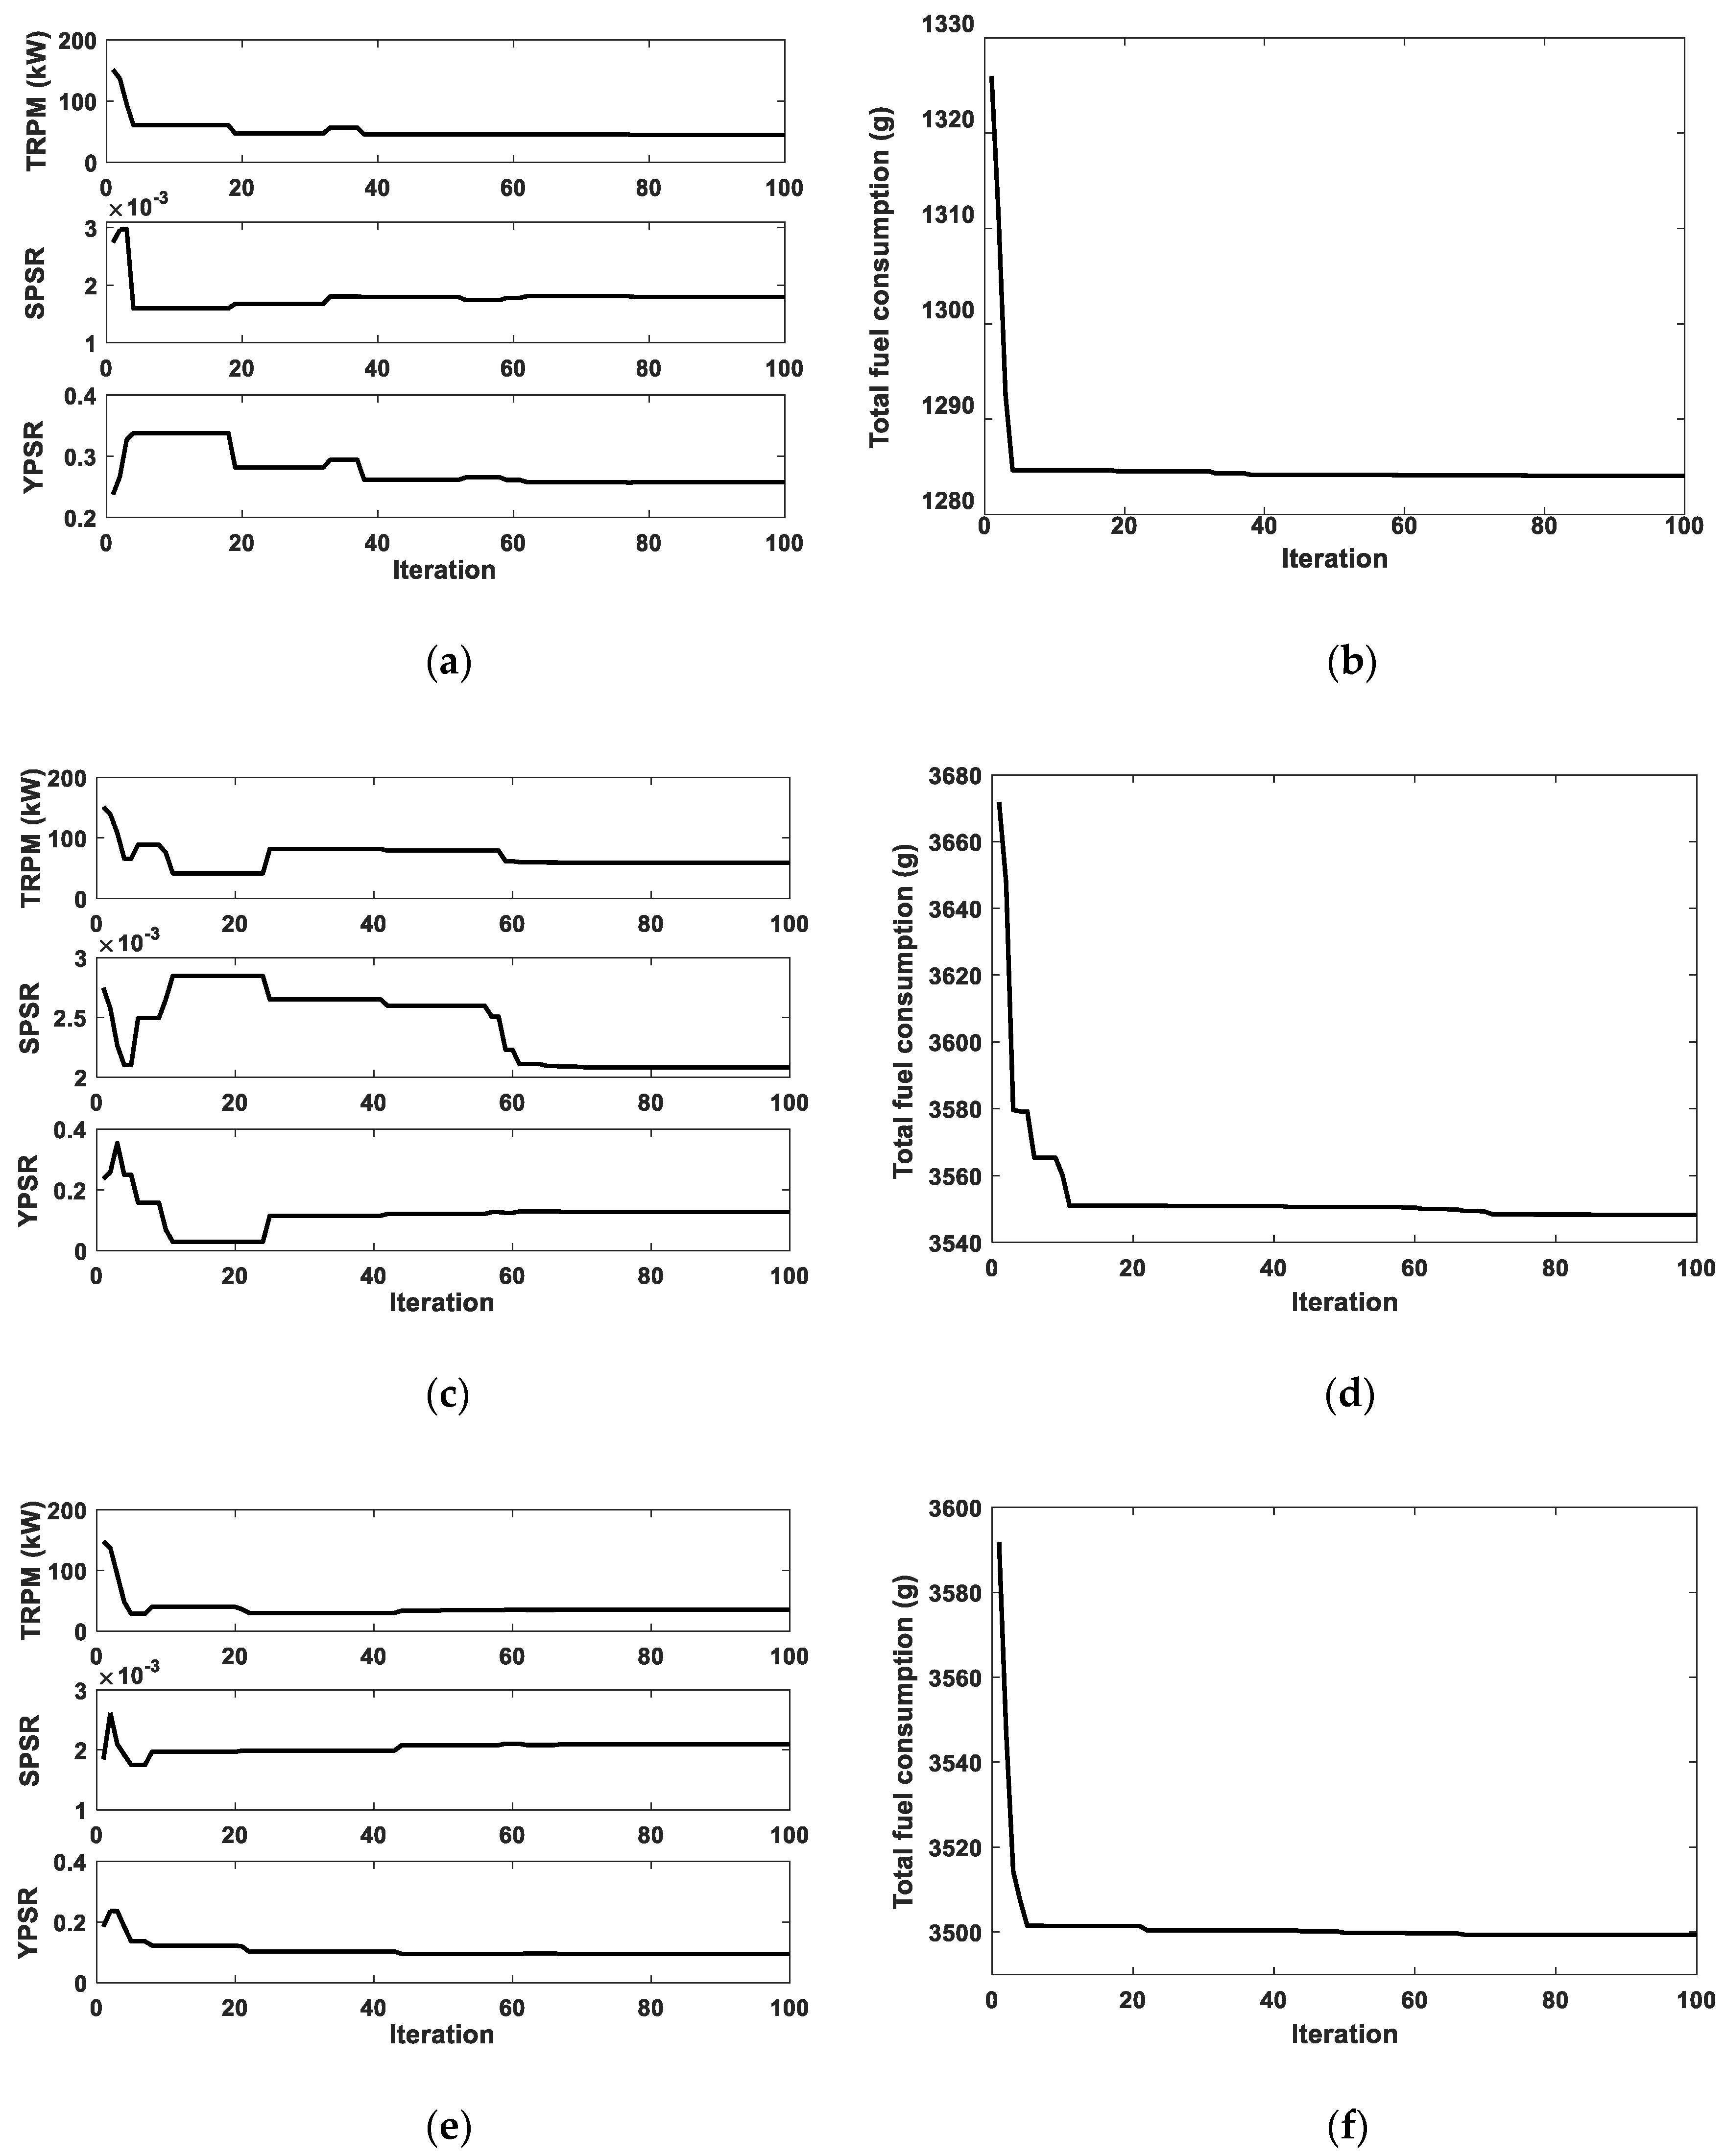
The PSO algorithm was conducted and the optimum for each cycle was determined, as shown in Figure 8, where (a) shows the optimization trajectory of the design variables TRPM, SPSR, and YPSR according to the number of iterations, and (b) presents the target (object function) trajectory of the total fuel consumption, according to the number of iterations. The variations in the design variables were clear and we could identify the evident decrease in total fuel consumption as the iteration progressed such that the optimal variables and object functions were determined, as shown in Table 3. In Figure 8a, the values of SPSR and YPSR appear to be small compared to that of TRPM; however, this was caused by the scale of the x-axis (kW) and the y-axis (YPSR maximum of 1) in Figure 5b.

5.2. Power Supply of ESSs

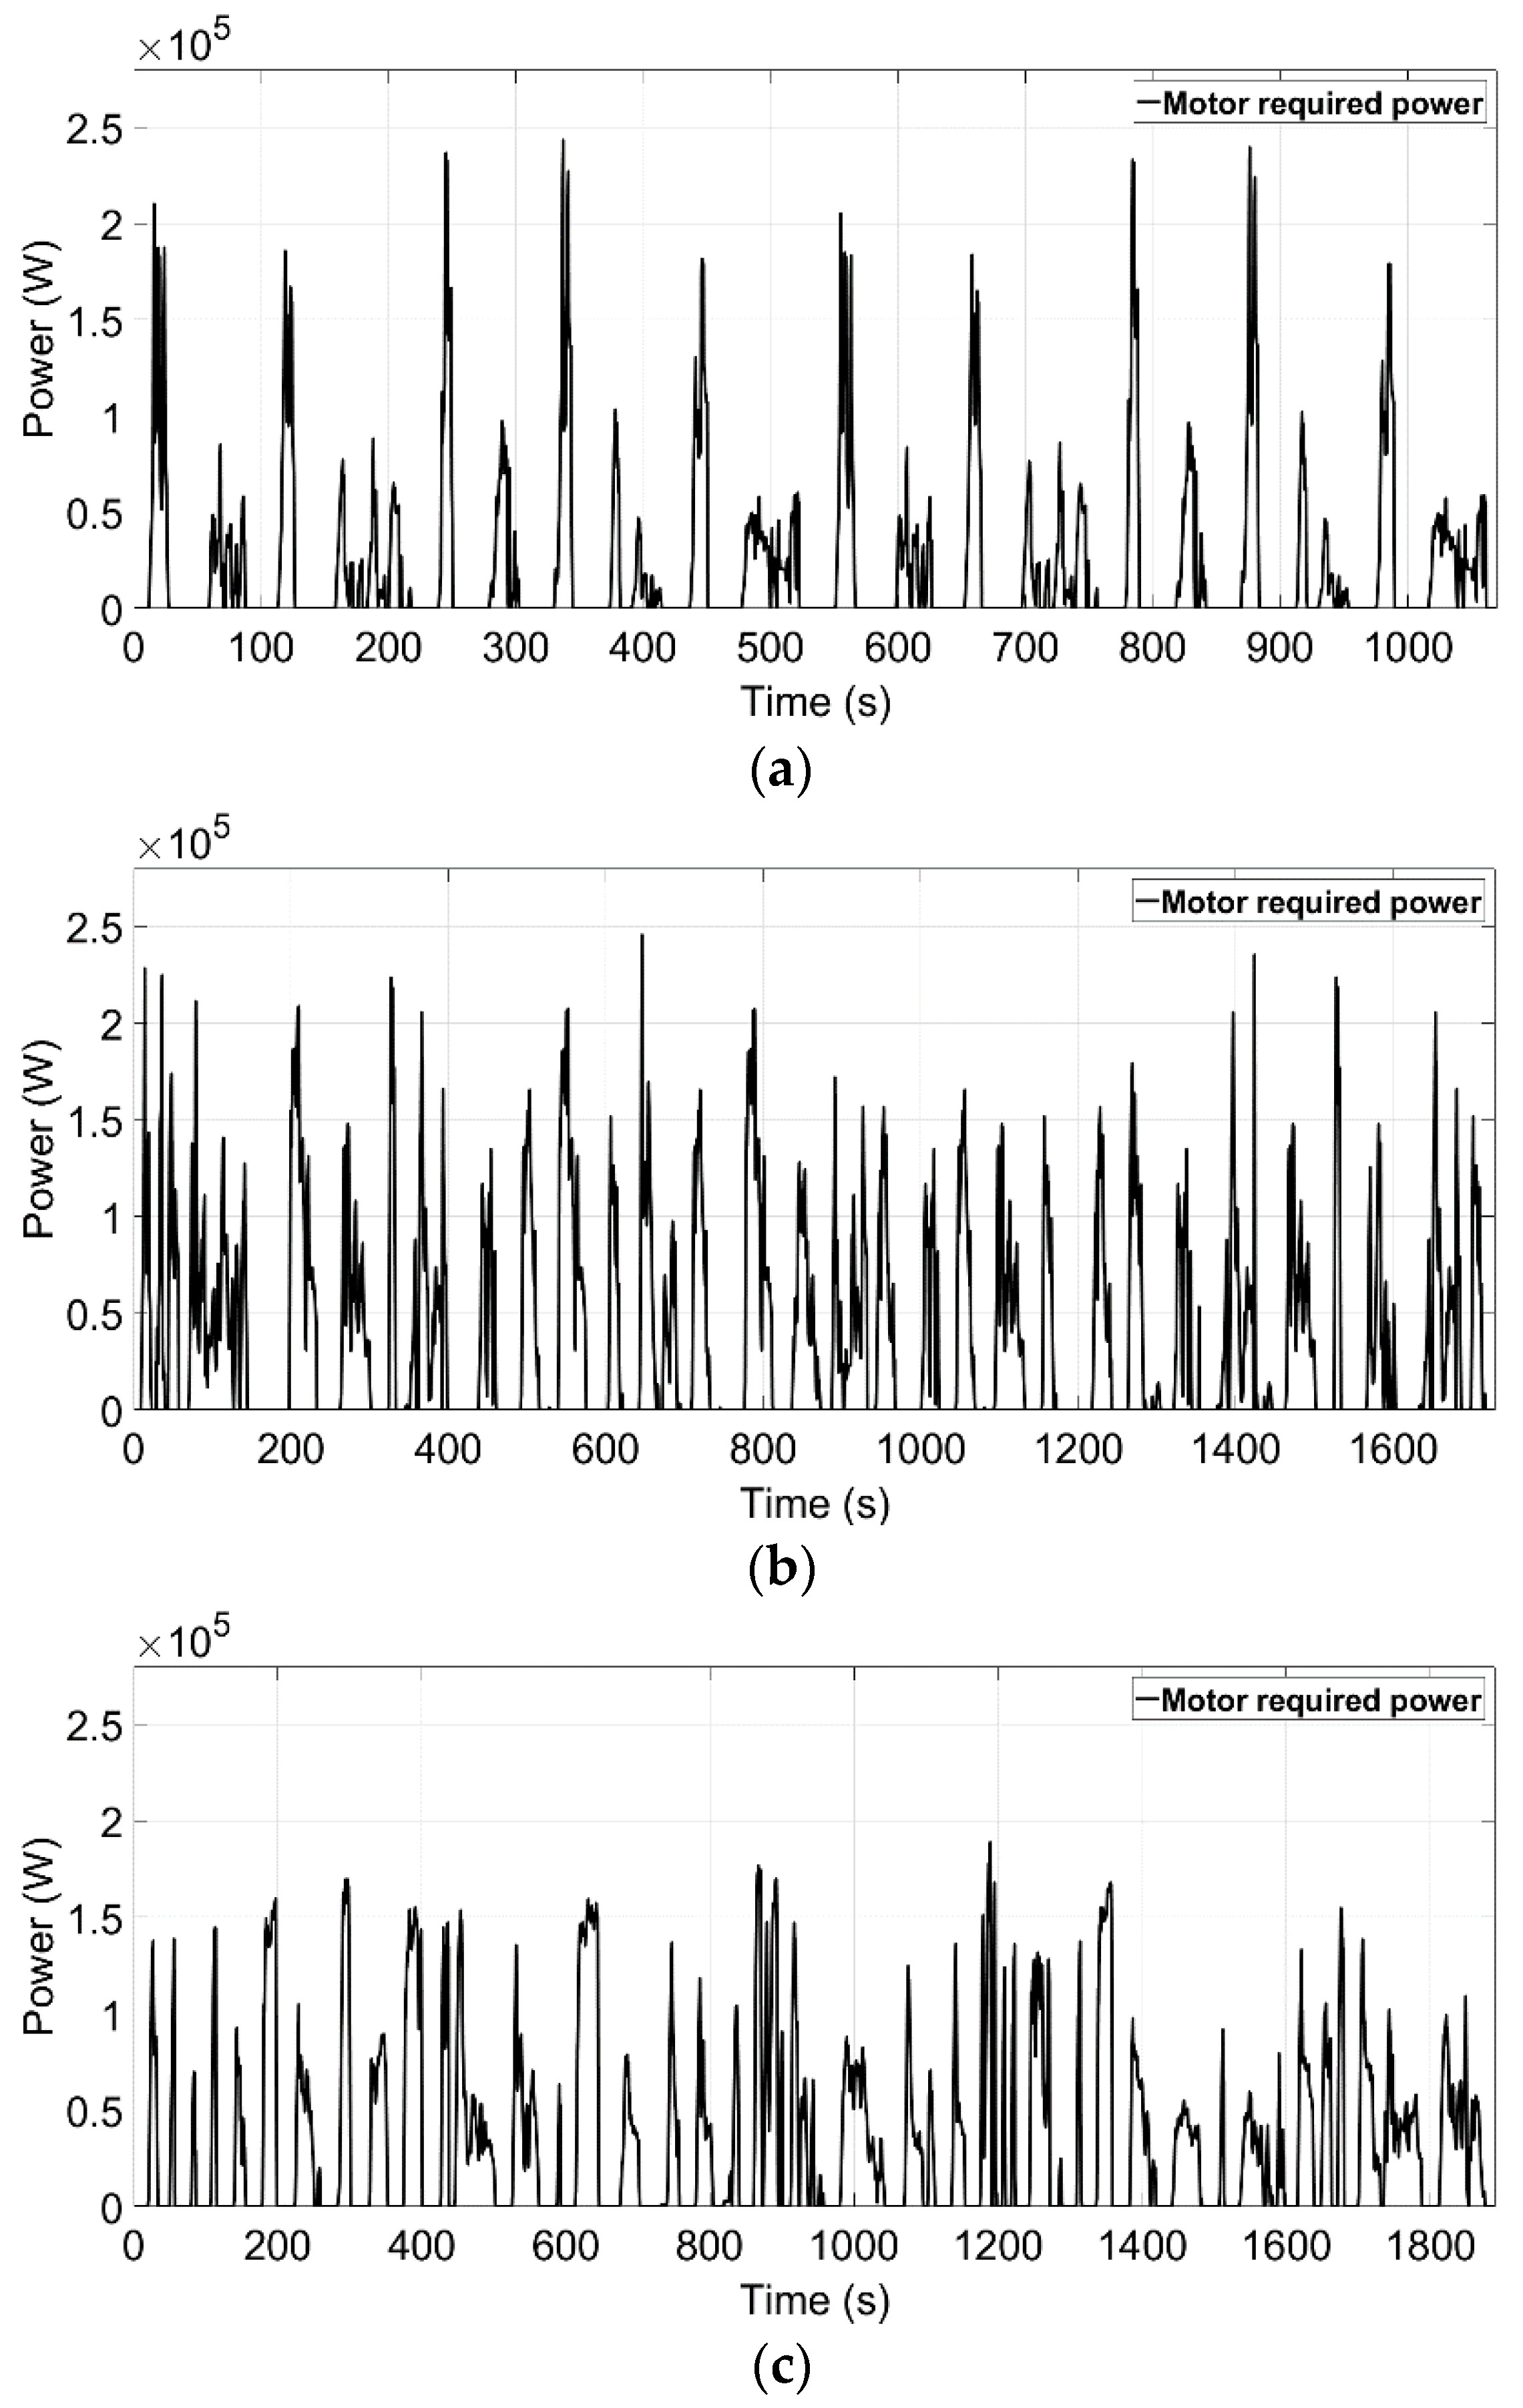
The three bus driving cycles show different speed profiles, and the required power of the motor is also different for each cycle. These are shown in Figure 9. The values are the same for both the conventional and newly proposed SHEBs.
The required power of the motor is supplied by the battery in the conventional SHEB, without the UC; however, the battery-only and load sharing modes based on the efficiency improvement factors in Figure 5 exist in the newly developed SHEB. Figure 10a shows the enlarged view of the Manhattan cycle between 545 and 630 s and the required power of the motor was divided by the battery and UC supply between 545 and 570 s because the TRPM was more than 44.49 kW (the threshold defined by the first improvement factor) in Table 3. The power-split ratio between the UC and battery also followed the SPSR and YPSR in Table 3, i.e., 1.795 × 10⁻³ and 0.2575 (the parameters defined by the second and third improvement factors), respectively. Moreover, the required power of the motor was covered by the battery alone between 610 and 621 s, as the required power of the motor was less than the TRPM of 44.49 kW. This was also true for the Braunschweig and Orange County cycles; Figure 10b,c show the load sharing and battery-only modes with an enlarged view of the other cycles.

5.3. Battery Efficiency Comparisons

Generally, the UC transfers electrical energy at a higher efficiency than the battery, so that the energy loss caused by the charging and discharging efficiency could be significantly improved. However, the UC energy density limitation prohibits the general use of the UC such that optimization should be conducted. The PSO algorithm was adopted and the battery and UC were simultaneously used to improve battery efficiency. Figure 11a shows the battery efficiency of the Manhattan cycle of Figure 10a when comparing it to the conventional SHEB, without the UC, using the enlarged view. Observing the difference between 545 and 570 s, the increment of the battery efficiency is evident, with a maximum difference of 9.7% (95.2% vs. 85.5% at 555 s). By contrast, the efficiency of the UC is also considered in Figure 11b and was more than 98% during this period. These phenomena were equally applicable to the Braunschweig and Orange County cycles, and the corresponding results are shown in Figure 11c–f.

5.4. ESS SOC Comparison

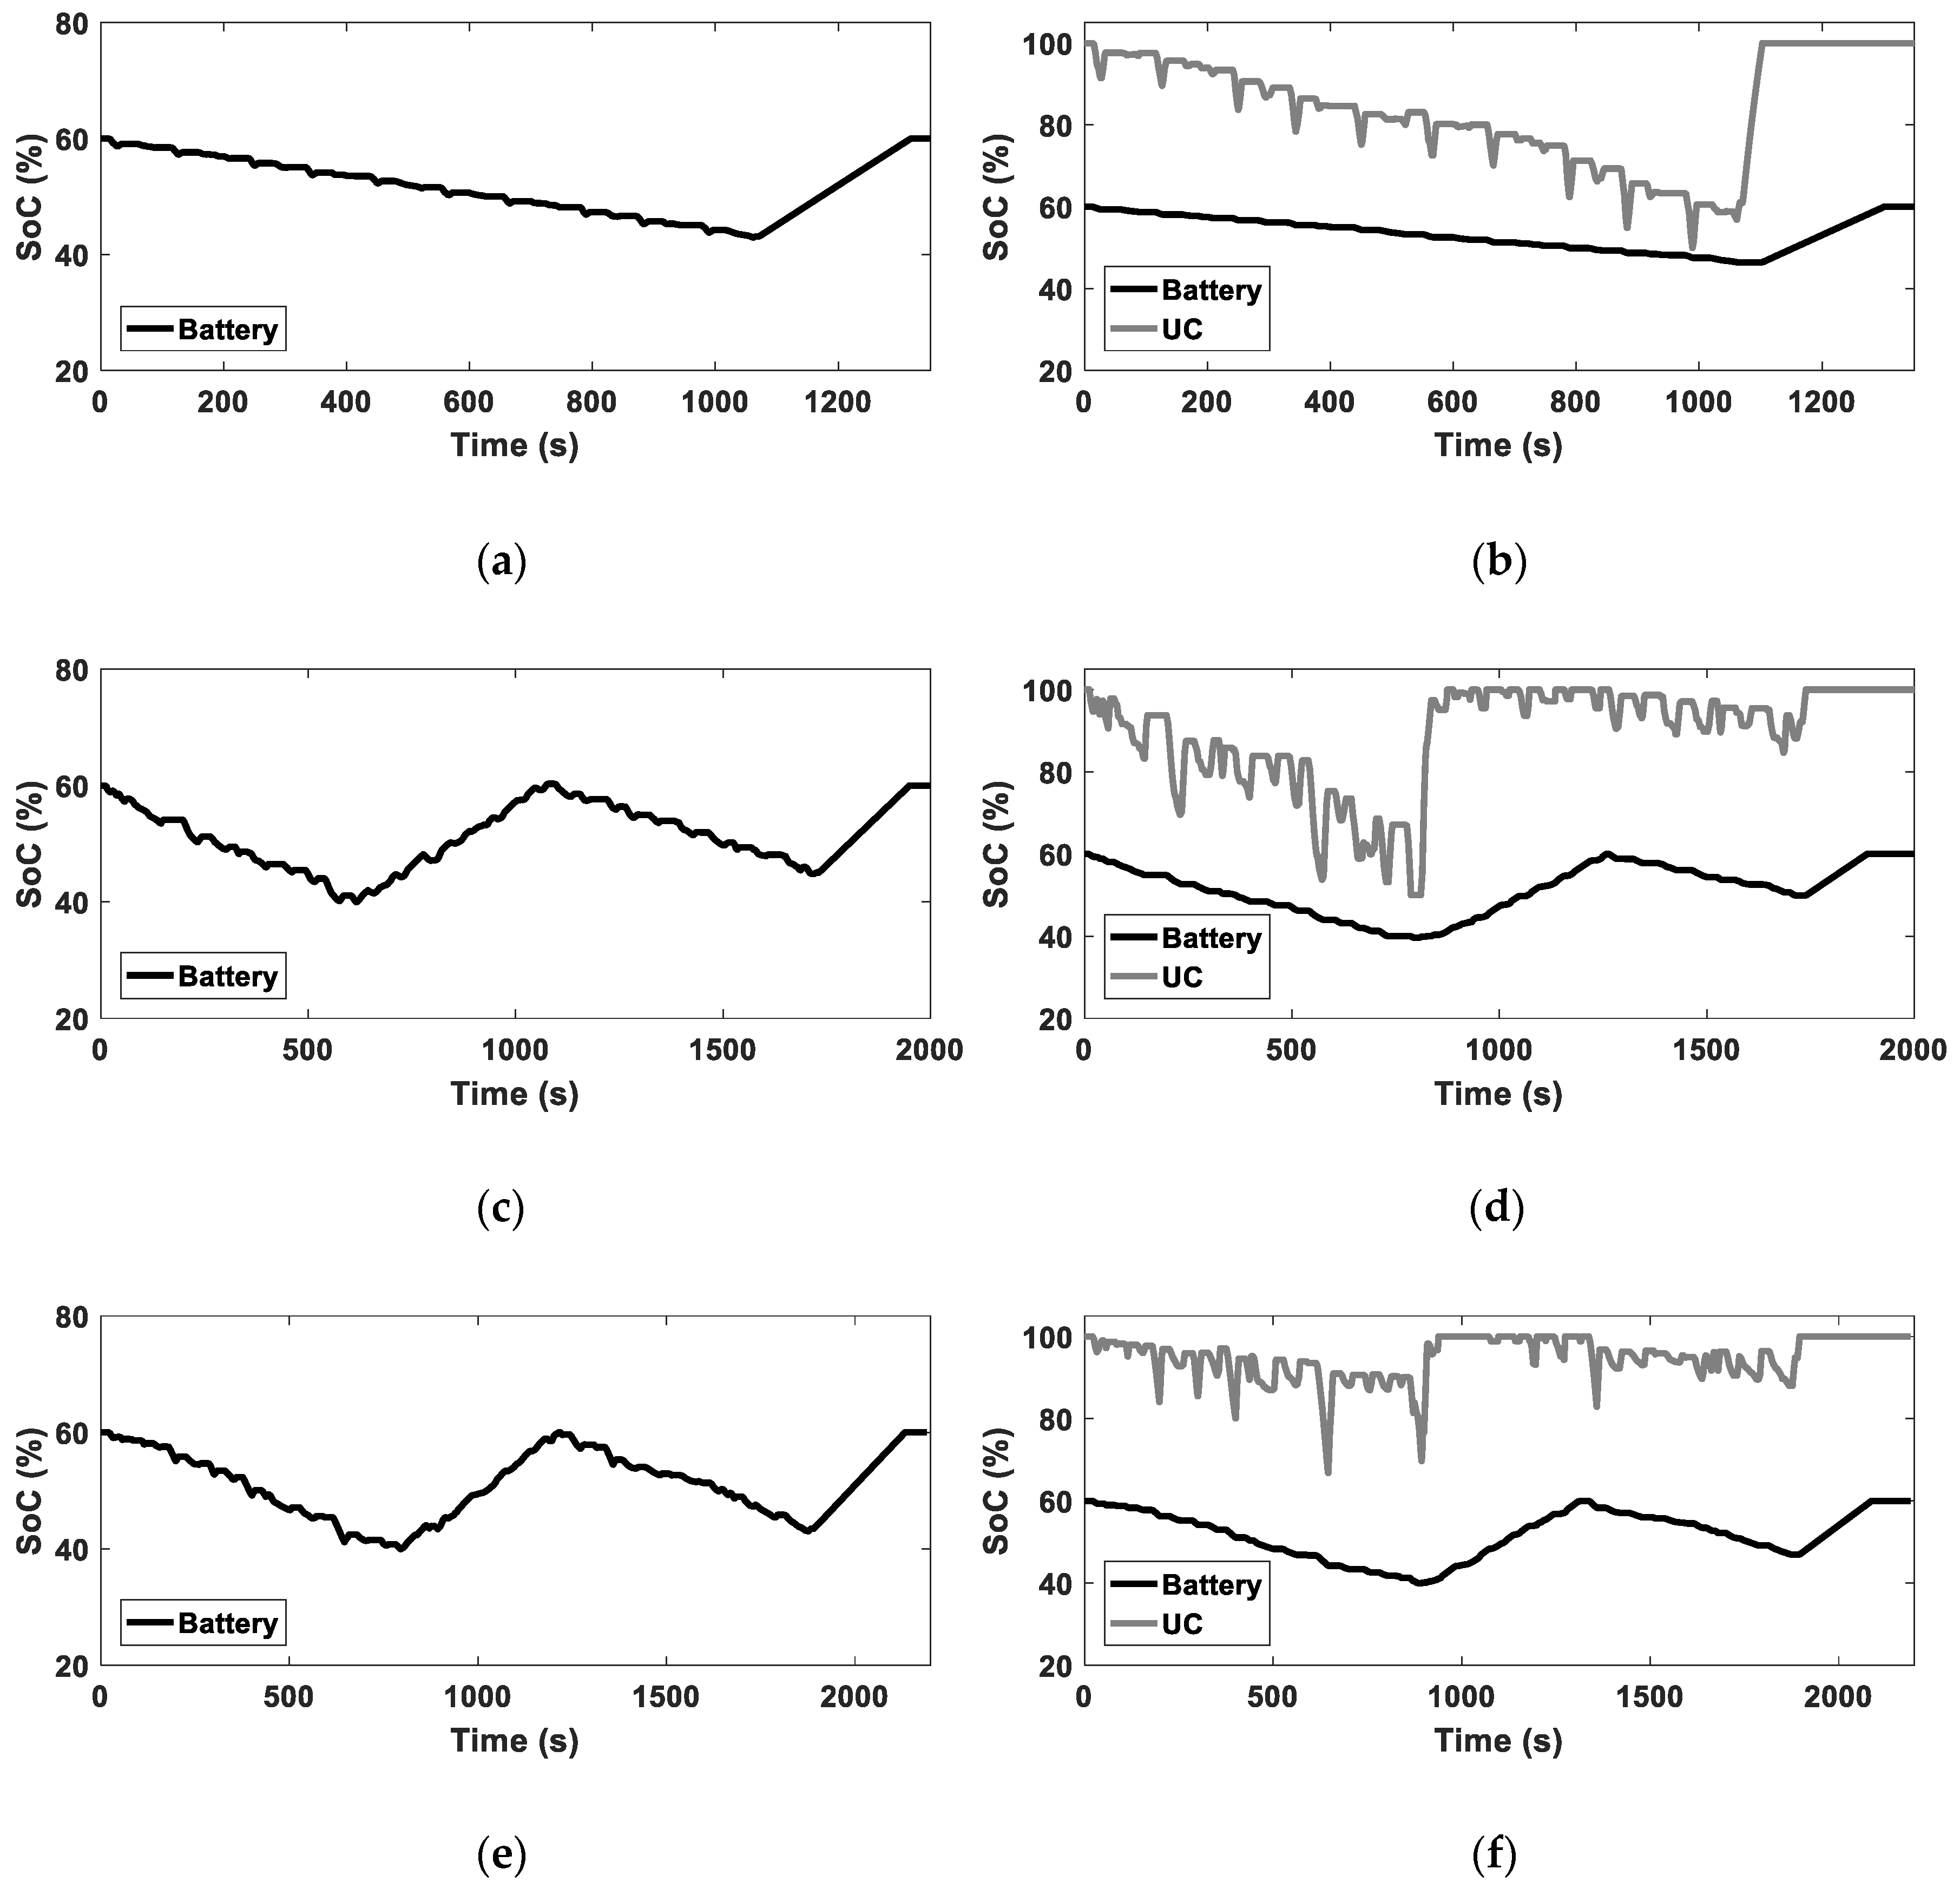
Figure 12 shows the battery SOC of the conventional SHEB, using the battery alone, and that of the newly proposed SHEB, using the battery and UC. The engine is turned on later in the case of the proposed SHEB than in a conventional SHEB, as the battery shares some load with the UC when a lot of power is required by the motor. In this study, to equally match the total energy consumption of the various cases, the initial and final SOCs were set as equal; the battery SOC started and ended at 60%, and the UC SOC started and ended at 100%. To adjust the final SOC at the end of the driving cycles, we operated the engine to charge the battery and UC to their initial states after driving, as shown in Figure 12.

5.5. Comparison of Fuel Efficiency

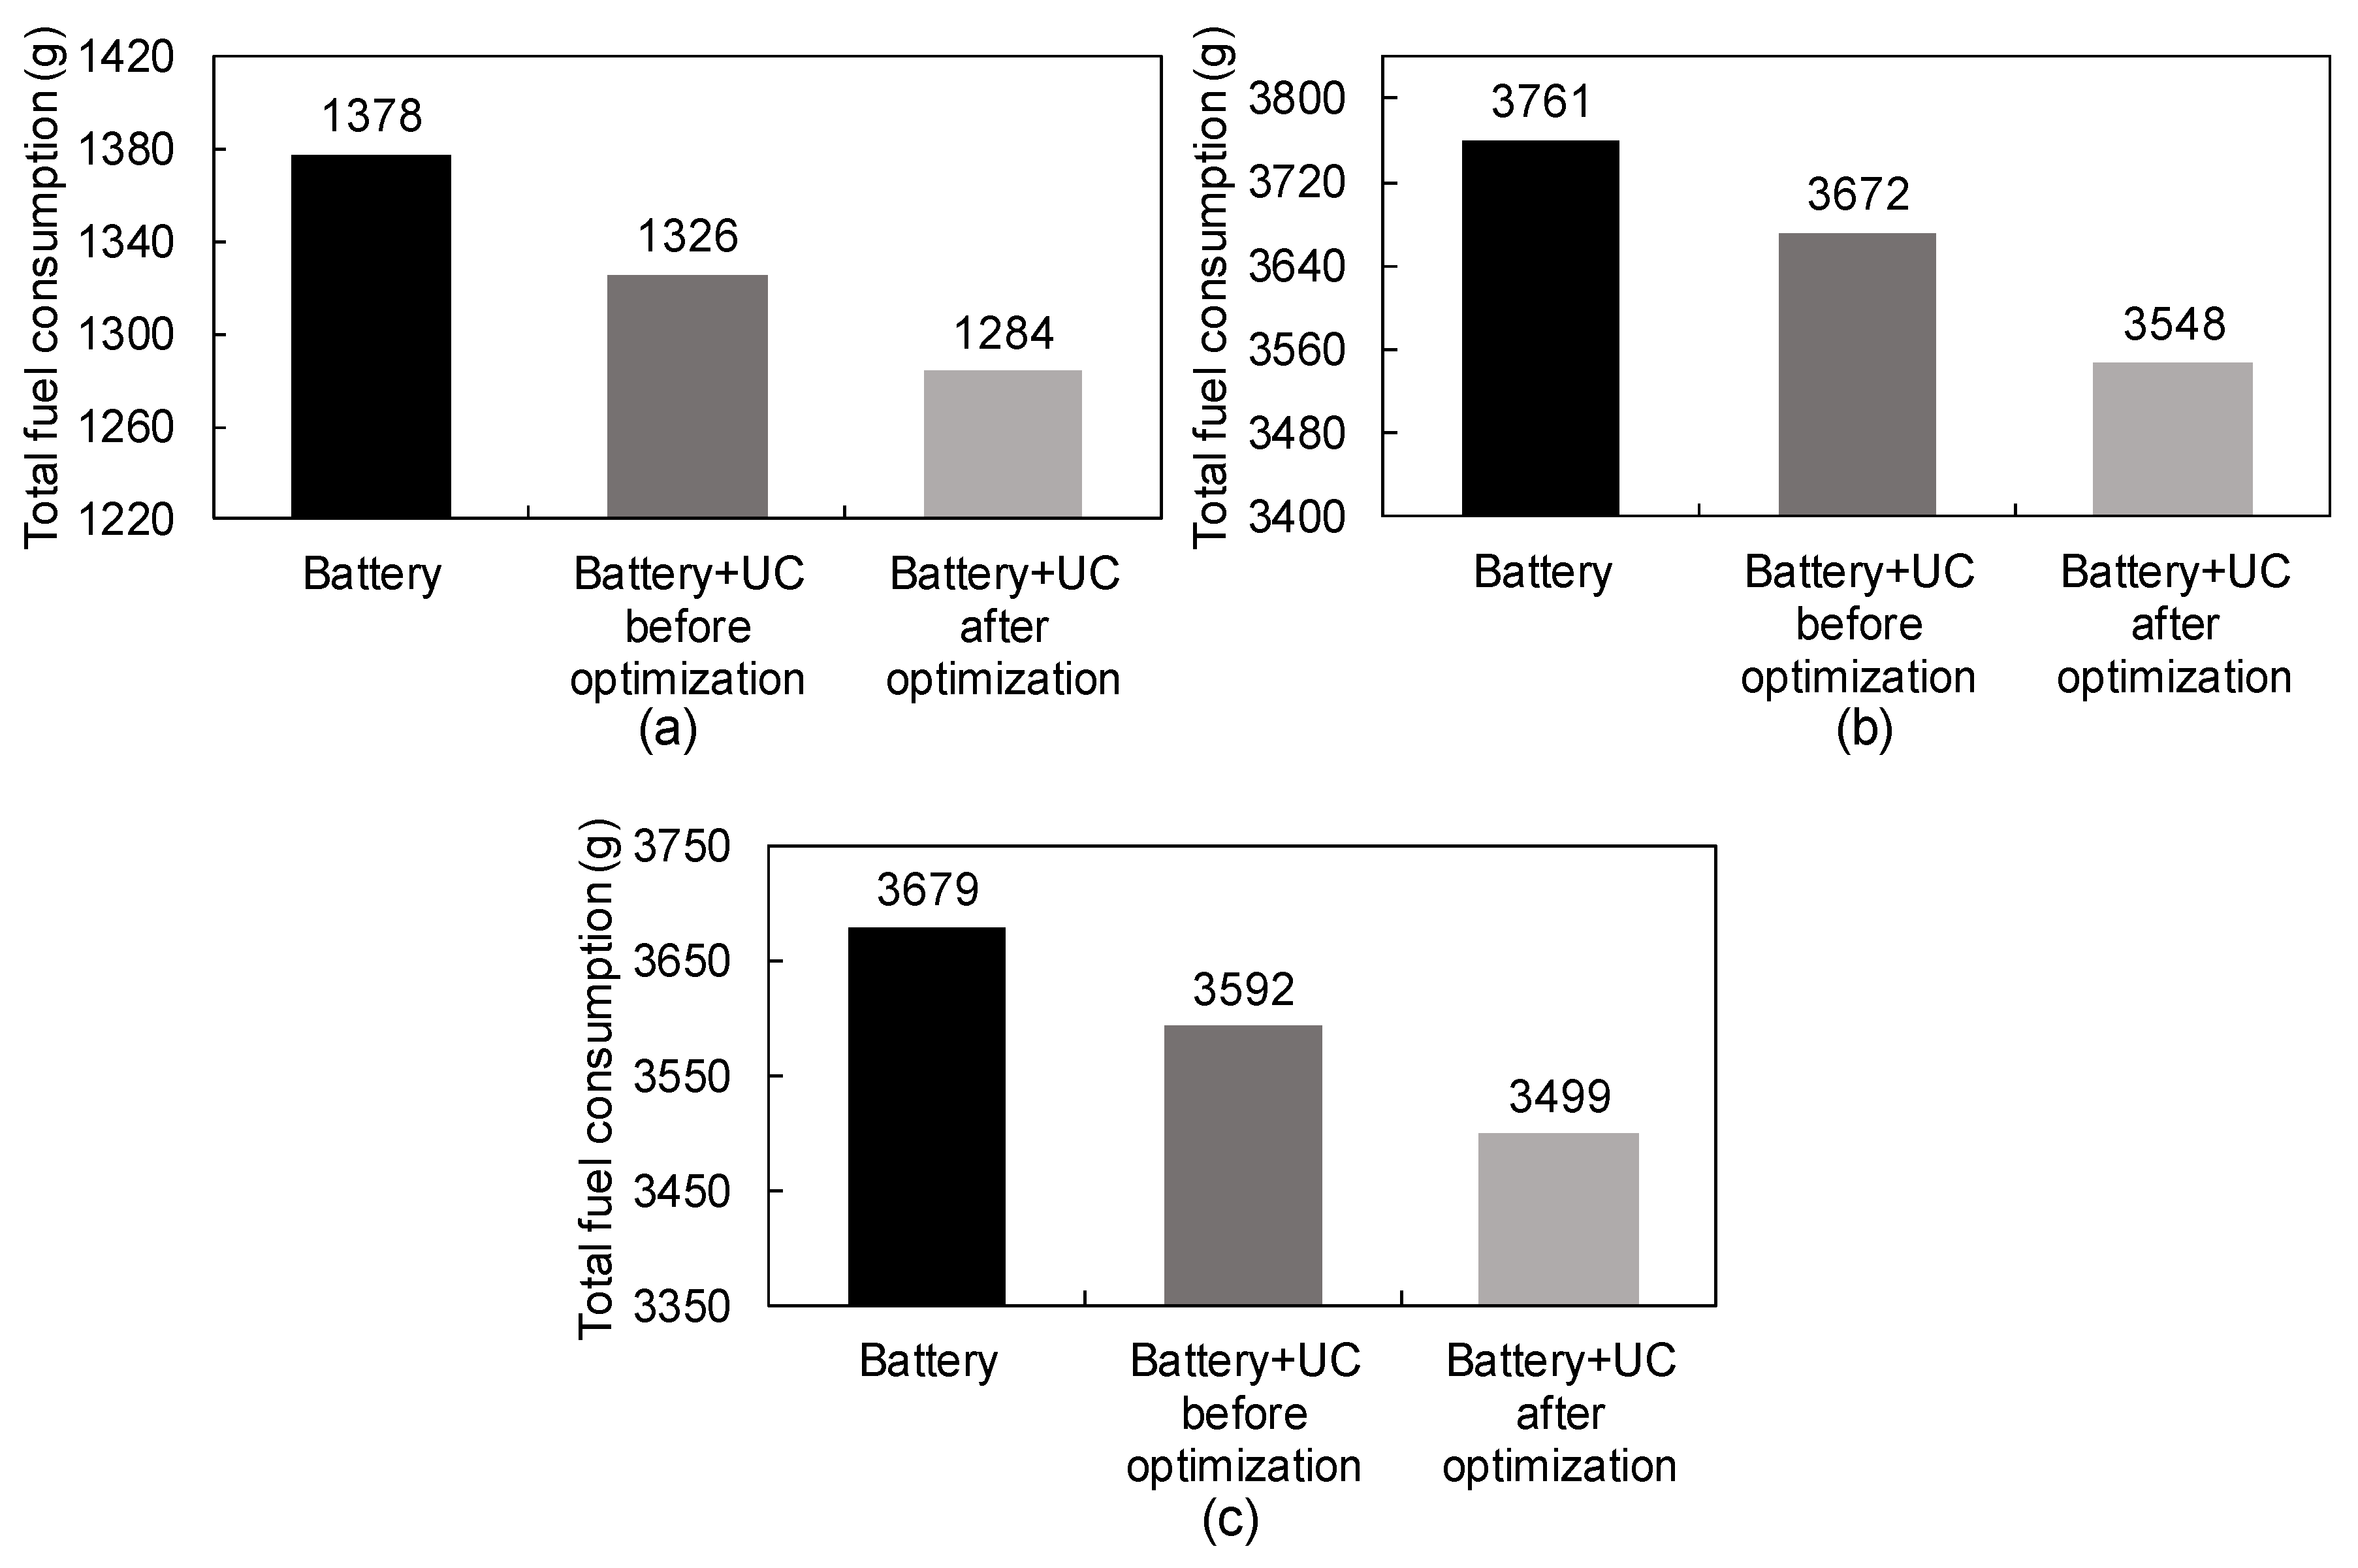
For the Manhattan, Braunschweig, and Orange County cycles, the total fuel consumptions of the conventional SHEB shown in Figure 13 were 1378 g, 3761 g, and 3679 g, respectively, while those of the newly proposed SHEB after PSO algorithm optimization were 1284 g, 3548 g, and 3499 g, respectively. Consequently, the total fuel consumption decreased by 6.82% in the Manhattan cycle, 5.66% in the Braunschweig cycle, and 4.89% in the Orange County cycle, which verifies the effectiveness of the proposed efficiency improvement factors in the SHEB with the UC. The efficiency changes due to the PSO algorithm are also presented in Figure 13. In each figure, the second bars indicate the total fuel consumption with the random starting TRPM, SPSR, and YPSR in Figure 8a,c,e and the third bars denote the total fuel consumption after optimization. The improvements were 3.16%, 3.37%, and 2.59% for the Manhattan, Braunschweig, and Orange County driving cycles, respectively. As a result, a SHEB, with high efficiency using a battery and UC, could be realized and verified. The number of transit buses in a city is huge, and buses generally run with similar driving patterns. In addition, we can know the traffic information in advance using the bus traffic information system. Therefore, defining the corresponding TRPM, SPSR, and YPSR according to the driving information with the SHEB would be a great help for fuel economy enhancement and CO2 reduction in the city.

6. Conclusions

Energy management optimization of the SHEB using a UC was studied. Novel efficiency improvement factors for defining the power supply between the battery and UC—TRPM, SPSR, and YPSR—were proposed, their efficiencies were considered, and the PSO algorithm was adopted to verify the effectiveness of the proposed efficiency improvement factors. From the results, it was confirmed that realizing a higher and sustainable SHEB without changing much of the structure is feasible, which would not have been the case for the existing SHEB. It was confirmed that the total fuel consumption of the proposed SHEB was reduced significantly, by 6.82% in the Manhattan cycle, 5.66% in the Braunschweig cycle, and 4.89% in the Orange County cycle, when compared to the results of the existing SHEB. All results were obtained using the MATLAB/Simulink and Amesim co-simulation, and the proposed improvement factors with the UC are also applicable to other real-time EMSs, for better performance. In the future, a study comparing optimization algorithms to find more efficiency improvement factors will be carried out.

Author Contributions

Conceptualization, S.L., M.K.; Methodology, S.L., M.K.; Data curation, K.L., G.H., M.K.; Formal analysis, J.K., G.H.; Investigation, K.-J.L., M.K.; Validation, G.H., K.L.; Visualization, K.-J.L., G.H., M.K.; Supervision, S.L., M.K. All authors have read and agreed to the published version of the manuscript.

Funding

This work was supported by 2018 Research Fund of Myongji University and the National Research Foundation of Korea (NRF) grant funded by the Korean government (MSIT) (No. 2019R1A2C1090927).

Conflicts of Interest

The authors declare no conflict of interest.

References

  1. Sabri, M.; Danapalasingam, K.; Rahmat, M. A review on hybrid electric vehicles architecture and energy management strategies. Renew. Sustain. Energy Rev. 2016, 53, 1433–1442. [Google Scholar] [CrossRef]
  2. Lukic, S.M.; Wirasingha, S.G.; Rodriguez, F.; Cao, J.; Emadi, A. Power Management of an Ultracapacitor/Battery Hybrid Energy Storage System in an HEV. In Proceedings of the 2006 IEEE Vehicle Power and Propulsion Conference, Windsor, UK, 6–8 September 2006; pp. 1–6. [Google Scholar]
  3. Li, Y.; Zhang, H.; Liang, X.; Huang, B. Event-triggered-based distributed cooperative energy management for multienergy systems. IEEE Trans. Ind. Inform. 2018, 15, 2008–2022. [Google Scholar] [CrossRef]
  4. Zhou, J.; Xu, Y.; Sun, H.; Wang, L.; Chow, M.-Y. Distributed Event-Triggered $ H_ {\infty} $ Consensus Based Current Sharing Control of DC Microgrids Considering Uncertainties. IEEE Trans. Ind. Inform. 2019. [Google Scholar] [CrossRef]
  5. Li, Y.; Gao, D.W.; Gao, W.; Zhang, H.; Zhou, J. Double-Mode Energy Management for Multi-Energy System via Distributed Dynamic Event-Triggered Newton-Raphson Algorithm. IEEE Trans. Smart Grid 2020, 1. [Google Scholar] [CrossRef]
  6. Li, Y.; Zhang, H.; Huang, B.; Han, J. A distributed Newton–Raphson-based coordination algorithm for multi-agent optimization with discrete-time communication. Neural Comput. Appl. 2020, 32, 4649–4663. [Google Scholar] [CrossRef]
  7. Lee, K. Optimal Power Distribution for Series Hybrid Bus Using Ultracapacitor and Battery; Myongji University: Seoul, Korea, 2018. [Google Scholar]
  8. Passalacqua, M.; Lanzarotto, D.; Repetto, M.; Vaccaro, L.; Bonfiglio, A.; Marchesoni, M. Fuel economy and energy management system for a series hybrid vehicle based on supercapacitor storage. IEEE Trans. Power Electron. 2019, 34, 9966–9977. [Google Scholar] [CrossRef]
  9. Schupbach, R.M.; Balda, J.C.; Zolot, M.; Kramer, B. Design methodology of a combined battery-ultracapacitor energy storage unit for vehicle power management. In Proceedings of the IEEE 34th Annual Conference on Power Electronics Specialist, Acapulco, Mexico, 15–19 June 2003; pp. 88–93. [Google Scholar]
  10. Ostadi, A.; Kazerani, M. A comparative analysis of optimal sizing of battery-only, ultracapacitor-only, and battery–ultracapacitor hybrid energy storage systems for a city bus. IEEE Trans. Veh. Technol. 2014, 64, 4449–4460. [Google Scholar] [CrossRef]
  11. Wang, G.; Yang, P.; Zhang, J. Fuzzy optimal control and simulation of battery-ultracapacitor dual-energy source storage system for pure electric vehicle. In Proceedings of the 2010 International Conference on Intelligent Control and Information Processing, Dalian, China, 13–15 August 2010; pp. 555–560. [Google Scholar]
  12. Garcia, F.; Ferreira, A.; Pomilio, J. Control strategy for battery-ultracapacitor hybrid energy storage system. In Proceedings of the 2009 Twenty-Fourth Annual IEEE Applied Power Electronics Conference and Exposition, Washington, DC, USA, 15–19 February 2009; pp. 826–832. [Google Scholar]
  13. Herrera, V.I.; Saez-de-Ibarra, A.; Milo, A.; Gaztañaga, H.; Camblong, H. Optimal energy management of a hybrid electric bus with a battery-supercapacitor storage system using genetic algorithm. In Proceedings of the 2015 International Conference on Electrical Systems for Aircraft, Railway, Ship Propulsion and Road Vehicles, Aachen, Germany, 3–5 March 2015; pp. 1–6. [Google Scholar]
  14. Shen, J.; Khaligh, A. Predictive control of a battery/ultracapacitor hybrid energy storage system in electric vehicles. In 2016 IEEE Transportation Electrification Conference and Expo (ITEC); IEEE: Dearborn, MI, USA, 2016; pp. 1–6. [Google Scholar]
  15. Shen, J.; Dusmez, S.; Khaligh, A. Optimization of sizing and battery cycle life in battery/ultracapacitor hybrid energy storage systems for electric vehicle applications. IEEE Trans. Ind. Inform. 2014, 10, 2112–2121. [Google Scholar] [CrossRef]
  16. Liu, X.; Zhang, Q.; Zhu, C. Design of Battery and Ultracapacitor Multiple Energy Storage in Hybrid Electric Vehicle. In Proceedings of the 2009 IEEE Vehicle Power and Propulsion Conference, Dearborn, MI, USA, 7–10 September 2009; pp. 1395–1398. [Google Scholar]
  17. Li, J.-Q.; Sun, F.-C.; Zhang, C.-N.; Li, H.-L. Ultracapacitors parameter matching design and experiment of electric bus. Chin. J. Power Sources 2004, 28, 483–486. [Google Scholar]
  18. Jeong, J.; Kim, N.; Lim, W.; Park, Y.-I.; Cha, S.W.; Jang, M.E. Optimization of power management among an engine, battery and ultra-capacitor for a series HEV: A dynamic programming application. Int. J. Automot. Technol. 2017, 18, 891–900. [Google Scholar] [CrossRef]
  19. Zhang, S.; Xiong, R. Adaptive energy management of a plug-in hybrid electric vehicle based on driving pattern recognition and dynamic programming. Appl. Energy 2015, 155, 68–78. [Google Scholar] [CrossRef]
  20. Buba, A.T.; Lee, L.S. Hybrid Differential Evolution-Particle Swarm Optimization Algorithm for Multiobjective Urban Transit Network Design Problem with Homogeneous Buses. Math. Probl. Eng. 2019, 2019. [Google Scholar] [CrossRef] [Green Version]
  21. Iliopoulou, C.; Tassopoulos, I.; Kepaptsoglou, K.; Beligiannis, G. Electric transit route network design problem: Model and application. Transp. Res. Rec. 2019, 2673, 264–274. [Google Scholar] [CrossRef]
  22. Abdelgadir, A.; Alsawalhi, J. Energy management optimization for an extended range electric vehicle. In Proceedings of the 2017 7th International Conference on Modeling, Simulation, and Applied Optimization (ICMSAO), Sharjah, UAE, 4–6 April 2017; pp. 1–5. [Google Scholar]
  23. Zhang, R.; Tao, J. GA-based fuzzy energy management system for FC/SC-powered HEV considering H 2 consumption and load variation. IEEE Trans. Fuzzy Syst. 2018, 26, 1833–1843. [Google Scholar] [CrossRef]
  24. Barker, P.P. Ultracapacitors for use in power quality and distributed resource applications. In Proceedings of the Power Engineering Society Summer Meeting, Chicago, IL, USA, 21–25 July 2002; pp. 316–320. [Google Scholar]
  25. Camara, M.B.; Gualous, H.; Gustin, F.; Berthon, A.; Dakyo, B. DC/DC converter design for supercapacitor and battery power management in hybrid vehicle applications—Polynomial control strategy. IEEE Trans. Ind. Electron. 2010, 57, 587–597. [Google Scholar] [CrossRef]
  26. Amjadi, Z.; Williamson, S.S. Prototype design and controller implementation for a battery-ultracapacitor hybrid electric vehicle energy storage system. IEEE Trans. Smart Grid 2012, 3, 332–340. [Google Scholar] [CrossRef]
  27. Kim, M.; Jung, D.; Min, K. Hybrid thermostat strategy for enhancing fuel economy of series hybrid intracity bus. IEEE Trans. Veh. Technol. 2014, 63, 3569–3579. [Google Scholar] [CrossRef]
  28. Gao, J.; Zhu, G.G.; Strangas, E.G.; Sun, F. Equivalent fuel consumption optimal control of a series hybrid electric vehicle. Proc. Inst. Mech. Eng. Part D J. Automob. Eng. 2009, 223, 1003–1018. [Google Scholar] [CrossRef]
  29. Ehsani, M.; Gao, Y.; Emadi, A. Modern Electric, Hybrid Electric, and Fuel Cell Vehicles: Fundamentals, Theory, and Design; CRC Press: Boca Raton, FL, USA, 2009. [Google Scholar]
  30. Fajri, P.; Ahmadi, R.; Ferdowsi, M. Equivalent vehicle rotational inertia used for electric vehicle test bench dynamic studies. In Proceedings of the IECON 2012-38th Annual Conference on IEEE Industrial Electronics Society, Montreal, QC, Canada, 25–28 October 2012; pp. 4115–4120. [Google Scholar]
  31. Kugelstadt, T. “Active Filter Design Techniques” in Op Amps for Everyone: Design Reference; Newnes: Boston, MA, USA, 2008; pp. 271–281. [Google Scholar]
  32. Mahadik, Y.; Vadirajacharya, K. Battery Life Enhancement in a Hybrid Electrical Energy Storage System Using a Multi-Source Inverter. World Electr. Veh. J. 2019, 10, 17. [Google Scholar] [CrossRef] [Green Version]
  33. Baisden, A.C.; Emadi, A. ADVISOR-based model of a battery and an ultra-capacitor energy source for hybrid electric vehicles. IEEE Trans. Veh. Technol. 2004, 53, 199–205. [Google Scholar] [CrossRef]
  34. Sun, D.; Lan, F.; Chen, J. Energy management strategy research and performance simulation for electric vehicles based on dual-energy storage system. In Proceedings of the 2013 6th International Conference on Information Management, Innovation Management and Industrial Engineering, Xi’an, China, 23–24 November 2013; pp. 442–445. [Google Scholar]
  35. Shi, L.; Crow, M. Comparison of ultracapacitor electric circuit models. In Proceedings of the 2008 IEEE Power and Energy Society General Meeting-Conversion and Delivery of Electrical Energy in the 21st Century, Pittsburgh, PA, USA, 20–24 July 2008; pp. 1–6. [Google Scholar]
  36. Paladini, V.; Donateo, T.; De Risi, A.; Laforgia, D. Super-capacitors fuel-cell hybrid electric vehicle optimization and control strategy development. Energy Convers. Manag. 2007, 48, 3001–3008. [Google Scholar] [CrossRef]
  37. Jalil, N.; Kheir, N.A.; Salman, M. A rule-based energy management strategy for a series hybrid vehicle. In Proceedings of the 1997 American Control Conference (Cat. No. 97CH36041), Albuquerque, NM, USA, 6 June 1997; pp. 689–693. [Google Scholar]
  38. Elsied, M.; Oukaour, A.; Chaoui, H.; Gualous, H.; Hassan, R.; Amin, A. Real-time implementation of four-phase interleaved DC–DC boost converter for electric vehicle power system. Electr. Power Syst. Res. 2016, 141, 210–220. [Google Scholar] [CrossRef]
  39. Liu, W. Hybrid Electric Vehicle System Modeling and Control; John Wiley & Sons: Hoboken, NJ, USA, 2017. [Google Scholar]
  40. Song, Z.; Li, J.; Han, X.; Xu, L.; Lu, L.; Ouyang, M.; Hofmann, H. Multi-objective optimization of a semi-active battery/supercapacitor energy storage system for electric vehicles. Appl. Energy 2014, 135, 212–224. [Google Scholar] [CrossRef]
  41. He, H.; Xiong, R.; Zhao, K.; Liu, Z. Energy management strategy research on a hybrid power system by hardware-in-loop experiments. Appl. Energy 2013, 112, 1311–1317. [Google Scholar] [CrossRef]
  42. Xie, S.; Hu, X.; Lang, K.; Qi, S.; Liu, T. Powering mode-integrated energy management strategy for a plug-in hybrid electric truck with an automatic mechanical transmission based on pontryagin’s minimum principle. Sustainability 2018, 10, 3758. [Google Scholar] [CrossRef] [Green Version]
  43. Zeng, Y.; Cai, Y.; Kou, G.; Gao, W.; Qin, D. Energy management for plug-in hybrid electric vehicle based on adaptive simplified-ECMS. Sustainability 2018, 10, 2060. [Google Scholar] [CrossRef] [Green Version]
  44. Rydh, C.J.; Sandén, B.A. Energy analysis of batteries in photovoltaic systems. Part II: Energy return factors and overall battery efficiencies. Energy Convers. Manag. 2005, 46, 1980–2000. [Google Scholar] [CrossRef]
  45. Poli, R.; Kennedy, J.; Blackwell, T. Particle swarm optimization. Swarm Intell. 2007, 1, 33–57. [Google Scholar] [CrossRef]
  46. Bai, Q. Analysis of particle swarm optimization algorithm. Comput. Inf. Sci. 2010, 3, 180. [Google Scholar] [CrossRef] [Green Version]
  47. Eberhart, R.; Kennedy, J. A new optimizer using particle swarm theory. In Proceedings of the Sixth International Symposium on Micro Machine and Human Science, Piscataway, NJ, USA, 4–6 October 1995; pp. 39–43. [Google Scholar]
  48. Chen, S.-Y.; Wu, C.-H.; Hung, Y.-H.; Chung, C.-T. Optimal strategies of energy management integrated with transmission control for a hybrid electric vehicle using dynamic particle swarm optimization. Energy 2018, 160, 154–170. [Google Scholar] [CrossRef]
  49. Chen, Z.; Xiong, R.; Cao, J. Particle swarm optimization-based optimal power management of plug-in hybrid electric vehicles considering uncertain driving conditions. Energy 2016, 96, 197–208. [Google Scholar] [CrossRef]
  50. Shi, Y.; Eberhart, R. A modified particle swarm optimizer. In Proceedings of the 1998 IEEE international conference on evolutionary computation proceedings. IEEE world congress on computational intelligence (Cat. No. 98TH8360), Anchorage, AK, USA, 4–9 May 1998; pp. 69–73. [Google Scholar]
  51. Shi, Y.; Eberhart, R.C. Empirical study of particle swarm optimization. In Proceedings of the 1999 congress on evolutionary computation-CEC99 (Cat. No. 99TH8406), Washington, DC, USA, 6–9 July 1999; pp. 1945–1950. [Google Scholar]
  52. Zheng, Y.-L.; Ma, L.-H.; Zhang, L.-Y.; Qian, J.-X. On the convergence analysis and parameter selection in particle swarm optimization. In Proceedings of the 2003 International Conference on Machine Learning and Cybernetics (IEEE Cat. No. 03EX693), Xi’an, China, 5 November 2003; pp. 1802–1807. [Google Scholar]
  53. Shi, Y.; Eberhart, R.C. Parameter selection in particle swarm optimization. In International Conference on Evolutionary Programming; Springer: Berlin/Heidelberg, Germany, 1998; pp. 591–600. [Google Scholar]
  54. Li-Ping, Z.; Huan-Jun, Y.; Shang-Xu, H. Optimal choice of parameters for particle swarm optimization. J. Zhejiang Univ. Sci. A 2005, 6, 528–534. [Google Scholar] [CrossRef]
  55. M’hamdi, B.; Teguar, M.; Mekhaldi, A. Optimal design of corona ring on HV composite insulator using PSO approach with dynamic population size. IEEE Trans. Dielectr. Electr. Insul. 2016, 23, 1048–1057. [Google Scholar] [CrossRef]
  56. Xin, J.; Chen, G.; Hai, Y. A particle swarm optimizer with multi-stage linearly-decreasing inertia weight. In Proceedings of the 2009 International Joint Conference on Computational Sciences and Optimization, Sanya, Hainan, China, 24–26 April 2009; pp. 505–508. [Google Scholar]
  57. Kim, M. Engine torque command handling for a series hybrid electric bus. Proc. Inst. Mech. Eng. Part D J. Automob. Eng. 2017, 231, 638–652. [Google Scholar] [CrossRef]
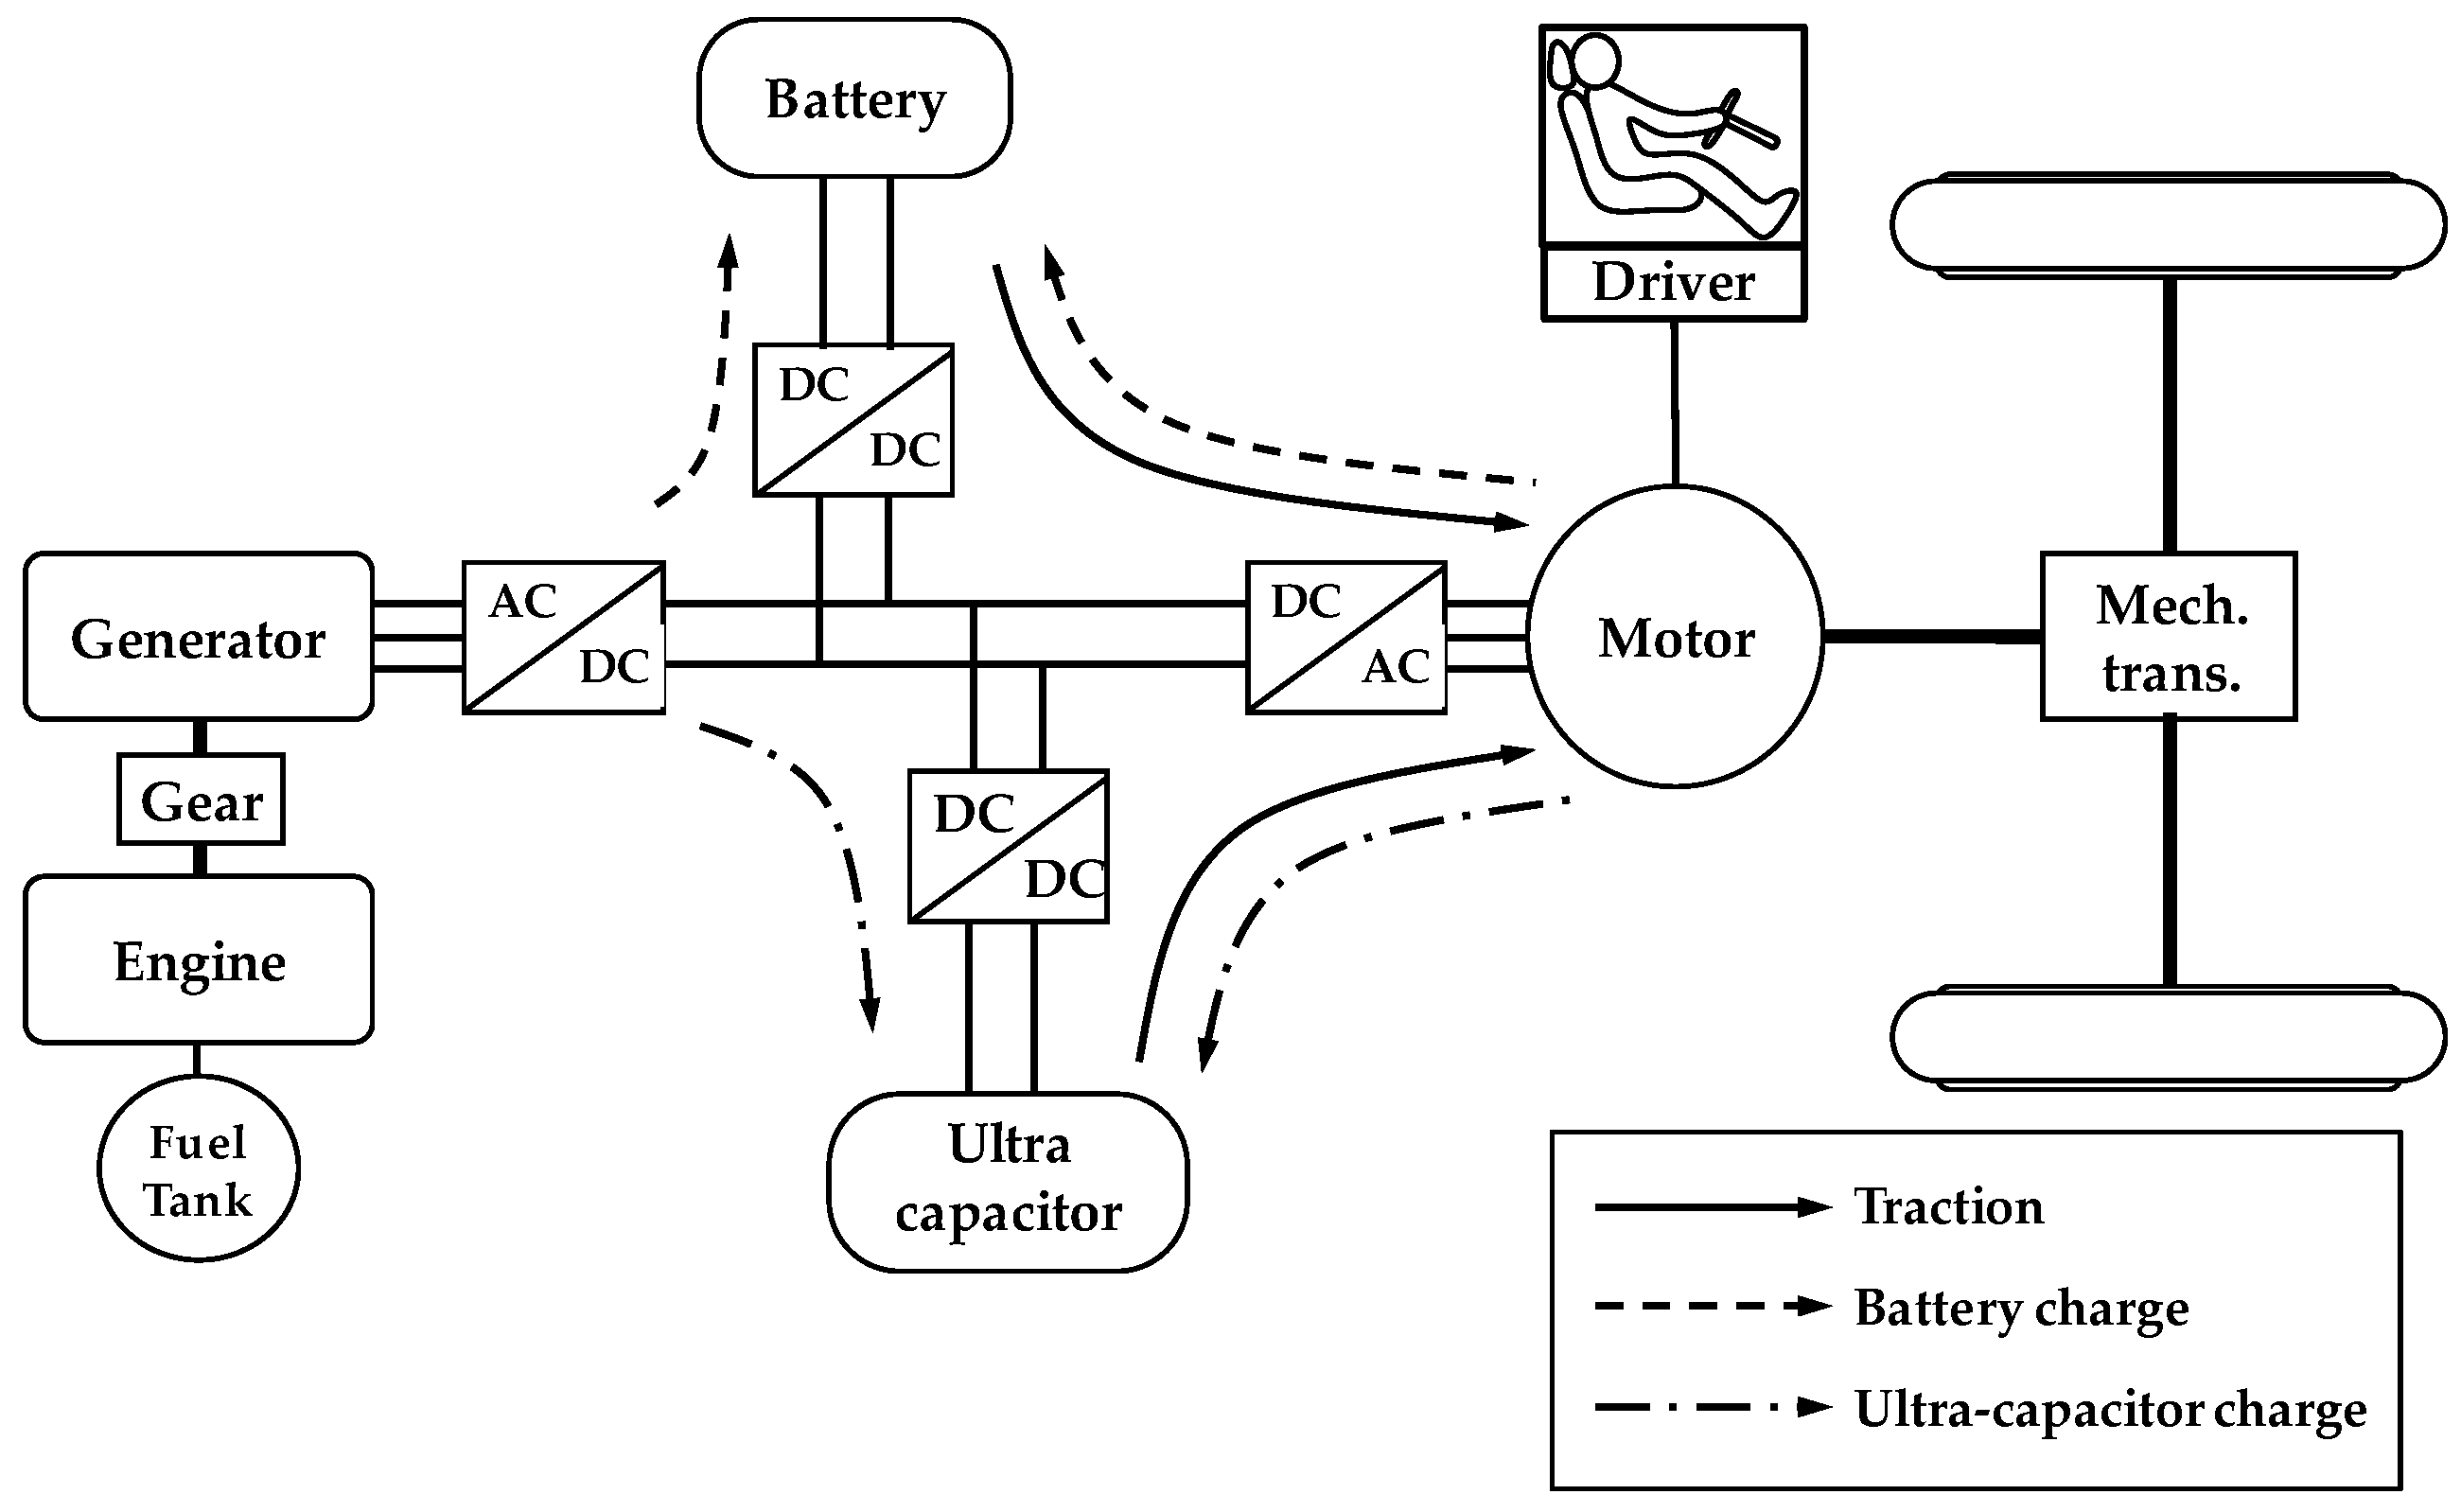
Figure 1. Forward simulation model of SHEB powertrain.
Sustainability 12 07354 g001
Figure 2. Longitudinal dynamics model for tractive resistance.
Sustainability 12 07354 g002
Figure 3. Efficiency maps: (a) engine brake-specific fuel consumption; (b) generator efficiency.
Sustainability 12 07354 g003
Figure 4. Equivalent battery model.
Sustainability 12 07354 g004
Figure 5. Efficiency improvement factors: (a) threshold of required power of motor; (b) power split ratio.
Sustainability 12 07354 g005
Figure 6. PSO algorithm: (a) algorithm flowchart; (b) movement of one particle.
Sustainability 12 07354 g006
Figure 7. Test driving cycles. (a) Manhattan cycle; (b) Braunschweig cycle; (c) Orange County cycle.
Sustainability 12 07354 g007
Figure 8. Optimization trajectories of each cycle: (a) design variable trajectories of Manhattan cycle; (b) object function trajectory of Manhattan cycle; (c) design variable trajectories of Braunschweig cycle; (d) object function trajectory of Braunschweig cycle; (e) design variable trajectories of Orange County cycle; (f) object function trajectory of Orange County cycle.
Sustainability 12 07354 g008
Figure 9. Required power of motor: (a) Manhattan cycle; (b) Braunschweig cycle; (c) Orange County cycle.
Sustainability 12 07354 g009
Figure 10. Enlarged view of motor power supply: (a) Manhattan cycle; (b) Braunschweig cycle; (c) Orange County cycle.
Sustainability 12 07354 g010
Figure 11. Enlarged view of ESS efficiencies: (a) battery efficiencies of proposed and conventional SHEBs in Manhattan cycle; (b) UC efficiency of proposed SHEB in Manhattan cycle; (c) battery efficiencies of proposed and conventional SHEBs in Braunschweig cycle; (d) UC efficiency of proposed SHEB in Braunschweig cycle; (e) battery efficiencies of proposed and conventional SHEBs in Orange County cycle; (f) UC efficiency of proposed SHEB in Orange County cycle.
Sustainability 12 07354 g011
Figure 12. Battery and UC SOCs: (a) Manhattan cycle with conventional SHEB; (b) Manhattan cycle with proposed SHEB; (c) Braunschweig cycle with conventional SHEB; (d) Braunschweig cycle with proposed SHEB; (e) Orange County cycle with conventional SHEB; (f) Orange County cycle with proposed SHEB.
Sustainability 12 07354 g012
Figure 13. Total fuel consumption comparisons: (a) Manhattan cycle; (b) Braunschweig cycle; (c) Orange County cycle.
Sustainability 12 07354 g013
Table 1. Basic parameters of SHEB.
ParametersValues
Weight (ton)16
Air Drag Coefficient0.6
Air Density (kg/m3)1.226
Front Area (m2)6.6
Gravitational acceleration (m/s2)9.81
Maximum Motor Power (kW)240
Maximum Generator Power (kW)200
Maximum Engine Power (kW)180
Battery TypeLi-ion
Battery Internal Resistance (ohm)0.17 @ SOC 0.5
Ultra-capacitor (ohm)0.022
Table 2. Parameters of the PSO algorithm.
ParametersValue
Particle number10
Maximum iterations100
Inertia weight coefficient ( ω s t a r t )1
Weight damped coefficient ( ω e n d )0.4
Cognitive acceleration coefficient (c1)1
Social acceleration coefficient (c2)1
Random numbers (r1, r2)[0, 1]
Table 3. Optimum of the optimization variables.
Driving cyclesTRPM (kW)SPSRYPSRTotal Fuel
Consumption (g)
Manhattan cycle (initial condition of PSO)151.12.747 × 10−30.23771326
Braunschweig cycle (initial condition of PSO)139.22.575 × 10−30.25923672
Orange County cycle (initial condition of PSO)148.21.845 × 10−30.18513592
Manhattan cycle (result of PSO)44.491.795 × 10−30.25751284
Braunschweig cycle (result of PSO)59.312.081 × 10−30.12843548
Orange County cycle (result of PSO)35.262.095 × 10−30.09413499