1. Introduction
The express delivery business is growing year by year in China. Due to the emergence and rapid development of various forms of online shopping such as new retail, e-commerce, online to offline, etc., the Chinese express delivery business has seen explosive growth. According to the statistical data from the National Post Office, in 2019, the volume of the Chinese express delivery business reached 63.52 billion pieces, an increase of 25.3% over 2018 [
1]. The volume and growth rate of the express delivery business over the last five years is shown in
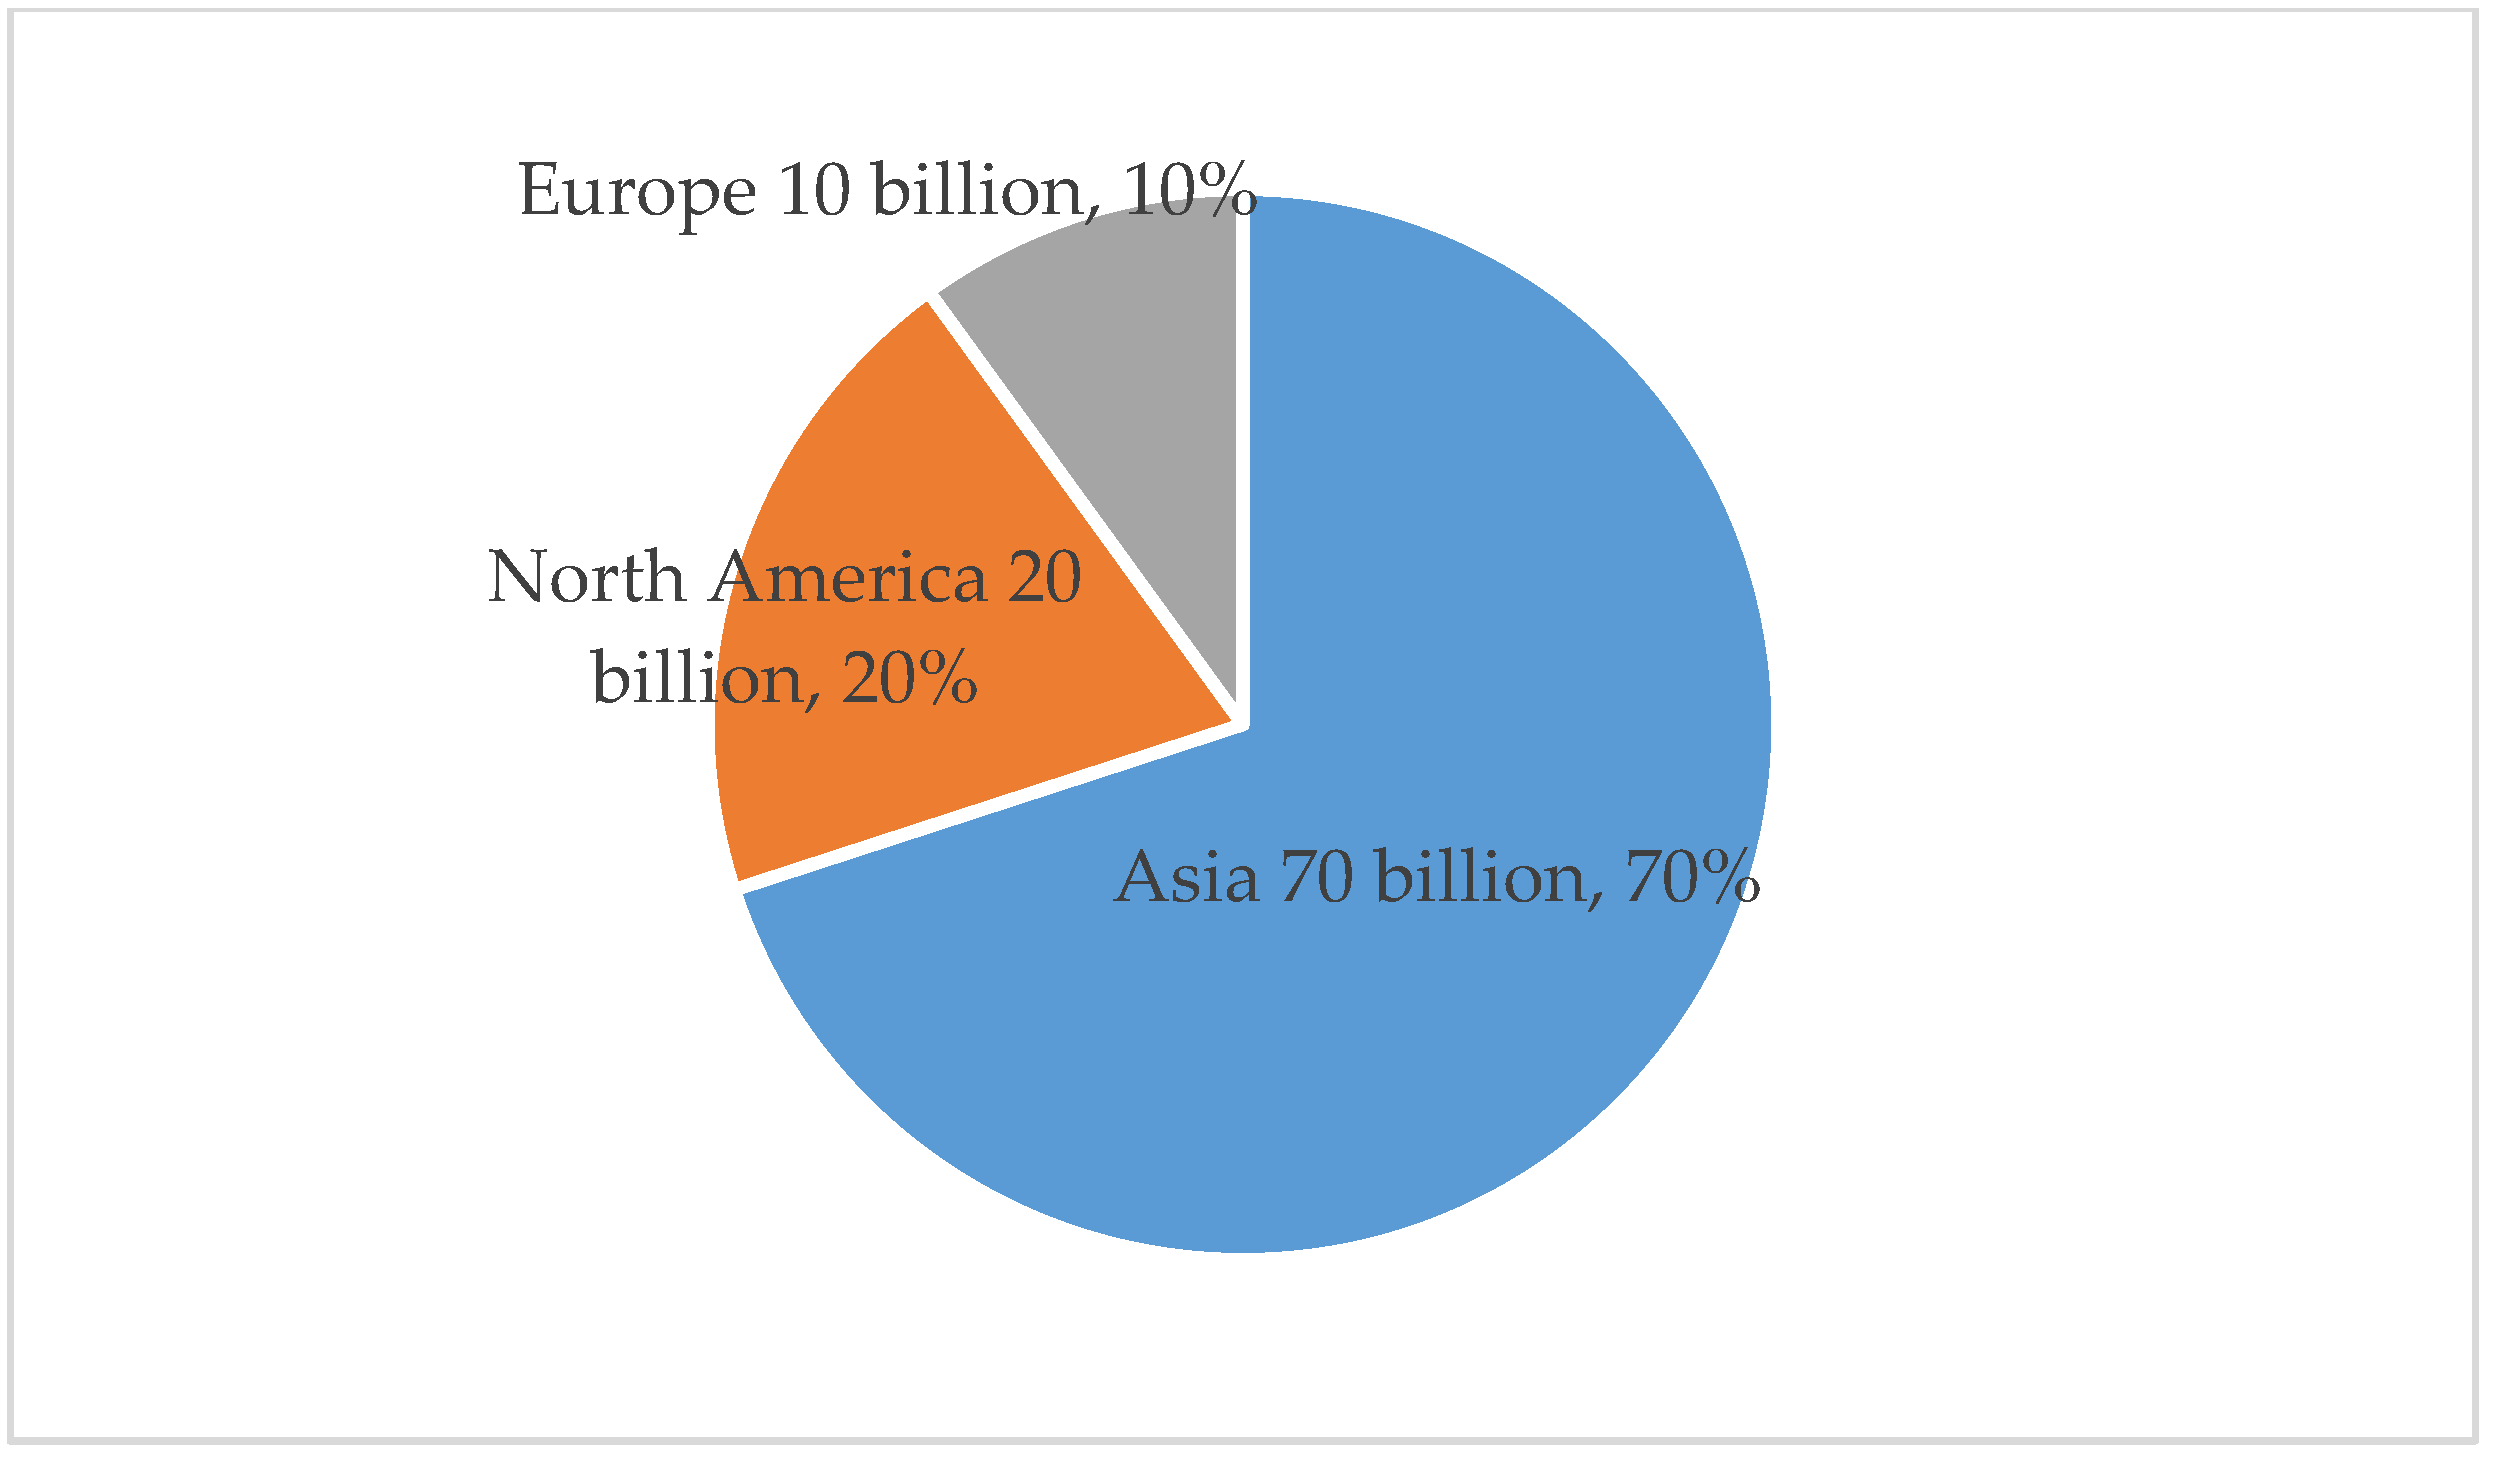
Figure 1. In 2018, the global express business was nearly 100 billion pieces, while China was 50.71 billion pieces, accounting for more than 50% of the global market. Asia, North America, and Europe account for 70%, 20%, and 10%, respectively. As can be seen in
Figure 2, China’s express business has exceeded the total amount of the developed economies of the United States, Japan, and Europe [
2].
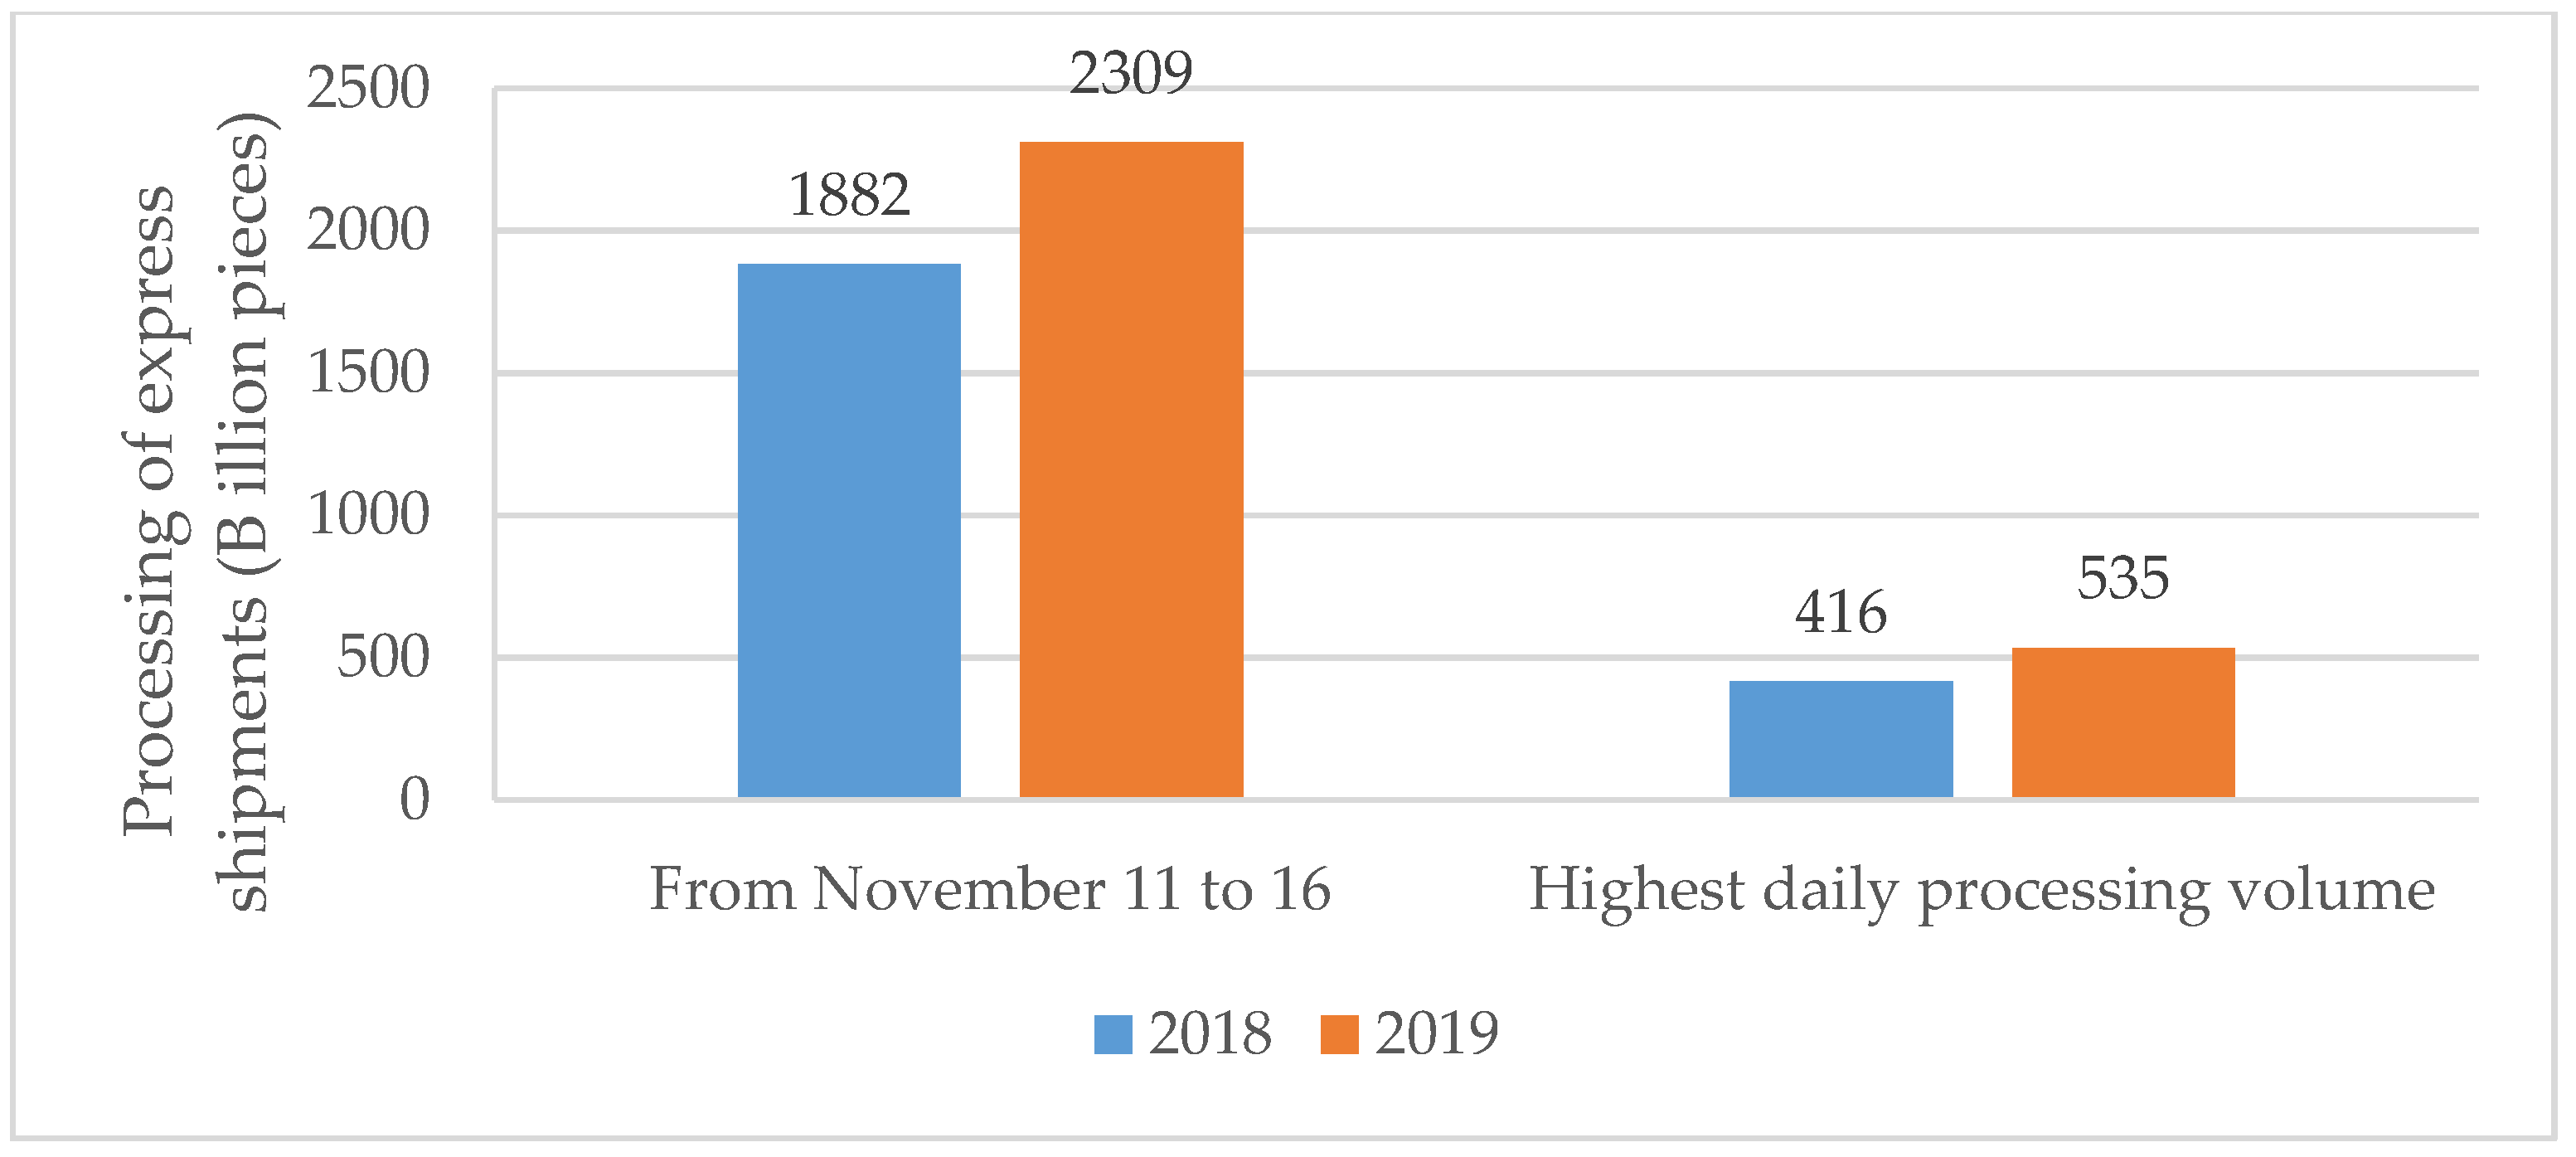
While the volume of the express delivery business is growing, consumers are also demanding increasingly better timeliness for express deliveries. In 2013, it took nine days to deliver 100 million parcels, and there were still overloaded warehouses. However, in 2019, affected by the concentrated promotion of e-commerce platforms, a total of 2309 billion pieces of express parcels were processed only in six days from November 11 to 16.
Figure 3 shows the volume of express parcels processed from November 11 to 16 and the highest daily volumes in 2018 and 2019. The highest daily processing volume reached 535 million pieces, up 28.6% year-on-year [
1].
High timeliness requirements have led to efficient last-mile delivery. There are mainly two modes of last-mile delivery. One is that the couriers drive electric bicycles or tricycles from the distribution points to the consumers’ homes, such as Shunfeng home delivery, Jingdong home delivery, Suning home delivery, etc. The other is that the couriers drive a minibus or light truck from the distribution points to the self-service express cabinets of residential areas or office buildings, such as Suyidi, Feng Nest, Rookie Bird post station, etc. Most consumers expect home delivery. However, home delivery usually has the following problems. If the couriers experience road congestion, then there is a high probability of delaying the delivery time. A large number of last-mile delivery express deliveries maybe result in high pressure on road traffic, which is not conducive to energy savings and emission reductions. Electric bicycles and tricycles are usually used in last mile delivery, which have many safety hazards and are prone to traffic accidents. From 2013 to 2017, approximately 56,200 electric bicycle accidents occurred nationwide, resulting in 8431 deaths, 63,500 injuries, and 110 million CNY in direct property damage [
3]. In addition, the problem of atmospheric pollution caused by motor vehicle emissions is becoming increasingly more prominent. In 2018, China had 18.18 million diesel trucks, although car ownership was only 7.9%. However, the trucks emitted 3.789 million tons of nitrogen oxide (NOx), accounting for 72.6% of the total vehicle emissions. The emissions of atmospheric particulate matter (PM) from these trucks accounted for more than 90% of the total PM emissions from all vehicles [
4]. Therefore, solving the problem of air pollution from freight vehicles is the top priority of Chinese environmental protection work.
Recent studies have demonstrated the feasibility and efficiency of using public transportation such as subways, buses, and trams for express delivery. This mode of freight on transit can reduce some of the delivery work of freight vehicles, reduce pressure on road traffic, and reduce environmental pollution [
5,
6,
7,
8,
9,
10,
11]. Van introduced a rural pilot project that was developed in the East of the Netherlands, and found that approximately 57.43 kg CO
2 emission was reduced per day if all the parcels towards Millingen aan de Rijn were delivered by cargo hitching [
7]. Kiba-Janiak conducted survey among cities in Poland, and found that of these 52 projects, 80% resulted in a reduction of emissions of CO
2, NO
x, and PM, while approximately 20% reduced noise in the city [
12]. Operational costs can be reduced by up to 27% by integrating passenger and freight flows. CO
2 emissions could be decreased by up to 70% by reducing the number of vehicles [
13]. In addition, it can make effective use of the carrying space of public transport vehicles, and can take advantage of its strong conveying capacity, fast operating speed, low transportation cost, and low environmental pollution [
5,
6,
7,
8,
9,
10,
11]. China encourages this mode of freight on transit. The
‘Chinese Thirteenth Five-Year Plan for Science, Technology and Innovation in Transportation’ proposed to develop intelligent and economical modes of freight suitable for the use of urban rail passenger transportation during periods of low passenger loads, taking into account the needs of the transportation of daily necessities between central areas and suburbs [
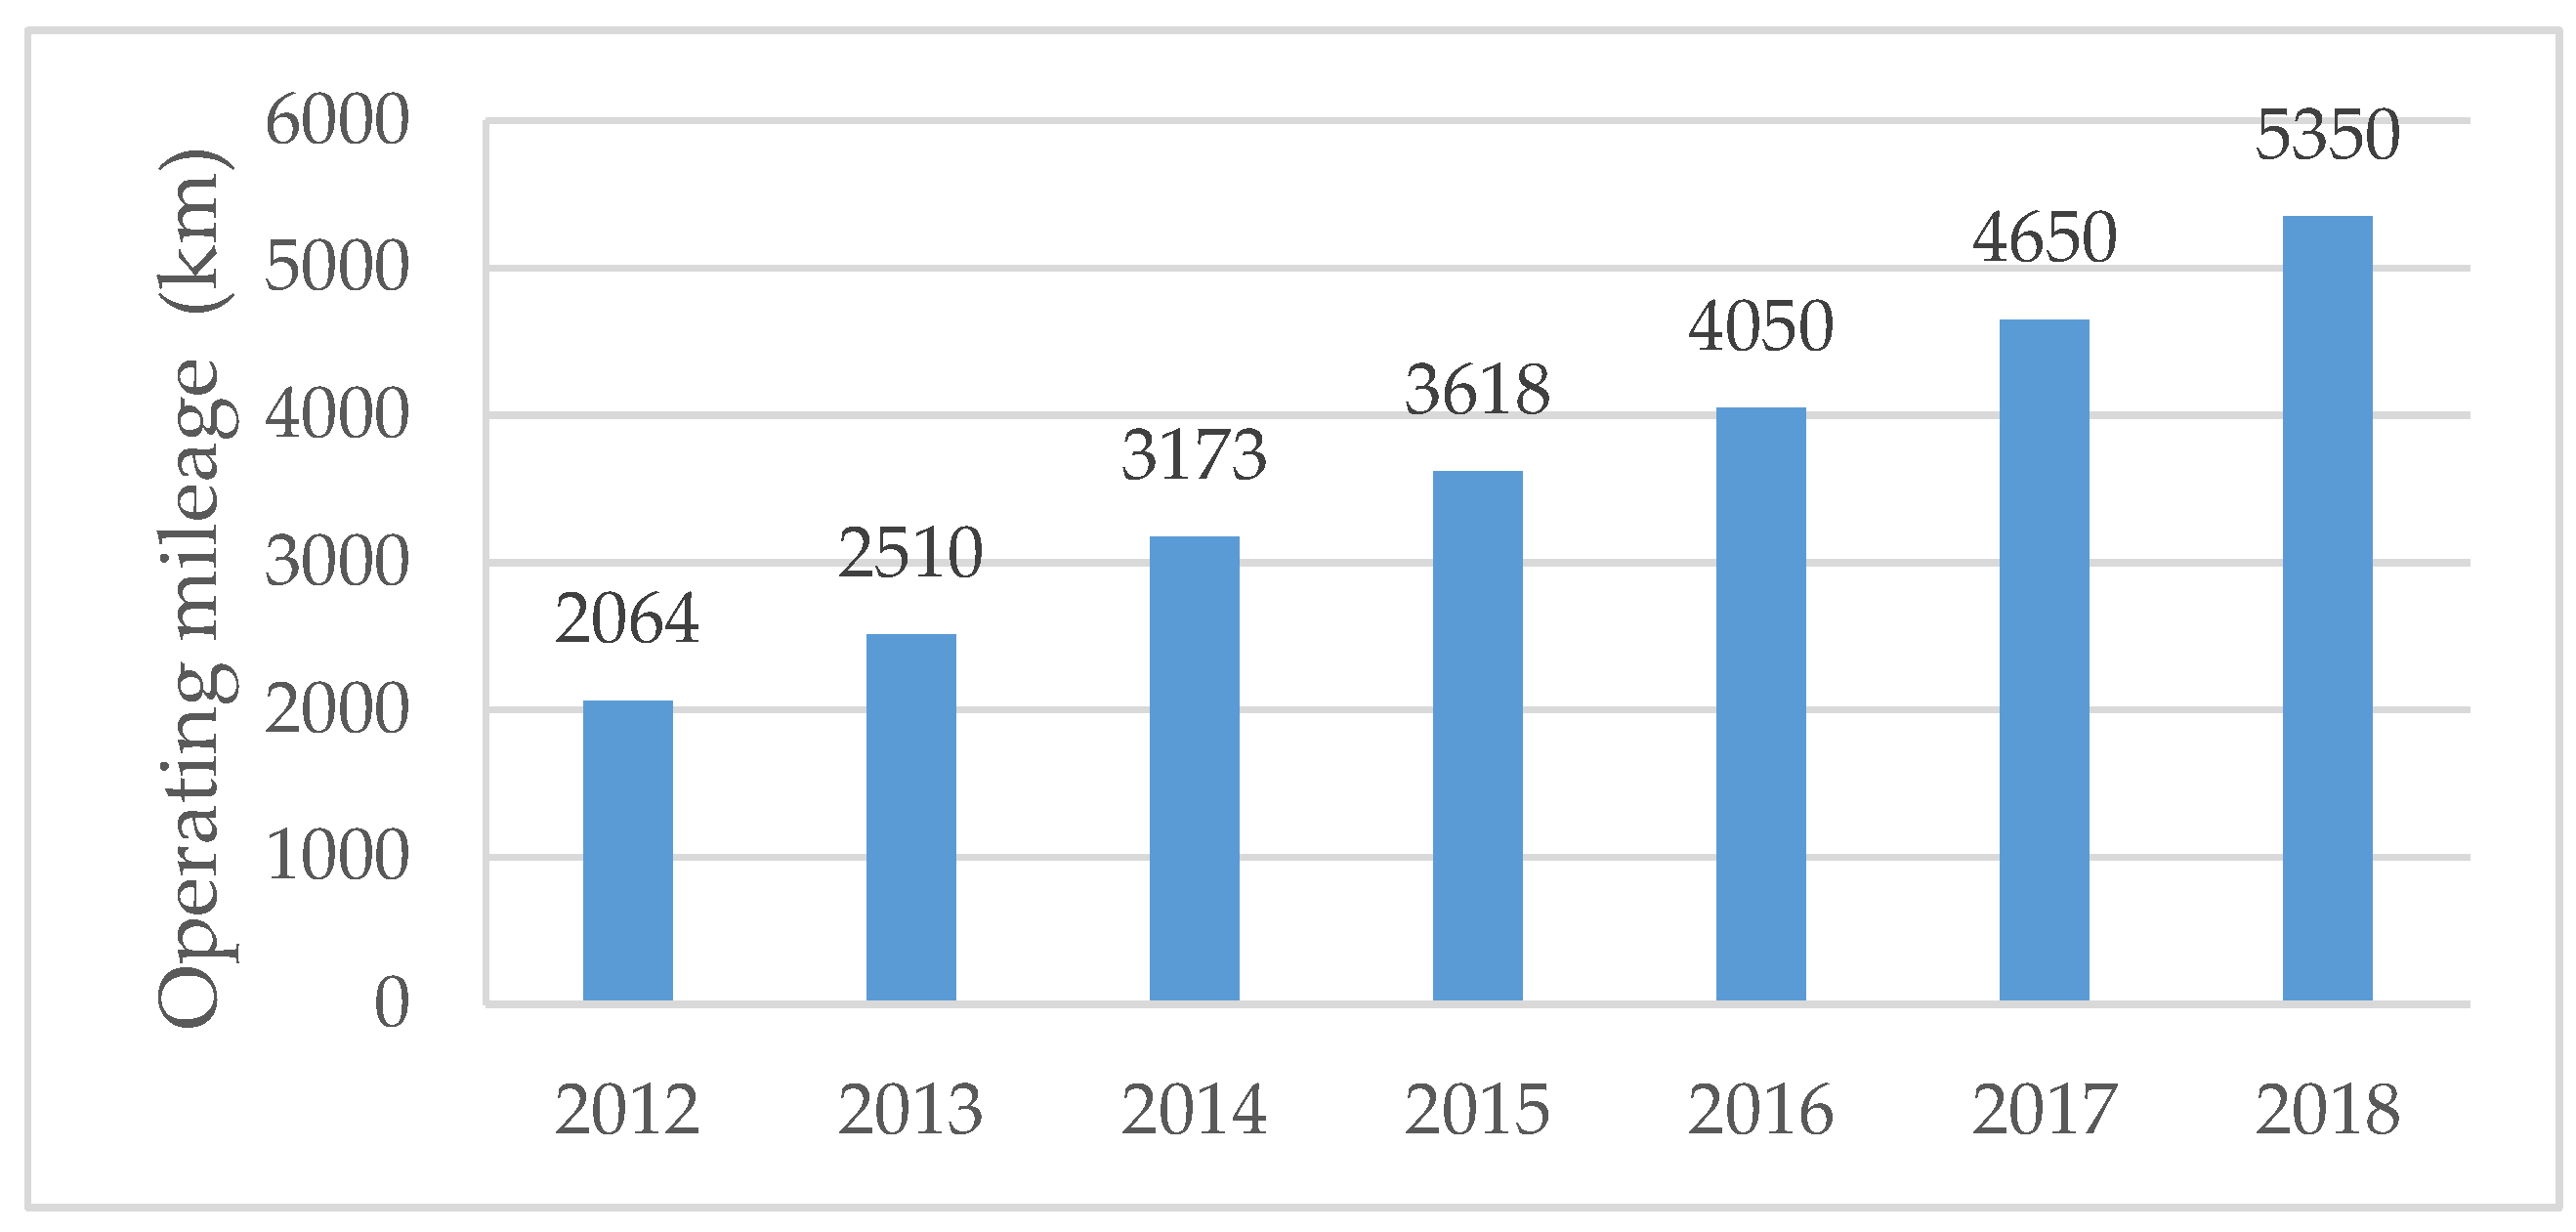
14]. If passenger and freight transportation can be effectively combined, it can play a very good role in promoting green, low-carbon, environmentally friendly, and sustainable transportation. Chinese subways have been developing rapidly, and the historical operating mileage of an urban subway is shown in
Figure 4 [
3]. The completed subway network lays the foundation for the implementation of freight on transit.
Studies have focused on the feasibility of urban distribution based on subways, the locations of transfer points, and the routing optimization problem [
15,
16,
17,
18,
19,
20,
21,
22]. In the practice of urban subway distribution, most of the parcels delivered by the subway are taken out by couriers from the subway station, and then couriers ride tricycles or bicycles to the consumers’ home or office. Few studies have mentioned the setting of express cabinets at subway stations, which can reduce the need for couriers to deliver parcels from subway stations to consumers. These smart cabinets located in subway stations mainly serve commuters who are frequent subway users. When they take the subway, they drop by to take out their deliveries. The consumers will consider whether the parcels are easy to carry, as it is still a long way from the subway station to their home or office. The consumers will also consider the pick-up time, as the subway commuters are always in a hurry to get to and from work. It could be seen that this self-service mode has significant limitations for the consumers. Now that people have become accustomed to downstairs pickup or home delivery, most consumers will find the self-service mode in subway stations not very convenient, and it will be difficult to accept this mode. It is unclear whether consumers are willing to accept this self-service mode based on the subway distribution. Further research on how to promote this self-service mode of express cabinets in subway stations is needed.
It is expected that research will be able to better explain consumers’ preferences for this new self-service mode of express cabinets in subway stations and to explore the factors influencing their preferences. Thus, they were examined in this paper. From June 2019 to September 2019, in Nanjing, Jiangsu province, China, the authors conducted online and offline questionnaires to analyze the preferences, concerns, and suggestions regarding the self-service mode based on the subway distribution. By investigating whether consumers were willing to use the self-service in subway stations, the logit model was applied to explore the consumers’ preferences and their influencing factors. The concerns regarding the self–service mode were analyzed and promotional suggestions were proposed. In the face of the global Corona Virus Disease-19 (COVID-19) outbreak, the increase in online shopping has directly led to an increase in package volumes, putting a lot of pressure on traditional truck delivery. Meanwhile, the implementation of “contactless” delivery, such as drone delivery and robot delivery, has been accelerated. China has not yet implemented subway distribution in cities, but the outbreak of the epidemic may prompt the implementation of subway distribution plan to share some of the transportation pressure. This subway distribution and self-service mode of express cabinets in station proposed in this paper is expected to provide suggestions for last mile delivery in China and even more regions.
The content of the rest of the paper is organized as follows.
Section 2 reviews the literature.
Section 3 designs the self-service mode based on the subway distribution.
Section 4 states the research methodology.
Section 5 is the results and discussion, and
Section 6 is the conclusion.
2. Literature Review
In recent years, passenger and cargo sharing systems, which are different from traditional dedicated cargo vehicles, have received increasing attention. The concepts such as logistics pooling, freight on transit, cargo hitching, using urban public transport for freight deliveries, mixed passengers and goods transportation, integrating passenger and freight transport systems are introduced. The combination of passengers and freight flows provides an opportunity to further promote the efficiency gains. Current sharing strategies for freight services are based on public transport modes such as subway [
6,
18,
19,
20,
21,
23,
24,
25,
26], bus [
7,
8,
9,
13,
17,
22,
27,
28], bus rapid transit [
15,
16], and trams [
5,
7,
29]. By effectively using the surplus capacity of public transport vehicles, the distribution of a considerable part of the freight vehicles can be reduced, and the road traffic pressure and environmental pressure can be alleviated.
Recent studies have demonstrated the feasibility and efficiency of using public transportation such as subways, busesm and trams for express delivery. Kikuta et al. studied the integration of the subway system in Sappora, Japan, with the traditional truck transportation system to make goods distribution more smoothly between the suburbs and the city center [
26]. Dampier et al. studied the feasibility of the Tyne and Wear metro system to deliver goods directly to the city center [
30]. Arvidsson reviewed the success and failure of tram systems for urban freight transport and proposed a low-emission multimodal transport solution using trams [
5]. Van calculated the benefits of cargo hitching, including being able to share space and reduce costs [
7]. The goods distribution method based on subway, bus, and tram has its applicability. Subway is suitable for distribution in cities with a large turnover of goods. Buses and trams are suitable for distribution in areas with a low turnover of goods. In the current climate where energy efficiency is becoming more and more important, the subway-based urban freight transport is more competitive than buses and trams. Subway distribution can take advantage of its high conveying capacity, high operating speed, punctuality and reliability, and low environmental pollution. Especially in China, where road congestion can lead to unpunctuality of buses and the capacity of buses is limited, the subway distribution is more suitable for urban distribution. In rural areas of China where there is no subway, conventional public transport has been applied to distribute goods.
Studies have focused on the feasibility of urban package distribution based on subways, the locations of transfer points, and the routing optimization problem [
15,
16,
17,
18,
19,
20,
21,
22]. Behiri raised issues that need to be addressed at the strategic, tactical, and operational levels of subway distribution [
18]. Mazzarino estimated the surplus space of the public transport system, suitable freight demand, freight and passenger flow, and studied the fine-tuning of the routes and schedules [
20]. Ghilas et al. studied the problem of set delivery with fixed scheduled routes considering time windows [
13]. Zhou has conducted a series of studies on the optimization of station locations and paths for subway distribution [
19,
21].
As for the research on the subway distribution mode, most of the existing researches have designed couriers to unload the express parcels from the subway station and then deliver them to consumers by tricycles or bicycles. Few studies have mentioned the setting of express cabinets at subway stations, which can reduce the need for couriers to deliver packages from subway stations to community self-service cabinets or home delivery. In 2012, Jingdong Mall opened self–service cabinets in Beijing subway stations, proving the feasibility of setting smart self–service cabinets in subway stations [
31]. This self-service mode in subway stations can further reduce the labor costs for distribution, carbon emissions, and traffic pressure. However, the self-service cabinets set up by Jingdong Mall in Beijing subway stations were not well used and were terminated within half a year after their implementation.
Further research on how to promote this self–service mode of express cabinets in subway stations is needed. It is unclear whether consumers are willing to accept this self–service mode based on the subway distribution. It is necessary to conduct further research to analyze consumers’ preferences for this self-service mode and identify the factors influencing their preferences. There are mainly five methodologies for researching behavior, namely interviews, questionnaires, case studies, modeling, and literature reviews. The interview methodology is usually used in combination with questionnaires. The questionnaire is the most common methodology for collecting large amounts of data. The selection behavior of the self-service mode in subway stations can be understood as quantitative analysis seeking to explain consumers’ choices and intentions using probability. The common method is to choose a discrete selection model. Discrete selection models include the logit model, nested logit model, probit model, and mixed logit model. The most widely used is the logit model [
32,
33,
34], which is simple to operate and easy to implement. This model can predict not only in-sample data, but also out-of-sample data [
35]. The logit model is a more mature approach and has been widely used in psychology, sociology, economics, and transportation [
36,
37,
38,
39,
40]. For example, Zhang explained the logistics dispatchers’ preferences for electric tricycles by using a binary logistic model [
41]. Kanchanapibul et al. applied a structural equation model and found that knowledge and the ecological effect played roles in determining young consumers’ green involvement and their actual purchases [
35]. By investigating whether consumers were willing to use the self-service mode in subway stations, the logit model was applied to explore the consumers’ preferences and their influencing factors.
Taking the above issues into consideration, we designed the self-service mode of express cabinets in station based on subway delivery and discussed the feasibility by investigating consumers’ preferences. The consumers’ preferences and influencing factors were examined by using the multicategorical logit model.
3. Self–Service Mode of Express Cabinets Based on the Subway Distribution
3.1. Process of Subway Distribution
Subway distribution is a relatively new mode that is already practiced in several cities but is still a fairly small part of the market. It does not replace the existing widespread use of dedicated truck delivery modes. After all, the subway network does not cover all areas of the city, so subway distribution only provides a new mode for urban distribution. In the practice of urban subway distribution, most of the parcels delivered by the subway are taken out by couriers from the subway station, and then couriers ride tricycles or bicycles to the consumers’ home or office, known as home delivery. The self-service cabinet in the subway station is also a novel way of express self-service, just for the consumers to add a choice, not to replace the existing delivery method and self-service method. The self-service cabinet downstairs in the neighborhood and the office building is already a very common self-service method. If the consumer is willing to try self-pickup in a metro station, he can put his delivery address as a subway station. If the consumer does not want to try this, his delivery address remains the same. The design of self-service cabinets based on the subway distribution is similar to the design of a regular self-service express cabinet, which is a large cabinet consisting of a number of small cabinets. The consumers use the cabinets in the same way to pick up their parcels. The only difference between a self-service cabinet in a subway station and one in a neighborhood or office building is the location where it is located. The self-service cabinets in station based on subway distribution mainly service commuters who are frequency subway users.
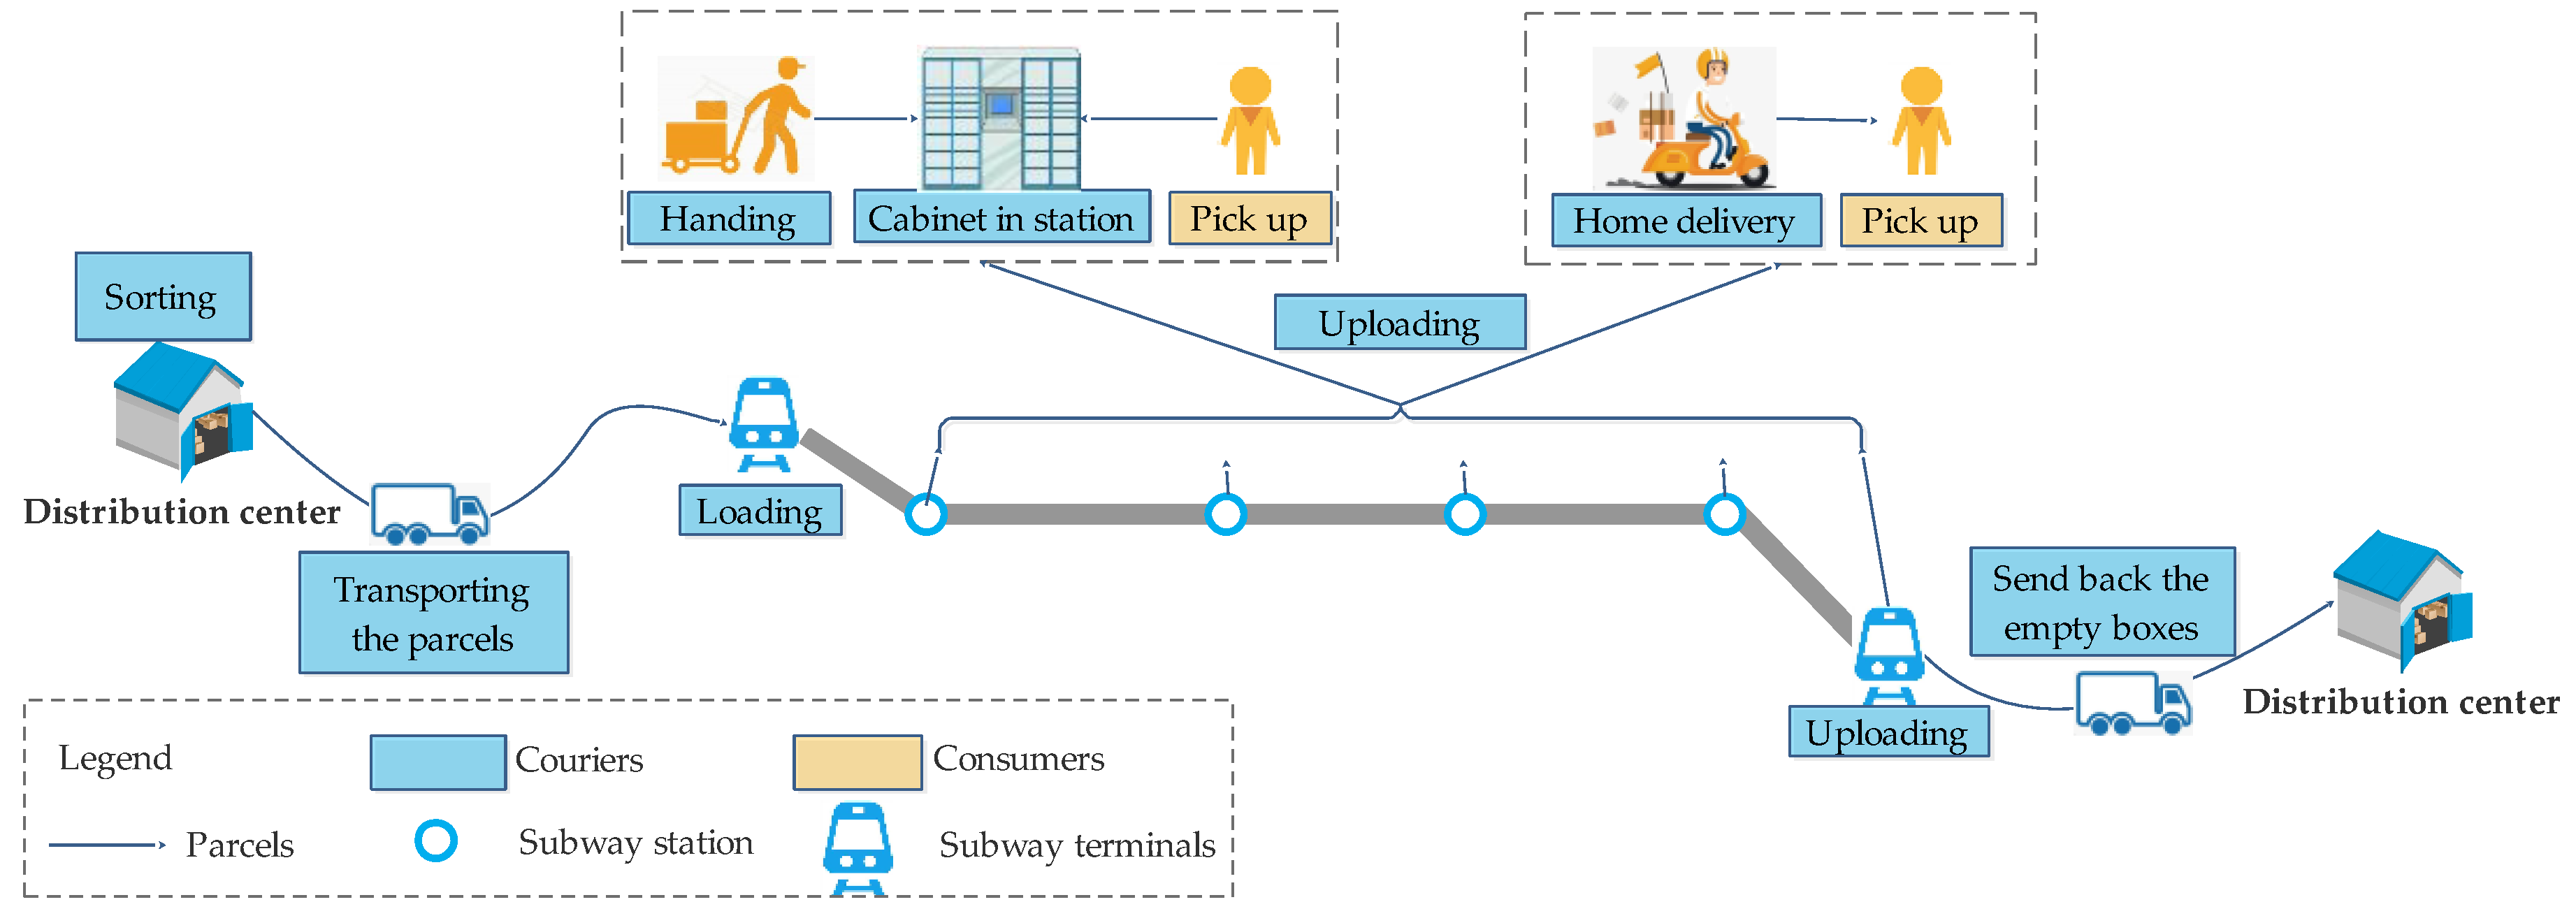
We designed two ways of delivery based on the last part of subway delivery. One is self–service in the subway station and the other is home delivery. The process of subway distribution as follows, and the flow chart is shown in
Figure 5.
Step 1. Sorting. Based on the consumer’s delivery address, the courier sorts the parcels into two categories at the distribution center. One is the parcels picked up by the consumer at the self-service cabinet at the subway station, and the other is the parcels delivered to home. The couriers sort the express parcels into distribution turnover boxes according to the destination subway station, that is, one station corresponds to the corresponding turnover box.
Step 2. Transportation and loading. The courier delivers the distribution turnover boxes via a dedicated truck to the first stop of subway and loads them to the available subway carriages.
Step 3. Uploading. After arriving at the destination station, the corresponding distribution turnover boxes will be uploaded from the subway carriage.
Step 4. Handing to the cabinet in station. The courier carries the first category of distribution turnover boxes to the cabinet in station and takes the express parcels out of the distribution turnover box and drop them into small cabinets corresponding to their size. Subsequently, consumers will receive a pick-up notice. Upon receipt of the notice, consumers pick up their own express parcels at the corresponding site.
Step 5. Home delivery. The courier carries the second category of distribution turnover boxes out of the metro station and drives a tricycle or bicycle for the last mile delivery to the consumers.
Step 6. Sending back the empty boxes. After the empty distribution turnover boxes are transported to the final station via subway, the courier drives the truck to bring the empty boxes back to the distribution center.
3.2. Available Time and Surplus Capacity of Subway Distribution
The subway can carry out distribution during off-peak passenger flow periods and during nighttime shutdown periods. However, we do not discuss the nighttime hours because it is inconvenient for people to load and unload goods during the nighttime shutdown hours. In this paper, we mainly consider the off- peak passenger flow during the subway operation hours and make full use of the spare capacity to provide urban distribution services.
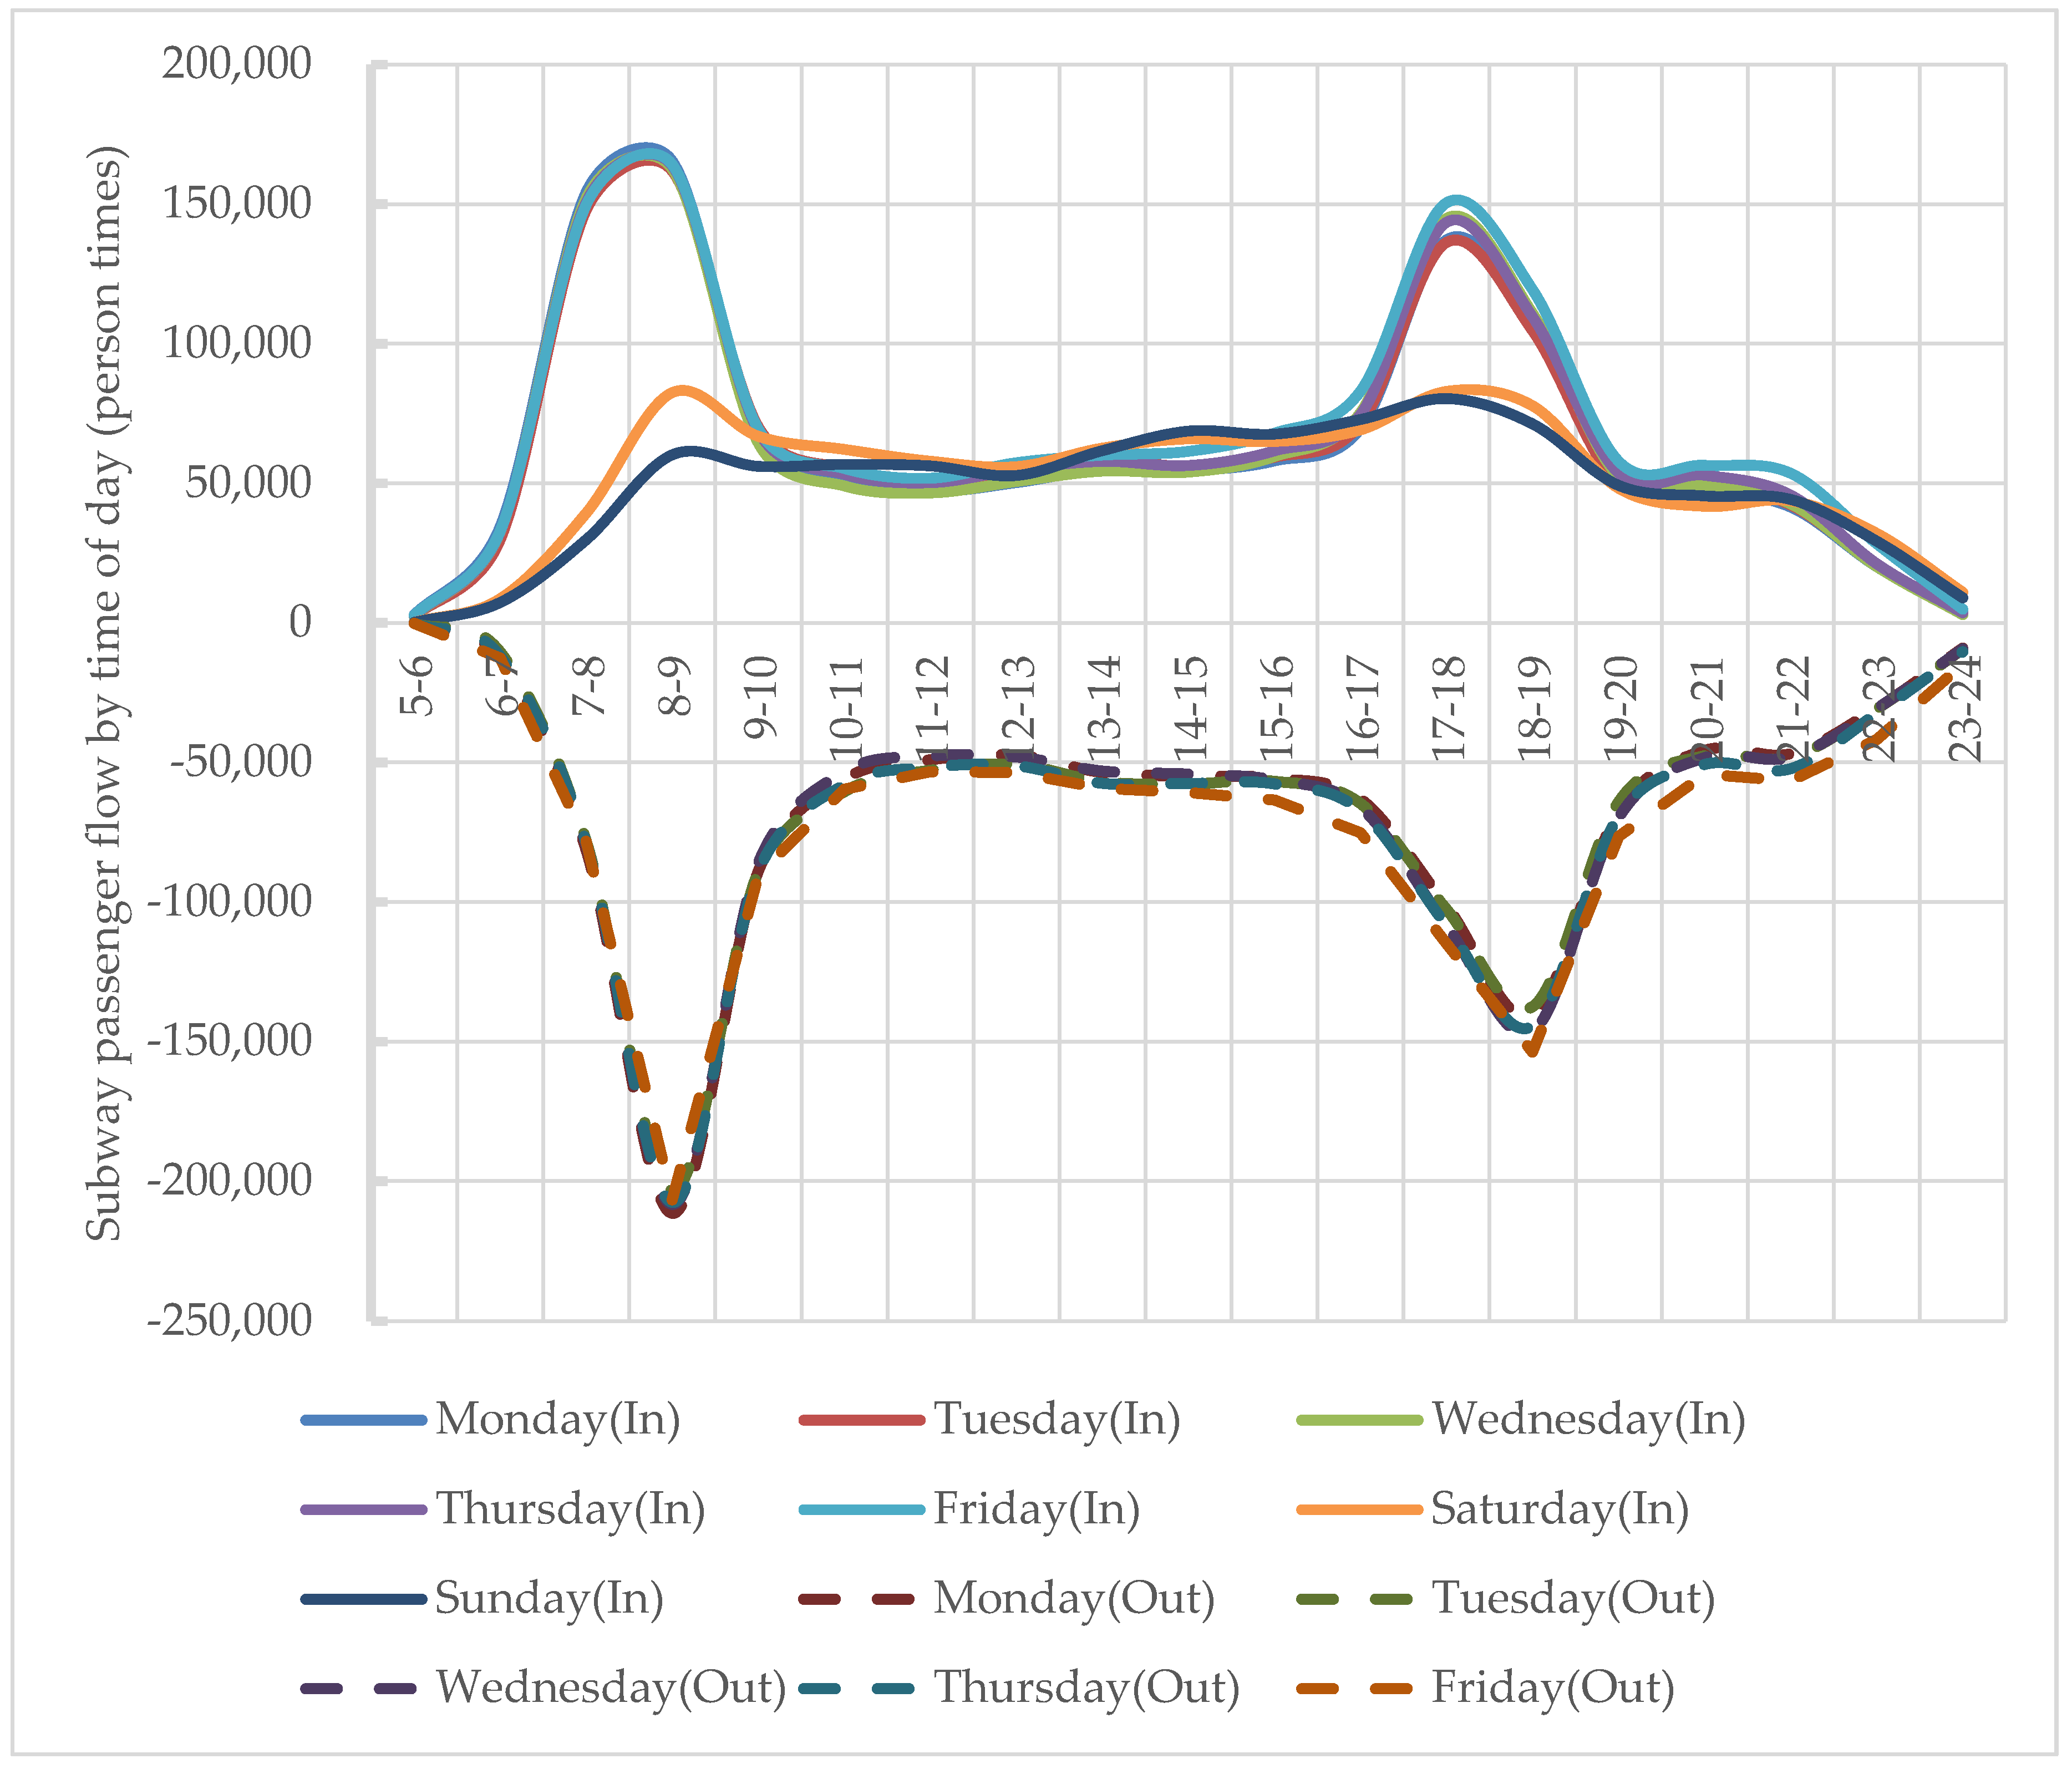
Subway operations usually have morning and evening peaks on weekdays [
42]. As shown in
Figure 6, the distribution of inbound and outbound passenger flow of Nanjing Subway in a week is shown. It can be seen that the morning peak of inbound flow is 7–9 a.m. and the evening peak is 17–19 p.m. Weekend passenger flow is significantly lower. The outbound morning peak is around 8–10 am and the evening peak is 18–20 p.m., basically an hour later than the inbound time.
Since there is a certain amount of surplus capacity during peak hours, it is possible to use the surplus capacity during peak hours for distribution. Of course, the morning departure time and the evening departure time cannot be used for distribution. Take Nanjing Subway as an example, the delivery times can be 10–17 p.m. and 20–22 p.m. on weekdays, and the weekend delivery hours can be 7–8 a.m., 10–15 p.m., and 20–22 p.m.
The following calculates the volume of express parcels available for subway distribution. This subway distribution proposed in the paper is based on the existing subway schedule and capacity unchanged. The railway capacity is constant with and without delivery tasks. In other words, it does not change the capacity and timetable of the existing subway, and on the basis of completing the task of carrying passengers, it uses the surplus capacity for distribution.
Here,
Ntrain is defined as the railway capacity, that is, the maximum number of trains in an hour.
Ntrain can be calculated as the Equation (1).
where
h is the interval time between trains, min.
Ctrain is defined as the train capacity without delivery task, that is, the maximum number of passengers travelling onboard in an hour without delivery task.
Ctrain can be calculated as the Equation (2).
where
Ncarriage is defined as the number of carriages in a train.
Ccarriage is the rated passenger capacity of each carriage. Generally,
Ccarriage is rated according to the per capita standing area of 6m
2 measurement. However, considering the comfort, the per capita standing area here must be increased, such as 10 m
2. Especially in the context of the current global outbreak of COVID-19, passengers travelling on public transport must maintain a social distance. Therefore, the social distance needs to be taken into account in the measurement.
The maximum number of carriages that can be used for subway distribution,
Nsurplus, can be calculated according to the following Equation (3).
where
PF is defined as passenger flow in an hour.
With the delivery task, the maximum number of passengers travelling onboard changed.
C’train is defined as the train capacity with delivery task, and it can be calculated as the Equation (4).
The cargo space of each carriage is defined as Scariage, and the number of parcels that can be delivered to the cargo can be roughly determined.
3.3. Design of Loading and Uploading Area to Reduce the Impact on Subway Passenger Flow
The whole process of subway distribution will affect the passenger flow more or less. First, in the subway waiting platform, the loading and unloading process will have an impact on the passengers waiting for the train and getting on and off the train. Secondly, in the direct elevator, the delivery couriers will use the direct elevator when handling the turnover box, which will have some influence on the passengers using the direct elevator. Three, in the passages, distribution couriers handling turnover box when passing through the passages may cause a certain amount of congestion. Fourth, in the lobby, consumers will have an impact on subway passengers when they pick up parcels in front of the express cabinets. Additionally, there are two groups of consumers. The first group is “travelers” consumers. When they take the subway, they drop by to take out their deliveries. The other group is “pick up” consumers who specially come to the subway station to pick up the parcels. The second group may be relatively small, but their impact on the subway passenger flow should also be considered. They pick up their parcels in the smart cabinet in the lobby, so it will mainly affect the passenger flow in the lobby. This paper focuses on the design after considering the influence of the waiting platform and the lobby, because the influence of these two places is relatively large.
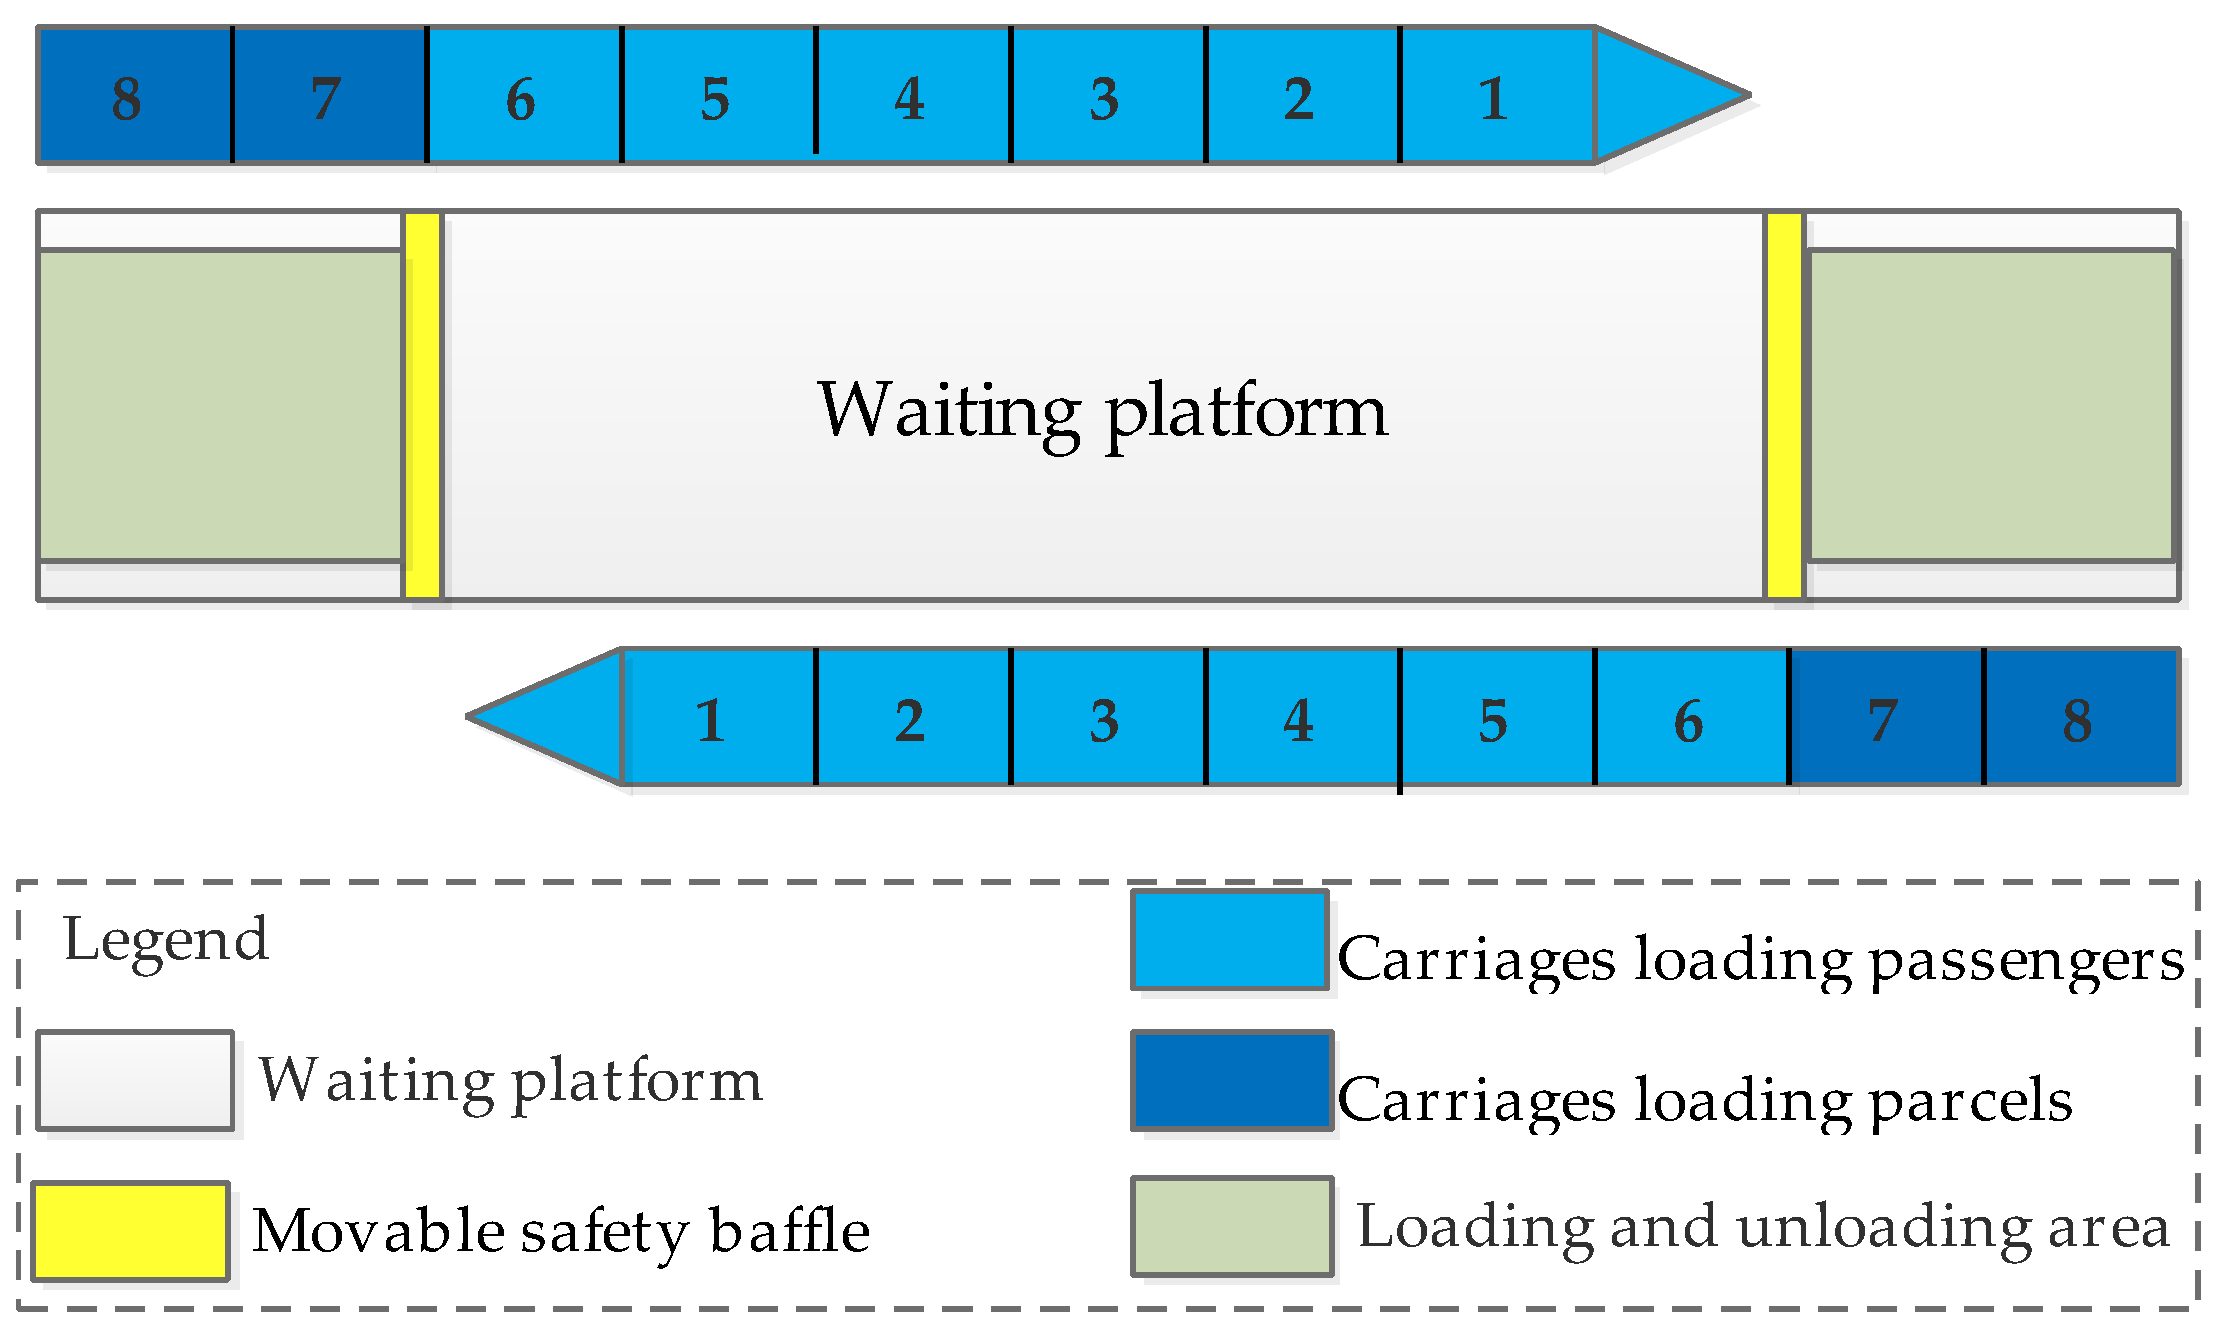
To address the impact of loading and unloading on the waiting platform, it is suggested to set aside a special space for loading and unloading, as shown in
Figure 7. For example, there is an eight-car subway train, which is delivered during off-peak hours. Among them, 1–6 carriages of the train are used to carry passengers, and 7–8 carriages are used to carry parcels. The two ends of the subway platform are separated by movable safety baffles for loading, unloading, and transferring. The movable safety baffles effectively separate the cargo logistics operations from the subway passengers to ensure the normal passenger flow and personal safety. During peak passenger periods, 1–8 cars are still used to carry passengers. When the baffle is removed, all space on the platform is used for passenger waiting and boarding.
In view of the impact of self-pick-up on subway passengers in front of express cabinets, the placement of self-service cabinets should be carefully considered.
Section 5.3 will specifically discuss the placement of self-service cabinets.
5. Results and Discussion
5.1. Selection of Independent Variables
The forward selection method was used to incorporate these candidate variables in the model. After calculating the significance, seven independent variables were finally selected as explanatory variables. The statistical results of the variables’ characteristics of this survey sample are shown in
Table 1.
Consumers’ willingness to use the self-service mode to retrieve their express parcels at the subway station was used as the dependent variable. The statistical results of the dependent variable are shown in
Table 2. A total of 41% of consumers were willing to use the self-service mode to retrieve their express parcels at a subway station. A total of 33% of the consumers indicated that it depends on the situation.
5.2. Regression Analysis Results
SPSS 25.0 was used to perform the likelihood ratio test for this model. The sample data were assumed to follow a Poisson distribution. The original hypothesis is that the defined covariates are not valid. The results are shown in
Table 3. The significance level (
p) of this model is less than 0.05, indicating that the defined covariates are valid, and the model’s construction is meaningful.
Based on the statistical results, seven independent variables and three dependent variables were analyzed in this multicategorical logit model. The dependent variable, namely, willingness, was used as the reference in the comparative analysis. The regression results are shown in
Table 4.
Using willingness as the reference term, the regression coefficients and intercepts in
Table 4 were inserted into Equation (10), resulting in the following Equation (14).
where
P1 is the probability of willingness,
P2 is the probability of unwillingness, and
P3 is the probability of depending on the situation.
The independent variables shown in bold in
Table 4 were the significant influencing factors with significance values less than 0.05 and 0.01. With willingness as the reference term, the following is the analysis of the consumers’ propensity in two situations, unwilling and depending on the situation.
When analyzing unwillingness, two independent variables have significance influences on consumers’ choice. The regression coefficient of the variable “education level” is −0.462, which means that “education level” has a negative impact on consumers’ choice. The regression coefficient of the variable “the number of online purchases per month” is 0.452, which means that it has a positive impact. That is, regarding willing and unwilling, the more educated consumers are more inclined to use the self-service mode to retrieve their express parcels at a subway station. In addition, the more online purchases that a consumer makes per month, the more unwilling they are to pick up their express parcels at a subway station.
When analyzing depending on the situation, two independent variables have a significance influence on consumers’ choice. Similarly, both of the variables of “gender (male)” and “the number of online purchases per month” positively influence consumers’ preference. That is, regarding willing and depending on the situation, male consumers are more inclined to choose depending on the situation, and those who shop online more often per month are more inclined to choose depending on the situation.
Based on the above analysis results, it is suggested that when promoting this new self-service mode of express cabinets based on the subway distribution, different advertisements should be pushed to different groups of people in different stages. First, we should target advertisements to consumers with strong intentions to use the mode, people with a high level of education, and people who have made relatively few online purchases. After a period of promotion and use, it is suggested that advertisements target male consumers and people with relatively more frequent online purchases.
5.3. Discussion on Consumers’ Concerns
This self-service mode of express cabinets in stations based on the subway distribution is an emerging mode, and consumers are bound to have some concerns. The consumers’ concerns were collected from the questionnaire survey. The selection proportions of concerns for the full sample of 510 people and for the 134 people who are unwilling to use this mode were counted separately. The selection results of the concerns are shown in
Table 5.
As seen in
Table 5, the two samples have similar concerns. The proportion of concerns, in descending order of importance, is whether the express parcel is convenient to carry, the queuing of an express cabinet, the increased express costs, and delivery timeliness. The following is the discussion of four consumers’ concerns and counterpart solutions to address the concerns.
Whether the express parcel is convenient to carry is the most concerning issue for consumers. Large express parcels not only affect the handing of the delivery staff but also are inconvenient for consumers to take from the express cabinet to the destination, thus affecting their choice of the self–service mode. To address this concern, it is recommended that the express cabinets in subway stations only deliver small, portable items. The choice of objects to be delivered using the express cabinets in subway stations is left to the consumer, who chooses whether or not to pick them up at the subway station. The express cabinets in subway stations will be set up with different sized compartments for different sized express parcels, and consumers should pay attention to whether the size of the purchased express parcel exceeds the size of the largest compartment of the express cabinet. If it is exceeded, the express items cannot be delivered using this express cabinet. There are also elevators in the subway stations for consumers to use, easing the burden of going up and down stairs. The promotion of this self-service mode of express cabinets in subway stations does not mean the elimination of pick-up cabinets in residential neighborhoods.
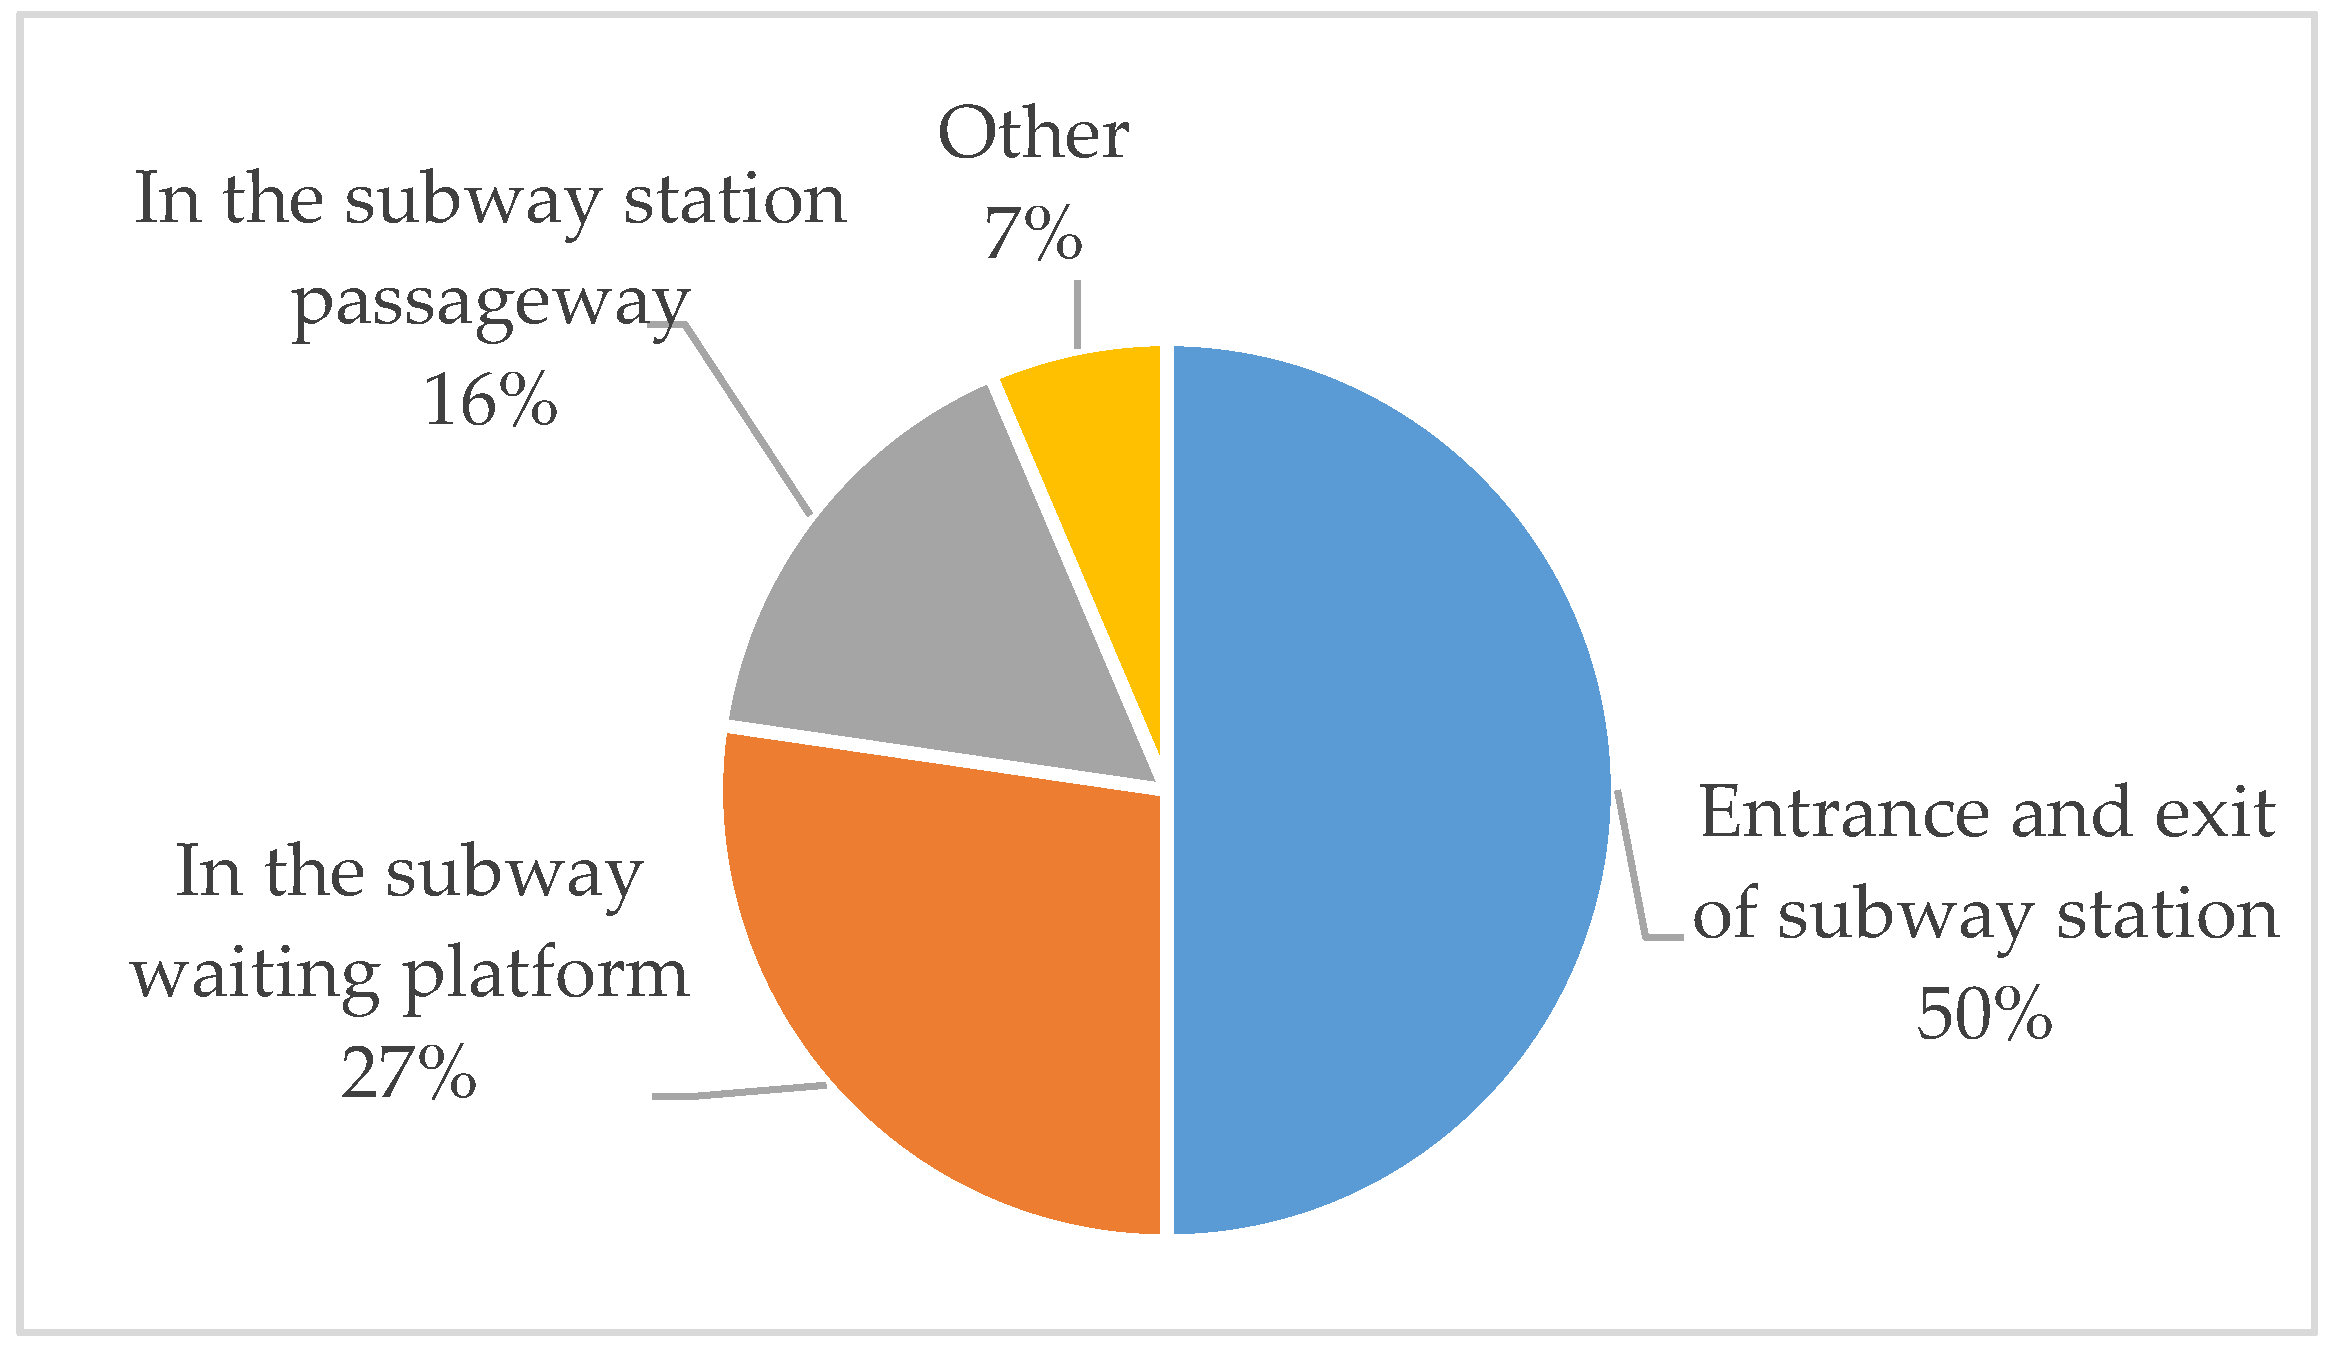
The concern about the queues in express cabinet ranks as the second most influential factor for consumers. Urban subways with their on-time performance, low fares and highly efficient operations have attracted many consumers. The peak time for consumers to take the subway is also the peak time for express pickups, and so consumers are concerned about the waiting queues to use the self–service mode to pick up their express parcels. To allay this concern, the design of the smart cabinet must be efficient. For example, using facial recognition and entering a verification code are the two ways to verify consumers’ identities, and consumers only need 1–2 s to take out their own express parcel after successful identification. This improves the efficiency of picking up express parcels and can reduce the queue time for consumers. The locations of the self-service cabinets also affect pickup time. Subway passageways and station platforms are the places with high passenger flows. If the self-service cabinets are placed in these places, it is easy to affect the consumers’ experiences. If they are placed at the subway entrances and exits, it will not affect the subway passenger flow on and off the train and waiting, and thus they are more appropriate installation locations. The survey statistics results of the consumers’ preferences for the location of cabinets are shown in
Figure 8. A total of 50% of the consumers chose the subway entrances and exits as the locations for the self-service cabinets for express parcels. The consumers’ intended choice validates the above analysis, i.e., it is more appropriate to place self-service cabinets at the subway entrances and exits.
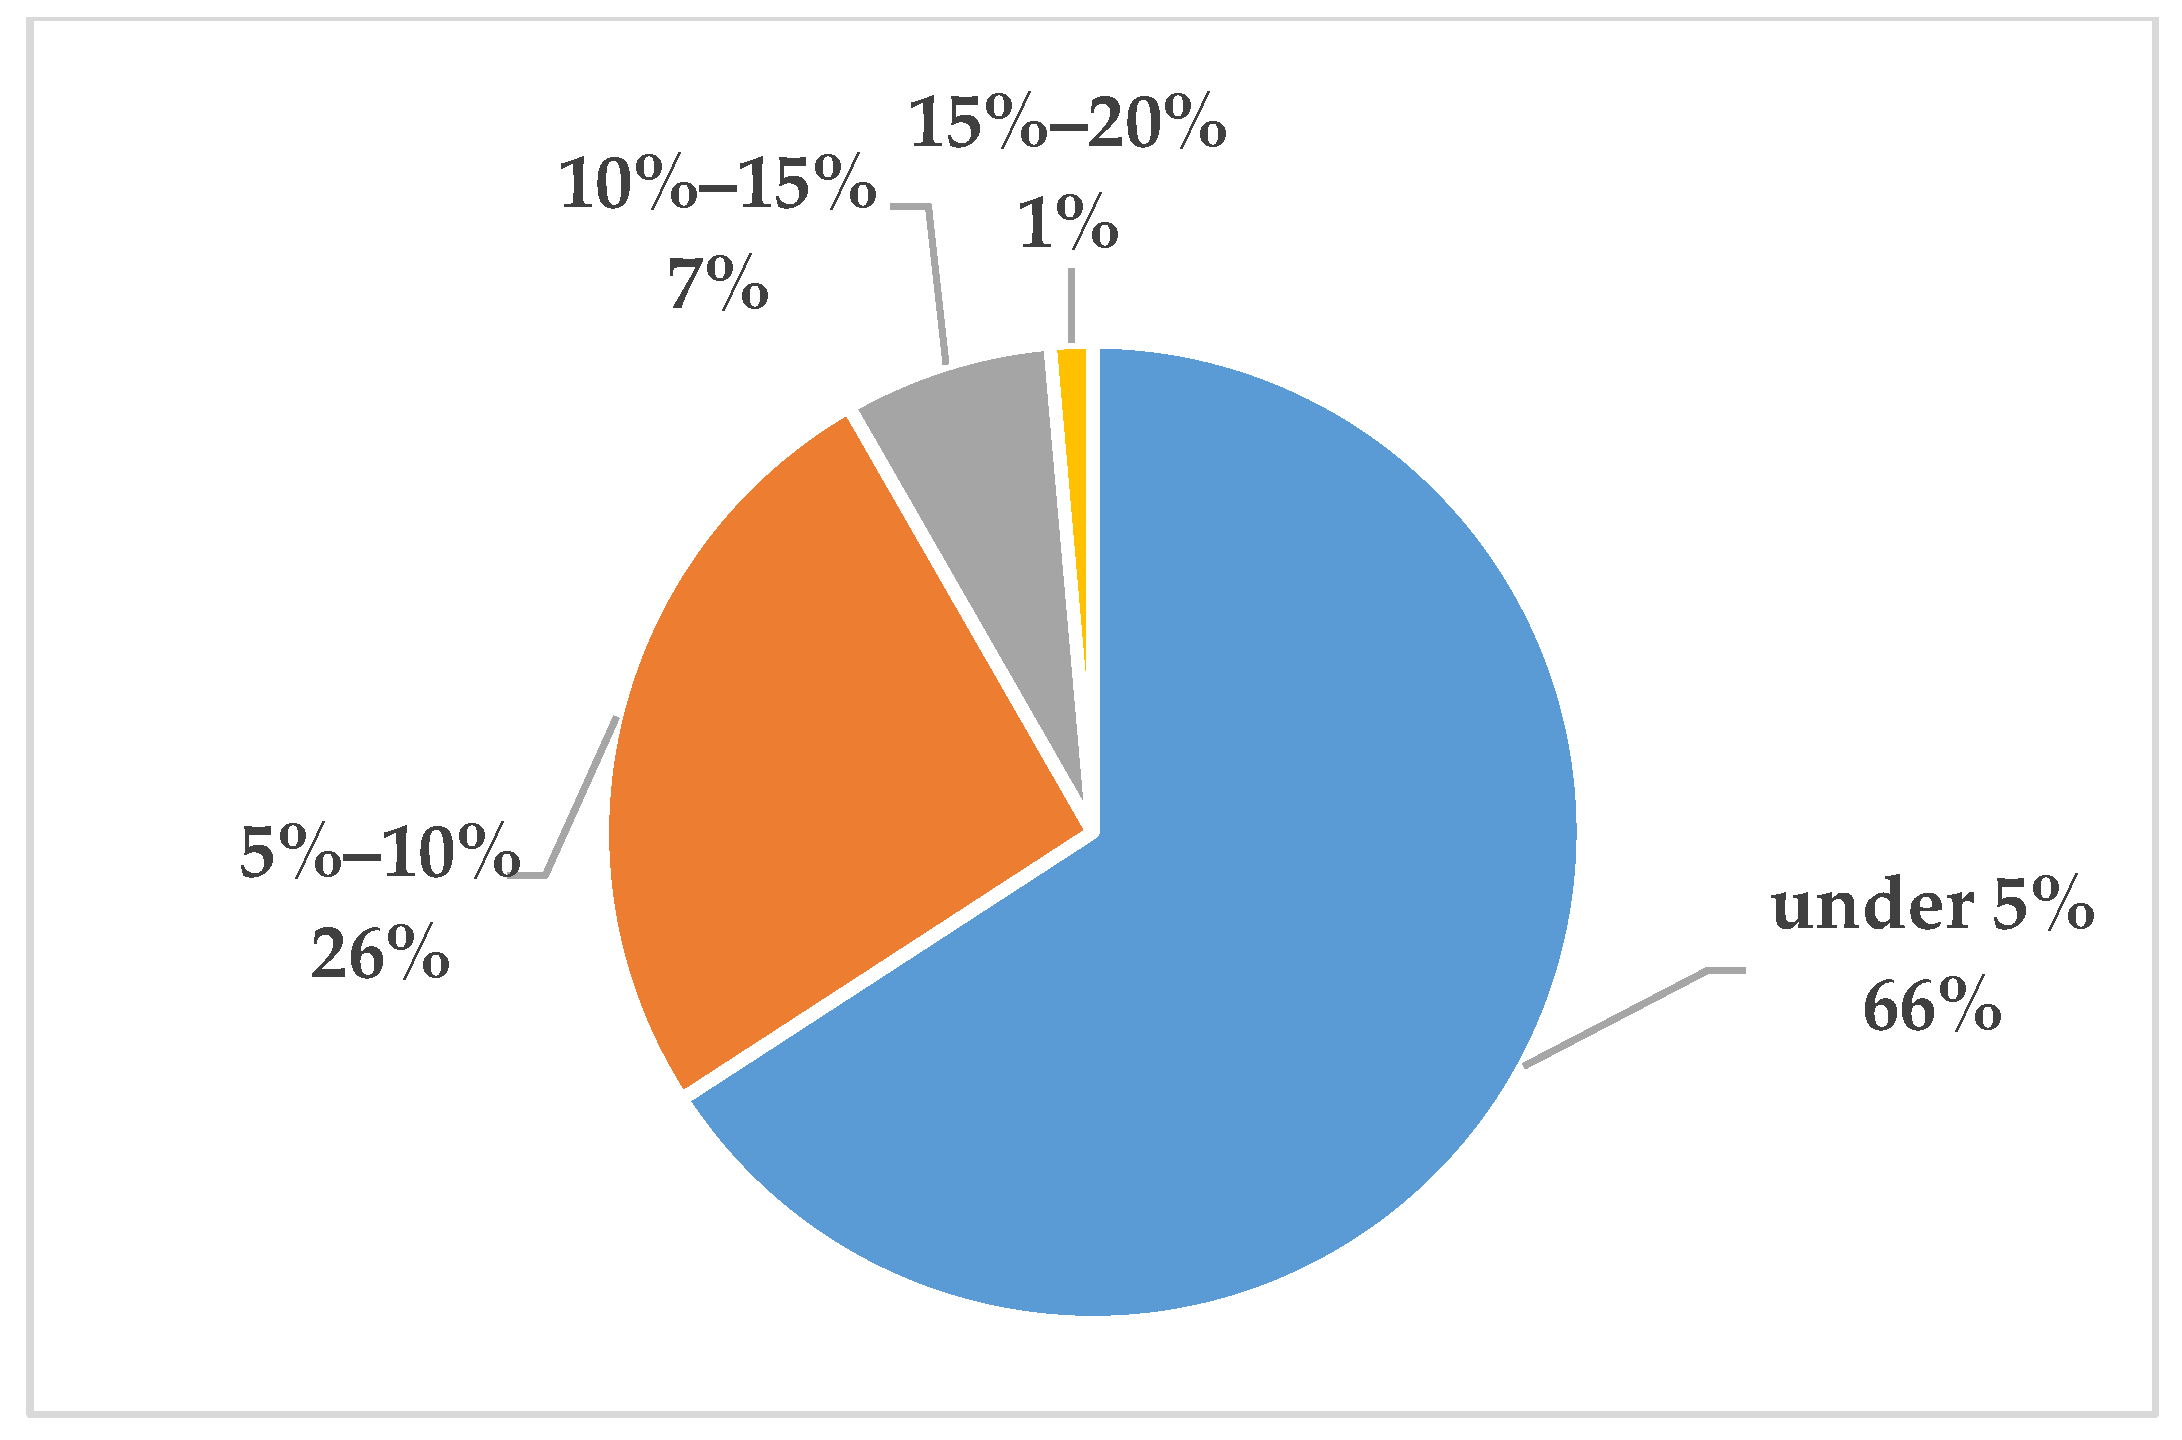
The concern of increased express costs also has a significant impact on consumers. The promotion of subway delivery will involve a certain amount of equipment, which will increase the equipment purchase costs and operating and maintenance costs. In this survey questionnaire, it was assumed that promoting subway delivery would increase the express fee for consumers, and consumers were asked how much of an increase in the express fee they could accept. The statistical results are shown in
Figure 9. A total of 66% consumers would accept an increase of less than 5%. It can be seen that most users prefer the smallest increase. In fact, although the promotion of subway delivery involves some equipment purchase costs and operating and maintenance costs, the self-service mode reduces the costs of last-mile delivery, and so the total costs of distribution may not increase. In addition, it can reduce carbon emissions, which is a green behavior. To promote this green and sustainable behavior, it is recommended that some incentive measures be introduced, such as rewards points for shipping fees or small gifts. The results of this survey show that if consumers can earn rewards points and redeem shipping fees or small gifts after completing a delivery at a subway station, a total of 53% of consumers would be willing to pick up their express parcels at subway stations and a total of 29% of consumers would do so depending on the situation. It is evident that the majority of consumers are willing to actively engage in green consumer behavior. Therefore, it is recommended to develop other functions of smart cabinets to increase profits. Examples include the use of a display on the smart cabinets to push advertising, provide public transportation card recharging, and offer other convenient services. Of course, there is a need to strengthen the propaganda supporting the cabinets by focusing on enhancing the consumers’ experience through the word-of-mouth effect to achieve the purpose of promoting the cabinets.
The concern of the express delivery time has relatively little impact on consumers, with approximately 35% of consumers selecting this concern factor. Since consumers will only pick up their own express parcels on their way to the subway, there are significant restrictions on when they can pick up their express parcels at a subway station, and some consumers are concerned about the timeliness of the delivery pickup. In response to this problem, it is recommended that the logistics company arrange the delivery times according to the time set by the consumer and promptly remind consumers to pick up the express parcels in time to avoid any delays in picking up their express parcels from a cabinet.
6. Conclusions
This paper investigated the feasibility of the self-service mode of express cabinets in stations based on the subway distribution. The self-service mode of express cabinets in subway station was designed, and the available time and surplus capacity for metro distribution were discussed. The loading and unloading area of the waiting platform was designed to reduce the impact of metro distribution operations on the waiting and boarding of metro passengers. The consumers’ preferences and concerns for the self–service mode was analyzed by using a multicategorical logit model. The results have shown that consumers’ gender, educational level, and number of online purchases per month could have an impact on their preferences. Therefore, it is suggested that when promoting this new self-service mode, different advertisements should be targeted to different groups of consumers in different stages.
The majority of consumers are willing to actively engage in green consumer behavior. Meanwhile, the consumers are more concerned about whether the express parcels are convenient to carry and the queuing of the express cabinet. To address these concerns, some suggestions and recommendations were proposed. It is recommended that the express cabinets in subway stations only deliver small, portable items. The design of the smart cabinet must be efficient. It is more appropriate to place the self-service express cabinets at subway entrances and exits. It is recommended that some incentive measures be introduced, such as rewards points for shipping fees or small gifts. It is also recommended that multi-functional cabinets be developed to obtain a variety of profits. The logistics company should arrange the delivery times according to the times set by the consumers and promptly remind consumers to pick up their express parcels in time to avoid a delay in picking up their express parcels from cabinets.
The contribution of this paper is as follows. In the practice of urban subway distribution, most of the parcels delivered by the subway are taken out by couriers from the station, and then couriers ride tricycles or bicycles to the consumers’ home or office. Few studies have mentioned the setting of express cabinets at subway stations. We designed the self-service mode of express cabinets in station based on subway delivery, while minimizing the impact of subway delivery operations on subway passengers waiting for and boarding the train. This self-service mode can reduce the need for couriers to deliver parcels from subway stations to consumers, and. This mode can further reduce the delivery work and road traffic pressure, reduce environmental pollution, and promote sustainable development. The COVID-19 outbreak has led to a rapid increase in demand for online shopping and logistics, which is likely to prompt the implementation of subway distribution plan to share some of the transportation pressure. This subway distribution and self-service mode of express cabinets in station proposed maybe is a solution for last mile delivery in China and even more regions. In addition, recent studies have focused on the feasibility of subway-based distribution from economic and environmental perspectives. This paper innovatively analyzed the feasibility of subway delivery from the perspective of consumers’ preferences and discussed in depth the consumers’ acceptance of this new self-service mode in stations. The impact of this self-service mode on various aspects of subway passengers have been fully considered, and the appropriate subway delivery times and loading and unloading area of the waiting platform have been designed. These research results provide a reference for the decision-making on the innovation of the urban subway distribution mode and lay the foundation for further research on the design and popularization of the self-service mode in subway stations. It is conducive to improve the efficiency of urban distribution operations and promoting sustainable consumption and the low-carbon development of urban transportation.


