Article

Pricing and Subsidy Models for Transshipment Sustainability in the Three Gorges Dam Region of China

1
School of Logistics Engineering, Wuhan University of Technology, Wuhan 430063, China
2
School of Management, Guilin University of Aerospace Technology, Guilin 541004, China
3
School of Economics and Management, Tongji University, Shanghai 200092, China
4
Engineering Research Center of Port Logistics Technology and Equipment of Ministry of Education, Wuhan University of Technology, Wuhan 430063, China
*
Authors to whom correspondence should be addressed.
Sustainability 2020, 12(17), 7026; https://doi.org/10.3390/su12177026
Submission received: 15 July 2020 / Revised: 21 August 2020 / Accepted: 25 August 2020 / Published: 28 August 2020
(This article belongs to the Section Sustainable Transportation)

Abstract

:
Congestion before the Three Gorges Dam has been an obstacle to the sustainable development of the Yangtze River. Water–land transshipment can be a better way to alleviate congestion. Consequently, the government started to offer subsidies to evacuate ships’ traffic flow through transshipment despite that it increases environmental pollution. In this paper, we analyze the effects of subsidies on carriers’ adoption behavioral strategies, congestion and transshipment on the environment, and subsidies on pricing considering environmental emissions. Two different models are constructed, and a simulation analysis is carried out with different scenarios by varying the values of different parameters. The results show that subsidies can affect carriers’ behavioral strategies. Both lockage and transshipment modes can increase environmental emissions. Pricing under the subsidy scenario can be more competitive with profit maximization. The results offer important implications to policymakers, carriers, shippers.

Graphical Abstract

1. Introduction

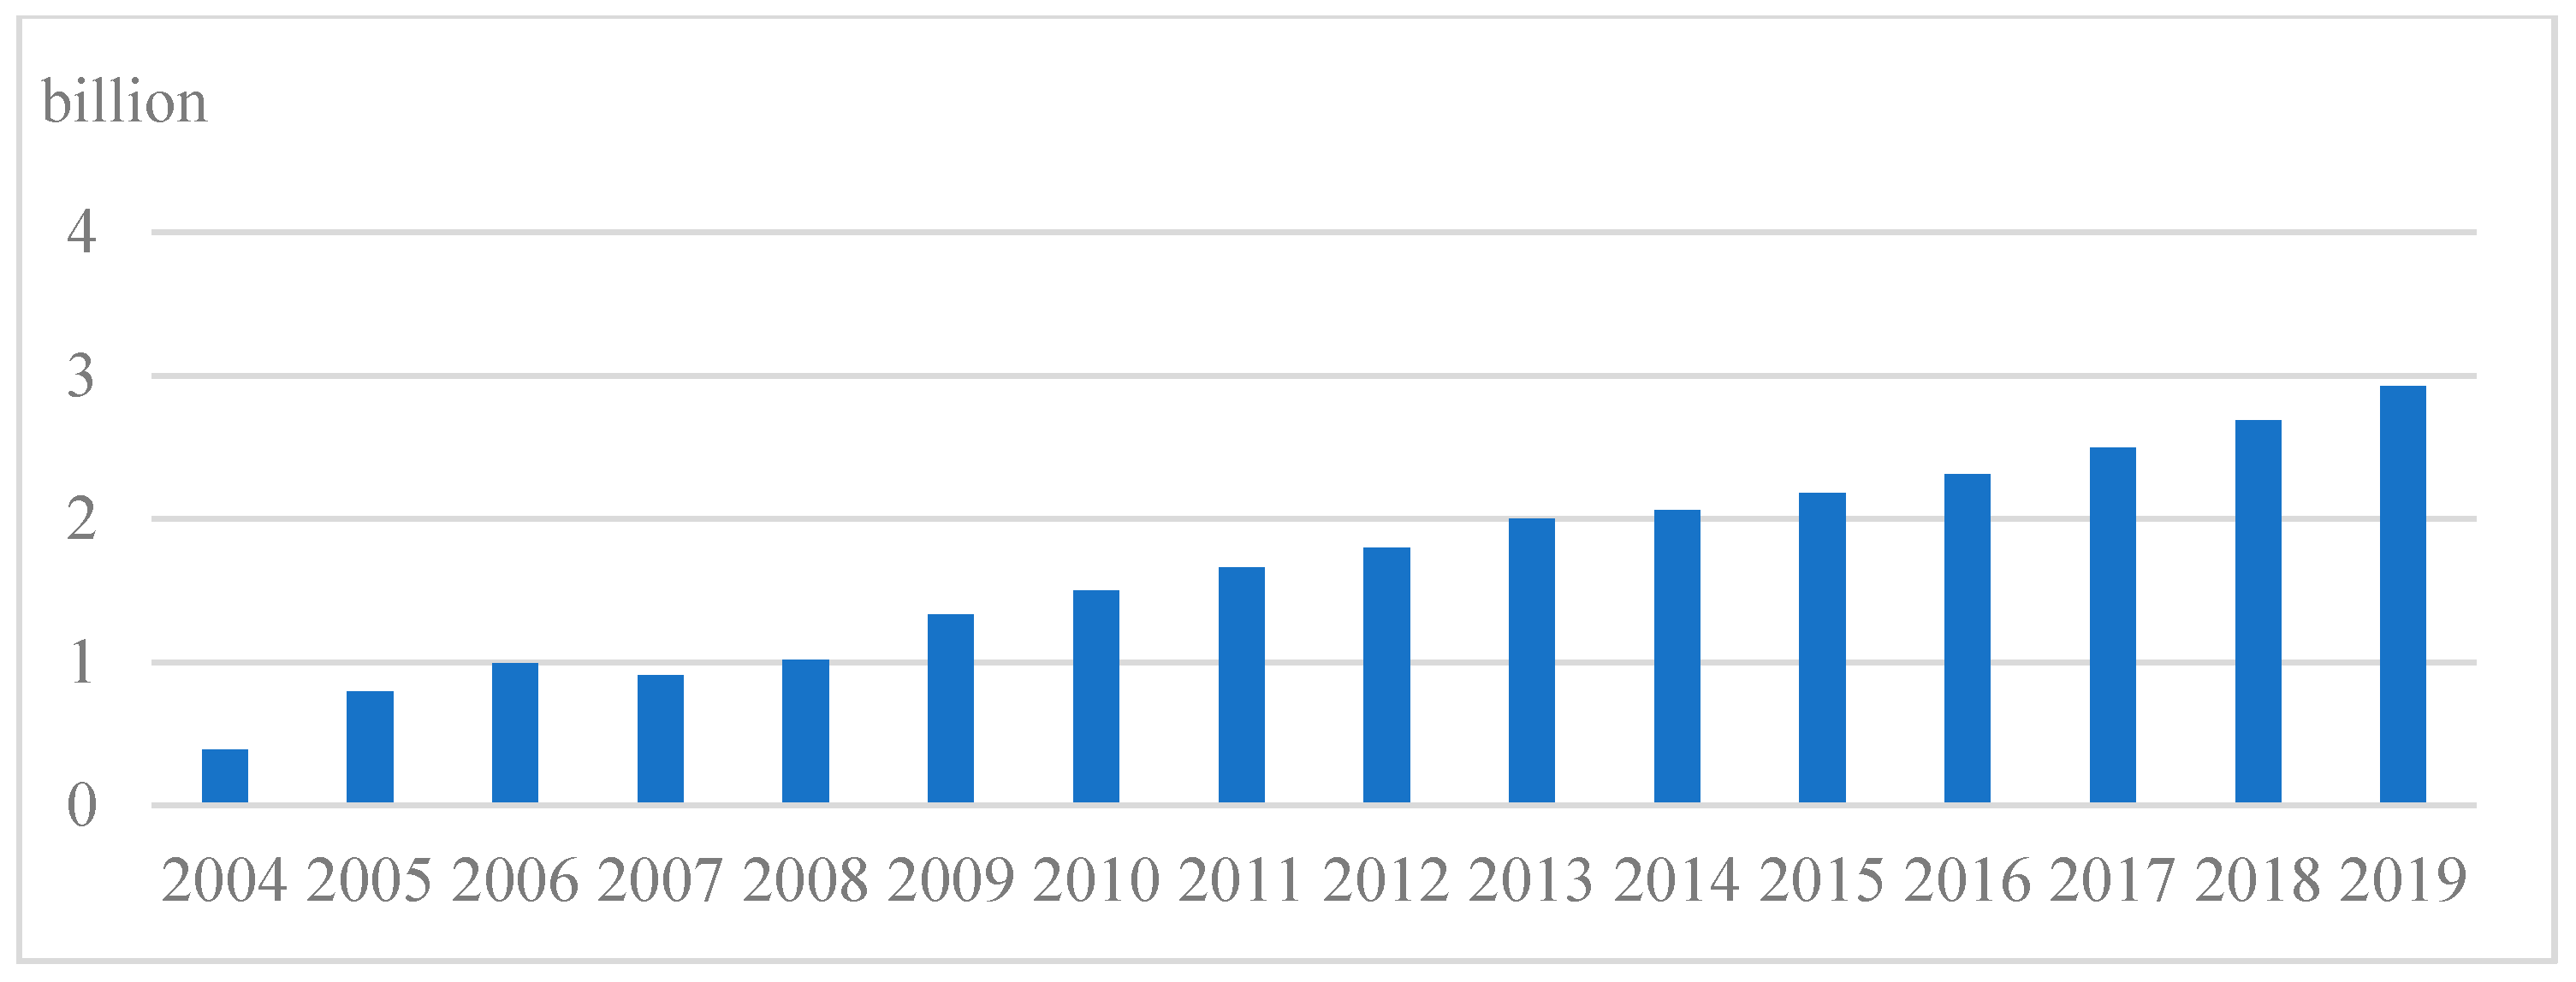
Yangtze River, known as Golden Channel in China, plays an important role in inland waterway transportation and is characterized by its large channel capacity, low transportation cost, and environment-friendliness. It has been the busiest inland waterway with a total freight volume soaring up to 2.93 billion tons in 2019 surpassing the Mississippi River and the Rhine. Figure 1 exhibits the growth of its freight volumes since 2004 [1].
The Three Gorges Dam (TGD), which is located in the upper stream of the Yangtze River, has brought many benefits such as power generation, flood prevention, and navigation capacity [2] since commencing its operation in 2004. However, it has also become a bottleneck due to the growing traffic volume of inland ships and insufficient navigation capacity of the lockage. This has hindered the sustainable development of inland waterway transportation on the Yangtze River. To pass the locks of the TGD, ships have to wait for 3 days on average, or even longer during emergencies (e.g., equipment malfunctions, traffic accidents, and extreme weather conditions), creating costly delays. Moreover, the detained ships cause environmental pollution in the dam area through the emission and discharge of other pollutants [3].
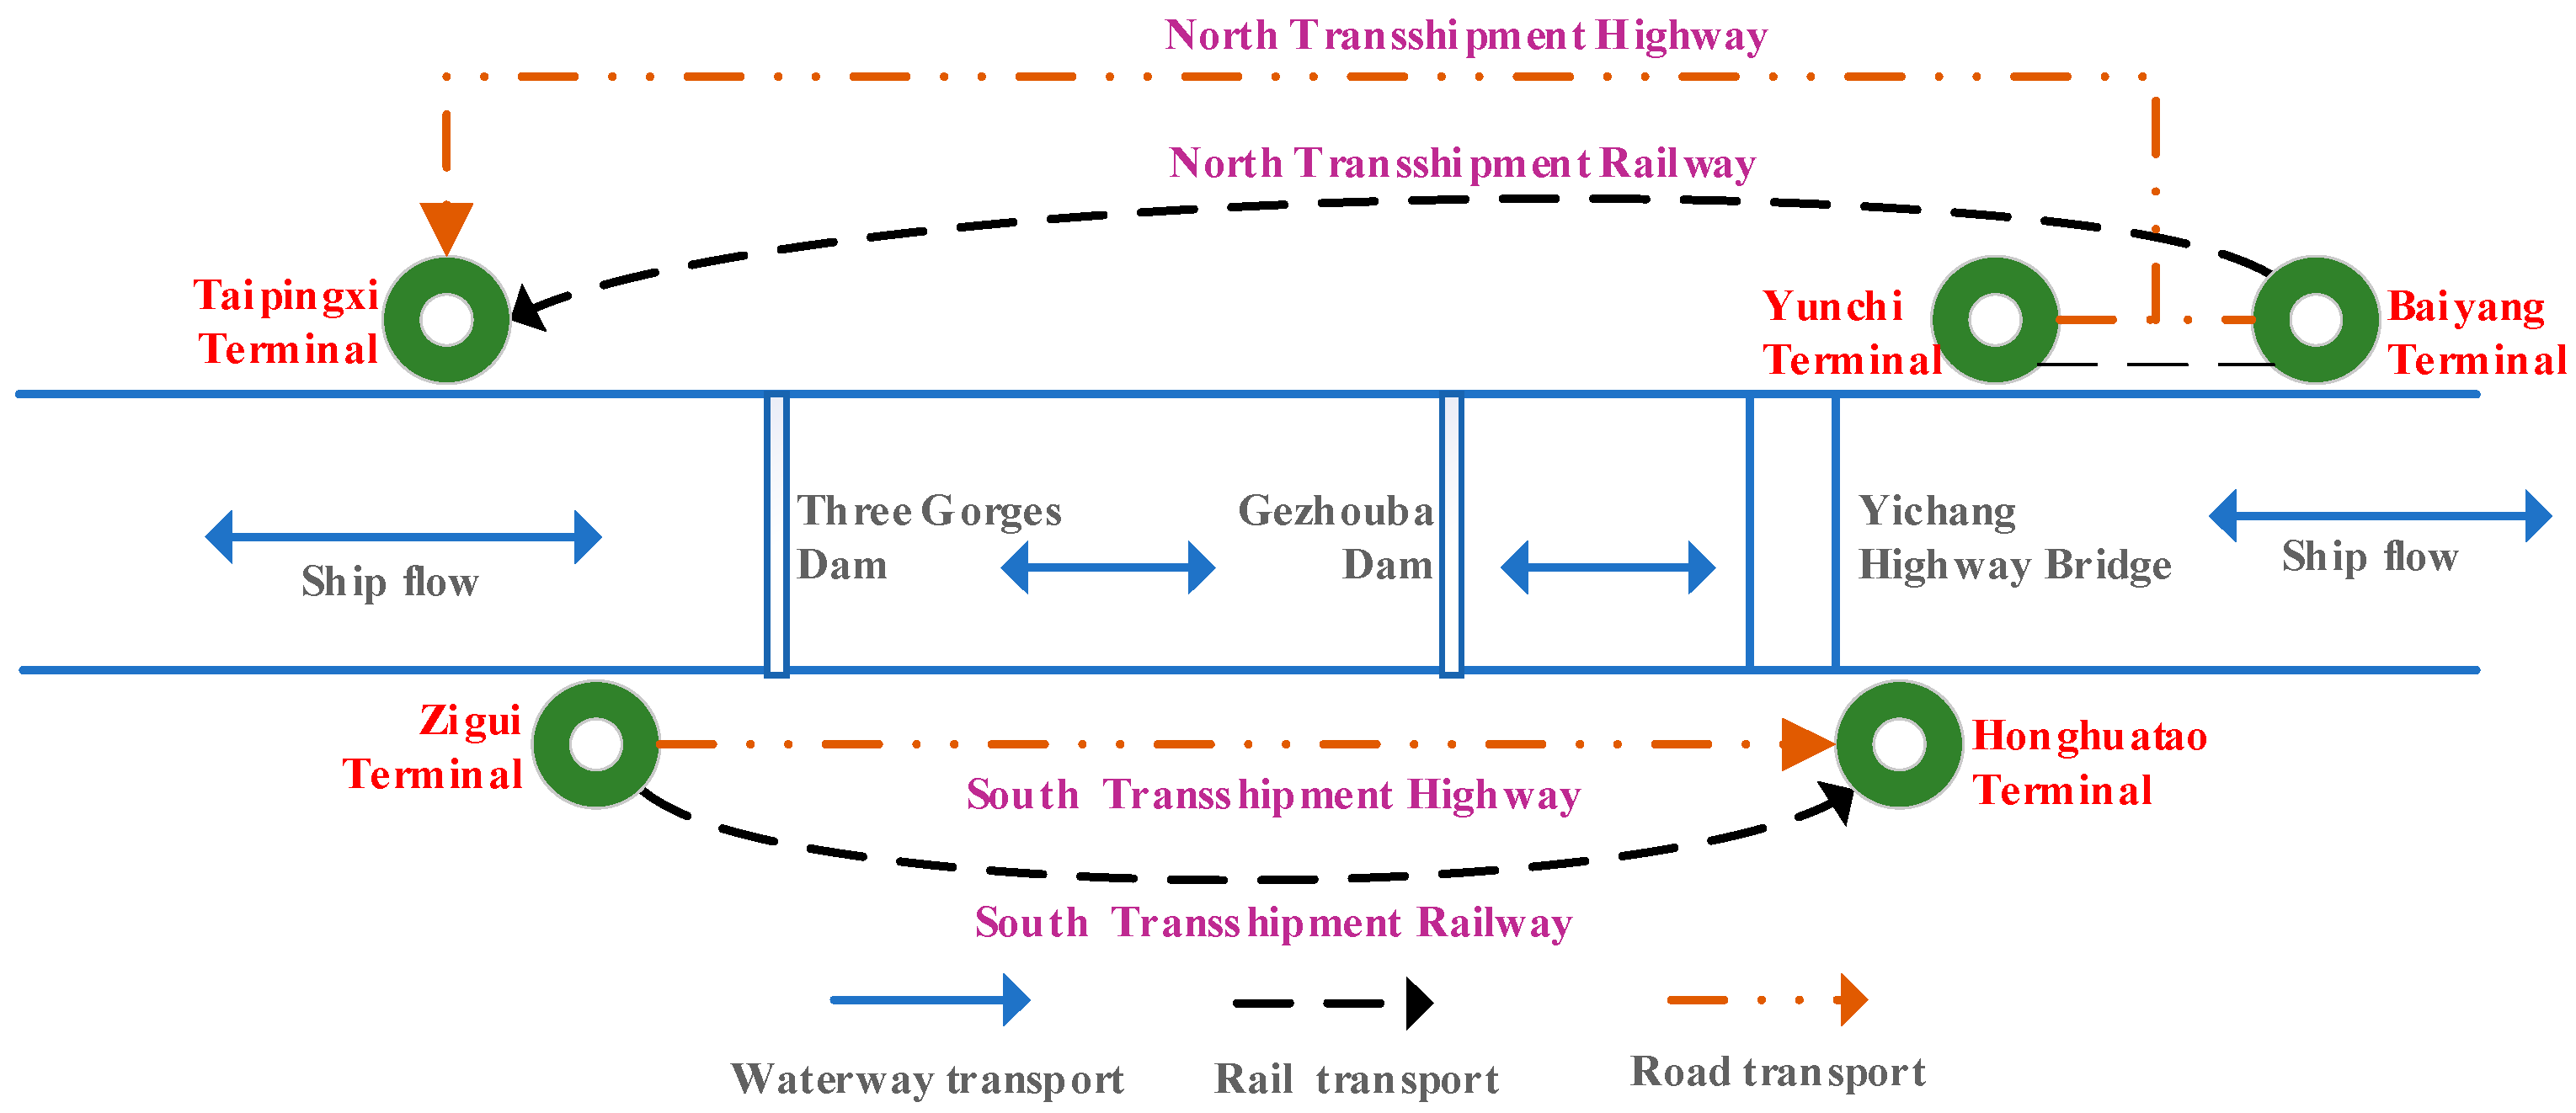
The 20-year long process from planning to completion of the Three Gorges Transshipment Project (TGTP) was designed to solve congestion at the upper end of the Three Gorges Dam and the lower end of the Gezhouba Dam because the capacity extension of the locks is impossible due to spatial and geographical conditions. To resolve the congestion issue, two transshipment systems (both highways and railways) on the sides of the TGD waterway had been planned. Currently, the South Transshipment Highway, which facilitates the transfer of cargos from ships at Zigui Terminal to Baiyang Terminal through Yichang Highway Bridge, is open to traffic (see Figure 2). Adopting the transshipment system is very likely to result in pollution and endanger environmental sustainability because the emission from road transportation is worse than inland waterway transportation. Nevertheless, the local government has decided to provide 3-year subsidies to encourage roll-on/roll-off (RO-RO) ships and container vessels to adopt transshipment in order to help alleviate congestion and provide a better flow of ship traffic. This situation calls for an investigation on carriers’ behavioral strategies regarding the adoption of transshipment and lockage mode under government subsidy. This study intends to answer this call.
A scrutiny of the extant literature reveals the dearth of research into the TGD transshipment systems. Models regarding lock capacity scheduling and water-land mixed transshipment systems of the TGD were established to optimize the efficiency of ships’ mixed-mode traffic flow by [3,4]. They considered the variables of ships, delay time, cost, berths and lockages, and co-scheduling optimization models constructed, which were solved algorithmically to get the optimal solutions. The other study on the TGD transshipment systems explored the impact of different subsidy policies from the government on carriers’ behavioral strategies [5]. The study used evolutionary game theory and found that subsidy strategies are feasible for carriers to adopt to a transshipment mode. The environmental impact assessment process and major efforts to control environmental problems brought by the construction of the Three Gorges Project were analyzed in [6], but their focus is beyond the environmental sustainability regarding the ships’ congestion and transshipment. In the above three existing studies, none of them had considered the environmental impacts incurred by lockage delay and a water–land transshipment mode. To fill this gap in the literature, this study intends to answer the following questions.
  • What is the economic benefit from carriers’ choice of a lockage or transshipment mode when the ship lock approaching channel is congested?
  • Given the 3-year subsidies on the transshipment cost provided by the local government, what is the impact on the environmental emissions measured by CO2?
  • What are the carriers’ pricing strategies based on profit under different modes with or without the government subsidies and lockage congestion?
The rest of this paper is organized as follows. Section 2 presents a literature review and Section 3 describes the construction of optimization models under lockage and transshipment modes. Then, Section 4 presents and analyzes simulation results, and Section 5 draws the conclusion.

2. Literature Review

Numerous measures for solving the congestion of ship-lock capacities have been proposed in the literature. In essence, they can be classified into two research streams: scheduling lockages and expanding lock capacities. Regarding lockage scheduling to improve the efficiency of locks’ capacities, model formulations were developed to clear the queues before the lock [7]. Taking the lockage co-scheduling problem of Three Gorges Project as an NP-hard problem, Zhang et al. [8] proposed an algorithm with a co-evolutionary strategy to learn the efficient strategy separately and collaboratively by lockage simulation. A mixed-integer programming model was developed to demonstrate the improvement of lock scheduling relative to simple rules, and a heuristic scheduler and computer simulation were applied to evaluate alternative scheduling mechanisms [9]. Scholars have investigated the co-scheduling of the Three Gorges–Gezhouba Dams [10] and a single lock scheduling of the Three Gorges Dam [11] to get the optimal algorithms to solve different mathematics models. Reynaerts [12] exploited the geographical variation in the demand patterns for individual locks along the Upper Mississippi River system of locks and dams. A fixed-effects regression model that relates lock congestion to lock usage and lock characteristics was constructed. A panel data set was used to find the optimal parameters that minimize lock congestion. Bugarski et al. [13] and Kanović et al. [14] presented optimization techniques to control a ship-locking process to achieve better results in distributing ship arrivals, i.e., shorter waiting times and less empty locks. Verstichel et al. [15,16,17,18] developed several combinatorial optimization methods for the lock scheduling problem, and the interconnected subproblems were solved with different heuristic approaches to find the optimality.
Recently, with the establishment of a mathematical model for the lockage scheduling of the Three Gorges-Gezhouba Dams, Yuan et al. [4] proposed heuristic-adjusted strategies to enhance the performance of scheduling. Zhang et al. [19] proposed a nonparametric model to relieve congestion considering the variables of arrival, waiting, and lockage time of vessels to increase the carrying capacity in the Upper Mississippi River system. Prandtstetter et al. [20] proposed a variable neighborhood search approach to solve an interdependent lock scheduling problem along the Austrian part of the Danube River, minimizing the overall ship travel times. Passchyn et al. [21] proposed a dynamic programming algorithm that solved the lockmaster’s problem in polynomial time, O(n3), to minimize the total waiting time of the ships traveling in both directions before a lock. Ji et al. [22] took the lockage co-scheduling of Three Gorges Dam and Gezhou Dam as an example of a mixed-integer nonlinear optimization problem. They presented an orthogonal design-based nondominated sorting genetic algorithm combined with a time-area series assignment method to optimize the scheduling problem. Passchyn et al. [23] adopted no-wait schedules and new graph-theoretical concepts to investigate the scheduling of a single lock with parallel chambers, and the algorithmic optimality was obtained for different special cases, including two arbitrary chambers, multiple identical chambers, and multiple arbitrary chambers.
Besides lockage scheduling, another solution to the problem of congestion is expanding the lock capacities. Wilson et al. [24] developed a spatial optimization model of the world grain trade based on the cost of delays in the Mississippi River system caused by lock congestion. They revealed that with an expansion in the lock capacity, delay costs in 2020 could decrease from USD 1.08 to 0.54 per metric ton. Liao [25] described expanding the lock capacity in the waterway transportation systems of the Beijing-Hangzhou Grand Canal, Yangtze River, and Xijiang River to reduce severe navigational delays and improve the lock performance in China. Other solutions include adding more parallel channels in dams or a new ship-lifter in the Three Gorges Dam [8]. However, expanding lock capacities, adding more channels, and constructing lifts incur restrictions based on spatial and geographical conditions and will have significant environmental impacts, making them very costly and difficult to implement. As to the lock scheduling solution, although the delay of ships can be decreased by scheduling locks algorithmically, its effectiveness is limited, especially when the throughput capacity of the locks is far from sufficient [26]. To our knowledge, there are some relevant studies regarding pricing [27,28,29,30] and transshipment [31,32,33], however, there is a death of research into the behavioral strategies and the pricing of carriers in adopting lockage modes or transshipment modes, or both, the environmental sustainability of the two modes, and the impact of subsidies from the government on carriers’ transshipment strategies.
This study intends to fill this void. The contributions of this study are as follows. First, it is the first study to consider environmental sustainability, which is impacted by carriers’ behavioral strategies in terms of adopting the modes. Second, it is the first attempt to construct profit-function models that consider pricing strategies at different modes and different scenarios, which provide guidelines for carriers to adopt different modes in TGD inland waterway transportation. Third, the economic benefits of different scenarios are analyzed for carriers’ choices of different modes with optimal prices under various parameters.

3. Model Construction

In this section, we construct two optimization models, each considers multiple relevant parameters and functions (e.g., profit, social welfare, demand) under lockage and transshipment modes.

3.1. Notations

The notations are listed in Table 1 and the model formulation follows.

3.2. Formulation of the Basic Model

If carriers select the lockage mode, the demands that carriers face are linear functions of the freight price, which is common in [34,35,36,37], and the demands are assumed to be downward sloping with the freight price. Thus, the demand function is as follows:
q i = q ( p i ) = ρ α β p i
Following the Stackelberg game framework, the government provides subsidies η i to carriers with water–land–water transshipment mode, whereas carriers determine the freight price for profit maximization. The demand function with government subsidies is as follows:
q i = q ( p i , η i ) = ( 1 ρ ) α β ( p i + η i )
Before formulating the model, two conditions must be satisfied. First, the demand for different transportation modes must be non-negative. Second, carriers with different transportation modes must gain non-negative profits. These two conditions can be rewritten as follows:
0 < p i < min ( ρ α β , ( 1 ρ ) α β η i β )
The shippers who consign cargos to carriers only care about the lead time and the reliability of transportation. It is also assumed that carriers only care about the social welfare of the customers, such as shippers. Therefore, carriers consider consumer surplus as an index of social welfare in their profit function; a similar treatment can be seen in [38]. If x [ 0 , 1 ] is the fraction of the shippers’ surplus, which is the carriers’ social concern, then the amount of shippers’ surplus xCS incorporated in the carriers’ profits in the models with the lockage mode is:
x C S = x p m a r k e t p max q i d p i = x p ρ α β ( ρ α β η i ) d p i = x ( ρ α β η i ) 2 2 β
and the amount of shippers’ surplus in the models with the government’s subsidies is:
x C S = x p m a r k e t p max q i d p i = x p ( 1 ρ ) α β η i β ( 1 ρ ) α β ( p i + η i ) d p i = x [ ( 1 ρ ) α β ( p i + η i ) ] 2 2 β

3.3. Formulation of Mathematical Components

The profit function of the lockage mode is as follows:
π i l = ( p i c i l ) ( ρ α β p i )
The environmental cost of the lockage mode is:
E i l = e i l q i
The social welfare function with the lockage mode is:
S W l = π i l + x C S E i l = ( p i l c i l ) ( ρ α β p i l ) + x 1 ( ρ α β p i l ) 2 2 β e i l q i l
The function S W l is jointly concave on the decision variable p i l ; thus, there exists an optimal solution of Equation (8), S W l .
p i l * = ( 1 x 1 ) ρ α + β ( c i l + e i l ) ( 2 x 1 ) β
q i l * = ρ α β ( c i l + e i l ) 2 x 1
π i l * = [ ( 1 x 1 ) ( ρ α β c i l ) + β e i l ] [ ρ α β ( c i l + e i l ) ] ( 2 x 1 ) 2 β
S W l * = [ ρ α β ( c i l + e i l ) ] 2 2 β ( 2 x 1 )
Corollary 1.
p i l * , q i l * and π i l * are increasing in ρ and α , and decreasing in β .
Proof. 
See Appendix A. □

3.4. Optimization Model Under the Transshipment Mode

Acting as the Stackelberg game leader, the government makes financial interventions such as providing subsidies for carriers to adopt the transshipment mode. The profit function of the transshipment mode is:
π i t = ( p i c i t ) [ ( 1 ρ ) α β ( p i + η i ) ]
The environmental cost of the transshipment mode is:
E i t = e i t q i
Similarly, the welfare function with the water–land–water transshipment mode is:
S W t = π i t + x C S E i t = ( p i c i t ) [ ( 1 ρ ) α β ( p i + η i ) ] + x 2 [ ( 1 ρ ) α β η i β p i ] 2 2 β e i t q i
The carriers’ willingness for transshipment adoption are uniformly distributed with a unit density normalized in the interval [0,1]. The optimal results are (see Appendix B):
p i t * = ( 1 x 2 ) [ ( 1 ρ ) α β η i ] + β ( c i t + e i t ) ( 2 x 2 ) β
q i t * = ( 1 ρ ) α β ( η i + c i t + e i t ) 2 x 2
π i t * = [ ( 1 ρ ) α β ( η i + c i t + e i t ) ] { ( 1 x 2 ) [ ( 1 ρ ) α β ( η i + c i t ) ] + β e i t } ( 2 x 2 ) 2 β
S W t * = [ ( 1 ρ ) α β ( η i + c i t + e i t ) ] 2 2 β ( 2 x 2 )
Corollary 2.
p i t * , q i t * are increasing in α , and decreasing in ρ , β and η i . π i t * is increasing in α , and decreasing in ρ and η i when ( 1 ρ ) α β η i > 0 is satisfied, but is piecewise concave in β .
Proof. 
see Appendix B. □

4. Results and Analyses

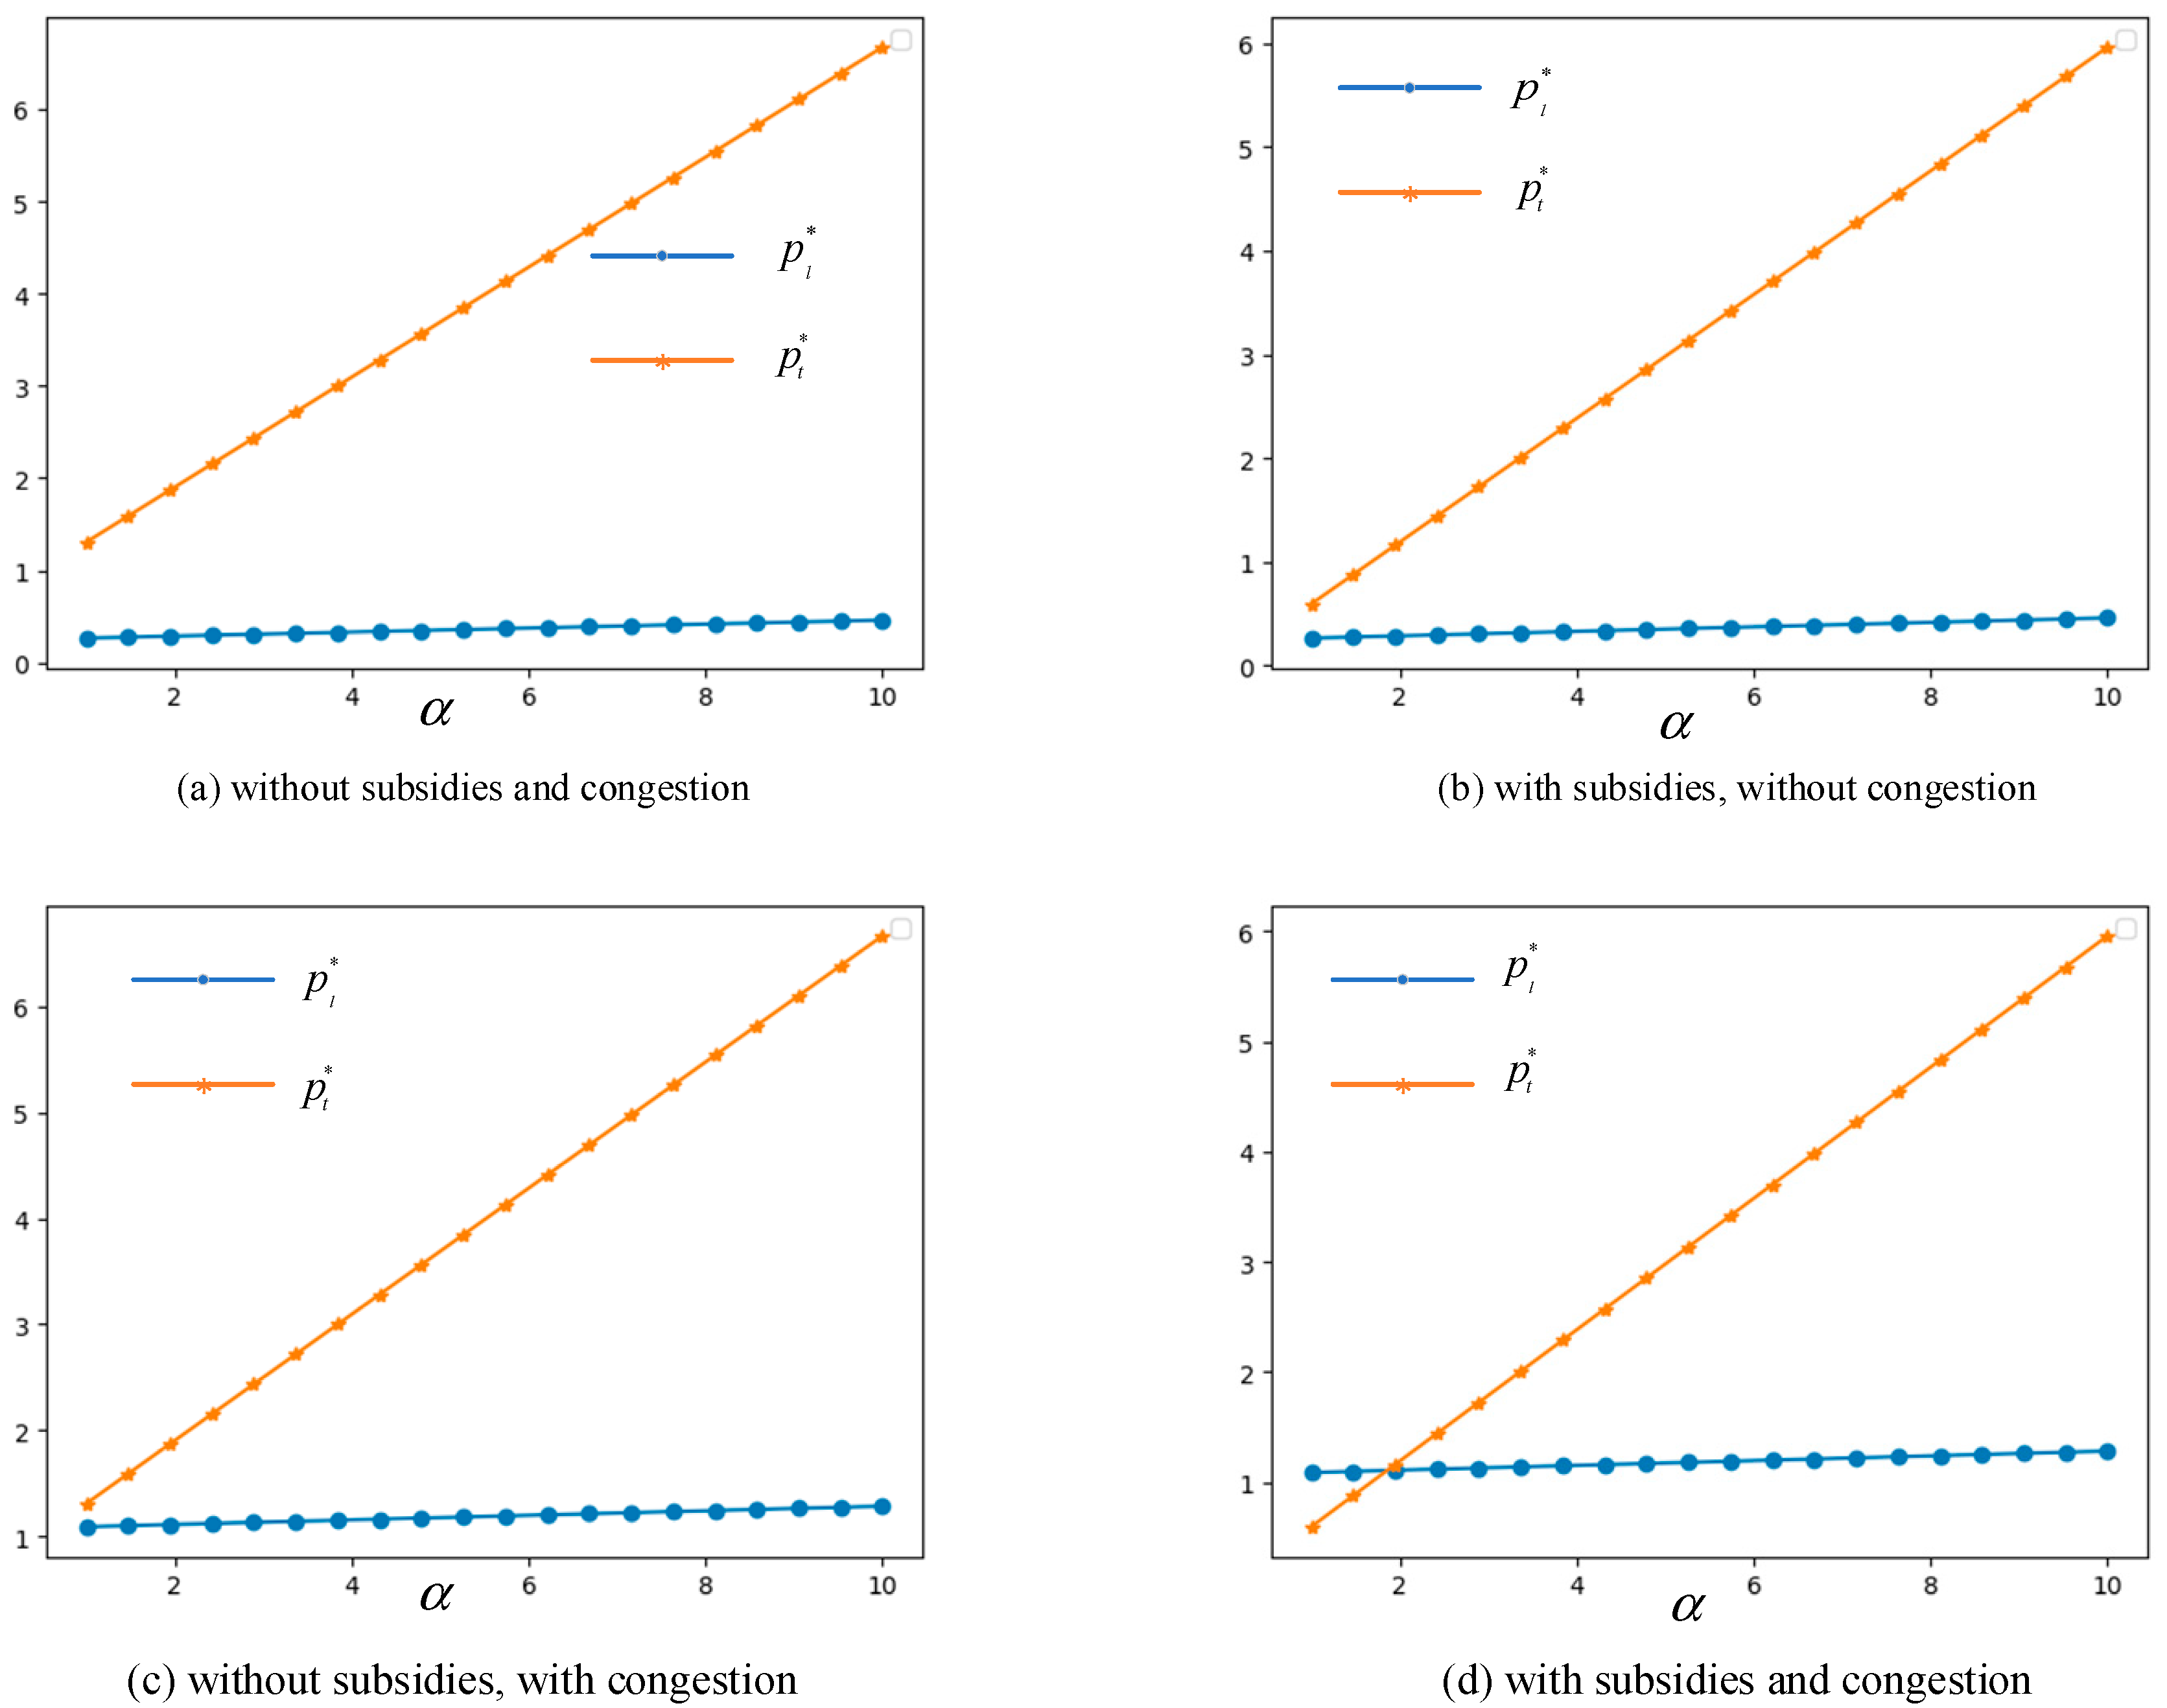
The TGTP can facilitate RO-RO ships and container ships to adopt the water–road–water transshipment mode. Either high-value cargos or low-value cargoes can be transshipped at Zigui or Baiyang Terminals by trucks to avoid long waiting times before the TGD. To better analyze our theoretical results, the transportation of a RO-RO ship loaded with vehicles is taken as an example in our game models. Through the assistance from China Changjiang National Shipping Group Company Ltd., which has carried out transshipment tasks since 2018, we get four data items, i.e., c i l = 0.45 , e i l = 0.016 , c i t = 1.05 , e i t = 0.299 . Let α = 1 , β ( 0 , 1 ) , ρ ( 0 , 1 ) , η i = 1.5 , the waiting cost be 0.52 RMB/vehicle, and the waiting time be 3 days. Through a simulation tool using Python 3.7, we obtained the data for the optimal price and profit under four different scenarios: without subsidies and congestion, with subsidies and without congestion, without subsidies and with congestion, with subsidies and congestion. The results of the analyses for the four scenarios are presented in Figure 3, Figure 4, Figure 5, Figure 6, Figure 7, Figure 8 and Figure 9. Each figure represents the output of one modeling and simulation experiment. The program codes of the simulation model that generates the two lines of optimal prices in Figure 3a are exhibited in Appendix C.
We can see from Figure 3 that, when the values of η i , ρ , β , x 1 and x 2 are set to 1.5, 0.035, 0.767, 0.1 and 0.1, respectively, the freight price of the transshipment mode, for every scenario, increases sharply with respect to the market potential α , while the freight price of the lockage mode shows small changes with α under different scenarios. In Figure 3a–c, the value of p t * has a larger gradient and is always larger than p l * , which is the same as in Figure 3d. An intersection in Figure 3d shows the same value of p t * and p l * when α is set at 2. If the optimal profit of the transshipment mode p t * continues to increase beyond α > 2, the government should provide more subsidies to offset the freight price of transshipment, which can be a burden to shippers.
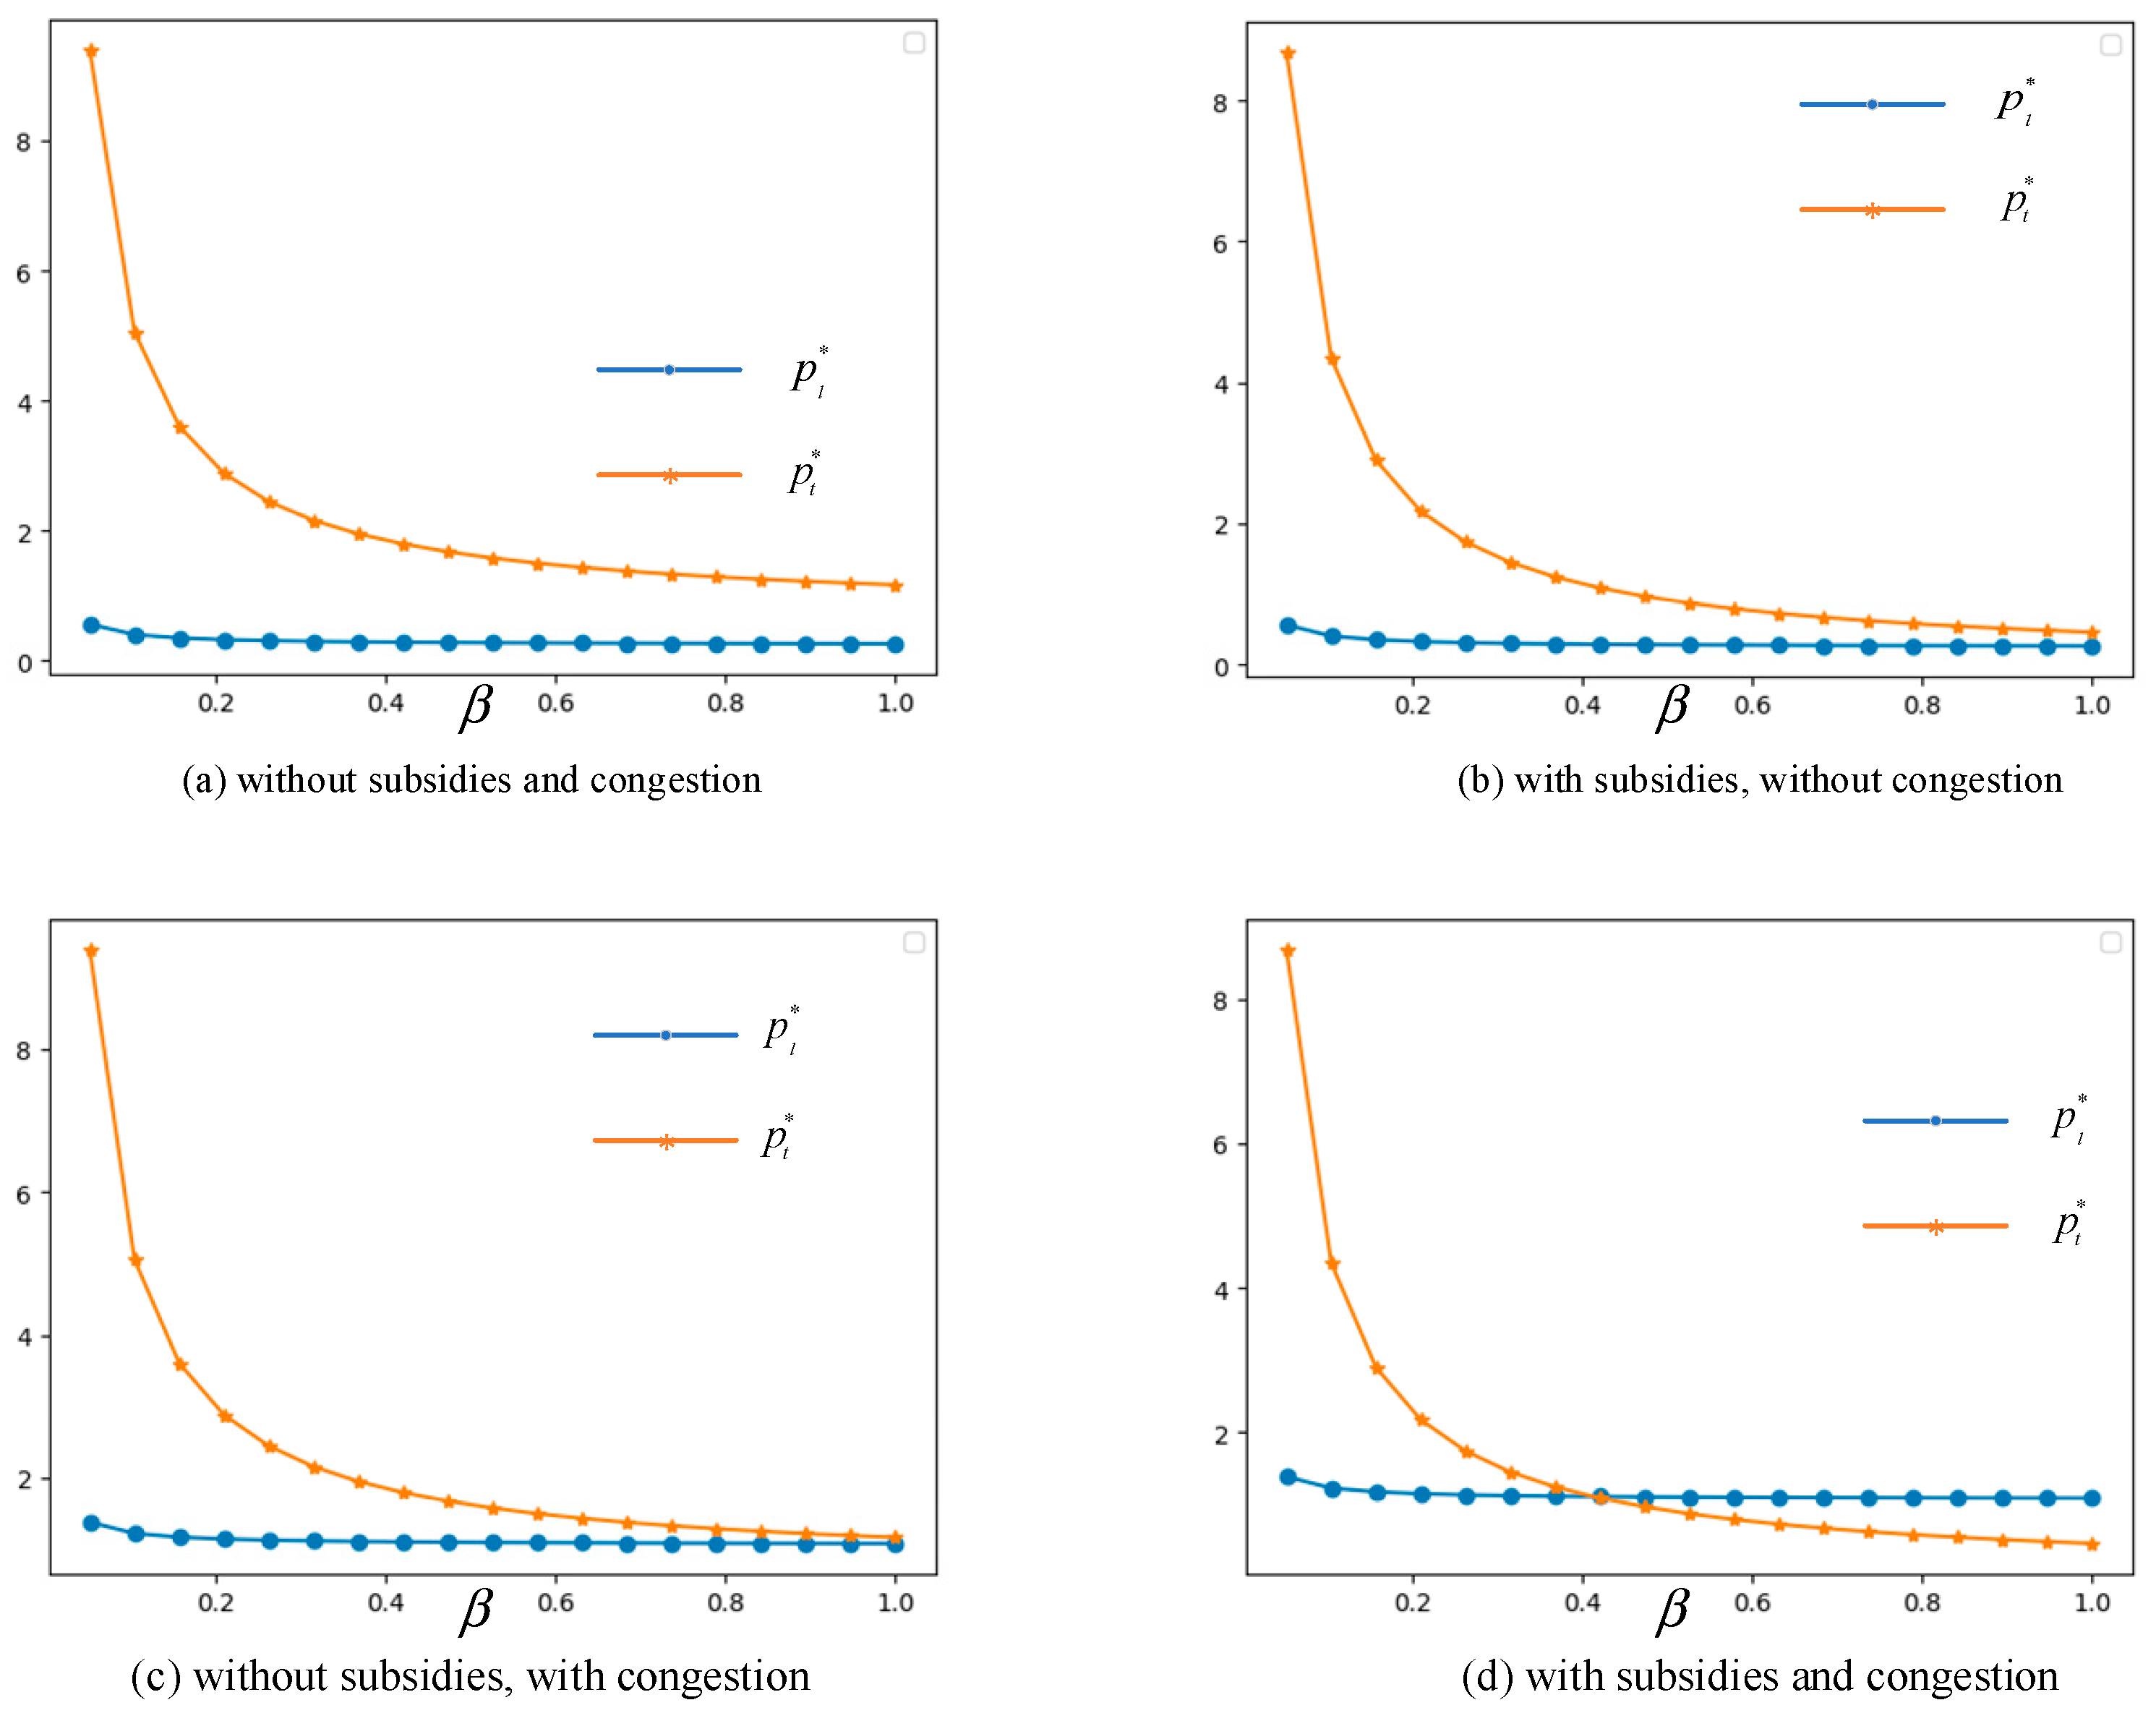
When η i = 1.5 , α = 1 , ρ = 0.035 , x 1 = 0.1 , x 2 = 0.1 , Figure 4 shows that the p t * of the transshipment mode goes down sharply when β is smaller than 0.2, and descends gradually at a certain level when β increases from 0.2 to 1. The curve of p l * shows a different trend with minor changes when β increases. In Figure 4b,c, two curves are near the coincidence state when β = 1 . For the scenario under subsidies and congestion, the freight price p t * of the transshipment mode intersects with the freight price p l * of the lockage mode when β = 0.4 because the subsidies from the government play an important role in reducing the transshipment cost.
In Figure 5, the parameters η i , α , β , x 1 and x 2 are set as 1.5, 1, 0.767, 0.1 and 0.1, respectively. The simulation results show that optimal freight prices p l * and p t * both show different changes with respect to carriers’ loyalty to the lockage mode ρ . The freight price p l * of the lockage mode increases in ρ , while the freight price p t * of the transshipment mode goes downward in ρ under different scenarios. In Figure 5a–c, p l * intersects with p t * at different values of ρ , but there is no intersection in Figure 5d. The latter shows that if carriers are more inclined to choose the lockage mode, resulting in more congestion and more waiting costs, the price of the lockage mode p l * is going to be much higher than p t * .
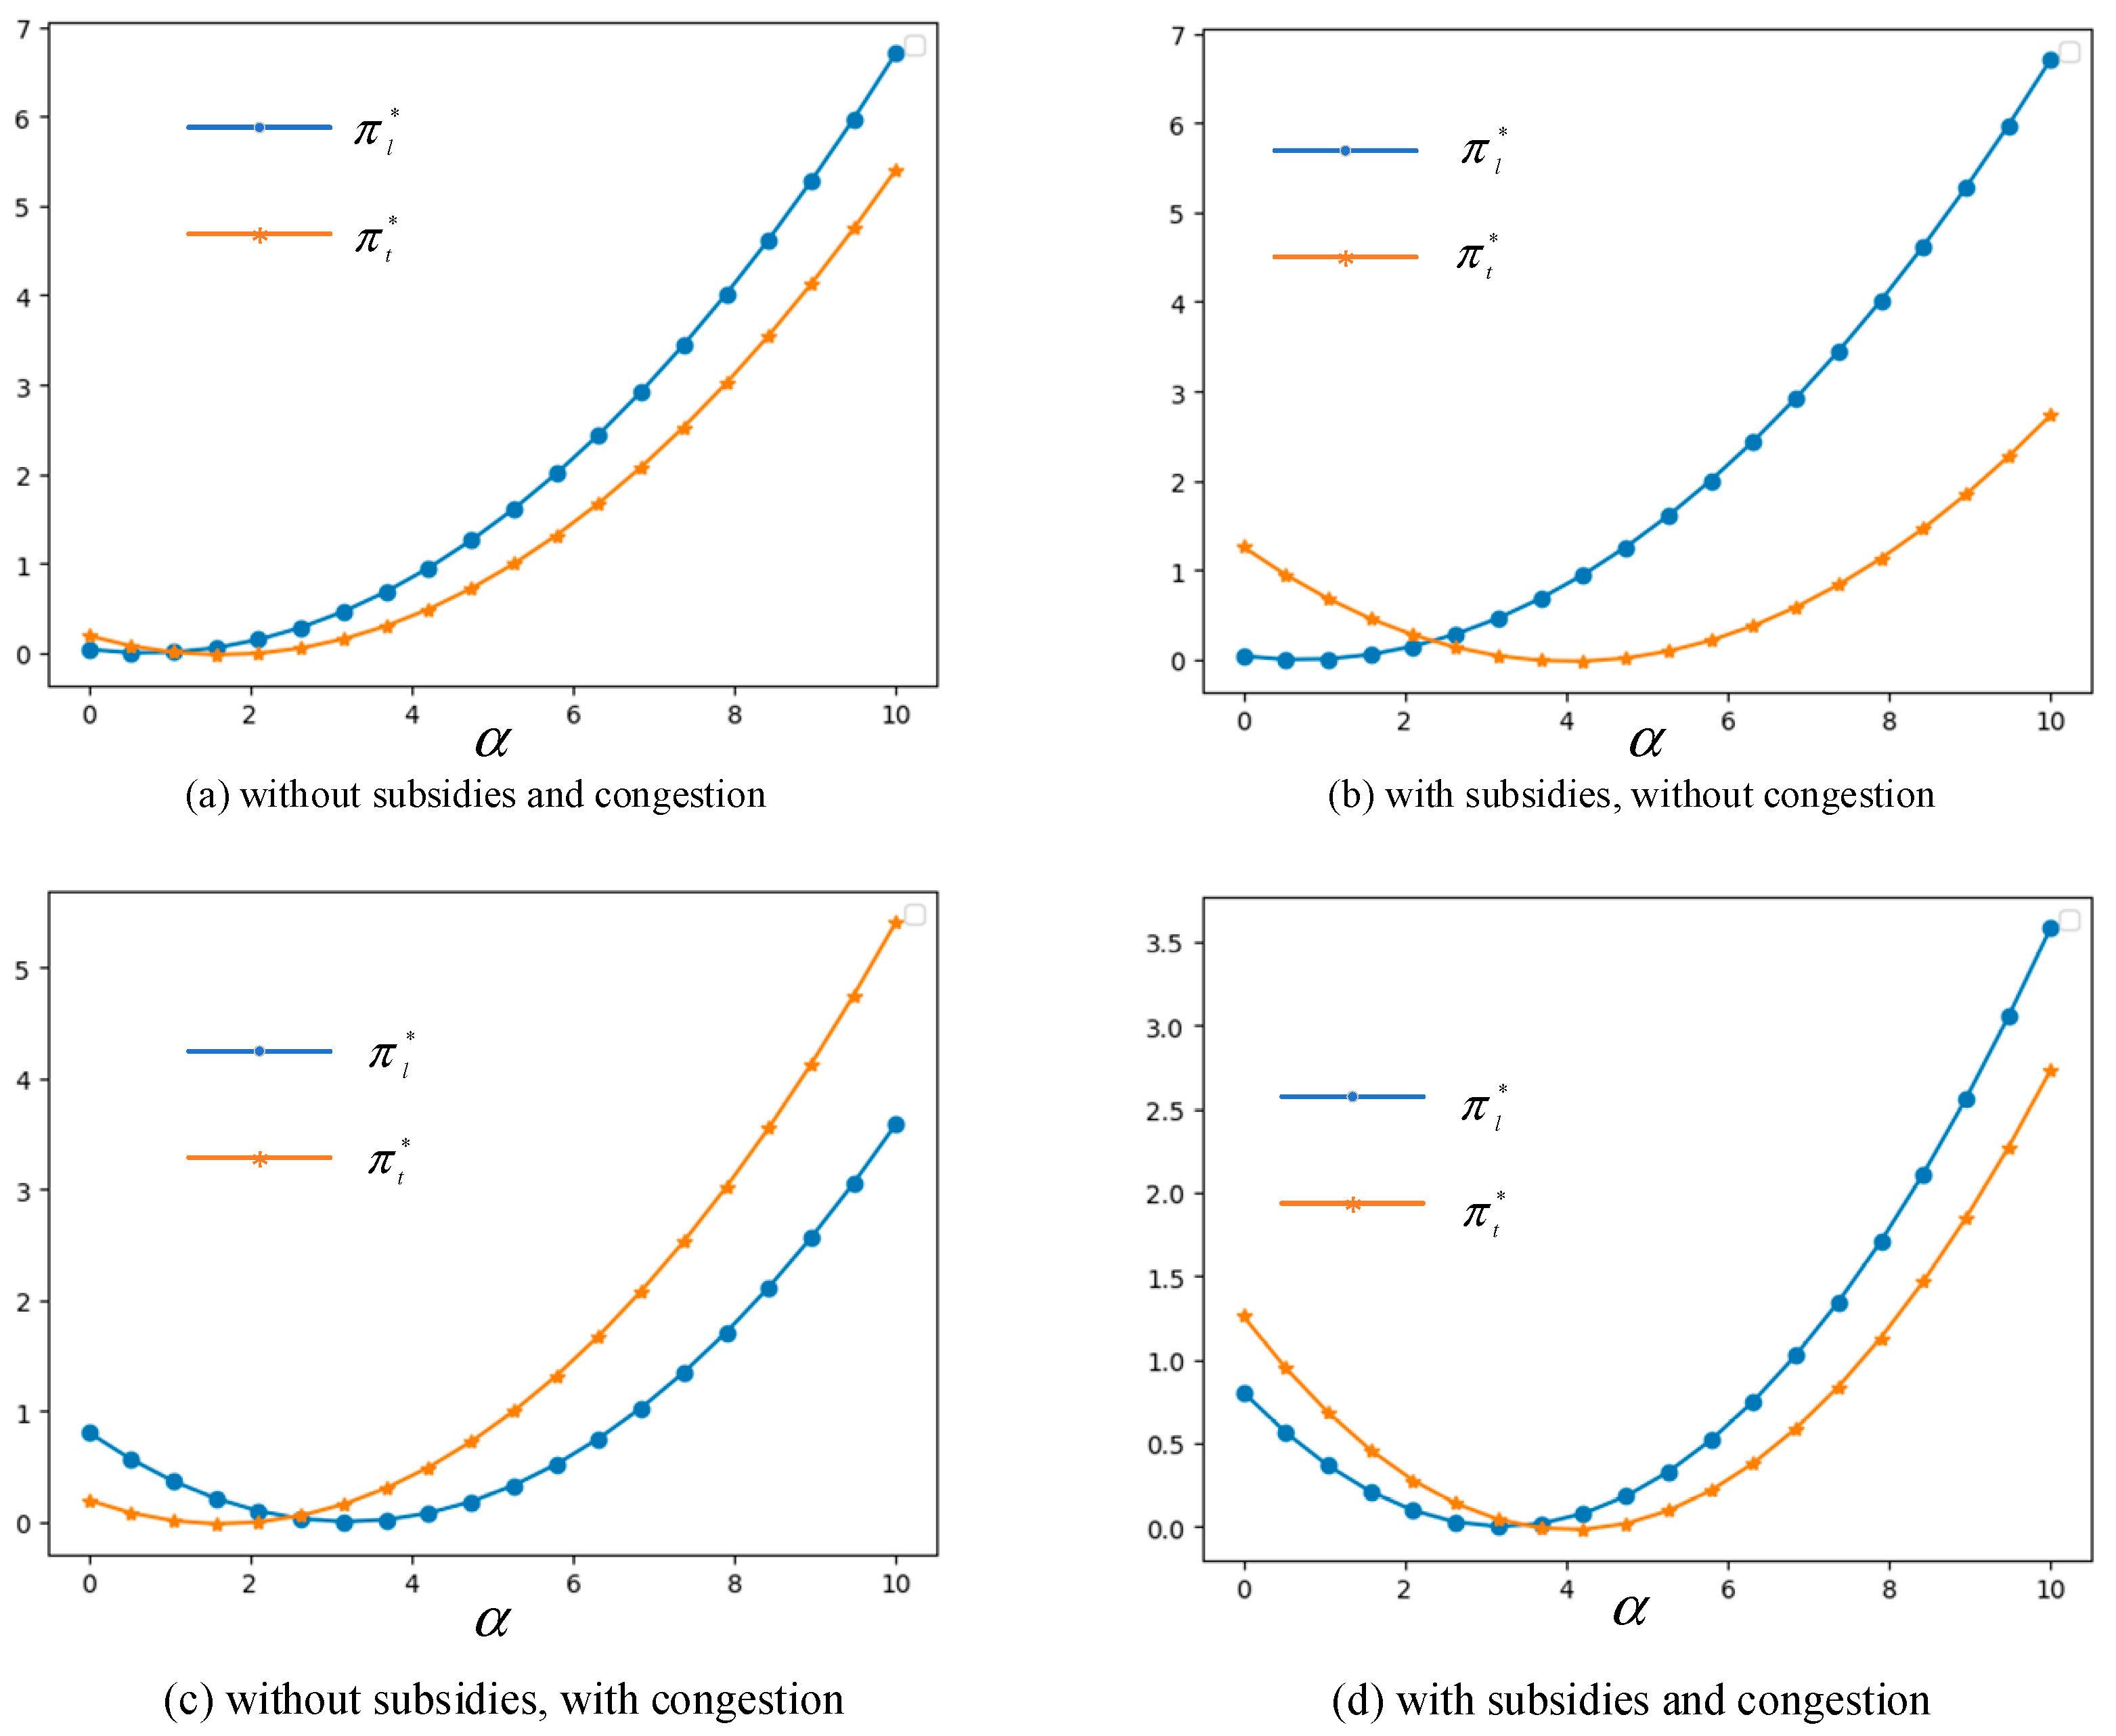
We can see from Figure 6 that, when η i , ρ , β , x 1 and x 2 are set to 1.5, 0.5, 0.8, 0.1 and 0.1, respectively, all the profit curves increase with α , and show different concave shapes. In Figure 6a–d, π l * intersects with π t * at different values of α . When α is larger than the value of intersection, π l * is larger than π t * in Figure 6a,b, which means that carriers can earn more profits without congestion before the TGD; however, the subsidies from the government are not enough to offset the loss incurred by transshipment transportation, as shown in Figure 6d. For the without subsidies and with congestion scenario in Figure 6c, carriers using the transshipment mode can earn more profits because of high delay costs before the TGD when α is larger than the value 2.6.
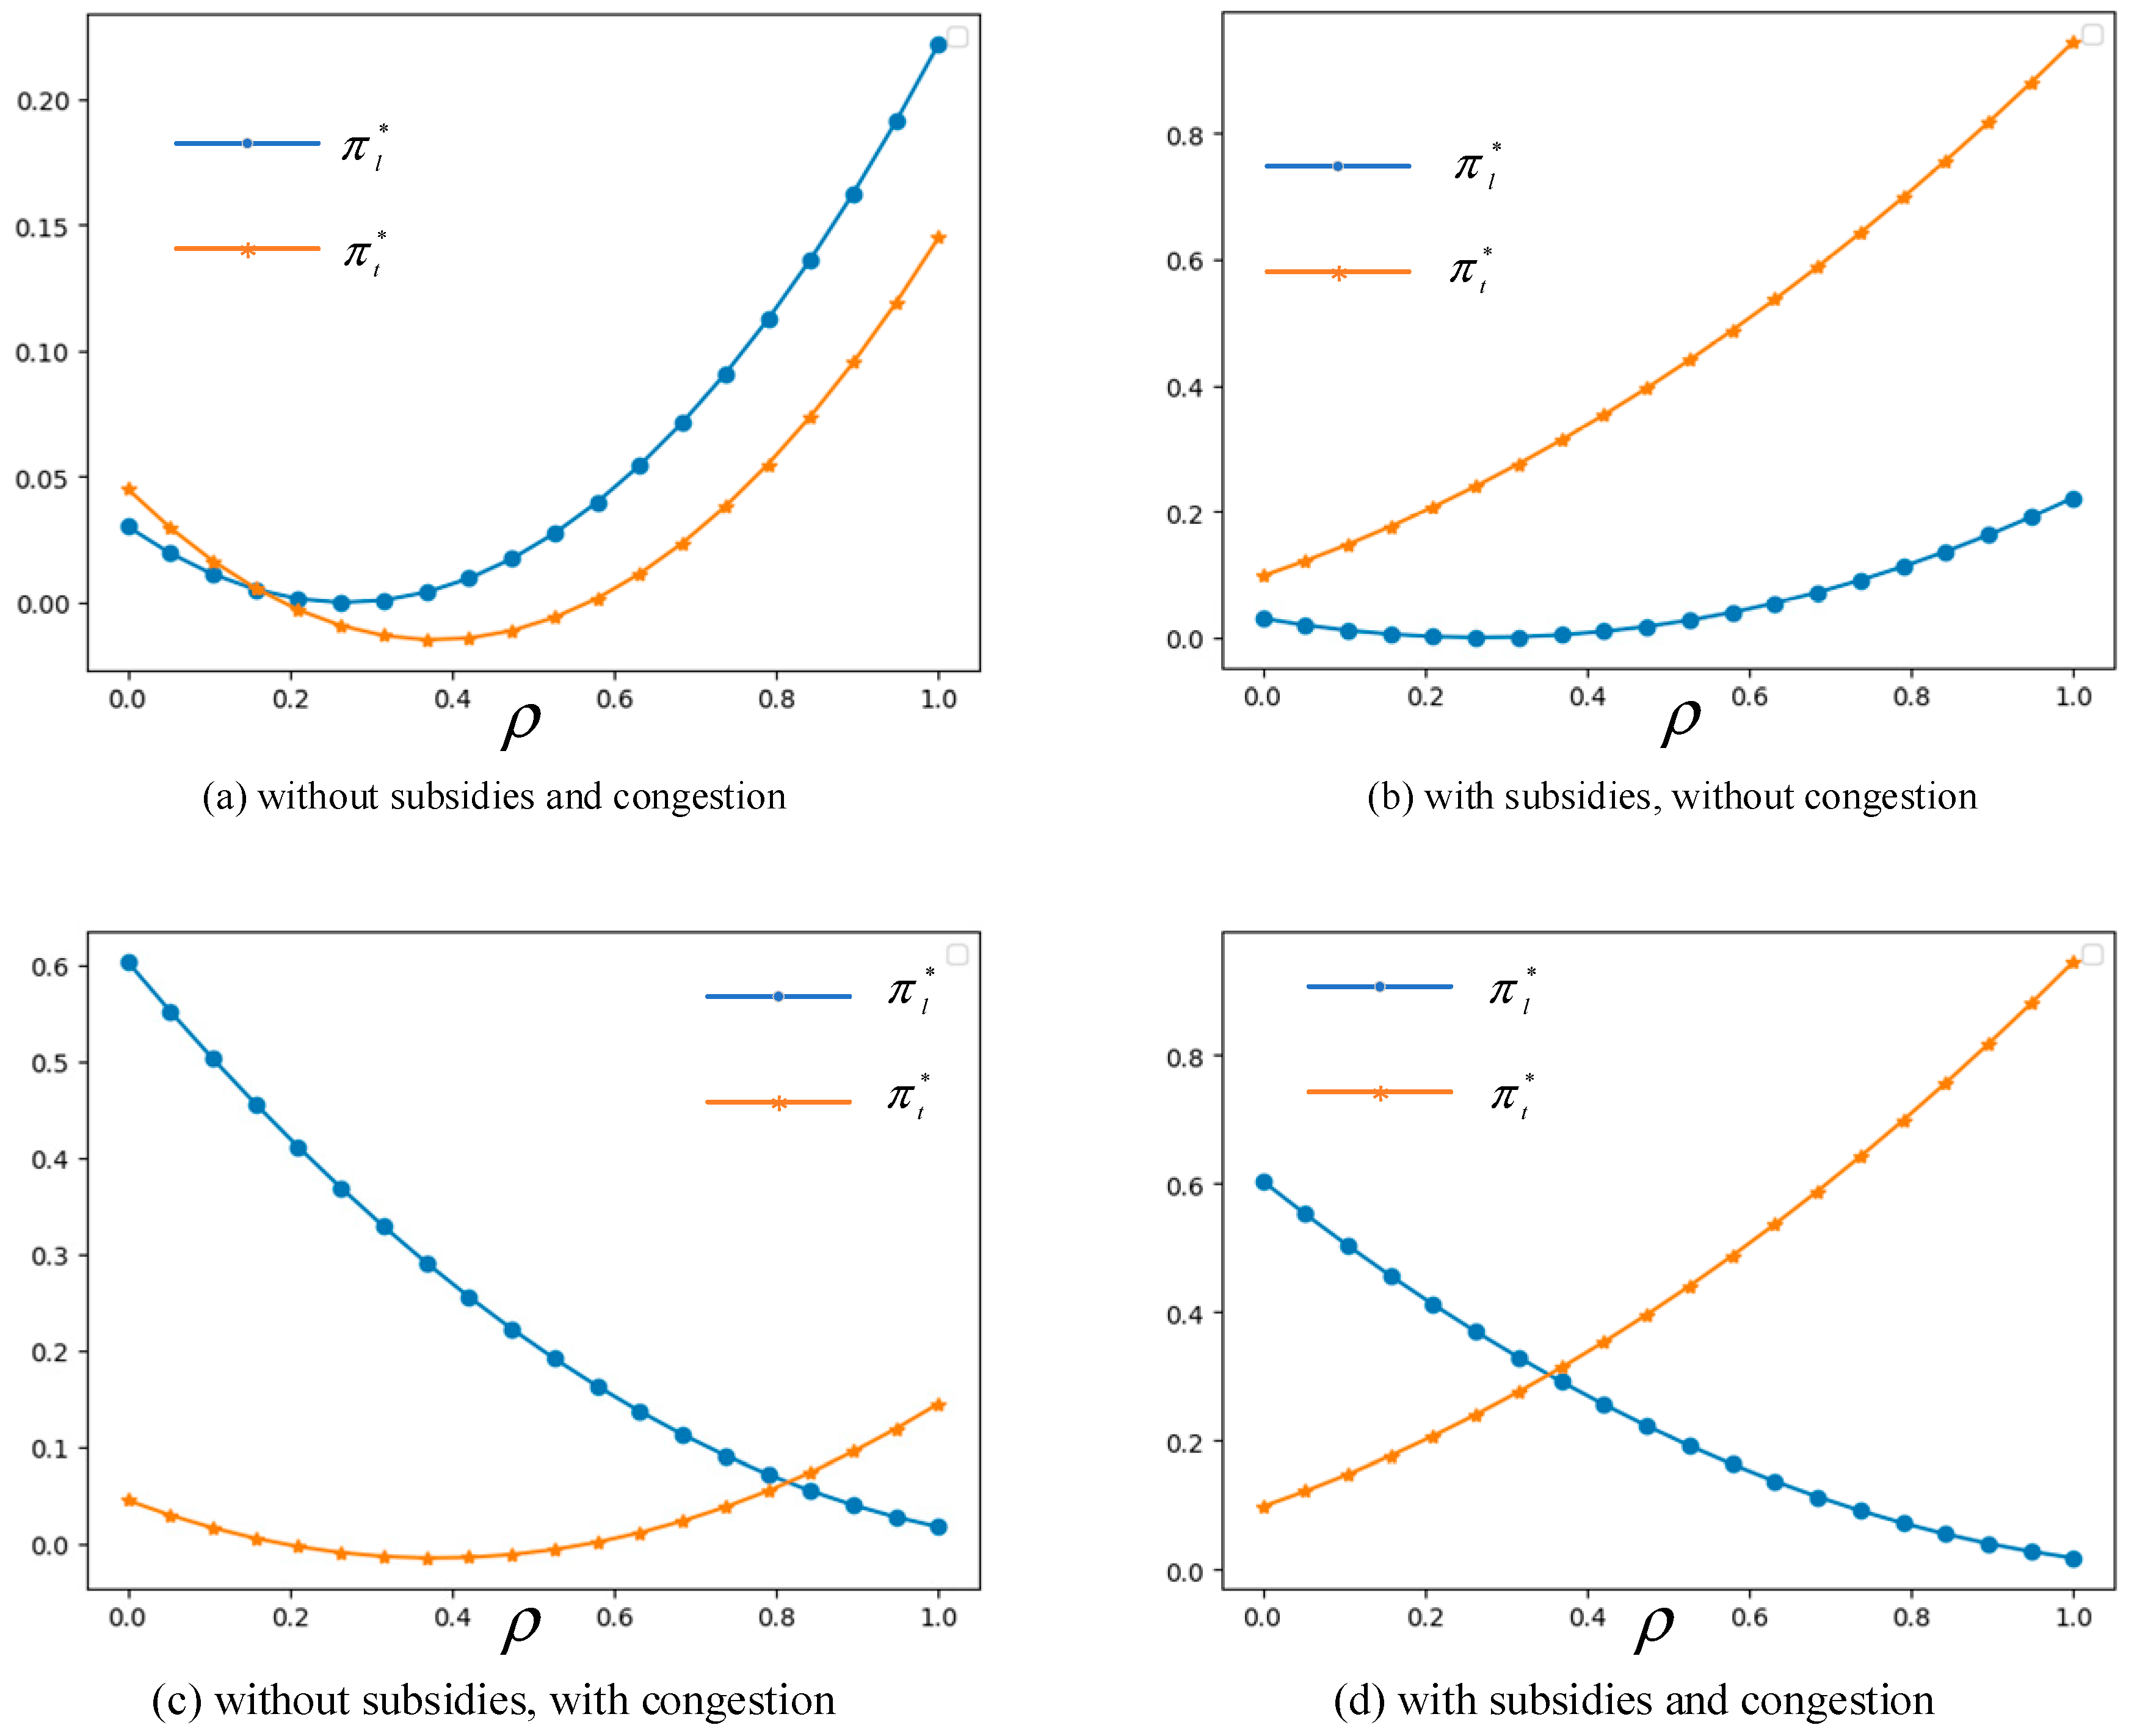
In Figure 7, we can see that profits with the lockage and transshipment modes show different changes with ρ when the parameters η i , β , x 1 and x 2 are set as 1.5, 0.6, 0.1, and 0.1, respectively. Under the scenario of congestion, the profit of the lockage mode decreases sharply because of the negative impact of congestion; when without congestion, as shown in Figure 7a,b, the curve of π l * increases with the lockage loyalty ρ > 0.3. The profit π t * of the transshipment mode increases when ρ increases beyond 0.4 as shown in Figure 7a,c, which means that if carriers are more inclined to use the lockage mode, it will result in more congestion and a higher waiting cost. Carriers should transfer to the transshipment mode if the government provides reasonable subsidies.
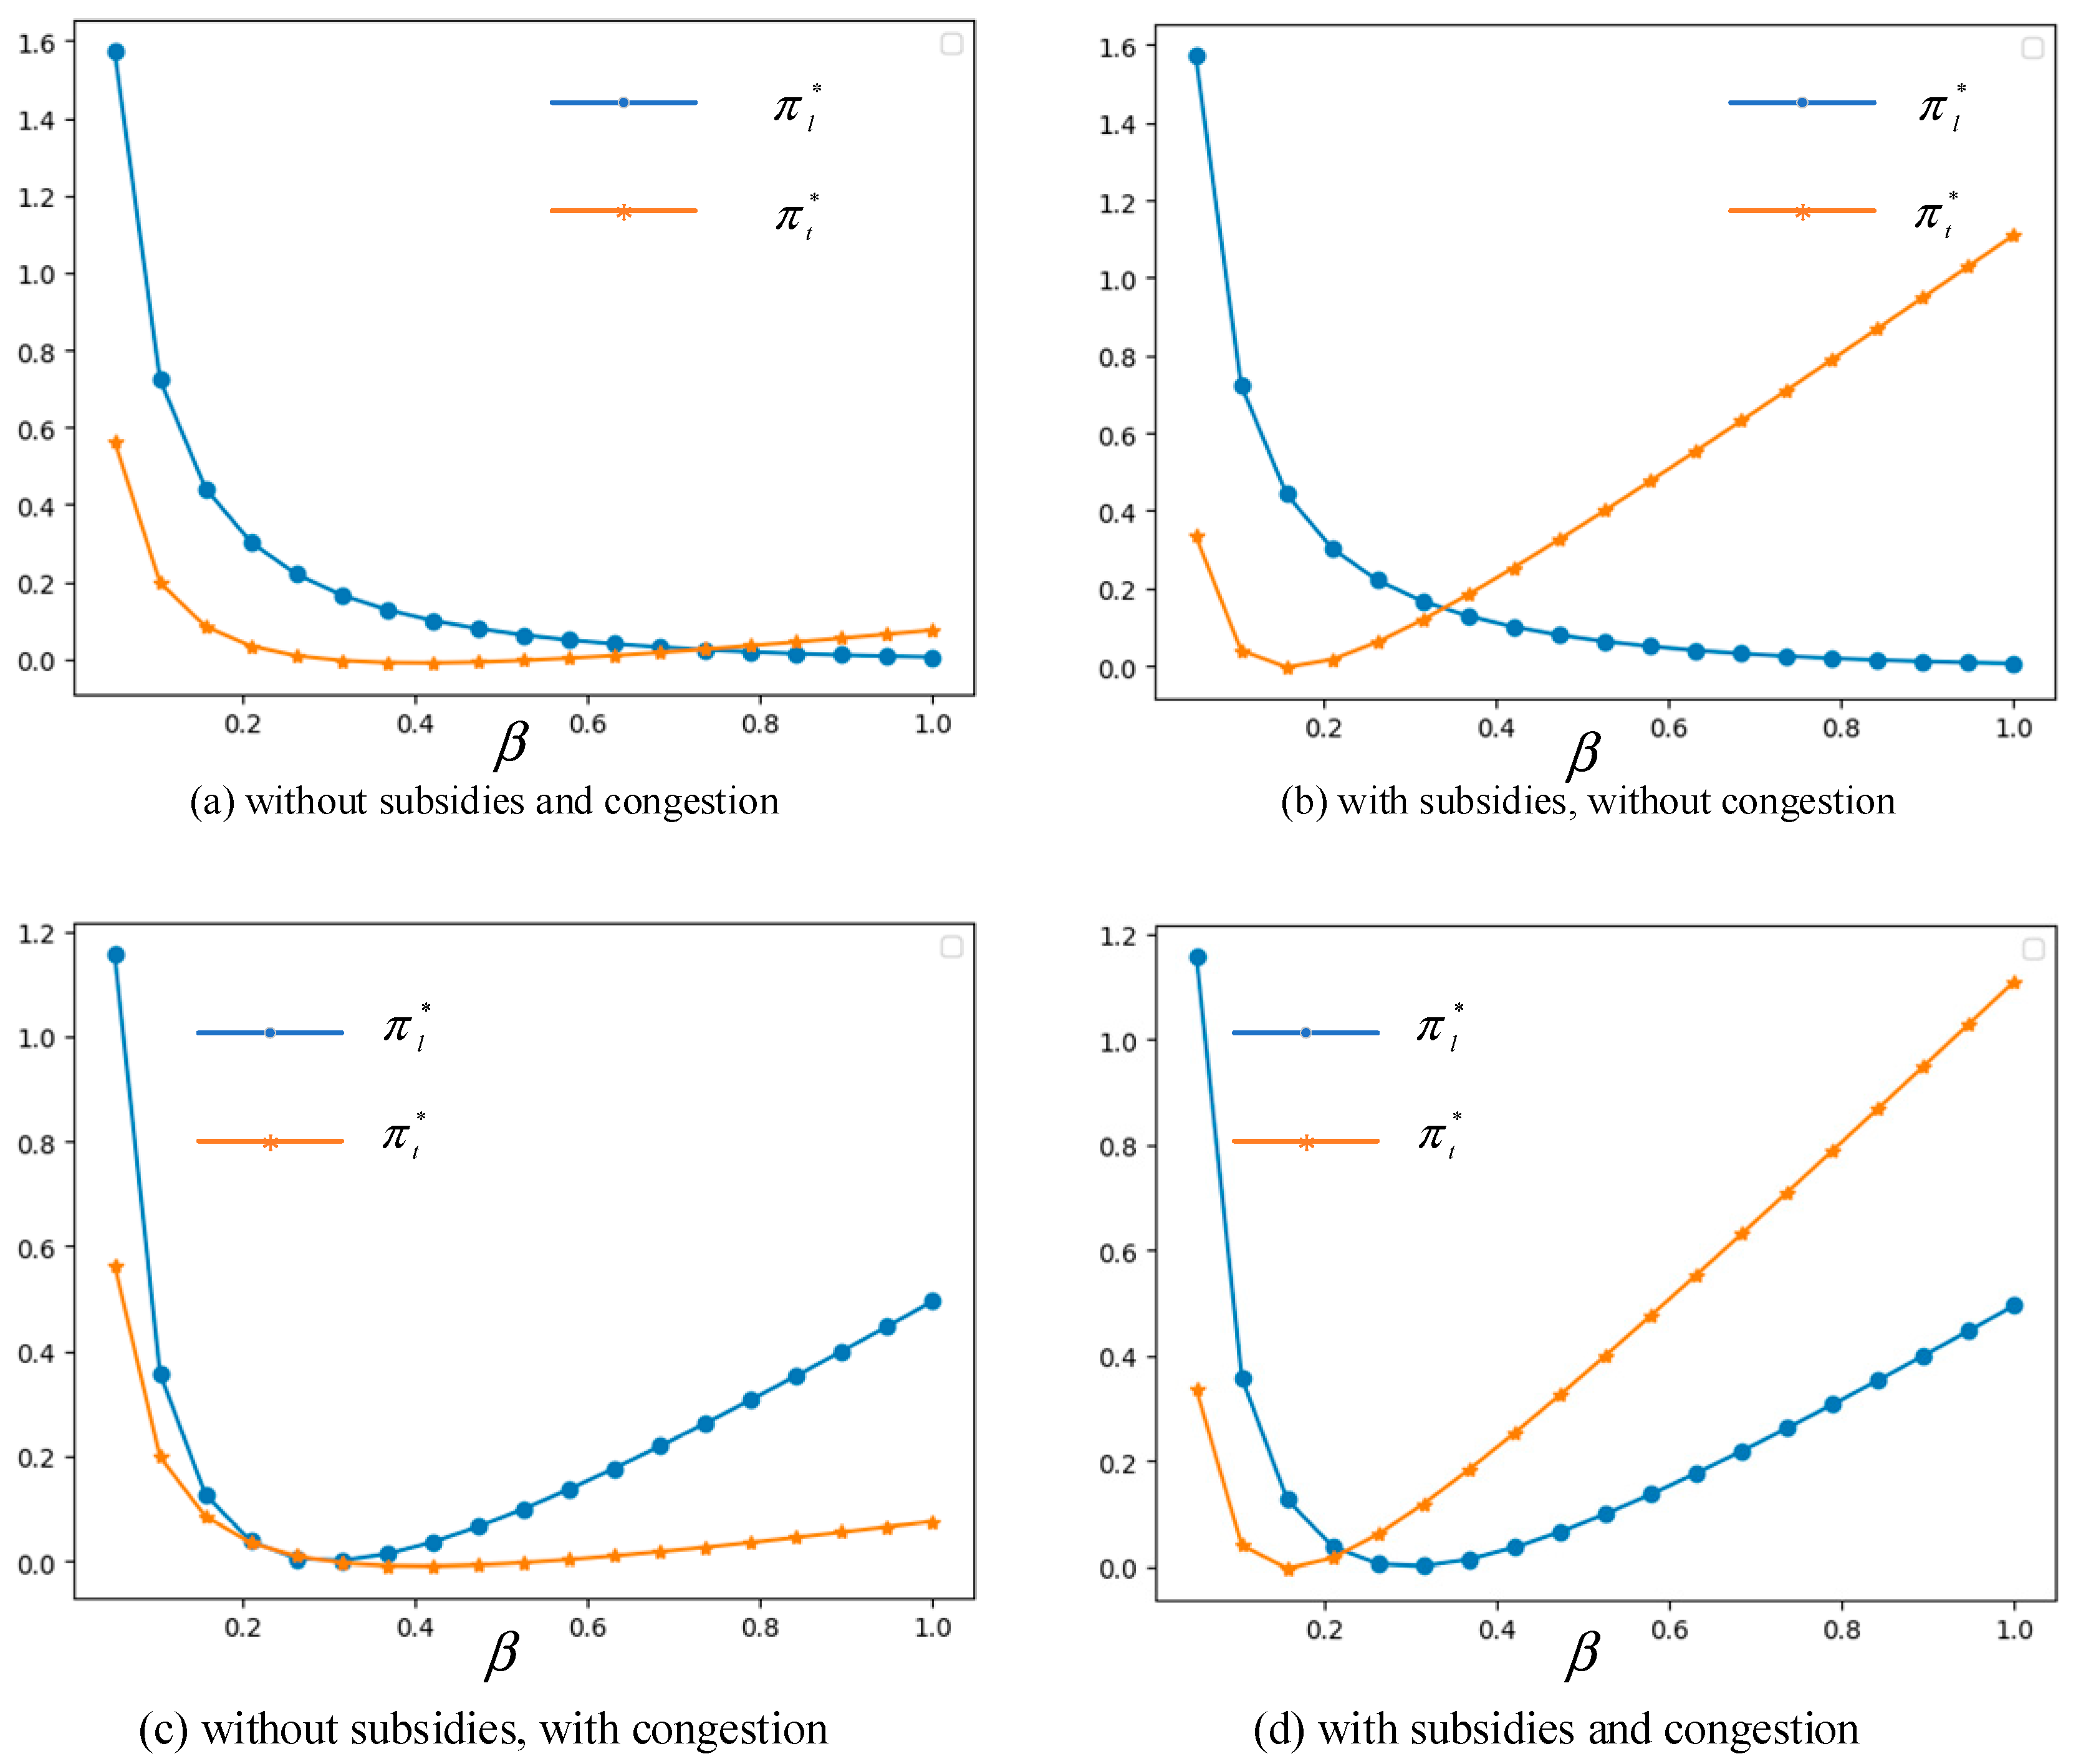
Interestingly, when η i = 1.5 , α = 1 , ρ = 0.6 , x 1 = 0.1 and x 2 = 0.1 , Figure 8 shows different changes of concave curves with an increasing β . The optimal profit with the lockage mode goes downward sharply when β is less than 0.2, then descends gradually in Figure 8a,b, but continues to grow in Figure 8c,d. In Figure 8b,d, the transshipment profit π t * goes downward sharply when β is less than 0.2, and rises rapidly after that because the subsidies can offset the cost of the transshipment mode. However, in Figure 8a,c, π t * goes downward sharply with β < 0.2 at first, and goes up only gradually when β is larger than 0.2 without subsidies. When β is larger than 0.26 under the scenario of without subsidies and with congestion, as shown in Figure 8c, it is better for carriers to adopt the lockage mode, because carriers can earn more profits.
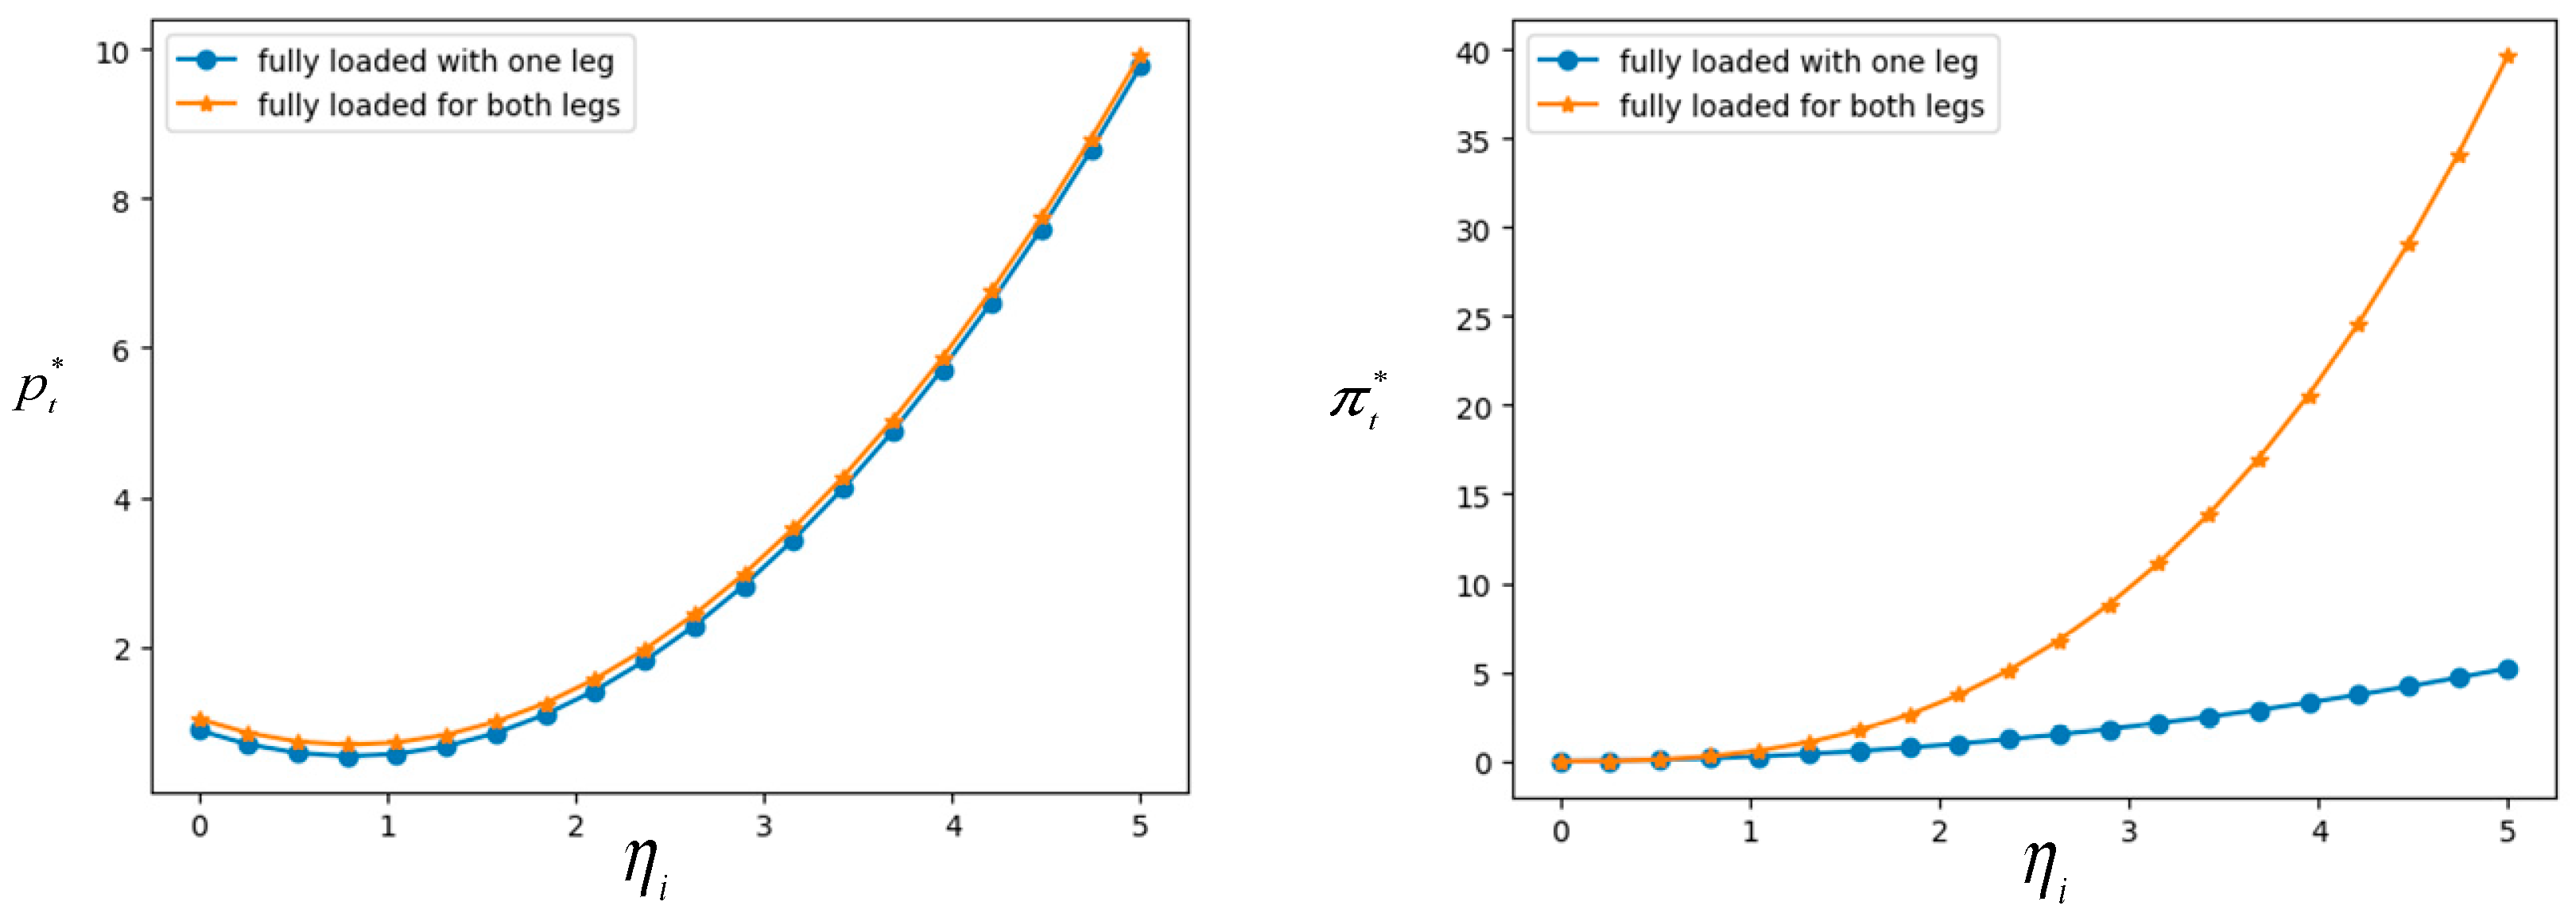
If carriers are to adopt the transshipment mode, trucks should undertake transportation back and forth many times to transship cargoes on ships. Figure 9 shows that the optimal price p t * goes upward when subsidy η i increases, but the price with fully loaded trucks for both legs is higher than the price for only one leg, which illustrates that carriers can only maximize their profits with high freight prices. However, the curve of profit under the scenario of fully loaded for both legs goes upward sharply when η i increases, which means that ship carriers can offset more transportation costs charged by truck carriers.

5. Conclusions

High transshipment costs have discouraged RO-RO and container ships from adopting the transshipment mode. The government attempted to alleviate the traffic flow of ships through subsidies for water–land transshipment, which can ease traffic flow in the waterway. However, it can bring more emissions than inland waterway transportation, resulting in a contradiction between the two modes. Given this issue, two models considering the impacts of environmental emissions under lockage and transshipment modes were constructed. We analyzed how the government subsidies affect the adoption of behavioral strategies by carriers when faced with serious congestion before the TGD. Furthermore, we evaluated the effects of congestion and transshipment on the environment as well as the optimal pricing under different modes, while considering environmental emissions and by varying the values of different parameters. The simulation results showed that subsidies from the government can affect carriers’ transshipment behaviors. If the government offers reasonable subsidies, carriers can provide more competitive pricing to maximize their profits and improve the usage of lockage, resulting in a reduction in emission and an improvement in sustainability.
Based on the simulation analysis of the case study described in Section 4, we illustrate some results in Table 2 below. It shows the variations in the unit pricing, unit profit with changes in the unit subsidy and unit freight volume of ships from the simulation, under the setting of parameters: c i t = 1.05 , e i t = 0.299 , ρ = 0.5 , β = 0.767 , x 2 = 0.1. The value of unit social welfare is manually derived from Formula (19) in Section 3.4. The results verify Corollary 2. As the subsidy from the government grows, both the unit pricing and unit profit decrease, which is beneficial to shippers; but the decreased unit profit is not advantageous to carriers. For example (see the italic numbers in Table 2), given the freight volume of 800 cars (8 units at 100 cars per unit) and the subsidy is 80,000 RMB in total (8 units at 10,000 RMB per unit), the profit will be 25,056 RMB (8 units at 3132 RMB per unit) and social welfare will be 13,264 (8 units at 1658 RMB per unit) if the carrier’s unit price is set to 270.7 RMB per car. The results offer a guideline for the government to provide a reasonable subsidy to carriers, while carriers can select reasonable pricing accordingly to avoid a substantial loss.

6. Policy Implications

The results of this study offer important implications for policymakers, carriers, and shippers. First, the government must provide guidelines for carriers to adopt the transshipment mode. Too-high transshipment costs will lead to a low pass-through ratio and low willingness of carriers to adopt the transshipment mode, which will aggravate the lock congestion condition. Especially in some emergency states such as locks malfunctions, traffic accidents, and extreme weather conditions, the government should attract carriers to adopt the transshipment mode and alleviate the congestion through more incentive mechanisms, such as subsidies to carriers and shippers, highway toll reductions, and tax benefits.
Second, the pricing of carriers should be more reasonable. When the transshipment of TGTP becomes normalcy, shippers are most likely to adopt an alternative road or railway transportation mode, if the pricing is too high. This will result in carriers suffering from the loss of customers. Similarly, if the pricing is too low, carriers will have low profits from their operations and may face the risk of bankruptcy. Future carriers must be more competitive to provide more diversified services to shippers before the TGD, including water, road, and railway modes. Consequently, shippers can pay different prices to use a more convenient service to meet their own needs. This strategy can be applied to the pricing of other carriers suitable for transshipment in water–land or water–railway mode.
Finally, with the increasing lockage volume and the prolonging waiting cost, that led to a serious backlog of ships before the TGD, a lack of capacity is becoming a barrier to the sustainable development of the Yangtze River. As the longest resourceful river in China, the Yangtze River could take advantage of a large capacity, low cost, and low energy consumption in inland transportation, turning the shipping service into gold. The TGTP can relieve the congestion through the reasonable dredge of ship flow to guarantee the unimpeded traffic of this golden river and assist the sustainable development of the Yangtze River Economic Belt.
Author Contributions

The research was designed and undertaken by Y.Z. Analysis and collection of data were performed by E.Y.L. L.Y. wrote the paper. All authors have read and approved the final manuscript.

Funding

This work was funded by the National Natural Science Foundation of China (Grant No. 71874132), and Guangxi Aviation Logistics Research Centre Project (Grant No. 20160001 and 2015KFJJHKWL03).

Conflicts of Interest

The authors declare no conflict of interest.

Appendix A

x C S = x p m a r k e t p max q i d p i = x p ρ α β ( ρ α β p i ) d p i = x [ ρ α p i 1 2 β p i 2 ] p ρ α β = x [ ρ α ( ρ α β p ) 1 2 β ( ρ 2 α 2 β 2 p 2 ) ] = x ( ρ α β p i ) 2 2 β d S W l d p i l = d [ ( p i l c i l ) ( ρ α β p i l ) + x 1 ( ρ α β p i l ) 2 2 β e i l q i l ] d p i l = ρ α 2 β p i l + β c i l x 1 ρ α + x 1 β p i l + e i l β p i l * = ( 1 x 1 ) ρ α + β ( c i l + e i l ) ( 2 x 1 ) β p i l * ρ = ( 1 x 1 ) α ( 2 x 1 ) β p i l * α = ( 1 x 1 ) ρ ( 2 x 1 ) β p i l * β = β ( c i l + e i l ) [ ( 1 x 1 ) ρ α + β ( c i l + e i l ) ] ( 2 x 1 ) β 2 = ( 1 x 1 ) ρ α ( 2 x 1 ) β 2 q i l * = ρ α β p i l * = ρ α ( 1 x 1 ) ρ α + β ( c i l + e i l ) ( 2 x 1 ) = ρ α β ( c i l + e i l ) 2 x 1 q i l * ρ = α 2 x 1 q i l * α = ρ 2 x 1 q i l * β = ( c i l + e i l ) 2 x 1 π i l * = [ ( 1 x 1 ) ( ρ α β c i l ) + β e i l ] [ ρ α β ( c i l + e i l ) ] ( 2 x 1 ) 2 β π i l * ρ = ( 1 x 1 ) α [ ρ α β ( c i l + e i l ) ] + [ ( 1 x 1 ) ( ρ α β c i l ) + β e i l ) ] α ( 2 x 1 ) 2 β = α [ 2 ( 1 x 1 ) ( ρ α β c i l ) + x 1 β e i l ] ( 2 x 1 ) 2 β π i l * α = ( 1 x 1 ) ρ [ ρ α β ( c i l + e i l ) ] + [ ( 1 x 1 ) ( ρ α β c i l ) + β e i l ] ρ ( 2 x 1 ) 2 β = ρ [ 2 ( 1 x ) ( ρ α β c i l ) + x β e i l ] ( 2 x 1 ) 2 β π i l * β = 1 ( 2 x 1 ) 2 β [ ( 1 x 1 ) ( c i l ) + e i l ] [ ρ α β ( c i l + e i l ) ] + β [ ( 1 x 1 ) ( ρ α β c i l ) + β e i l ] [ ( c i l + e i l ) ] β 2 1 ( 2 x 1 ) 2 [ ( 1 x 1 ) ( ρ α β c i l ) + β e i l ] [ ρ α β ( c i l + e i l ) ] β 2 S W l * = ( p i l * c i l ) ( ρ α β p i l * ) + x 1 ( ρ α β p i l * ) 2 2 β e i l q i l * = q i l * [ p i i * + x 1 2 β ( ρ α β p i l * ) ( c i l + e i l ) ] = [ ρ α β ( c i l + e i l ) ] 2 2 β ( 2 x 1 )

Appendix B

x C S = x p m a r k e t p max q i d p i = x p ( 1 ρ ) α β η i β ( 1 ρ ) α β ( p i + η i ) d p i = x [ ( 1 ρ ) α p i β η i p i 1 2 β p i 2 ] p ( 1 ρ ) α β η i β = x [ ( 1 ρ ) α β η i β p i ] 2 2 β d ( S W t ) d p i = d { ( p i c i t ) [ ( 1 ρ ) α β ( p i + η i ) ] + x 2 [ ( 1 ρ ) α β η i β p i ] 2 2 β e i t [ ( 1 ρ ) α β ( p i + η i ) ] } d p i = ( 1 ρ ) α β ( p i + η i ) + ( p i c i t ) ( β ) x 2 [ ( 1 ρ ) α β η i β p i ] + e i t β = ( 1 x 2 ) [ ( 1 ρ ) α β η i ] + β ( c i t + e i t ) + ( x 2 2 ) β p i p i t * = ( 1 x 2 ) [ ( 1 ρ ) α β η i ] + β ( c i t + e i t ) ( 2 x 2 ) β p i t * α = ( 1 x 2 ) ( 1 ρ ) ( 2 x 2 ) β p i t * ρ = ( 1 x 2 ) ( α ) ( 2 x 2 ) β p i t * η i = ( 1 x 2 ) ( 2 x 2 ) p i t * β = ( 1 x 2 ) ( 2 x 2 ) · [ ( 1 ρ ) α β η i + ( c i t + e i t ) ] β = ( 1 x 2 ) ( 2 x 2 ) · [ ( 1 ρ ) α β 2 ] q i t * = ( 1 ρ ) α β ( p i t * + η i ) = ( 1 ρ ) α β [ ( 1 x 2 ) [ ( 1 ρ ) α β η i ] + β ( c i t + e i t ) ( 2 x 2 ) β + η i ] = ( 1 ρ ) α β ( η i + c i t + e i t ) 2 x 2 q i t * α = 1 ρ 2 x 2 q i t * ρ = α 2 x 2 q i t * η i = β 2 x 2 q i t * β = ( η i + c i t + e i t ) 2 x 2 q i t * x 2 = β ( η i + c i t + e i t ) ( 1 ρ ) α ( 2 x 2 ) 2 π i t * = [ ( 1 ρ ) α β ( η i + c i t + e i t ) ] { ( 1 x 2 ) [ ( 1 ρ ) α β ( η i + c i t ) ] + β e i t } ( 2 x 2 ) 2 β π i t * α = ( 1 ρ ) { ( 1 x 2 ) [ ( 1 ρ ) α β ( η i + c i t ) ] + β e i t ) } + ( 1 x 2 ) ( 1 ρ ) [ ( 1 ρ ) α β ( η i + c i t + e i t ) ] ( 2 x 2 ) 2 β = ( 1 ρ ) ( 2 x 2 ) 2 β { 2 ( 1 x 2 ) [ ( 1 ρ ) α β ( η i + c i t ) ] + x 2 β e i t } π i t * ρ = α { ( 1 x 2 ) [ ( 1 ρ ) α β ( η i + c i t ) ] + β e i t ) } + ( 1 x 2 ) α [ ( 1 ρ ) α β ( η i + c i t + e i t ) ] ( 2 x 2 ) 2 β = α ( 2 x 2 ) 2 β { 2 ( 1 x 2 ) [ ( 1 ρ ) α β ( η i + c i t ) ] + x 2 β e i t } π i t * η i = ( β ) { ( 1 x 2 ) [ ( 1 ρ ) α β ( η i + c i t ) ] + β e i t ) } + ( 1 x 2 ) ( β ) [ ( 1 ρ ) α β ( η i + c i t + e i t ) ] ( 2 x 2 ) 2 β = 1 ( 2 x 2 ) 2 { 2 ( 1 x 2 ) [ ( 1 ρ ) α β ( η i + c i t ) ] + x 2 β e i t } π i t * β = 1 ( 2 x 2 ) 2 β [ ( η i + c i t + e i t ) ] { ( 1 x 2 ) [ ( 1 ρ ) α β ( η i + c i t ) ] + β e i t ) } + β [ ( 1 ρ ) α β ( η i + c i t + e i t ) ] { ( 1 x 2 ) [ ( η i + c i t ) ] + e i t ) } β 2 1 ( 2 x 2 ) 2 1 β 2 [ ( 1 ρ ) α β ( η i + c i t + e i t ) ] { ( 1 x 2 ) [ ( 1 ρ ) α β ( η i + c i t ) ] + β e i t ) } S W t * = ( p i t * c i t ) [ ( 1 ρ ) α β ( p i t * + η i ) ] + x 2 [ ( 1 ρ ) α β η i β p i t * ] 2 2 β e i t q i t * = [ ( 1 ρ ) α β ( η i + c i t + e i t ) ] 2 2 β ( 2 x 2 )

Appendix C

Program Codes of Figure 3a:
import numpy as np
import matplotlib.pyplot as plt
cl = 0.45 “Unit cost of lockage mode ”
el = 0.016 “Unit environmental cost of lockage mode ”
ct = 1.05 “Unit cost of transshipment mode ”
et = 0.299 “Unit environmental cost of transshipment mode ”
st = 0 “Unit subsidy from the government ”
pou = 0.035 “ The degree of carriers’ loyalty to the lockage mode ”
beta = 0.767 “Customer’s price sensitivity”
x1 = 0.1 “The fraction of the shippers’ surplus”
x2 = 0.1 “The fraction of the shippers’ surplus”
x = np.linspace(1,10,20)
y1 = ((1 − x1) * pou * x+ beta * (cl + el))/(beta * ((2 − x1))) “Function of pl”
y2 = ((1 − x2) * ((1−pou) * x − beta * st) + beta * (ct + et))/(beta * ((2 − x2))) “Function of pt”
plt.figure()
plt.plot(x, y1, marker = ‘o’) #pl
plt.plot(x, y2, marker = ‘*’) #pt
plt.legend()
plt.show()

References

  1. UNITEX. The Volume of Goods Passing along the Yangtze River Trunk Line Reached 2.93 Billion Tons, up 8.9 Percent Year on Year. Available online: http://www.unitexlogistics.com/content/?699.html (accessed on 25 August 2020).
  2. Yuan, Y.; Ji, B.; Yuan, X.; Huang, Y. Lockage scheduling of Three Gorges-Gezhouba dams by hybrid of chaotic particle swarm optimization and heuristic-adjusted strategies. Appl. Math. Comput. 2015, 270, 74–89. [Google Scholar] [CrossRef]
  3. Ji, B.; Yuan, X.; Yuan, Y. A binary borg-based heuristic method for solving a multi-objective lock and transshipment co-scheduling problem. IEEE Trans. Intell. Transp. Syst. 2018, 20, 947–958. [Google Scholar] [CrossRef]
  4. Yuan, X.; Ji, B.; Yuan, Y.; Wu, X.; Zhang, X. Co-scheduling of lock and water–land transshipment for ships passing the dam. Appl. Soft Comput. 2016, 45, 150–162. [Google Scholar] [CrossRef]
  5. Yang, L.; Zhang, Y.; Chiong, R.; Dhakal, S.; Qi, Q. Using evolutionary game theory to study behavioral strategies of the government and carriers under different transshipment modes. IEEE Access. 2020, 8, 18514–18521. [Google Scholar] [CrossRef]
  6. Fu, B.J.; Wu, B.F.; Lü, Y.H.; Xu, Z.H.; Cao, J.H.; Niu, D.; Yang, G.S.; Zhou, Y.M. Three Gorges Project: Efforts and challenges for the environment. Prog. Phys. Geogr. 2010, 34, 741–754. [Google Scholar] [CrossRef]
  7. Nauss, R.M. Optimal sequencing in the presence of setup times for tow/barge traffic through a river lock. Eur. J. Oper. Res. 2008, 187, 1268–1281. [Google Scholar] [CrossRef]
  8. Zhang, X.; Fu, X.; Yuan, X. Co-evolutionary strategy algorithm to the lockage scheduling of the three gorges project. In Proceedings of the 2008 IEEE Pacific-Asia Workshop on Computational Intelligence and Industrial Application, Wuhan, China, 19–20 December 2008; Volume 2, pp. 583–587. [Google Scholar]
  9. Smith, L.D.; Nauss, R.M.; Mattfeld, D.C.; Li, J.; Ehmke, J.F.; Reindl, M. Scheduling operations at system choke points with sequence-dependent delays and processing times. Transp. Res. Part E 2011, 47, 669–680. [Google Scholar] [CrossRef]
  10. Wang, X.; Qi, H.; Xiao, H.; Zhang, X.; Hu, Y.; Feng, X. Series queuing network scheduling approach to co-scheduling model of three Gorges-Gezhou dam. J. Syst. Sci. Complex. 2010, 23, 715–726. [Google Scholar] [CrossRef]
  11. Wang, X.; Zhao, Y.; Sun, P.; Wang, X. An analysis on convergence of data-driven approach to ship lock scheduling. Math. Comput. Simulat. 2013, 88, 31–38. [Google Scholar] [CrossRef]
  12. Reynaerts, J. Estimating lock congestion. Int. J. Shipp. Transp. Logist. 2014, 6, 133–151. [Google Scholar] [CrossRef] [Green Version]
  13. Bugarski, V.; BačKalić, T.; Kuzmanov, U. Fuzzy decision support system for ship lock control. Expert Syst. Appl. 2013, 40, 3953–3960. [Google Scholar] [CrossRef]
  14. Kanović, Ž.; Bugarski, V.; Bačkalić, T. Ship lock control system optimization using GA, PSO and ABC: A comparative review. Promet-Traffic Transp. 2014, 26, 23–31. [Google Scholar] [CrossRef]
  15. Verstichel, J. The Lock Scheduling Problem. Ph.D. Dissertation, Faculty of Engineering Science, KU Leuven, Heverlee, Belgium, 2013. Available online: https://lirias.kuleuven.be/1675876?limo=0 (accessed on 25 August 2020).
  16. Verstichel, J.; De Causmaecker, P.; Spieksma, F.C.; Berghe, G.V. Exact and heuristic methods for placing ships in locks. Eur. J. Oper. Res. 2014, 235, 387–398. [Google Scholar] [CrossRef]
  17. Verstichel, J.; De Causmaecker, P.; Spieksma, F.; Berghe, G.V. The generalized lock scheduling problem: An exact approach. Transp. Res. Part E 2014, 65, 16–34. [Google Scholar] [CrossRef]
  18. Verstichel, J.; Kinable, J.; De Causmaecker, P.; Berghe, G.V. A Combinatorial Benders’ decomposition for the lock scheduling problem. Comput. Oper. Res. 2015, 54, 117–128. [Google Scholar] [CrossRef] [Green Version]
  19. Zhang, Y.Y.; Chang, M.S.; Fuller, S.W. Statistical analysis of vessel waiting time and lockage time on the Upper Mississippi River. Marit. Econ. Logist. 2015, 17, 416–439. [Google Scholar] [CrossRef]
  20. Prandtstetter, M.; Ritzinger, U.; Schmidt, P.; Ruthmair, M. A variable neighborhood search approach for the interdependent lock scheduling problem. In Proceedings of the European Conference on Evolutionary Computation in Combinatorial Optimization, Copenhagen, Denmark, 8–10 April 2015; Springer: New York, NY, USA, 2015. [Google Scholar]
  21. Passchyn, W.; Coene, S.; Briskorn, D.; Hurink, J.L.; Spieksma, F.C.; Berghe, G.V. The lockmaster’s problem. Eur. J. Oper. Res. 2016, 251, 432–441. [Google Scholar] [CrossRef]
  22. Ji, B.; Yuan, X.; Yuan, Y. Orthogonal design-based NSGA-III for the optimal lockage co-scheduling problem. IEEE Trans. Intell. Transp. Syst. 2016, 18, 2085–2095. [Google Scholar] [CrossRef]
  23. Passchyn, W.; Briskorn, D.; Spieksma, F.C. No-wait scheduling for locks. Inf. J. Comput. 2019, 31, 413–428. [Google Scholar] [CrossRef]
  24. Wilson, W.W.; Dahl, B.L.; Taylor, R.D. Impacts of lock capacity expansion on delay costs for grain shipped on the Mississippi River. J. Transp. Econ. Policy 2011, 45, 129–154. [Google Scholar]
  25. Liao, P. Improved analytical model for estimating the capacity of a waterway lock. J. Waterw. Port Coast. Ocean Eng. 2018, 144, 04018021. [Google Scholar] [CrossRef]
  26. Ji, B.; Yuan, X.; Yuan, Y.; Lei, X.; Fernando, T.; Iu, H.H. Exact and heuristic methods for optimizing lock-quay system in inland waterway. Eur. J. Oper. Res. 2019, 277, 740–755. [Google Scholar] [CrossRef]
  27. Tawfik, C.; Limbourg, S. Pricing Problems in Intermodal Freight Transport: Research Overview and Prospects. Sustainability 2018, 10, 3341. [Google Scholar] [CrossRef] [Green Version]
  28. Chen, J.; Wu, D.; Li, P. Research on the Pricing Model of the Dual-Channel Reverse Supply Chain Considering Logistics Costs and Consumers’ Awareness of Sustainability Based on Regional Differences. Sustainability 2018, 10, 2229. [Google Scholar] [CrossRef] [Green Version]
  29. Xie, C.; Wang, X.; Fukuda, D. On the Pricing of Urban Rail Transit with Track Sharing Freight Service. Sustainability 2020, 12, 2758. [Google Scholar] [CrossRef] [Green Version]
  30. Baghestani, A.; Tayarani, M.; Allahviranloo, M.; Gao, H.O. Evaluating the Traffic and Emissions Impacts of Congestion Pricing in New York City. Sustainability 2020, 12, 3655. [Google Scholar] [CrossRef]
  31. Wang, S.; Meng, Q. Liner ship fleet deployment with container transshipment operations. Transp. Res. Part E 2012, 48, 470–484. [Google Scholar] [CrossRef]
  32. Lee, L.H.; Chew, E.P.; Tan, K.C.; Wang, Y. Vehicle dispatching algorithms for container transshipment hubs. OR Spectrum 2010, 32, 663–685. [Google Scholar] [CrossRef]
  33. Zhen, L.; Shen, T.; Wang, S.; Yu, S. Models on ship scheduling in transshipment hubs with considering bunker cost. Int. J. Prod. Econ. 2016, 173, 111–121. [Google Scholar] [CrossRef]
  34. Dubovik, A.; Janssen, M.C. Oligopolistic competition in price and quality. Games Econ. Behav. 2012, 75, 120–138. [Google Scholar] [CrossRef] [Green Version]
  35. Álvarez-SanJaime, Ó.; Cantos-Sánchez, P.; Moner-Colonques, R.; Sempere-Monerris, J.J. Competition and horizontal integration in maritime freight transport. Transp. Res. Part E 2013, 51, 67–81. [Google Scholar] [CrossRef] [Green Version]
  36. Xu, L.; Govindan, K.; Bu, X.; Yin, Y. Pricing and balancing of the sea–cargo service chain with empty equipment repositioning. Comput. Oper. Res. 2015, 54, 286–294. [Google Scholar] [CrossRef]
  37. Qu, C.; Wang, G.W.; Zeng, Q. Modelling port subsidy policies considering pricing decisions of feeder carriers. Transp. Res. Part E 2017, 99, 115–133. [Google Scholar] [CrossRef]
  38. Sinayi, M.; Rasti-Barzoki, M. A game theoretic approach for pricing, greening, and social welfare policies in a supply chain with government intervention. J. Clean. Prod. 2018, 196, 1443–1458. [Google Scholar] [CrossRef]
Figure 1. Freight Volume of the Yangtze River.
Sustainability 12 07026 g001
Figure 2. Three Gorges Transshipment Project.
Sustainability 12 07026 g002
Figure 3. Changes in optimal prices with respect to market potential α .
Sustainability 12 07026 g003
Figure 4. Changes in the optimal prices with respect to price sensitivity β .
Sustainability 12 07026 g004
Figure 5. Changes in optimal prices with respect to lockage loyalty ρ .
Sustainability 12 07026 g005
Figure 6. Changes in optimal profits with respect to market potential α .
Sustainability 12 07026 g006
Figure 7. Changes in optimal profits with respect to lockage loyalty ρ .
Sustainability 12 07026 g007
Figure 8. Changes in optimal profits with respect to price sensitivity β .
Sustainability 12 07026 g008
Figure 9. Changes in optimal prices ( p t * ) and optimal profits ( π t * ) with respect to subsidy η i .
Sustainability 12 07026 g009
Table 1. Parameters and variables.
ParametersDescriptions
α Market potential, α > 0
β Customer’s price sensitivity β [ 0 , 1 ]
ρ The degree of carriers’ loyalty to the lockage mode, ρ [ 0 , 1 ]
η i Unit subsidy offered by the government
e i Unit environmental cost (CO2)
p i Freight rate
q i Demand functions
c i l Unit cost of lockage mode
c i t Unit cost of transshipment mode
π i l Profit function of lockage mode
π i t Profit function of transshipment mode
C S Consumer’ surplus
S W i l Social welfare function of lockage mode
S W i t Social welfare function of transshipment mode
E i l Unit environment cost of lockage mode
E i t Unit environment cost of transshipment mode
Table 2. Variation of different parameters with water–land–water transshipment mode.
Unit Freight Volume
(100 cars/unit)
158
Unit Subsidy
(100 RMB/car)
011.52011.52011.52
Unit Pricing
(100 RMB/car)
1.0190.5450.3080.0712.2541.7801.5431.3073.1802.7072.4702.233
Unit Profit
(10 RMB/car)
−0.287−0.373−0.273−0.0781.7380.6540.256−0.0474.9633.1322.3591.682
Unit Social Welfare
(10 RMB/car) *
0.0980.5810.9741.4680.7370.1670.0340.0163.0171.6581.1300.703
* This value is not from simulation; it is manually derived from Formula (19) in Section 3.4.