Article

Effect of Adding Drinking Water Treatment Sludge on Excess Activated Sludge Digestion Process

1
College of Urban Construction, Nanjing Tech University, Nanjing 211816, China
2
River Basin Research Center, Gifu University, 1-1 Yanagido, Gifu 501-1193, Japan
3
Graduate School of Natural Science and Technology, Gifu University, 1-1 Yanagido, Gifu 501-1193, Japan
4
Graduate School of Engineering, Gifu University, 1-1 Yanagido, Gifu 501-1193, Japan
*
Authors to whom correspondence should be addressed.
Sustainability 2020, 12(17), 6953; https://doi.org/10.3390/su12176953
Submission received: 29 July 2020 / Revised: 18 August 2020 / Accepted: 20 August 2020 / Published: 26 August 2020
(This article belongs to the Collection Waste Utilization and Resource Recovery)

Abstract

:
Drinking water treatment sludge (DWTS) is a waste by-product from water treatment plants where aluminum and iron salts are the most commonly used coagulants. DWTS was reused to investigate the effects of DWTS on the digestion liquid quality and microorganism activity of excess activated sludge (EAS). DWTS with four suspended solid (SS) concentrations (0%, 2%, 5% and 10%) was added to EAS which was sampled during aerobic and anaerobic digestion processes, then batch tests were carried out which followed the coagulation-flocculation process. It was found that DWTS can improve total dissolved nitrogen (TDN) and dissolved phosphorus (DP) removal efficiencies for anaerobic EAS. The highest removal efficiency of TDN (29.97%) as well as DP (55.38%) was observed when DWTS dosage was SS = 10%. The release of dissolved organic matter (DOM) by DWTS could increase dissolved organic carbon (DOC) concentration and lead to the accumulation of non-biodegradable humic acid-like substance in aerobic and anaerobic digestion liquid. The dehydrogenase activity (DHA) values of anaerobic EAS were higher than aerobic EAS. DWTS could reduce DHA for both EAS. These results indicate that potential risk of release of DOM should be considered when reusing DWTS in future research.

1. Introduction

The number of municipal wastewater treatment plants (MWTPs) increased sharply, resulting in the generation of large volumes of excess activated sludge (EAS). The untreated EAS not only contains microorganisms and undigested organic and inorganic components, but also involves considerable concentrations of nitrogen and phosphorus, pathogens and heavy metals [1,2], which can cause serious environmental and human related health problems. In recent years, extensive research has been carried out on the proper treatment and disposal technologies of EAS.
The main methods for treating and disposing EAS around the world are landfill, incineration and composting, as well as aerobic and anaerobic digestion. In order to improve the sludge stabilization and resource and energy recovery, aerobic and anaerobic digestion methods are widely used [3]. Aerobic and anaerobic digestion methods have been applied in 24 and 20 European countries, respectively [4]. In China, aerobic and anaerobic digestion systems are used commonly in MWTPs [5]. However, various problems still remain in aerobic and anaerobic digestion process. During the process of aerobic and anaerobic digestion, the degradation of nitrogenous matter can lead to the production of high concentration of ammonium nitrogen, which affects the activity of microorganisms [3,6,7]. The digestion liquid contains high levels of phosphorus as a result of the decay of bacterial cells [8]. Moreover, the production of large amounts of digestion liquid containing dissolved organic matter (DOM) is of great concern [9]. It has been observed that humic acids contained in EAS could limit the conversion of organic compounds into energy [10,11]. Thus, more studies are still needed to improve the removal efficiency of pollutants generated during EAS digestion.
On the other hand, drinking water treatment sludge (DWTS) is a waste by-product from the drinking water treatment process, which contains high content of aluminum or iron species due to the use of different types of coagulants [12]. Moreover, DWTS is also composed of the colloidal and suspended impurities such as sand, silt, clay and humic particles, which is related to the quality of raw water [13]. Direct discharging of DWTS from a water treatment plant (WTP) is harmful to the environment and human health. From the perspective of sustainable development, the recovery and utilization of DWTS has been investigated in different fields (e.g., building material, support material for the manufacture of compost, adsorbent for phosphorus removal, and coagulant for treating wastewater) and is considered as an effective approach for reducing waste disposal [14,15,16,17]. Therefore, considering that a large amount of sediment DWTS containing coagulant metals was generated in the coagulation-flocculation process, several studies have been conducted on the techniques of coagulant recovery and reuse from DWTS (i.e., alkali treatment, acid treatment, ion exchanging and membranes) [18,19]. Among them, acid treatment seems to be a potential method because of the low cost and high recovered efficiency [20]. Suman et al. (2018) [21] compared the removal pollutants performance of conventional coagulants and acidified water treatment sludge in the treatment of synthetic dairy wastewater, it was found that acidified water treatment sludge performed better on the removal of turbidity, chemical oxygen demand (COD), biochemical oxygen demand (BOD), total suspended solids (TSS) and total dissolved solids (TDS) under the optimum condition. Jung et al. (2016) [12] investigated the application of recovered coagulant from drinking water treatment residuals to treat cotton textile wastewater. Zhang et al. (2019) [22] demonstrated that ferric groundwater treatment residual recovered by acid dissolution could be used as an effective sorbent for vanadium-containing wastewater treatment. However, some problems are needed to be considered in the application of recovering coagulant from DWTS. First, the recovery efficiency of coagulant depends on pH value that should be strictly controlled. In addition, some contaminants in DWTS like DOM and heavy metals could dissolve at low pH [23].
The direct reuse of DWTS as coagulant or adsorbent from water treatment plant has been investigated in recent years [24,25]. It has been demonstrated that DWTS has the capacity to improve removal of contaminants form wastewater. Mazari et al. (2018) [26] investigated the reuse of alum sludge for the removal of the turbidity, UV254 and COD in the secondary effluent from a wastewater treatment plant. Babatunde and Zhao (2010) [27] suggested that phosphate adsorption by waste alum sludge was attributed to amorphous aluminum ions and pores of alum sludge. Previous research has established that DWTS obtained from conventional coagulation process contained flocs with rugged and curved surface [28]. It has been reported that the porous structure of sludge might be improved by using coagulants [29,30]. However, there are few studies on recycling DWTS to treat EAS during aerobic and anaerobic digestion processes. Previous studies have reported that coagulants could promote the release of biopolymers within sewage sludge through charge neutralization and hydrolysis [31]. In addition, some researchers have observed the leakage of natural organic matter in alum sludge reuse [32]. However, Xu et al. (2016) [33] demonstrated that alum sludge from WTP could remove natural organic matter by physical adsorption mechanisms without other additional treatment processes. Therefore, the change of DOM concentration should be carefully monitored during DWTS reuse.
In the present study, six aerobic and six anaerobic digestion reactors were incubated at 25 °C. The EAS samples were obtained at designated time (day0, 3, 6, 11, 18, 27), and then batch tests were carried out to follow the coagulation-flocculation process with the different dosage of DWTS (suspended solid (SS) concentration of 0, 2%, 5% and 10%). In order to determine the effects of DWTS on the EAS aerobic and anaerobic digestion processes, the changes of supernatant and sludge were comprehensively considered. The main issues considered in this paper are: (1) evaluation of the effect of DWTS on the removal of nitrogen and phosphorus in digestion liquid, (2) assessment of the effect of DWTS on DOM produced in the digestion of EAS, and (3) possible mechanism analysis of the impact of DWTS on the dehydrogenase activity (DHA) of EAS.

2. Materials and Methods

2.1. DWTS and EAS Preparation

DWTS in slurry form was obtained from the sedimentation basin of WTP in Gifu, Japan, which uses polyaluminum chloride (PAC) as the coagulant. All the slurry samples were aerated by air pump for 36 h and then stored at 4 °C as stock solution. EAS is the return sludge of MWTP in Gifu, Japan. In this MWTP, the main process of wastewater treatment was anaerobic and aerobic activated sludge process.

2.2. Aerobic and Anaerobic Digestion Experiment

A total of 12,500 mL conical flasks were used as digestion reactors, designated as AeX (X = 1–6) and AnY (Y = 1–6). Each reactor was added 450 mL EAS samples. Ae1–Ae6 were subjected to under aerobic condition, aerated by continuous bubbling of air pump (Power: 2 W, Air flow: 2.0 L/min). An1–An6 were sealed tightly after adding EAS to maintain the anaerobic condition and were shaken gently by reciprocal shaker (NR-10, Taitec, Saitama, Japan). All of the reactors were placed in dark with indoor thermostatic incubation at 25 °C.

2.3. Batch Tests Procedure

EAS samples were respectively collected at different stages of the digestion experiments. 400 mL samples were taken from one of AeX and AnY at one time, divided into 4 equal parts and placed in 100 mL beakers respectively. Then, DWTS with different dosages (SS concentration of 0, 2%, 5% and 10%) were added respectively to carry out batch tests which followed the coagulation-flocculation process. The batch tests were conducted using a magnetic stirring apparatus (Synchro·M·Stirrer, Toyo Seisakusho Co., Ltd., Tokyo, Japan). The coagulation-flocculation procedures were as follows: rapid mixing at 250 rpm for 1 min, slow mixing at 50 rpm for 20 min, and finally the mixture was subjected to settle for 2 h to settle down the flocs and get supernatant easily. The supernatant samples were taken from approximately 1 cm below the liquid surface with a syringe for measuring pH, oxidation-reduction potential (ORP), electrical conductivity (EC) and dissolved oxygen (DO) directly. Total dissolved nitrogen (TDN), dissolved phosphorus (DP), dissolved organic carbon (DOC), ultraviolet absorbance at wavelength of 260 nm (UV260) and fluorescence excitation-emission matrix (EEM) were determined after filtration through 0.2 μm membrane filters (Toyo Roshi Kaisha, Ltd., Tokyo, Japan). The precipitated sludge was sampled to measure pH, total solids (TS), volatile solids (VS), SS, volatile suspended solid (VSS) and DHA.

2.4. Analytical Methods

2.4.1. Chemical and Physical Analysis

The pH, ORP, DO and EC were determined immediately by using a pH meter (HM-21P, Toaok, Kyoto, Janpan), ORP meter (RM-20P, Toaok), DO meter (RM-31P, Toaok) and EC meter (CM-31P-W, DKK-TOA, Tokyo, Japan), respectively. TS and SS were measured by using an oven at 105 °C, VS and VSS were measured by using a muffle furnace at 600 °C. DOC concentrations were obtained by using a TOC analyzer (TOC-Vws, Shimadzu, Kyoto, Japan). UV260, TDN and DP were analyzed using a UV-visible spectrophotometer (UV-2600, Shimadzu, Japan). Specific ultraviolet absorbance (SUVA) values were calculated based on UV260 absorbance divided by DOC concentration. Mineralogy of the DWTS was determined by X-ray diffractometer (Smartlab 3 KW, Rigaku, Tokyo, Japan).

2.4.2. Fluorescence EEM Analysis

Fluorescence EEM measurements were conducted by using a spectrofluorophotometer (RF-5300, Shimadzu, Japan). The wavelengths of excitation (Ex) and emission (Em) were both incrementally increased from 220 nm and 550 nm at sequential 5 nm, and the slits of Ex and Em were 1 nm hand-pass. The Ex and Em calibration for fluorescence spectral properties of the instrument is based on measurement of quinine sulfate (QS) solution (10 μg of QS/L in 0.05 M H2SO4) at Ex/Em = 350 nm/450 nm [34]. All the samples were filtered by 0.2 μm membrane filters to reduce Tyndall scattering [35]. To limit inner filter effect, the samples were diluted with Milli-Q water to reach a final DOC below 2 mg/L [34,36]. Furthermore, Raman and Rayleigh scatter peaks were eliminated by scattering correction technique as reported by Zepp et al. (2004) [35].

2.4.3. PARAFAC Analysis

The PARAFAC analysis, as a three-way method, was performed using Matlab 2012a (Mathworks, Inc., Natick, MA, USA) toolbox (i.e., DOMFluorv1_7) in order to characterize the change of dissolved organic matter fluorescence by decomposing EEM data into individual fluorescent components. PARAFAC decomposes the data matrix into a set of trilinear terms and a residual array according to the following function [37].
x ijk   =   f = 1 F a if   b jf   c kf   +   e ijk
where i = 1, …, I; j = 1, …, J; and k = 1, …, K.
The number of different fluorescent components was identified by split-half analysis and analysis of residuals and loadings and the concentration of the components was determined by the Fmax which is the fluorescence at the Ex and Em maximum [38,39].

2.4.4. Fluorescence Regional Integration Analysis (FRI) Analysis

In the FRI analysis, EEM spectra were divided into five excitation-emission regions (regions I–V), and EEM peaks at the different Ex/Em wavelengths were related to various organic compounds [36,40,41]. The volume (Φi) beneath region “i” and percent fluorescence response parameters were calculated according to following expressions:
Φi = ∑exemI (λex λem) ∆λex∆λem
P i,n   =   Φ i,n / Φ T,n   ×   100 %   =   ( MF i   Φ i ) / ( i = 1 5 Φ i,n )
where ∆λex and ∆λem are Ex and Em wavelength intervals, respectively (both taken as 5 nm); I (λexλem) is the fluorescence intensity at each Ex/Em wavelength pair; Φi,n and ΦT,n are the Ex/Em area volumes of region i and all five regions, respectively; and MFi is a multiplication factor for each region.

2.4.5. Determination of Triphenyl-Tetrazolium Chloride (TTC)-Dehydrogenase Activity (DHA) Test

Once the precipitated sludge sample was extracted, 1 mL sludge sample was added into a 15 mL centrifuge tube, followed by adding 2.5 mL of Tris-HCl buffer solution, 0.5 mL of standard TTC and 0.5 mL Na2SO3. Then, the mixture were shaken gently and incubated in the dark for 30 min using a water bath shaker at a temperature of 37 ± 1 °C. In order to inhibit the enzyme reaction, 0.5 mL formaldehyde solution was added into the each blank control sample after incubation for 5 min. After 30 min, 0.5 mL formaldehyde solution was added to the remaining samples respectively and mixed uniformly. The samples were centrifuged at 4000 r/min (centrifugation force: 2147× g) for 5 min, removing the supernatant and adding 5 mL acetone. Then, the mixture was shaken at 37 ± 1 °C for 10 min and centrifuged at 4000 r/min (centrifugation force: 2147× g) for 5 min to obtain the supernatant. The UV absorbance of the supernatant was obtained using a UV-visible spectrophotometer at the wavelength of 485 nm.

3. Results and Discussion

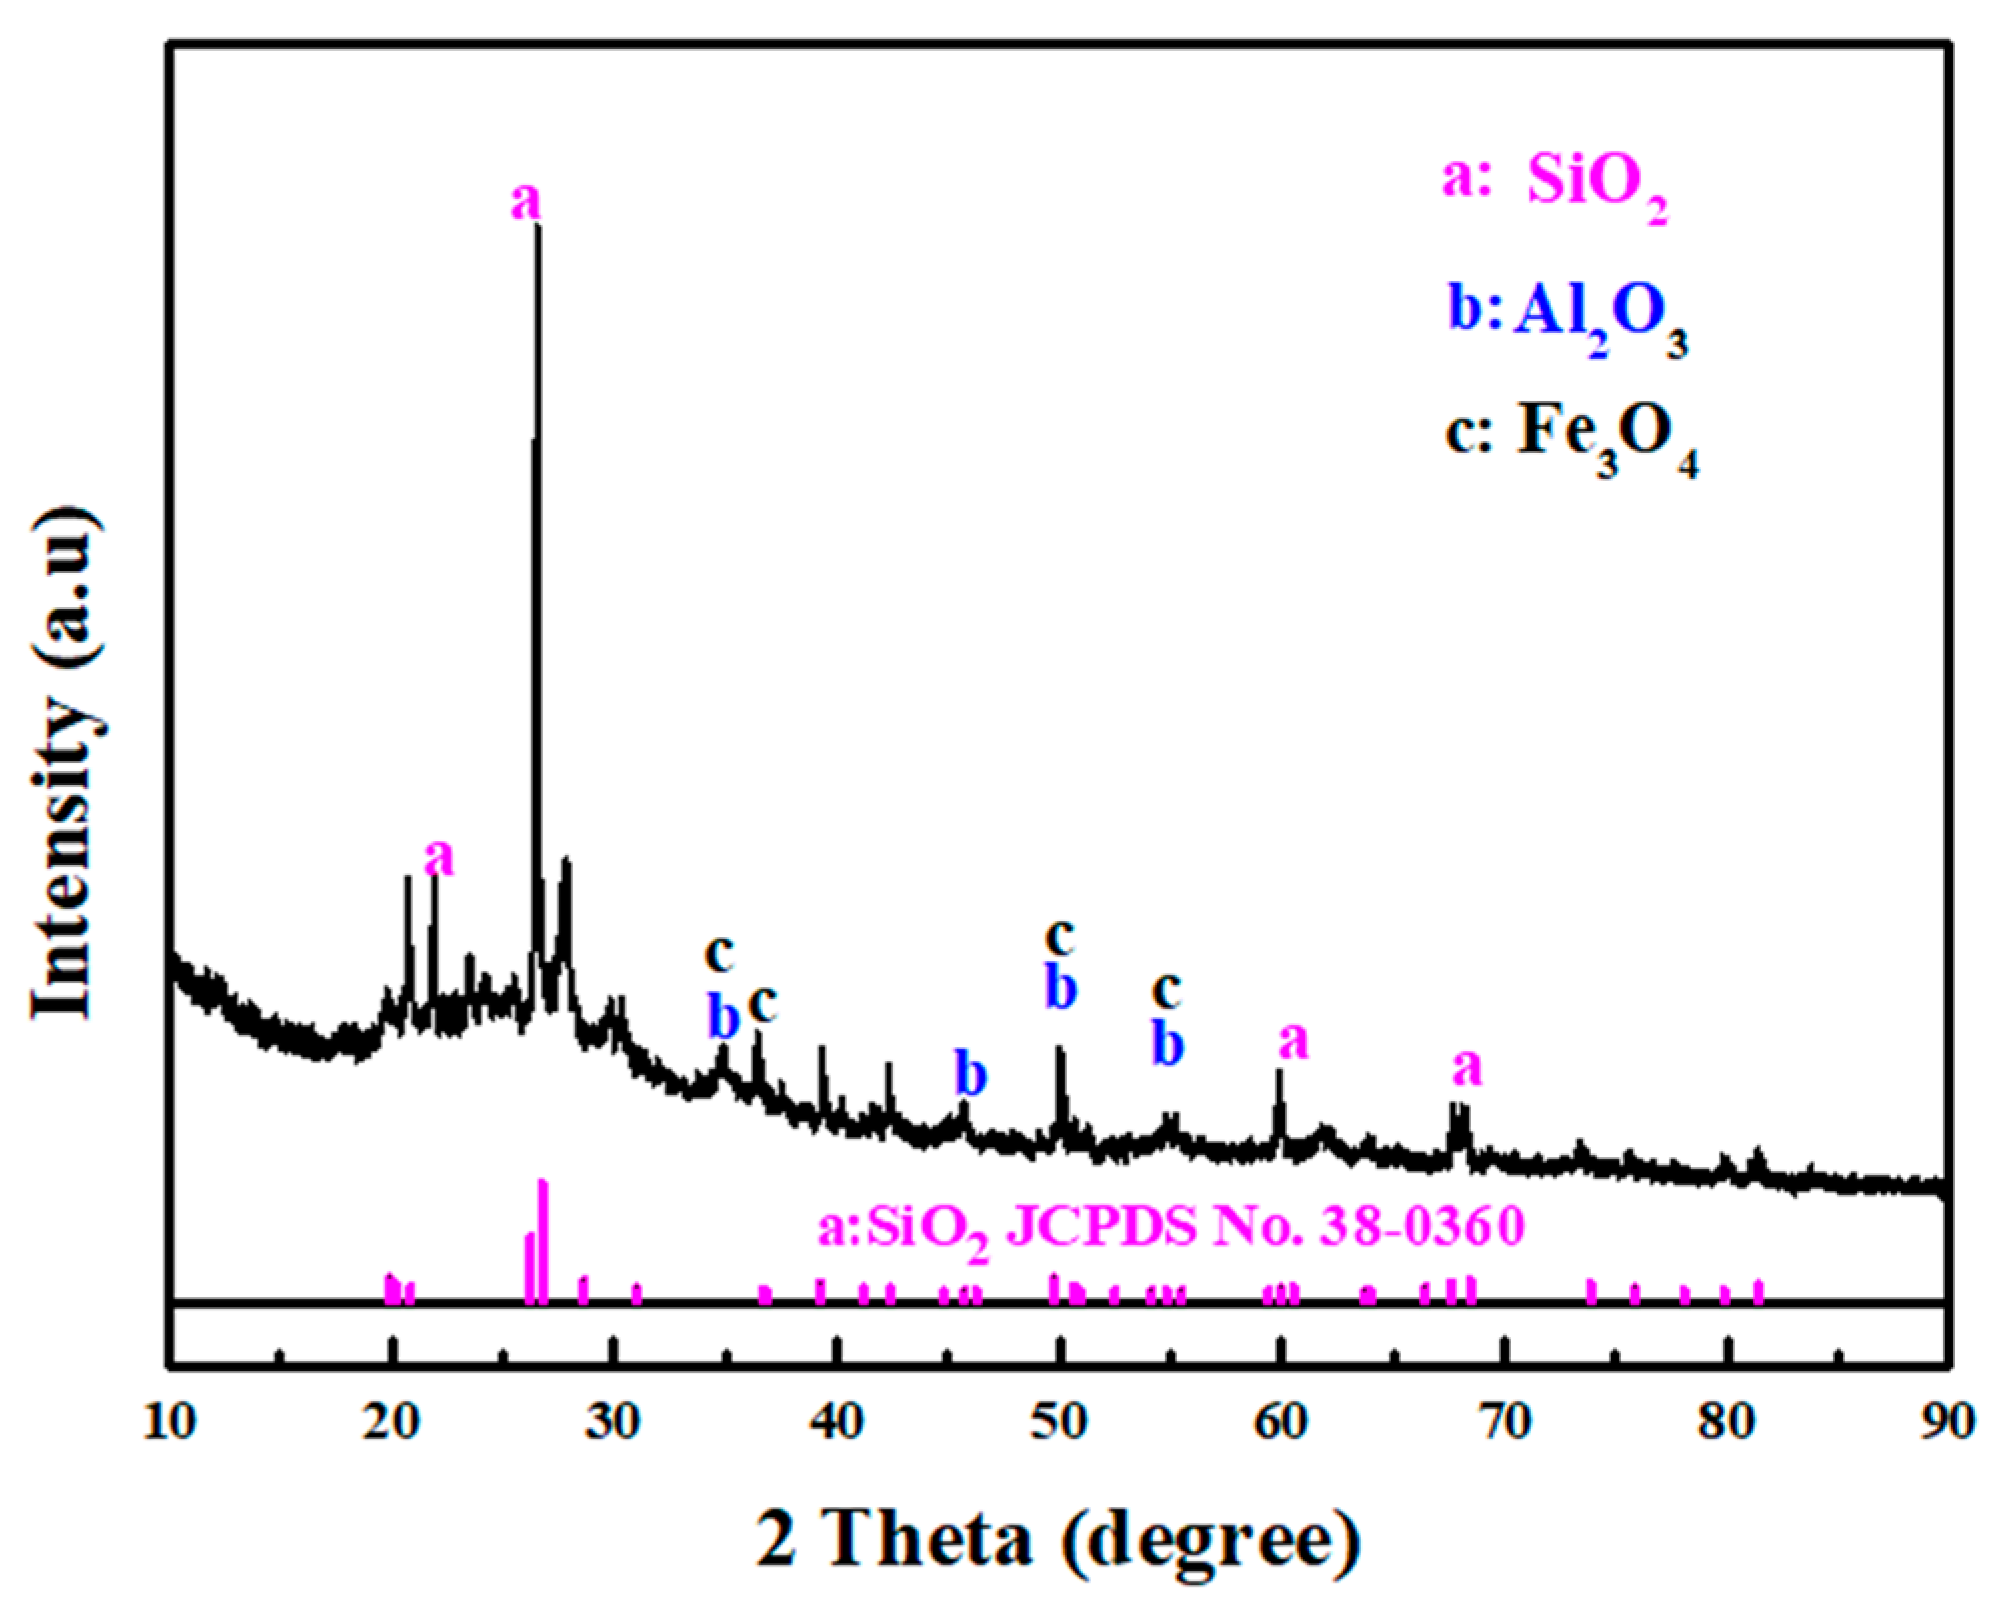
3.1. Characteristics of DWTS and EAS

The measured parameter values of DWTS were: pH 6.80, DO 2.32 mg/L, EC 7.34 mS/m, ORP 167.4 mV, SS 42.66 g/L, VSS 6.58 g/L, TDN 13.53 mg/L, DP 4.30 mg/L, DOC 6.5 mg/L and UV260 10.91 m−1. For initial EAS, the measured parameter were: pH 6.22, DO 0.58 mg/L, EC 60.6 mS/m, ORP−171.7 mV, TS 11.37 g/L, vs. 8.34 g/L, SS 10.42 g/L, VSS 7.98 g/L, TDN 16.18 mg/L, DP 354.87 mg/L, DOC 14.4 mg/L and UV260 71.6 m−1. A high DO value of DWTS was associated with being aerated for 36 h. The aim of aeration is to accelerate the microbial consumption [42], strengthen the degradation of the organic matter in DWTS and reduce the impact of organic matter on batch tests. The EAS contained high content of EC, TDN, DP, DOC and UV260 which also indicates that the content of organic pollutants in EAS was higher than those of DWTS. X-ray diffraction analysis result of DWTS is shown in Figure 1, indicating that the inorganic components are mainly composed of silicon dioxide [43,44]. Meanwhile, crystalline phase of Al2O3 and Fe3O4 were detected in the low intensity peaks.

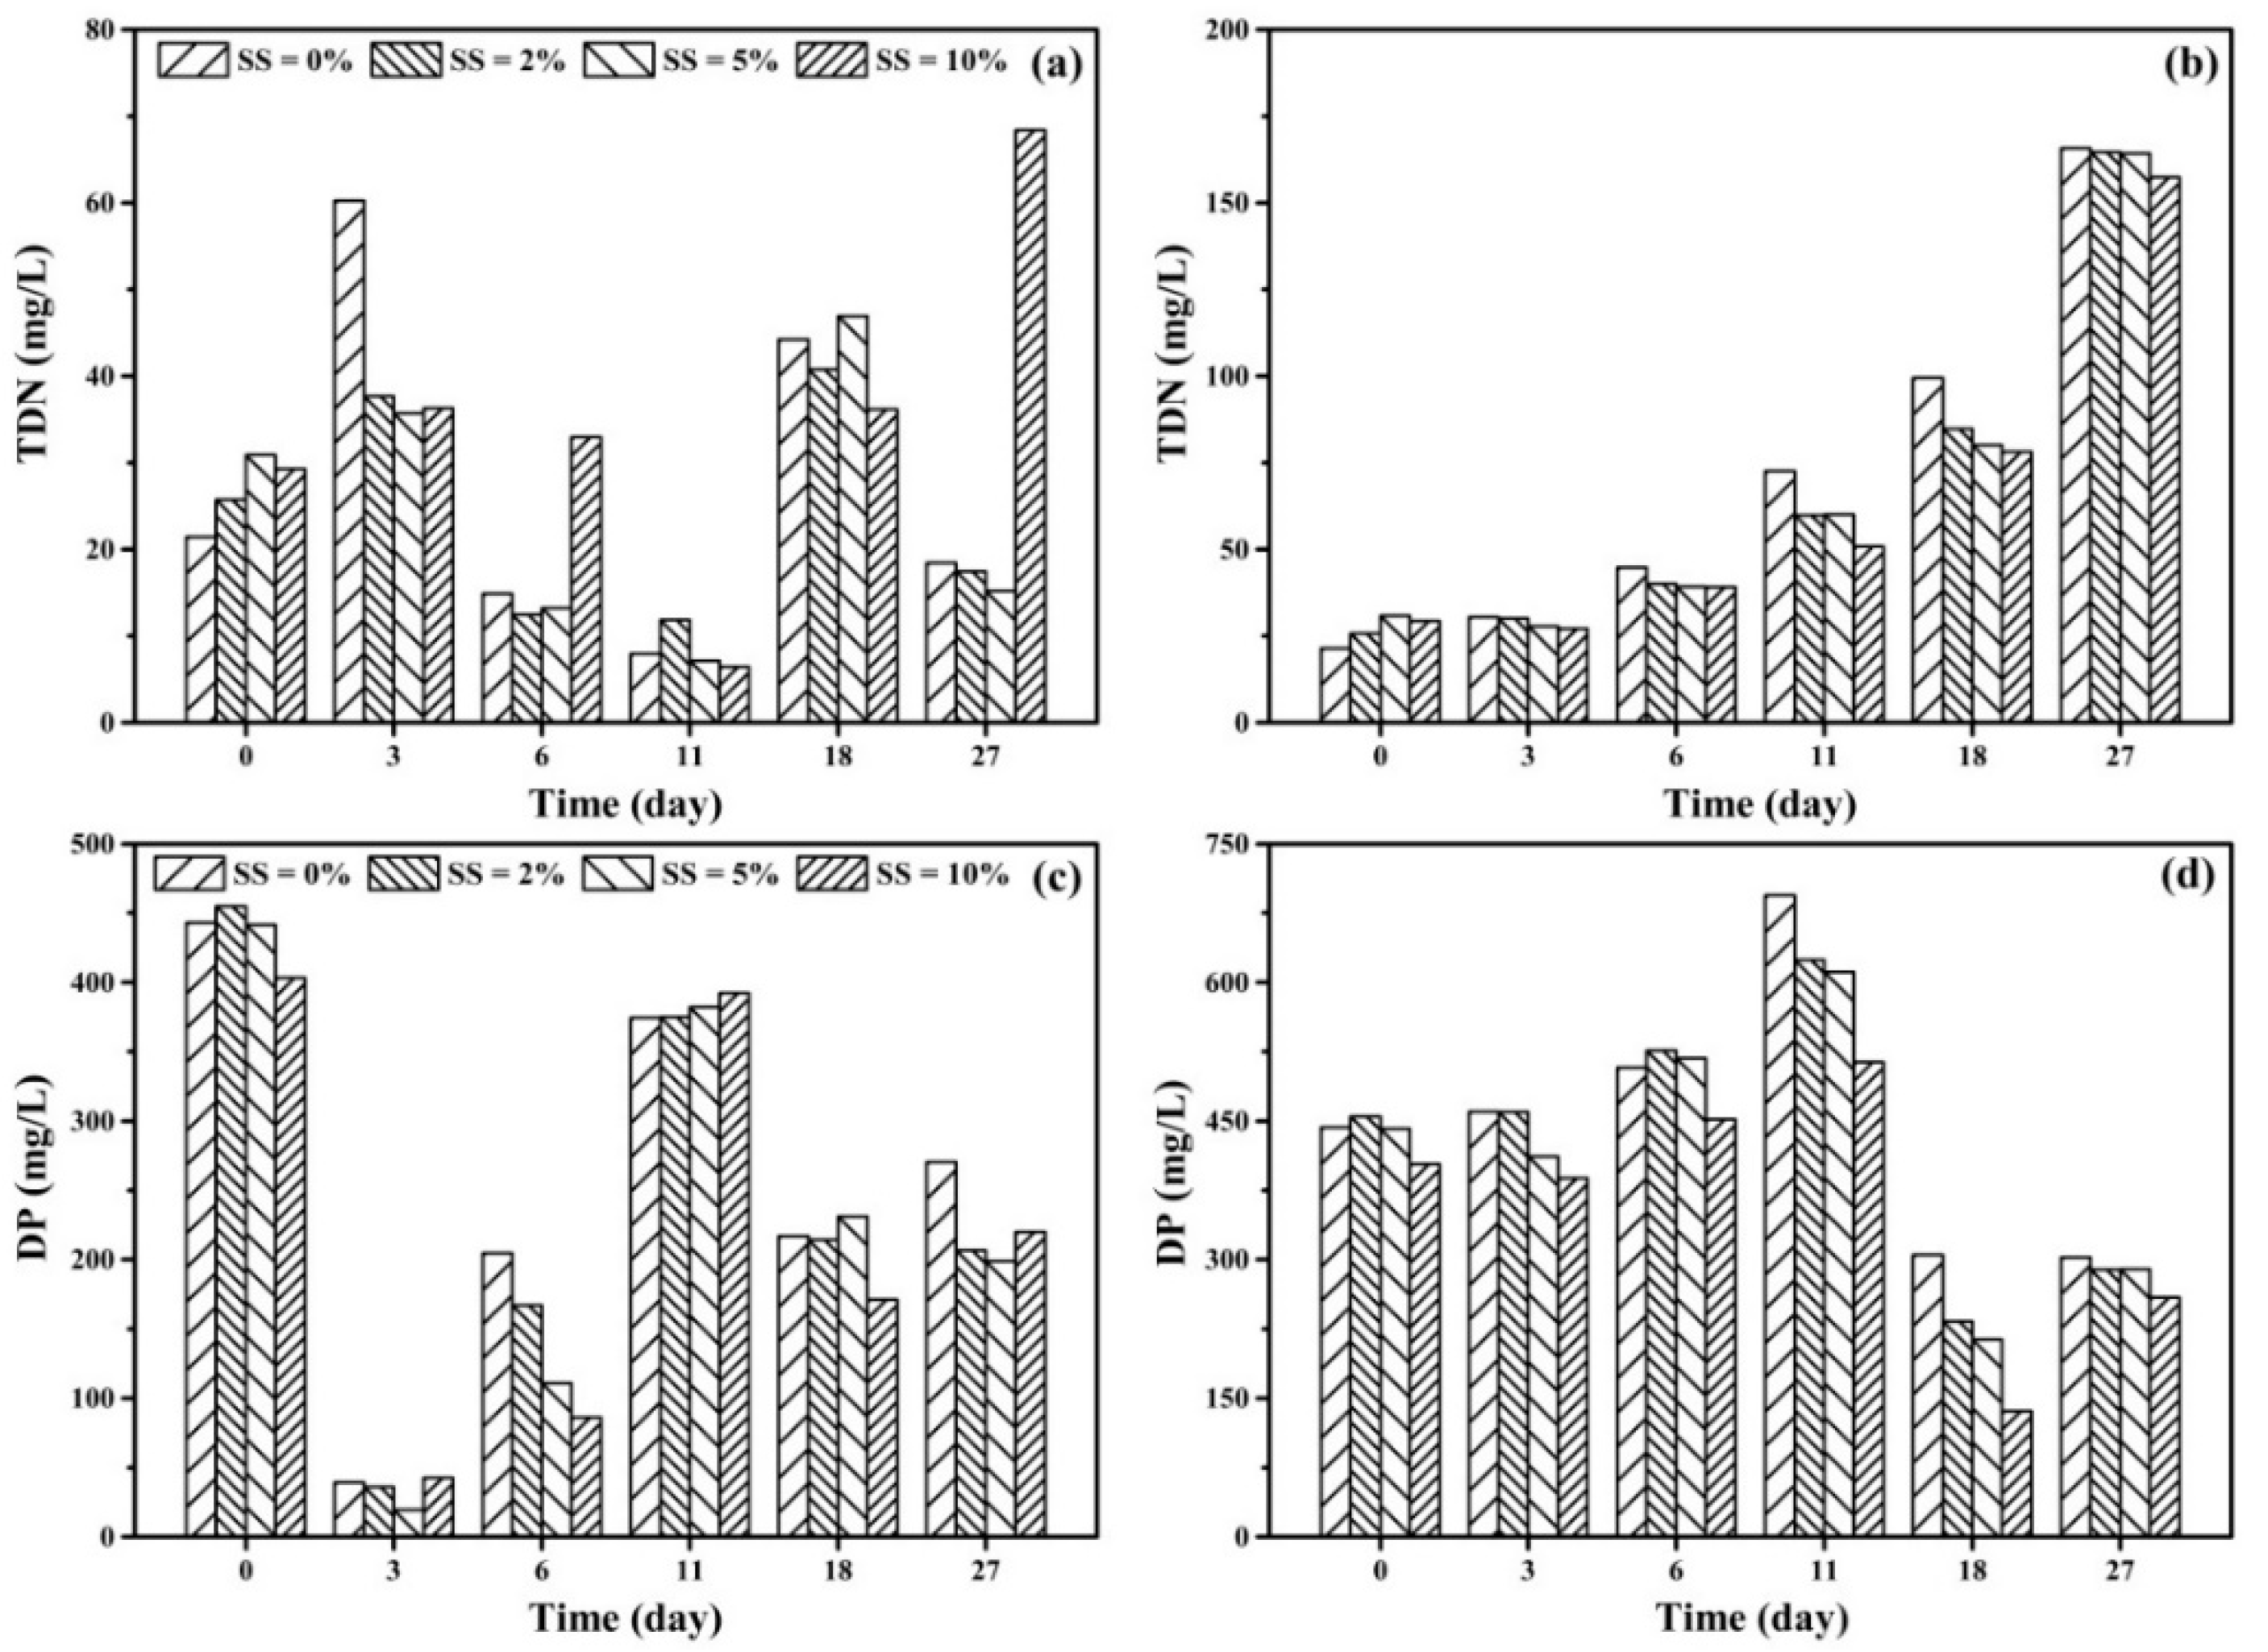
3.2. Effect of DWTS on the Removal of Nitrogen and Phosphorus

N and P are necessary to maintain bacterial growth and biodegradation. The TDN and DP concentrations at different DWTS dosages are shown in Figure 2. For aerobic EAS, there was no obvious evidence that adding DWTS can promote the removal of TDN in the supernatant, as could be seen from Figure 2a. On the contrary, the addition of DWTS may release a certain amount of nitrogen. As shown in Figure 2b, there has been a marked increase in the TDN concentration during the anaerobic digestion. It seems possible that this result could be attributed to microbial cells lysis, releasing intracellular nutrients [45,46]. For anaerobic EAS, TDN removal efficiency increased gradually with the increase in the dosage of DWTS. When DWTS was dosed at SS concentration of 10%, the highest TDN removal efficiency was increased to 29.97% on day 11. These results may be due to the adsorption of dissolved organic nitrogen on amorphous aluminum hydroxide precipitate and charge neutralization at nearly neutral pH values [47]. The pH changes of supernatant after adding DWTS are displayed in the Table 1. As analyzed in Table 1, DWTS can slightly neutralize the acidic conditions of aerobic and anaerobic supernatant. According to Figure 2, it was found that TDN concentration in aerobic digestion liquid was lower than that in anaerobic digestion liquid, and this observation could be associated with microbial metabolism and nitrogen volatilization which may be caused by aeration under aerobic condition.
As shown in Figure 2c, without the addition of DWTS, DP concentration decreased significantly at the initial stage of aerobic digestion, and then increased to 374.61 mg/L at day 11. The decrease was caused by adsorption of polyphosphate accumulating organism (PAO). The increases can be explained by releasing intracellular nutrients with the process of aerobic digestion. No significant correlation was found between DWTS dosage and the change of DP concentration. The reason may be related to the complex combination of interaction and adsorption between the DWTS particles and aerobic sludge. In the process of anaerobic digestion, Figure 2d illustrates the changes of DP concentration at different DWTS dosages. When DWTS was dosed at 0, DP concentration increased continuously to a maximum of 694 mg/L at day 11 and then decreased to 302 mg/L. The increase of DP content was mainly released by PAO in the sludge hydrolysate. The decrease was related to the hydrolysis of polyphosphate after microbial cells lysis. It is observed that the increase of DWTS dosage could lead to the increase of DP removal efficiency in anaerobic digestion liquid. The maximum removal efficiency of DP was 55.38% on day 18, when the addition of DWTS was 10% of SS concentration. The removal of DP is due to the precipitation of metal phosphates, which is related to the residual metal in DWTS and the adsorption of phosphate ions to the solid in suspension [27,48,49].

3.3. Variations of DOM Content and Composition

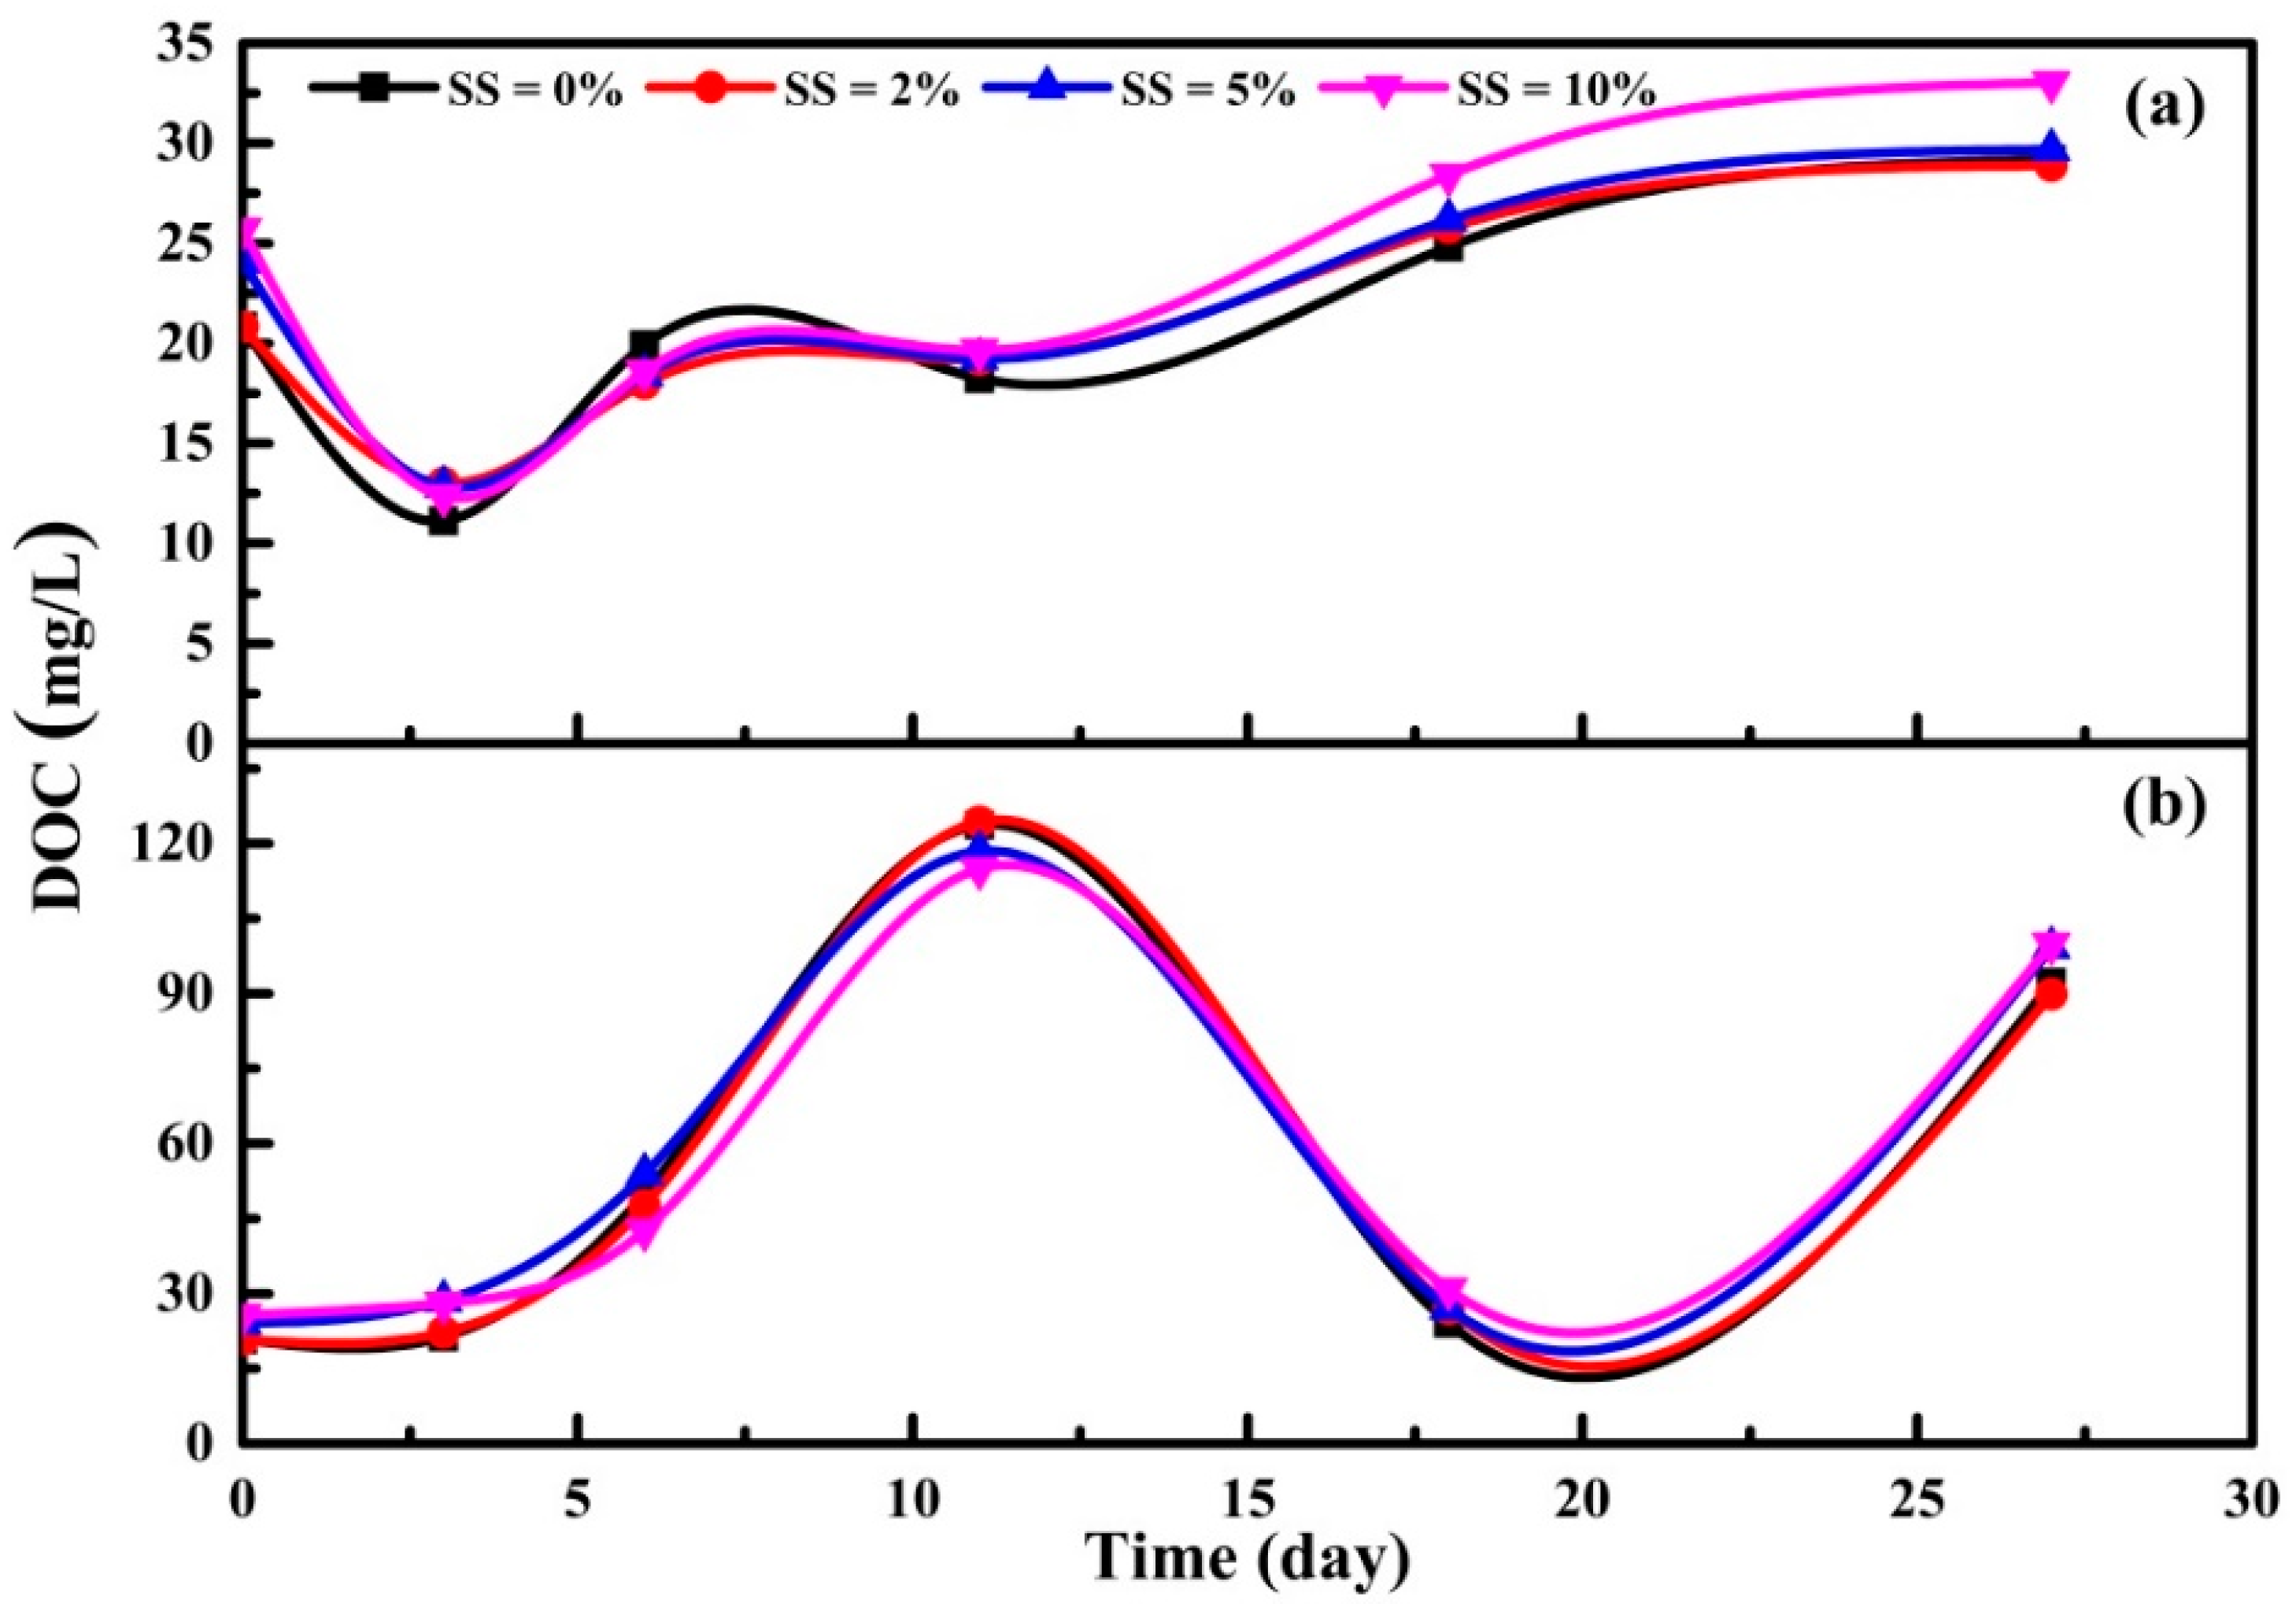
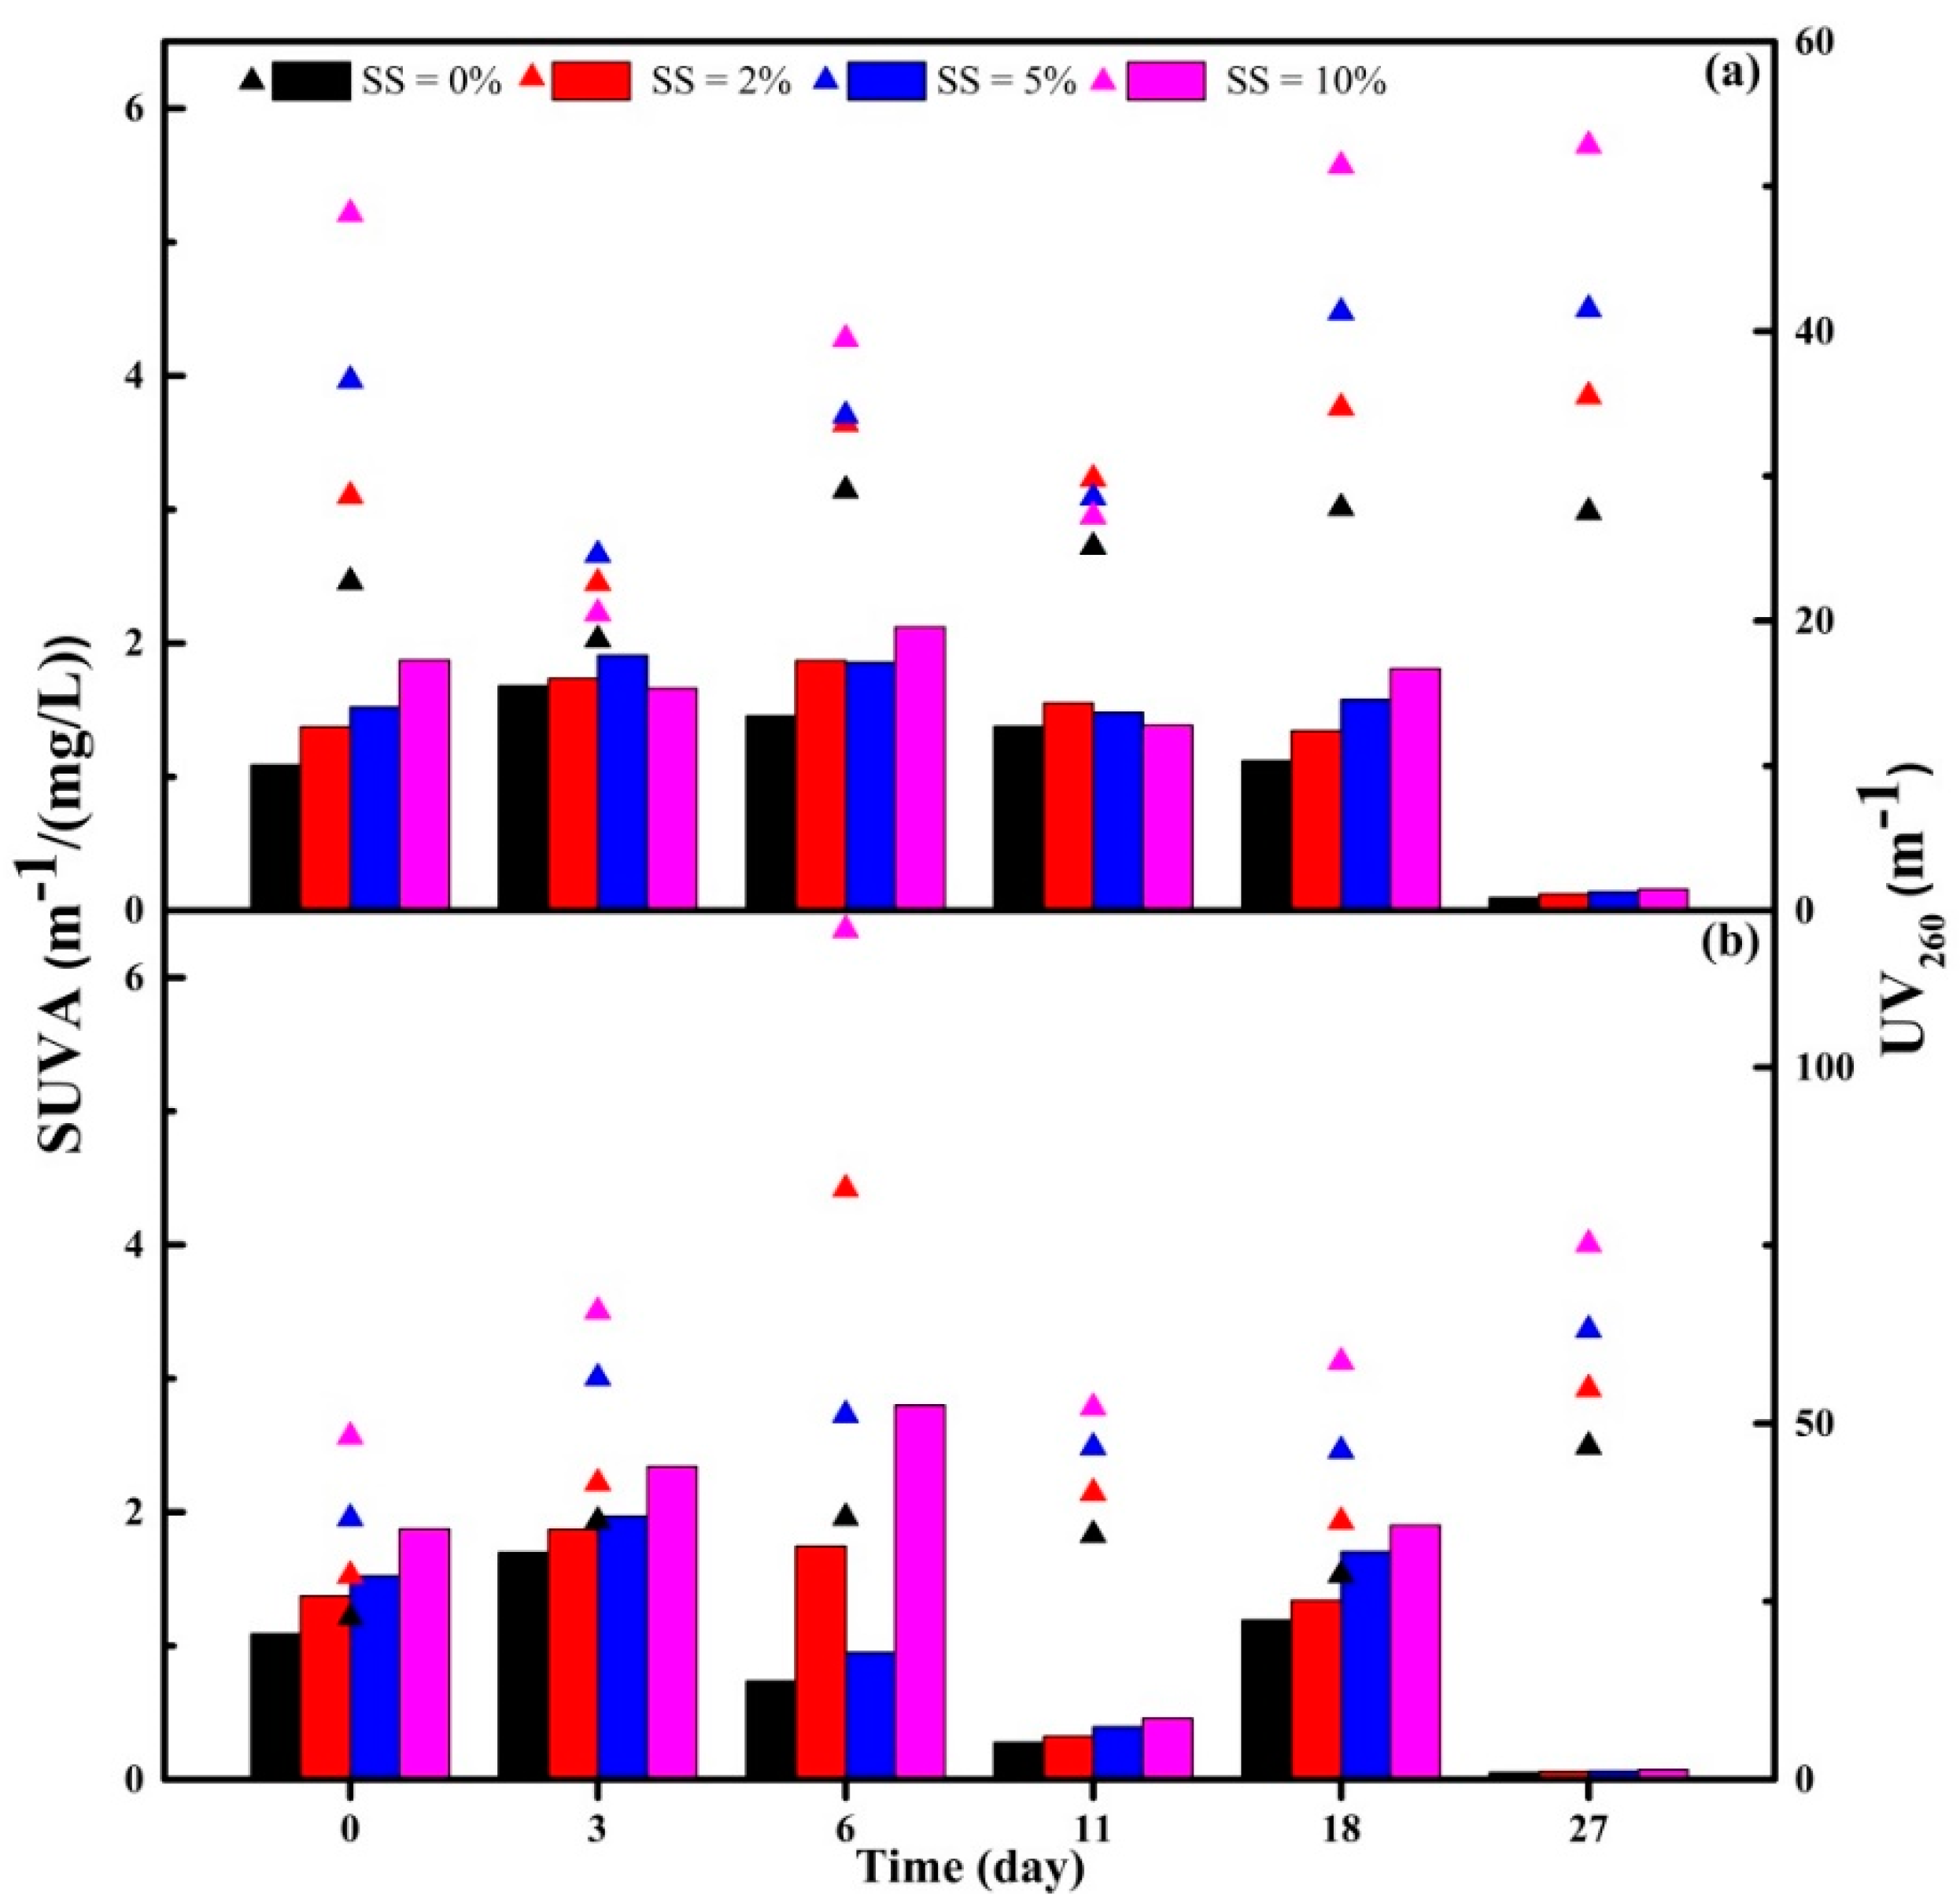
3.3.1. DOC, UV260 and SUVA Indexes of Supernatant

The changing trends of DOC, UV260 and SUVA over the total digestion time were recorded for 27 days.
The content of DOC in the supernatant is shown in Figure 3. EAS produced a larger amount of DOC under anaerobic condition than under aerobic condition. Overall, following the addition of DWTS, there was no obvious influence on the reduction of DOC for both aerobic and anaerobic EAS. However, the high dosage of DWTS tended to increase DOC in aerobic digestion liquid. It can be concluded that adding DWTS into a low DOC concentration of EAS, the remaining coagulant in DWTS had less effect on DOC removal, and DOM fractions which released from DWTS would increase the concentration of DOC during the batch tests. In a previous study, TOC concentration would increase with the increase of phosphate concentration in solution, which was due to the competitive effect of phosphate for surface sites with the humic substances [50].
The UV260 and SUVA values are illustrated in Figure 4. During the digestion process, the SUVA values of aerobic EAS were higher than those of anaerobic EAS, which has demonstrated in the previous study [9]. The UV260 and SUVA increased when the dosage of DWTS increased obviously. It indicated the addition of DWTS has a negative effect on DOM removal of supernatant. Except on day 6 of aerobic and anaerobic conditions and day 3 of anaerobic condition, when DWTS dosage was SS = 10%, the rest of SUVA values were all lower than 2 m−1/(mg/L). This suggests that the DOM composition of supernatant is mostly composed of non-humics, low hydrophobicity and low molar mass compounds with or without adding DWTS [51]. These results also seem to be consistent with the previous research, which found the removal efficiencies of DOC was poor by coagulation when SUVA is lower than 2 [52].

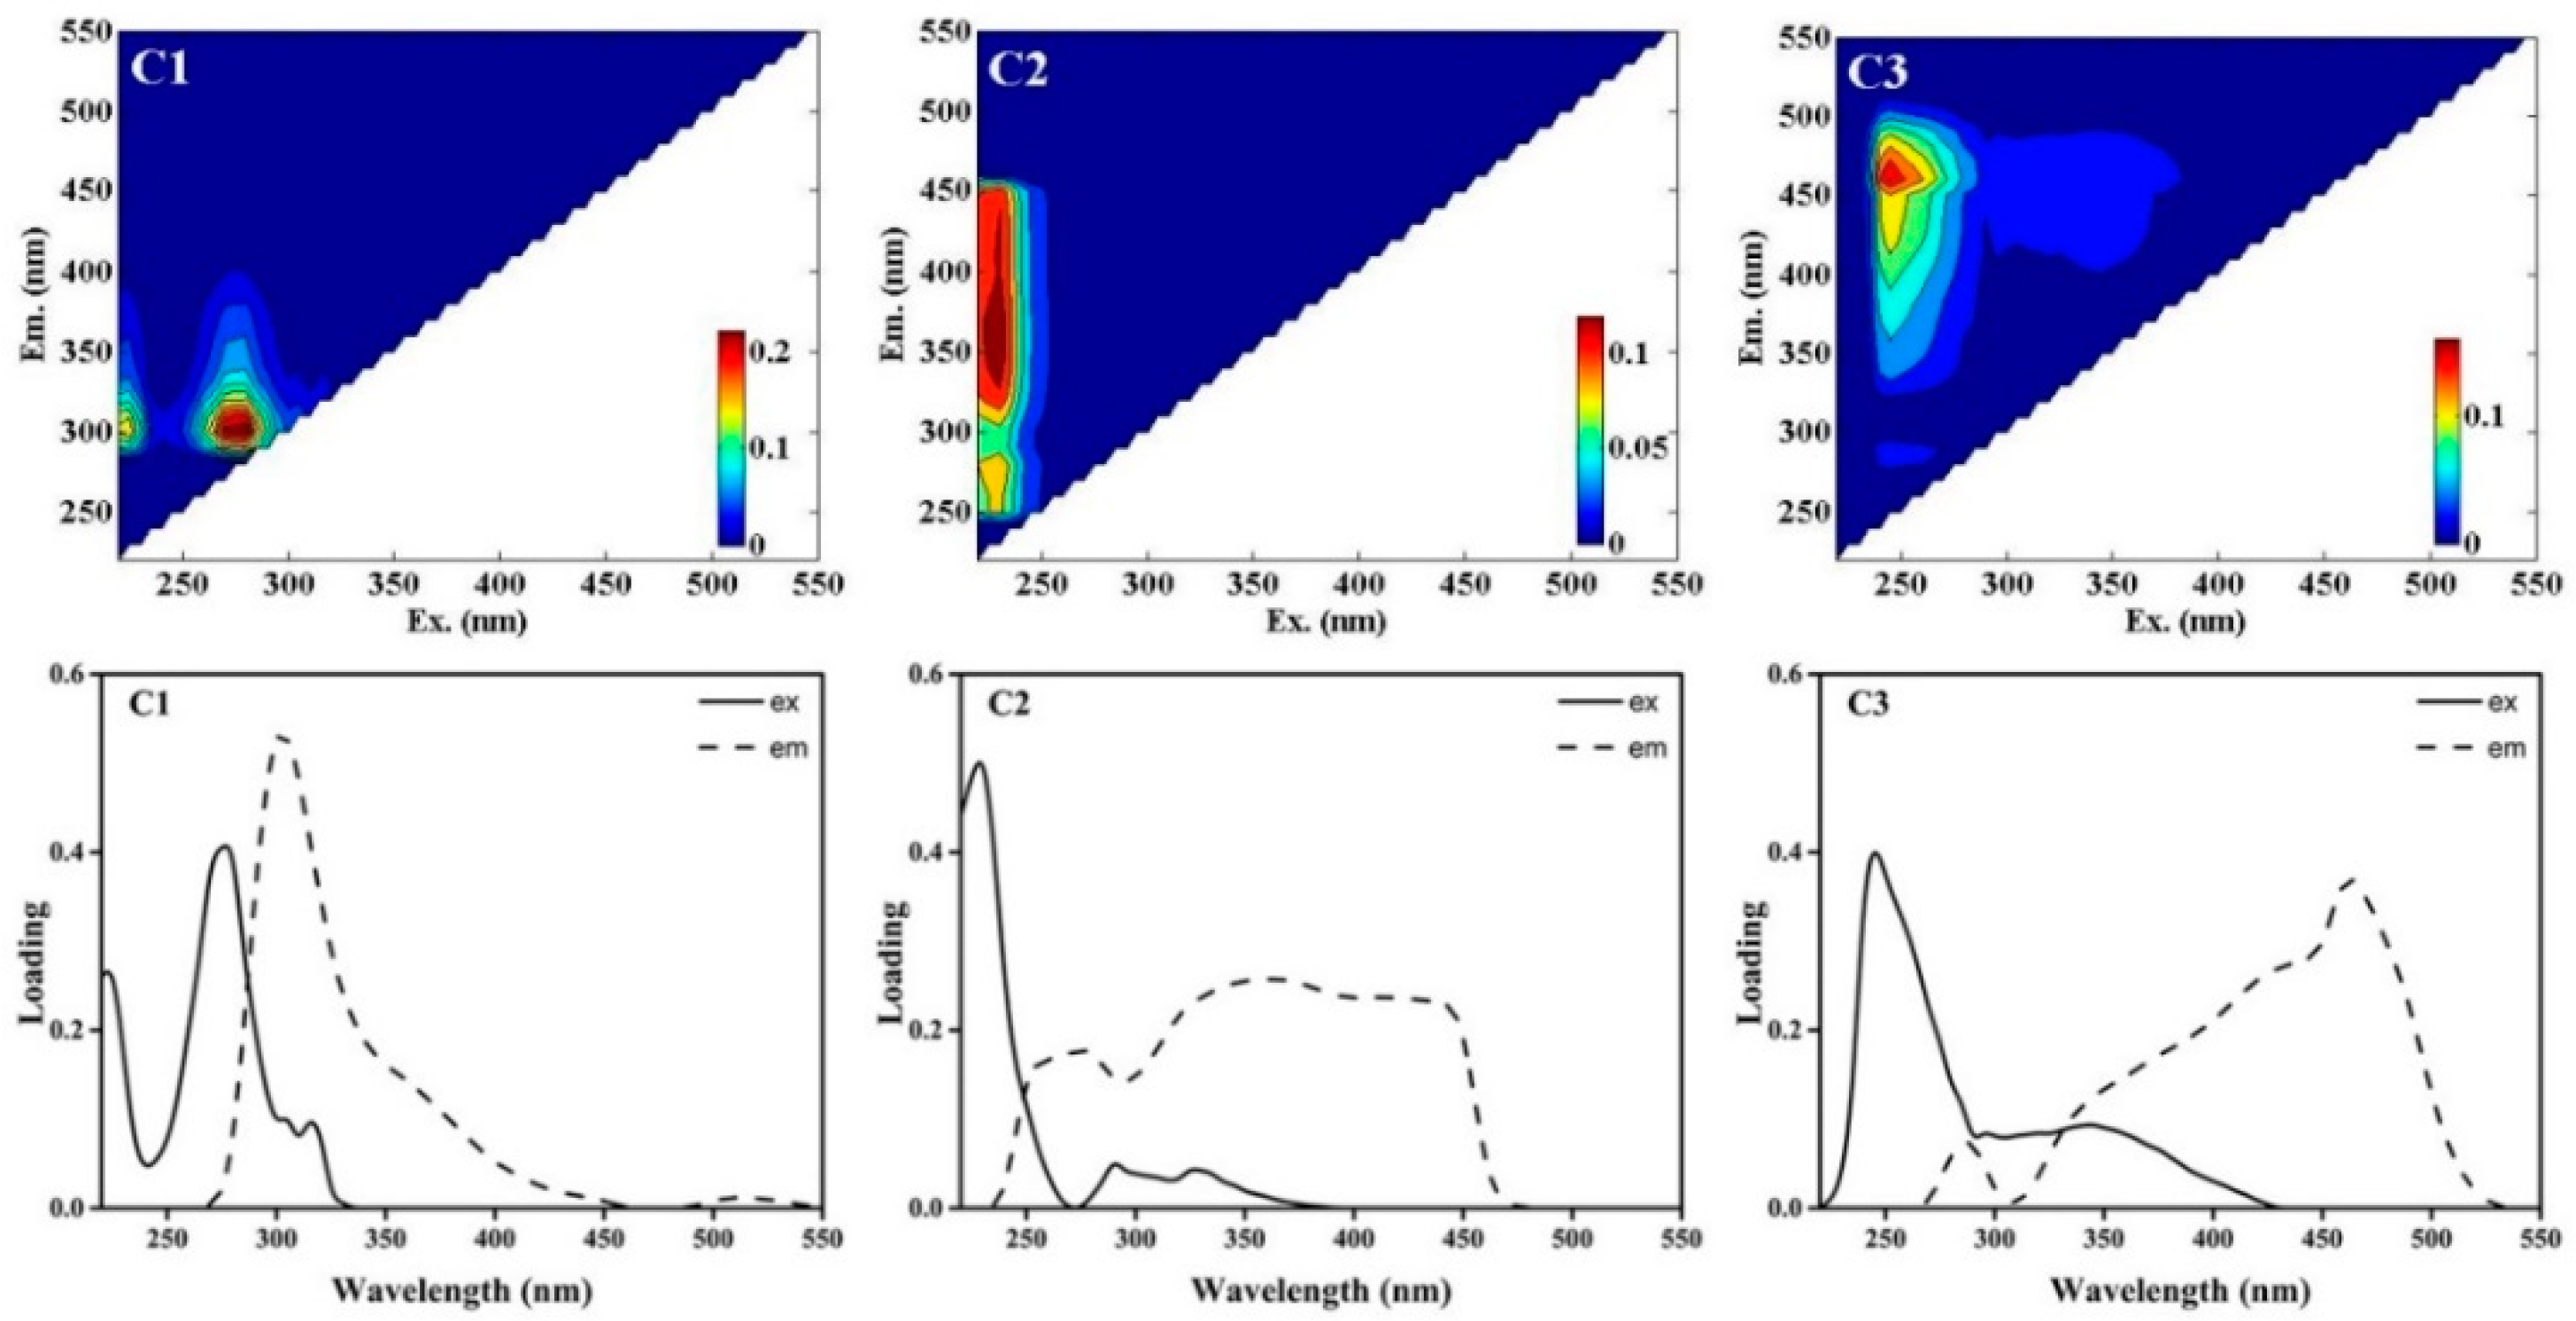
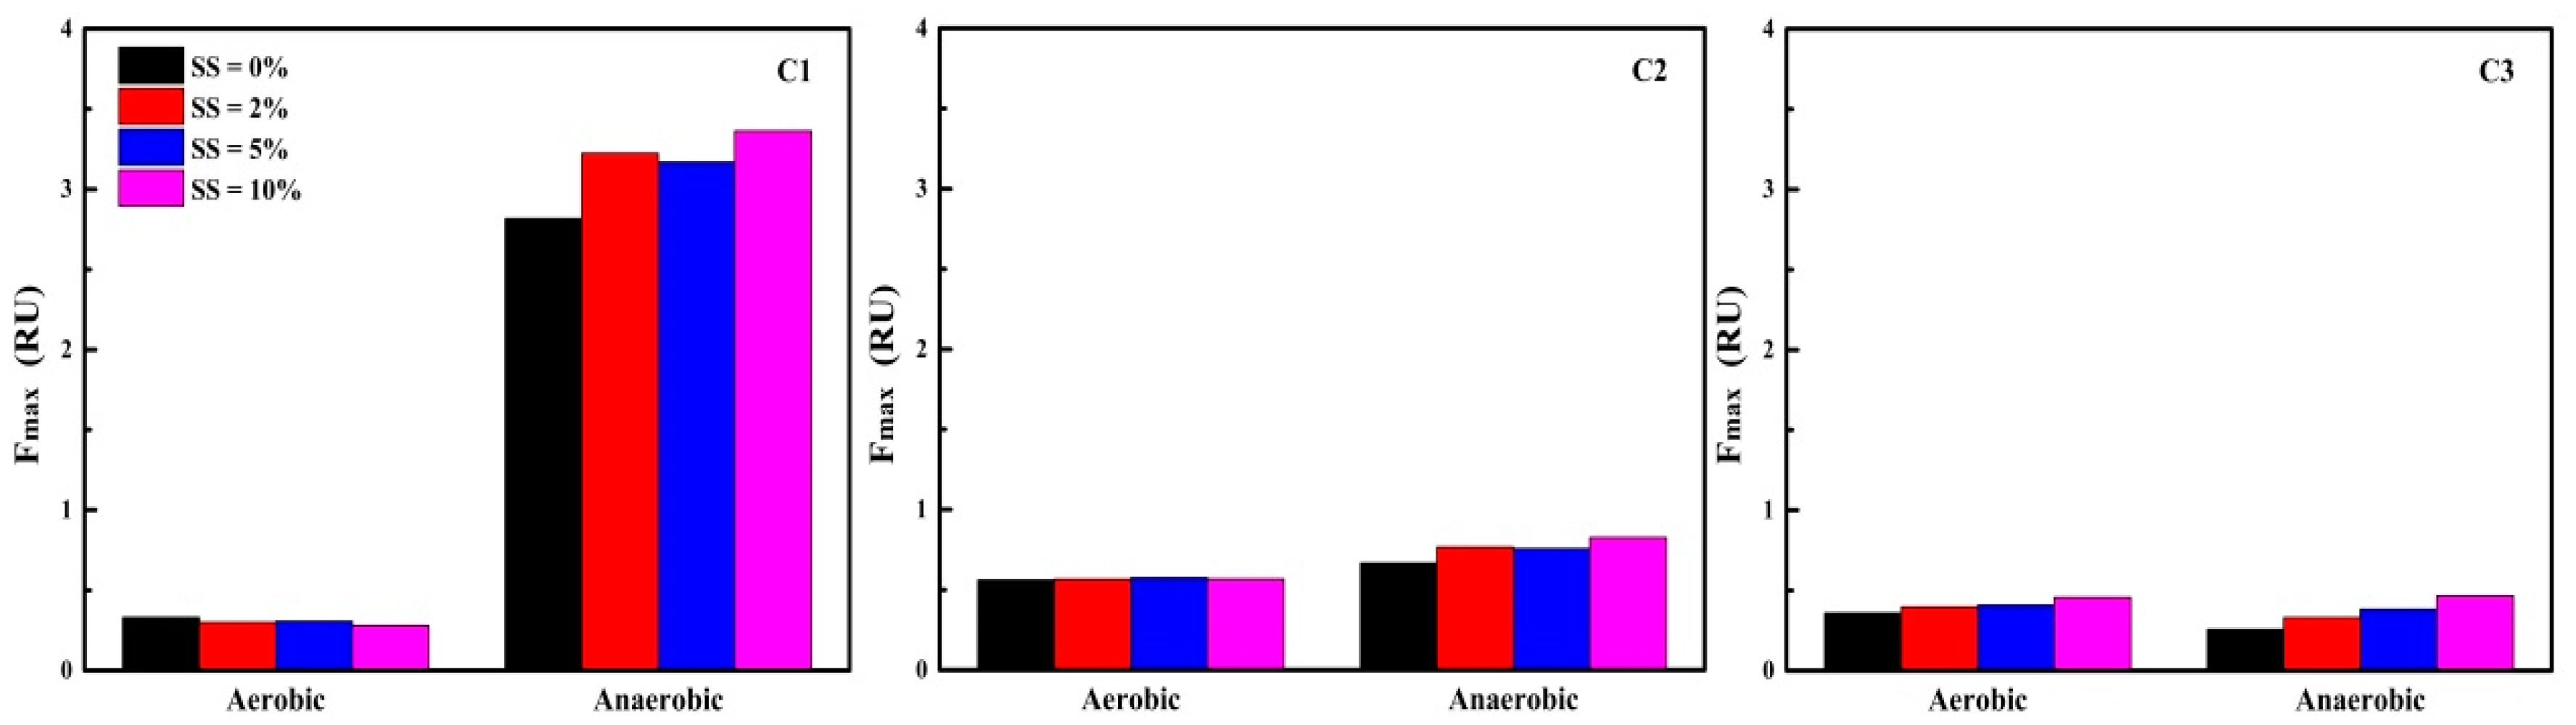
3.3.2. PARAFAC Component Characteristics

Three fluorescence components were extracted by PARAFAC analysis which is based on 44 supernatant samples. Figure 5 shows the contour plots and spectral loadings of three fluorescence components. Component 1 (C1) had two peaks: one peak is centered at the maximum Ex/Em wavelength pair of 225 nm/300 nm and the other at 275 nm/300 nm, which is related to protein-tyrosine-like [53]. Component 2 (C2) had a primary fluorescence peak at Ex/Em 230 nm/280 nm, which had fluorescence properties similar to protein-tyrosine-like [54], and a secondary peak at Ex/Em 230 nm/380 nm which is classified to fulvic-like [55]. The maximum Ex/Em wavelength pairs of the two peaks in component 3 (C3) are at 245 nm/460 nm and 335 nm/460 nm, respectively. C3 resembled fulvic-like and humic-like components [56].
PARAFAC analysis can describe the distribution of three components in the samples by using Fmax to represent fluorescence [57]. Fmax values of the three components in the supernatant samples at the end of digestion for 27 days are shown in Figure 6. After adding different dosage of DWTS, there was no obvious change in Fmax values of C2 for aerobic EAS. However, C1 was reduced slightly and C3 gradually increased when the dosage of DWTS was increased. For anaerobic EAS, Fmax values of C1 displayed an increasing trend with the increase of DWTS addition amount; C2 and C3 also exhibited a similar trend. This indicated that organic pollutants were continuously released in anaerobic digestion liquid. Meanwhile, the Fmax values of C1 in anaerobic digestion liquid were higher than that in aerobic digestion liquid. This suggests that protein-tyrosine-like substances are the major components in anaerobic supernatant samples.

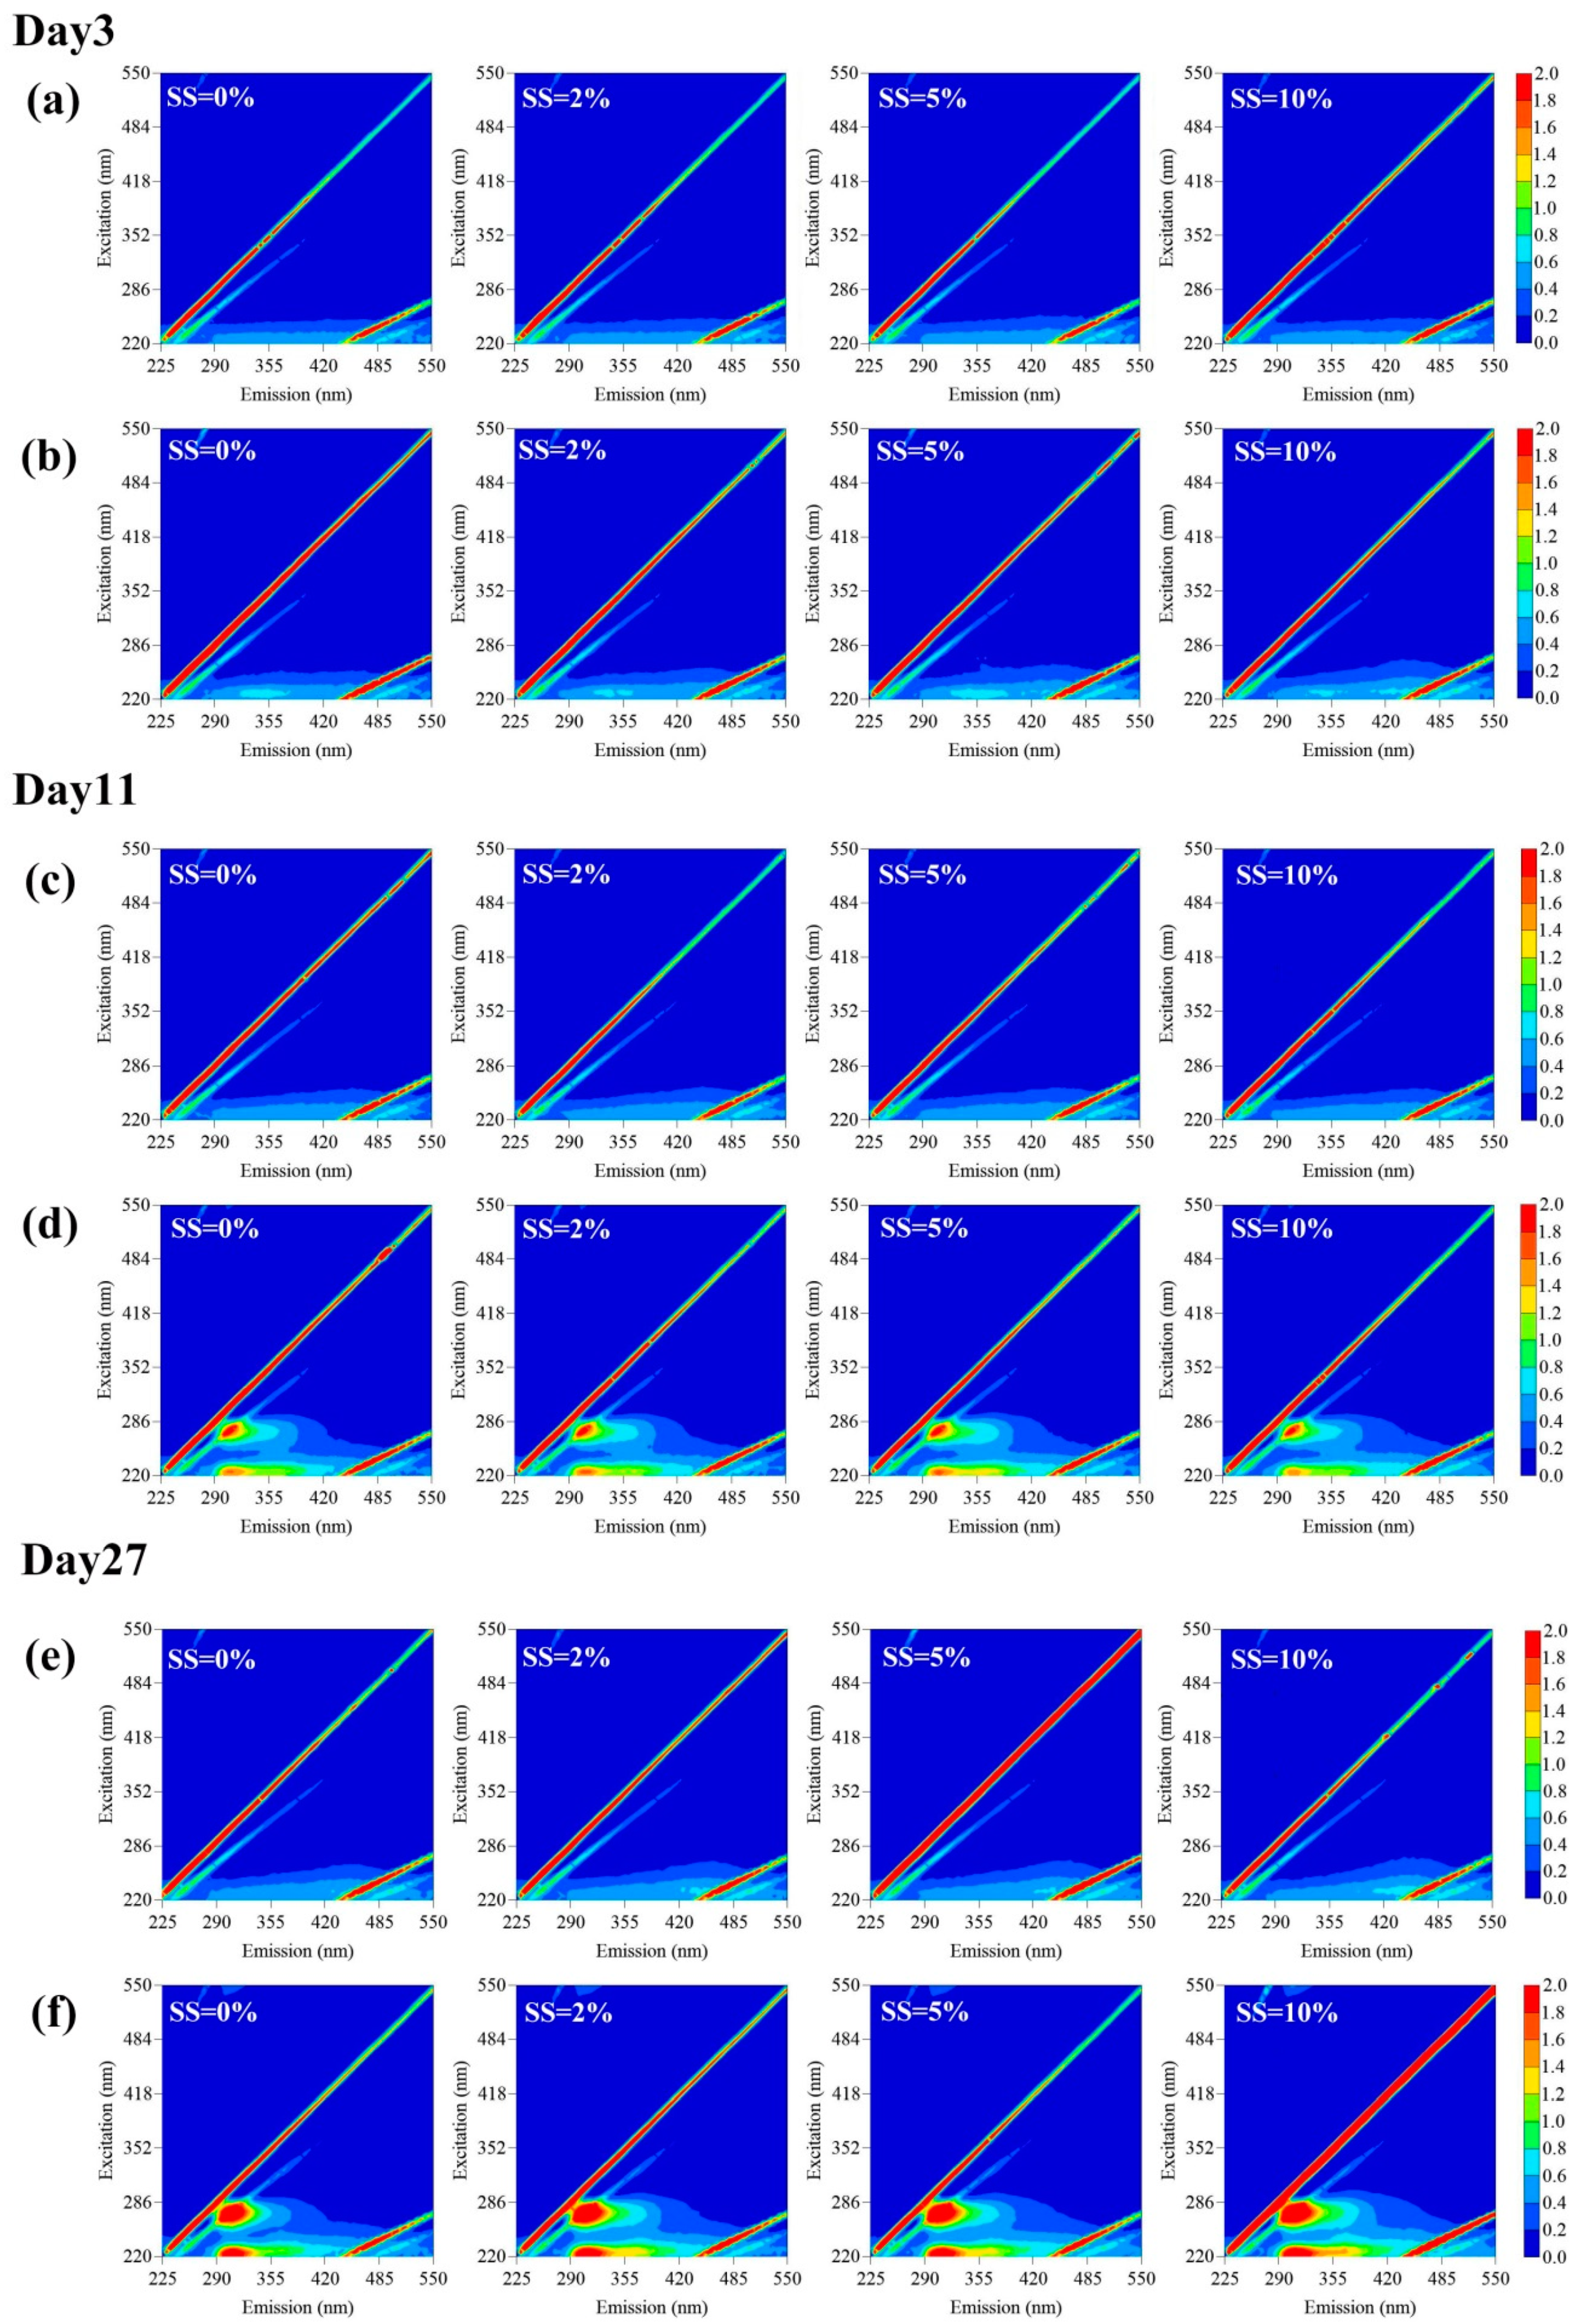
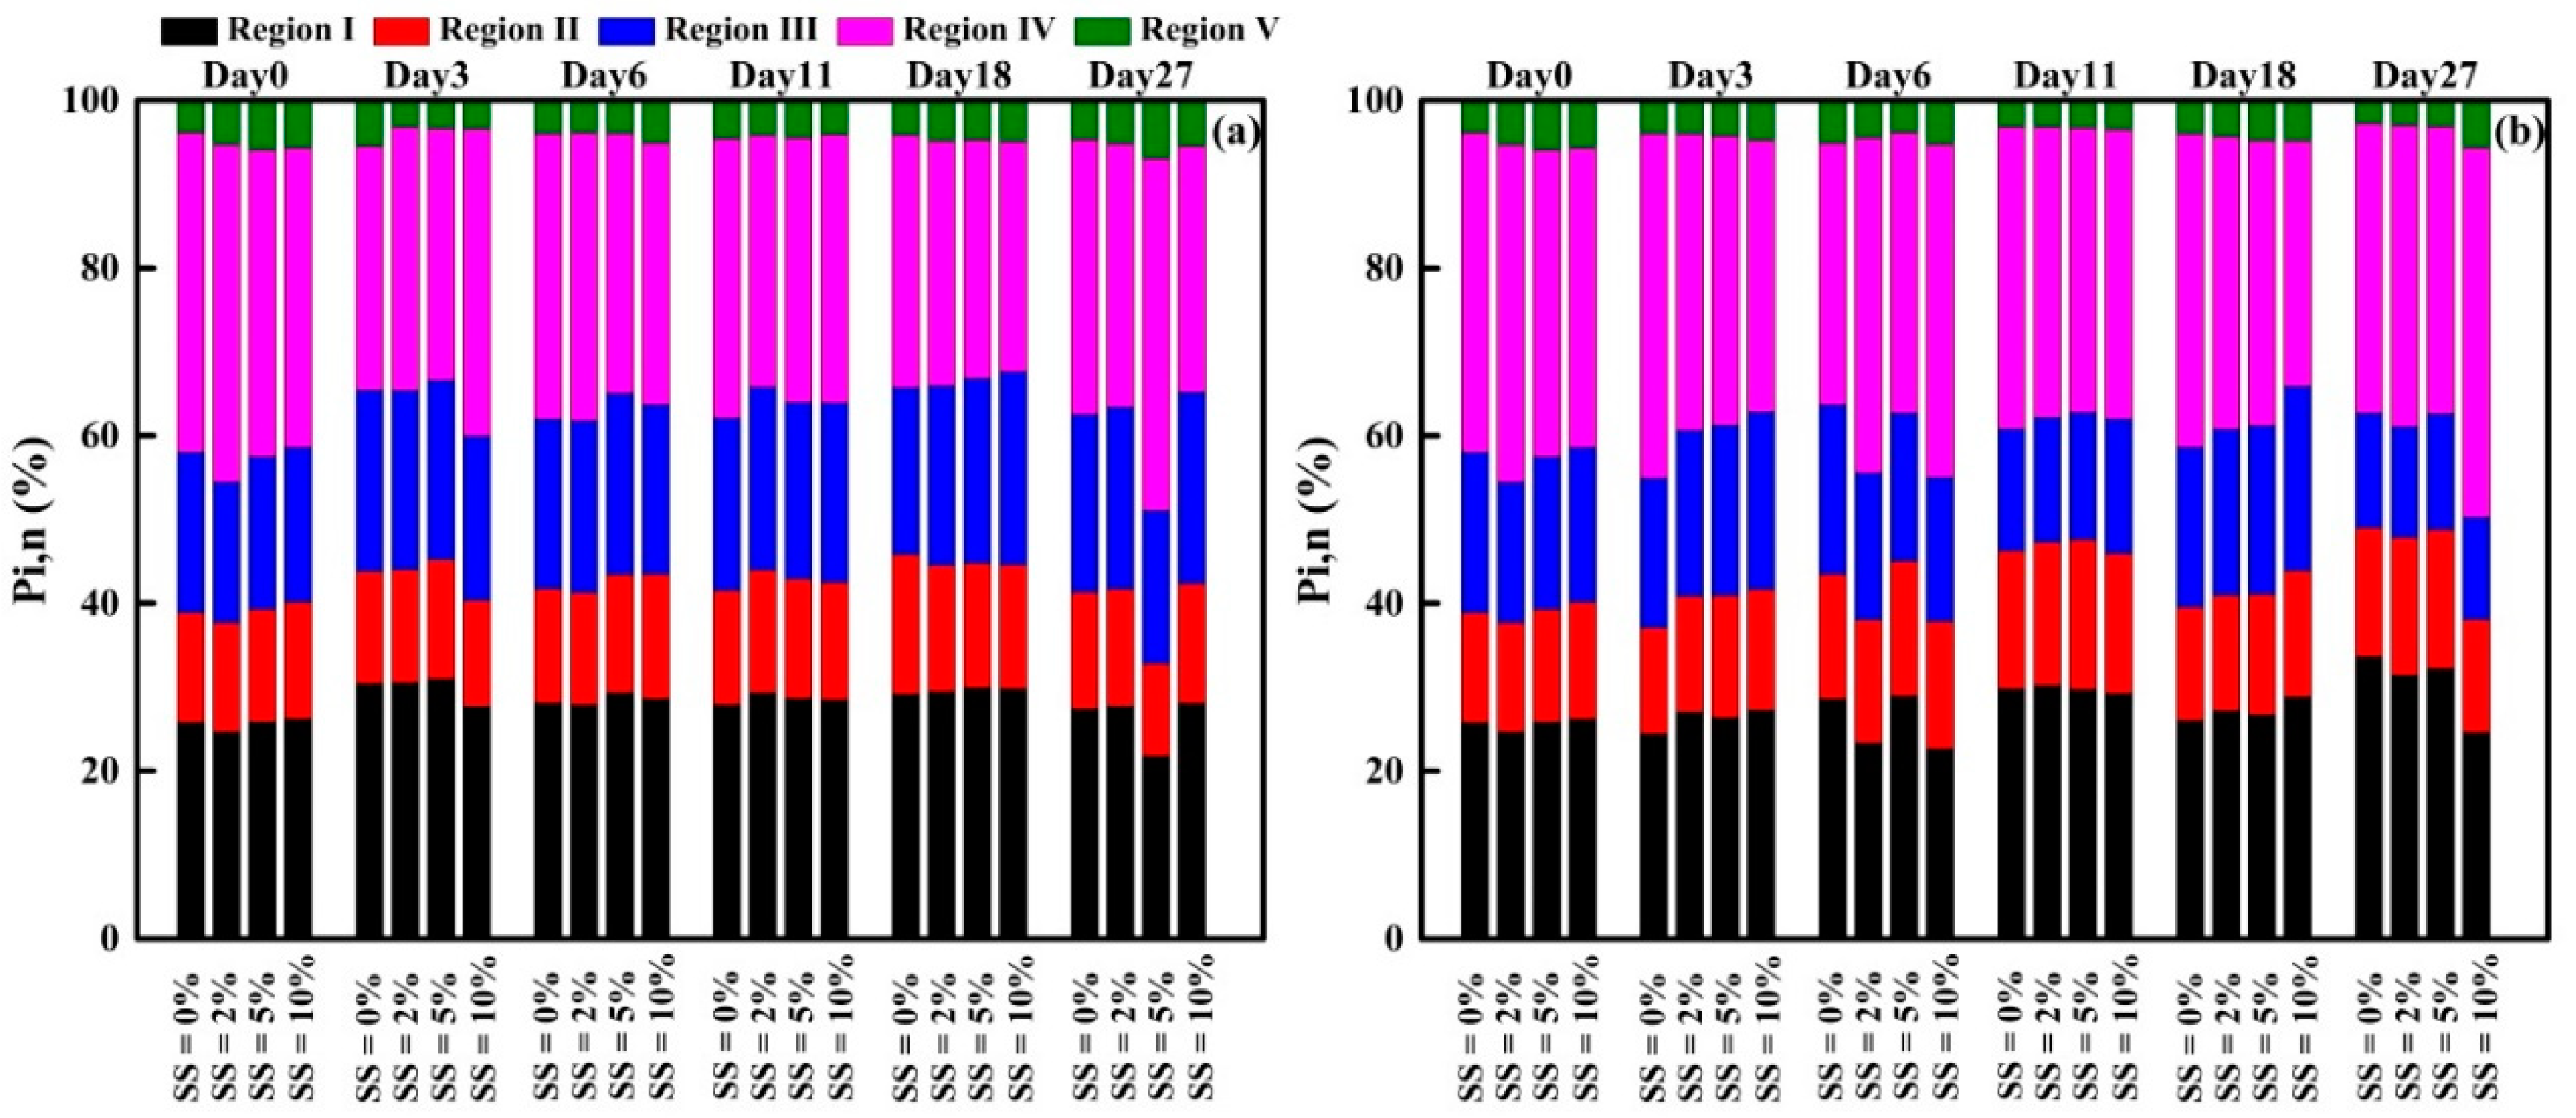
3.3.3. FRI Analysis of EEM Spectra

The EEM spectra for supernatant DOM fractions with different dosage of DWTS addition are shown in Figure 7. During the process of digestion, the EEM observed under aerobic condition was different from that under anaerobic condition. At the end of digestion for 27 days, two peaks were observed in the anaerobic samples without adding DWTS at Ex/Em 220–230 nm/295–325 nm and 265–285 nm/295–325 nm, which were located in region I (Ex/Em 200–250 nm/250–330 nm) and region IV (Ex/Em 250–450 nm/250–380 nm), respectively [36,40]. These peaks are associated with tyrosine-like and tryptophan-like substances. Meanwhile, for aerobic supernatant samples, one fulvic-like fluorescence peak was obtained, which was centered at Ex/Em 230 nm/430 nm (region III: Ex/Em 200–250 nm/380–550 nm) [36,40]. However, no peak change was observed with the addition of DWTS in this study.
The percent fluorescence response (Pi,n) of supernatant samples after batch tests are shown in the Figure 8. For all the aerobic samples, the distribution order of Pi,n value was PIV,n > PI,n > PIII,n > PII,n > PV,n. For anaerobic samples, the Pi,n value of region IV and I was higher than other regions. The sum of PI,n and PIV,n was more than 60% for aerobic and anaerobic samples. These results indicated that soluble microbial by-product-like and tyrosine-like were the main contents of supernatant samples after both aerobic and anaerobic digestion. Meanwhile, it was found that the addition of DWTS result in different distribution of five regions for both aerobic and anaerobic conditions. For aerobic EAS, when the DWTS was dosed at SS concentrations of 2% and 5%, a gradual decrease in the sum of PI,n and PIV,n was observed, accompanied by increases in other Pi,n. The similar change tendency of PIV,n was found in the process of anaerobic condition except on day 6. It was reported that region I and IV were correlated to the biodegradable materials, and region III and V were associated with least and non-biodegradable compounds [58]. In general, therefore, it seems that the DOM released by DWTS could lead to the accumulation of non-biodegradable humic acid-like substance at the different stages of digestion.

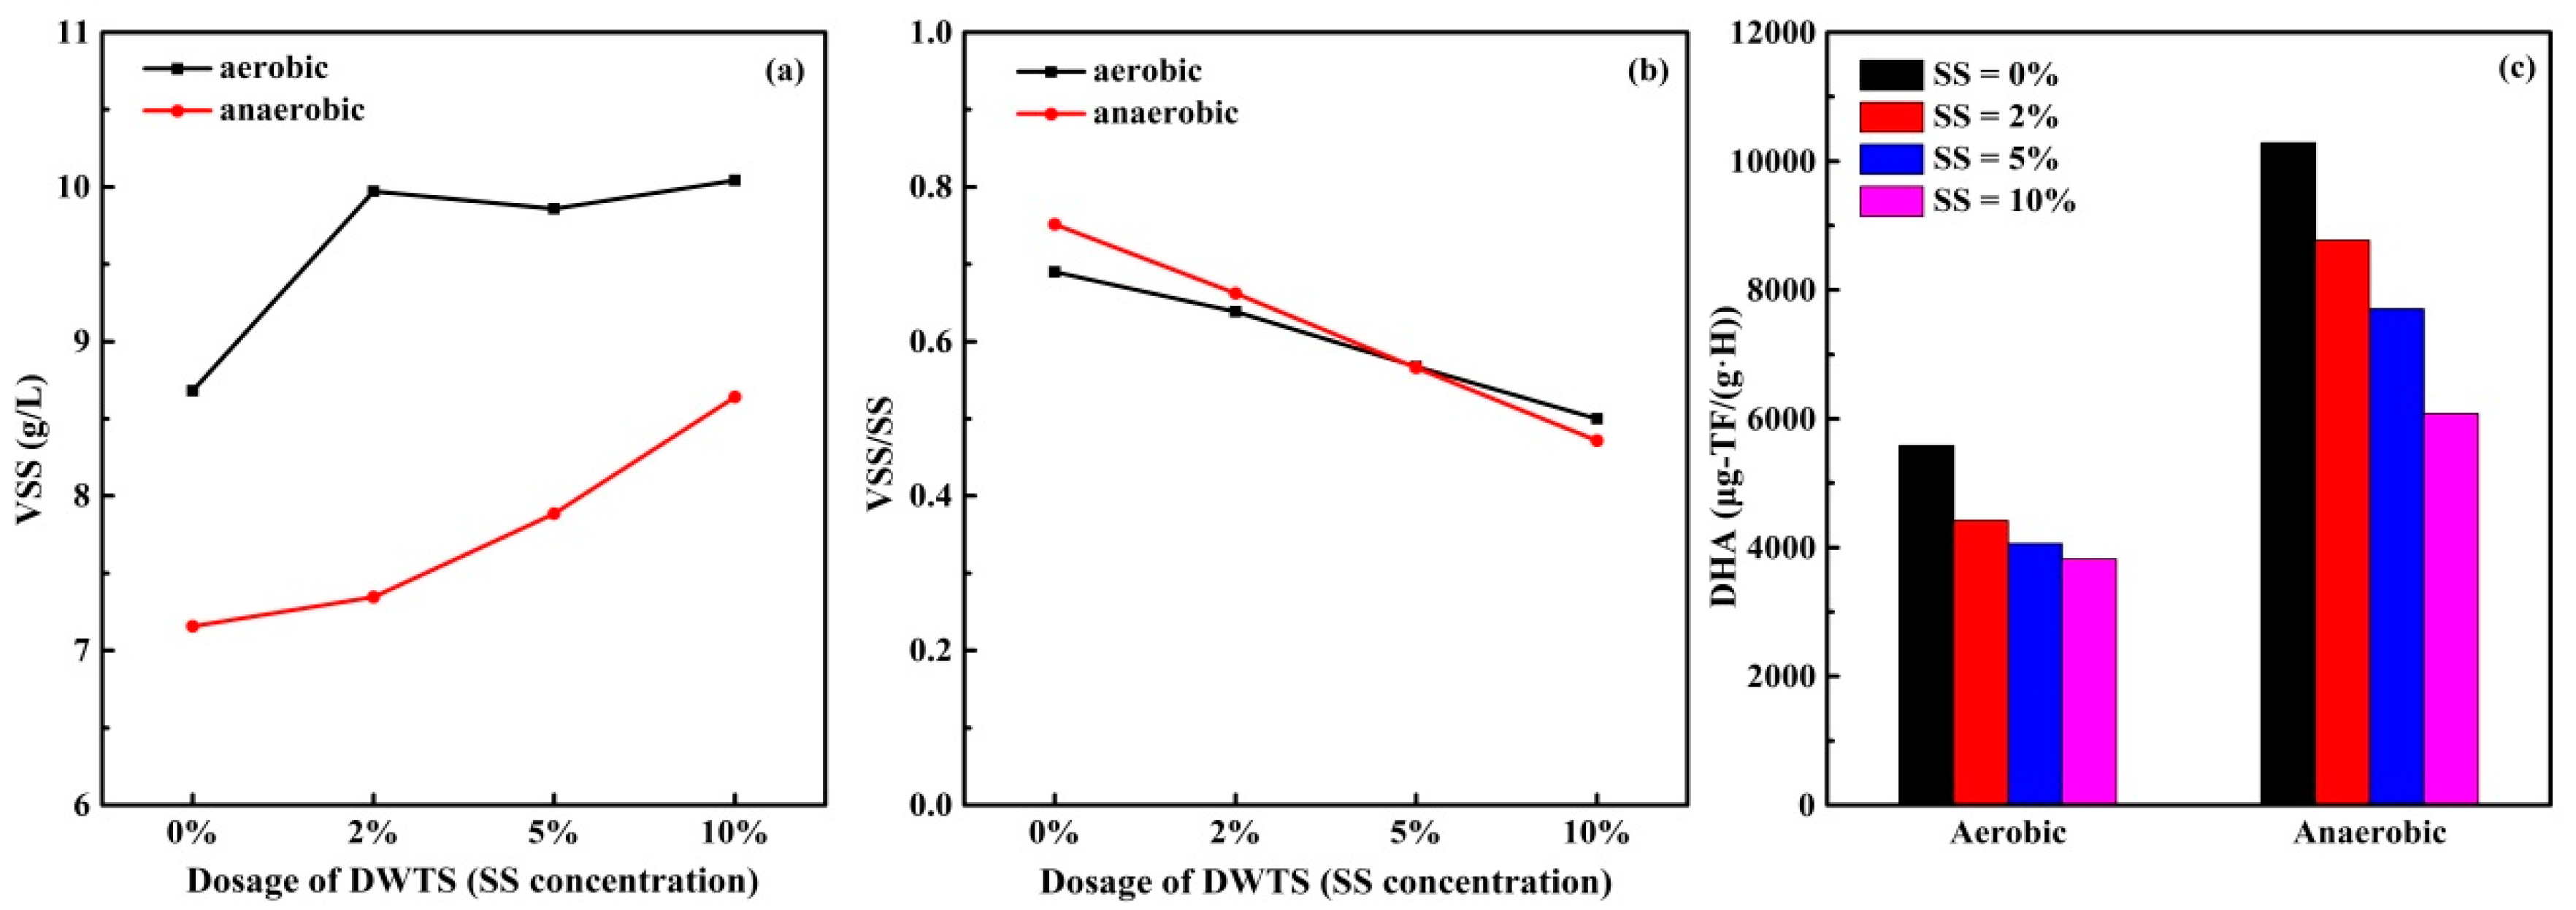
3.4. Study on Sludge Dehydrogenase Activity

The VSS concentration, VSS/SS ratio and TTC-DHA in the precipitated sludge at the end of digestion for 27 days are shown in Figure 9. With the increase of DWTS dosage, the VSS concentration of the sludge increased whereas the VSS/SS ratio decreased. This indicated that the addition of DWTS resulted in higher content of inorganic components in the sludge than organic components, which may be related to the characteristic of DWTS.
TTC was applied as final H+/e−1 acceptor of the microorganisms of the sludge in TTC-DHA test [59], which can reflect microorganism activity of precipitated sludge after batch tests. From Figure 9 we can see that the anaerobic EAS without the DWTS addition has the highest TTC-DHA value, which was 10,283.17 μg-TF/(g·H). Compared to aerobic EAS, The TTC-DHA values of anaerobic EAS were higher in all the dosages of DWTS. Figure 9 reveals that there has been a steady decrease of TTC-DHA when the DWTS dosage increased in both aerobic and anaerobic conditions. This finding suggests that the addition of DWTS can lead to a decrease in the degradation rate, and it corresponds to the DOC content at the end of EAS digestion which is shown in Figure 3. This may be due to two reasons. Firstly, it may be associated with the presence of some heavy metals in DWTS and the toxicity of heavy metals can influence DHA as described by Tan et al. (2017) [60]. Another possible explanation for this is that DWTS contained a large number of inorganic components, and the addition of DWTS reduced the concentration of organic matter, leading to the decrease of DHA [61].

4. Conclusions

In this study, DWTS was added to EAS after aerobic and anaerobic digestion of different stages. It was found that the removal efficiency of TDN and DP increased with the increase of DWTS dosage for anaerobic EAS. For anaerobic EAS, the highest removal efficiency of TDN and DP was observed when DWTS dosage was SS = 10%, which were 29.97% and 55.38%, respectively. However, for aerobic EAS, no obvious correlation was found between DWTS dosages and the removal efficiency of TDN and DP. The remaining coagulant in DWTS had less effect on DOC removal of aerobic and anaerobic EAS. On the contrary, DWTS would increase DOC concentration by releasing DOM. The EEM spectra were analyzed to evaluate the biodegradable and non-biodegradable components in supernatant DOM fractions. At the end of digestion for 27 days, two peaks (tyrosine-like and tryptophan-like substances) were observed in anaerobic supernatant, and one fulvic-like fluorescence peak was obtained in aerobic supernatant. However, no peak change was observed with the addition of DWTS in this study. PARAFAC analysis identified three components including a protein-tyrosine-like component (C1), a protein-tyrosine-like and fulvic-like component (C2) and a fulvic-like and humic-like component (C3). For aerobic and anaerobic EAS, adding DWTS could reduce DHA which has influence on the EAS degradation rate. It might be contributed by the presence of some heavy metals in DWTS and the decrease of organic matter concentration. The findings of this research suggest that the DOM released by DWTS needs to be evaluated in order to select DWTS with higher potential benefits for future reuse. Further studies should focus on the effect of DWTS with different kinds of coagulants on EAS.

Author Contributions

Conceptualization, H.D. and F.L.; methodology, H.D., Y.W. and F.L.; validation, Y.W.; formal analysis. Y.W. and M.Y.R.; investigation, Y.W., H.S., F.A. and Y.L.; writing—original draft preparation. Y.W.; writing—review and editing, S.A.B., H.H. and H.W.; funding acquisition H.D. All authors have read and agreed to the published version of the manuscript.

Funding

This research was funded by the Natural Science Foundation of Jiangsu Province, grant number BK20171017 and Nanjing Overseas Students Science and Technology Innovation Project.

Conflicts of Interest

The authors declare no conflict of interest.

References

  1. Meng, X.; Huang, Q.; Gao, H.; Tay, K.; Yan, J. Improved utilization of phosphorous from sewage sludge (as Fertilizer) after treatment by Low-Temperature combustion. Waste Manag. 2018, 80, 349–358. [Google Scholar] [CrossRef] [PubMed]
  2. Udayanga, W.D.C.; Veksha, A.; Giannis, A.; Lisak, G.; Chang, V.W.-C.; Lim, T.-T. Fate and distribution of heavy metals during thermal processing of sewage sludge. Fuel 2018, 226, 721–744. [Google Scholar] [CrossRef]
  3. Anjum, M.; Al-Makishah, N.H.; Barakat, M.A. Wastewater sludge stabilization using pre-treatment methods. Process Saf. Environ. 2016, 102, 615–632. [Google Scholar] [CrossRef]
  4. Kelessidis, A.; Stasinakis, A.S. Comparative study of the methods used for treatment and final disposal of sewage sludge in European countries. Waste Manag. 2012, 32, 1186–1195. [Google Scholar] [CrossRef]
  5. Yang, G.; Zhang, G.; Wang, H. Current state of sludge production, management, treatment and disposal in China. Water Res. 2015, 78, 60–73. [Google Scholar] [CrossRef]
  6. Chen, Y.; Cheng, J.J.; Creamer, K.S. Inhibition of anaerobic digestion process: A review. Bioresour. Technol. 2008, 99, 4044–4064. [Google Scholar] [CrossRef]
  7. Yuan, H.; Xu, C.; Zhu, N. Disinhibition of the ammonium nitrogen in autothermal thermophilic aerobic digestion for sewage sludge by chemical precipitation. Bioresour. Technol. 2014, 169, 686–691. [Google Scholar] [CrossRef]
  8. Zou, J.; Zhang, L.; Wang, L.; Li, Y. Enhancing phosphorus release from waste activated sludge containing ferric or aluminum phosphates by EDTA addition during anaerobic fermentation process. Chemosphere 2017, 171, 601–608. [Google Scholar] [CrossRef]
  9. Du, H.; Li, F. Characteristics of dissolved organic matter formed in aerobic and anaerobic digestion of excess activated sludge. Chemosphere 2017, 168, 1022–1031. [Google Scholar] [CrossRef]
  10. Li, J.; Hao, X.; van Loosdrecht, M.C.M.; Yu, J.; Liu, R. Adaptation of semi-continuous anaerobic sludge digestion to humic acids. Water Res. 2019, 161, 329–334. [Google Scholar] [CrossRef]
  11. Luo, J.; Zhang, Q.; Zhao, J.; Wu, Y.; Wu, L.; Li, H.; Tang, M.; Sun, Y.; Guo, W.; Feng, Q.; et al. Potential influences of exogenous pollutants occurred in waste activated sludge on anaerobic digestion: A review. J. Hazard. Mater. 2020, 383, 121176. [Google Scholar] [CrossRef] [PubMed]
  12. Jung, K.W.; Hwang, M.J.; Park, D.S.; Ahn, K.H. Comprehensive reuse of drinking water treatment residuals in coagulation and adsorption processes. J. Environ. Manag. 2016, 181, 425–434. [Google Scholar] [CrossRef] [PubMed]
  13. Ahmad, T.; Ahmad, K.; Alam, M. Characterization of Water Treatment Plant’s Sludge and its Safe Disposal Options. Procedia Environ. Sci. 2016, 35, 950–955. [Google Scholar] [CrossRef]
  14. Cremades, L.V.; Cusidó, J.A.; Arteaga, F. Recycling of sludge from drinking water treatment as ceramic material for the manufacture of tiles. J. Clean. Prod. 2018, 201, 1071–1080. [Google Scholar] [CrossRef]
  15. Hidalgo, A.M.; Murcia, M.D.; Gómez, M.; Gómez, E.; García-Izquierdo, C.; Solano, C. Possible Uses for Sludge from Drinking Water Treatment Plants. J. Environ. Eng. 2017, 143, 04016088. [Google Scholar] [CrossRef]
  16. Hou, Q.; Meng, P.; Pei, H.; Hu, W.; Chen, Y. Phosphorus adsorption characteristics of alum sludge: Adsorption capacity and the forms of phosphorus retained in alum sludge. Mater Lett. 2018, 229, 31–35. [Google Scholar] [CrossRef]
  17. Nair, A.T.; Ahammed, M.M. The reuse of water treatment sludge as a coagulant for post-treatment of UASB reactor treating urban wastewater. J. Clean. Prod. 2015, 96, 272–281. [Google Scholar] [CrossRef]
  18. Li, C.-W.; Lin, J.-L.; Kang, S.-F.; Liang, C.-L. Acidification and alkalization of textile chemical sludge: Volume/solid reduction, dewaterability, and Al(III) recovery. Sep. Purif. Technol. 2005, 42, 31–37. [Google Scholar] [CrossRef]
  19. Keeley, J.; Jarvis, P.; Smith, A.D.; Judd, S.J. Coagulant recovery and reuse for drinking water treatment. Water Res. 2016, 88, 502–509. [Google Scholar] [CrossRef] [Green Version]
  20. Ooi, T.Y.; Yong, E.L.; Din, M.F.M.; Rezania, S.; Aminudin, E.; Chelliapan, S.; Rahman, A.A.; Park, J. Optimization of aluminium recovery from water treatment sludge using Response Surface Methodology. J. Environ. Manag. 2018, 228, 13–19. [Google Scholar] [CrossRef]
  21. Suman, A.; Ahmad, T.; Ahmad, K. Dairy wastewater treatment using water treatment sludge as coagulant: A novel treatment approach. Environ. Dev. Sustain. 2018, 20, 1615–1625. [Google Scholar] [CrossRef]
  22. Zhang, R.; Leiviskä, T.; Tanskanen, J.; Gao, B.; Yue, Q. Utilization of ferric groundwater treatment residuals for inorganic-organic hybrid biosorbent preparation and its use for vanadium removal. Chem. Eng. J. 2019, 361, 680–689. [Google Scholar] [CrossRef]
  23. Keeley, J.; Jarvis, P.; Judd, S.J. An economic assessment of coagulant recovery from water treatment residuals. Desalination 2012, 287, 132–137. [Google Scholar] [CrossRef]
  24. Lin, L.; Xu, X.; Papelis, C.; Cath, T.Y.; Xu, P. Sorption of metals and metalloids from reverse osmosis concentrate on drinking water treatment solids. Sep. Purif. Technol. 2014, 134, 37–45. [Google Scholar] [CrossRef]
  25. Guan, X.-H.; Chen, G.-H.; Shang, C. Re-use of water treatment works sludge to enhance particulate pollutant removal from sewage. Water Res. 2005, 39, 3433–3440. [Google Scholar] [CrossRef] [PubMed]
  26. Mazari, L.; Abdessemed, D.; Szymczyk, A. Evaluating Reuse of Alum Sludge as Coagulant for Tertiary Wastewater Treatment. J. Environ. Eng. 2018, 144, 04018119. [Google Scholar] [CrossRef]
  27. Babatunde, A.O.; Zhao, Y.Q. Equilibrium and kinetic analysis of phosphorus adsorption from aqueous solution using waste alum sludge. J. Hazard. Mater. 2010, 184, 746–752. [Google Scholar] [CrossRef] [Green Version]
  28. Zhou, Z.; Yang, Y.; Li, X.; Li, P.; Zhang, T.; Lv, X.; Liu, L.; Dong, J.; Zheng, D. Optimized removal of natural organic matter by ultrasound-assisted coagulation of recycling drinking water treatment sludge. Ultrason. Sonochem. 2018, 48, 171–180. [Google Scholar] [CrossRef]
  29. Singh, S.; Srivastava, V.C.; Mandal, T.K.; Mall, I.D. Synthesis of different crystallographic Al2O3 nanomaterials from solid waste for application in dye degradation. RSC Adv. 2014, 4, 50801–50810. [Google Scholar] [CrossRef]
  30. Singh, S.; Singh, S.; Lo, S.-L.; Kumar, N.; Kazmi, A.A.; Fakour, H. Preparation and reuse of iron and aluminum oxides activated sewage sludge based coagulants for the post-treatment of up-flow anaerobic sludge blanket reactor effluent. J. Clean. Prod. 2017, 149, 1020–1032. [Google Scholar] [CrossRef]
  31. Wang, H.-F.; Hu, H.; Wang, H.-J.; Zeng, R.J. Combined use of inorganic coagulants and cationic polyacrylamide for enhancing dewaterability of sewage sludge. J. Clean. Prod. 2019, 211, 387–395. [Google Scholar] [CrossRef]
  32. Liu, R.; Zhao, Y.; Sibille, C.; Ren, B. Evaluation of natural organic matter release from alum sludge reuse in wastewater treatment and its role in P adsorption. Chem. Eng. J. 2016, 302, 120–127. [Google Scholar] [CrossRef]
  33. Xu, Y.; Chen, T.; Liu, Z.; Zhu, S.; Cui, F.; Shi, W. The impact of recycling alum-humic-floc (AHF) on the removal of natural organic materials (NOM): Behavior of coagulation and adsorption. Chem. Eng. J. 2016, 284, 1049–1057. [Google Scholar] [CrossRef]
  34. Lee, B.M.; Seo, Y.S.; Hur, J. Investigation of adsorptive fractionation of humic acid on graphene oxide using fluorescence EEM-PARAFAC. Water Res. 2015, 73, 242–251. [Google Scholar] [CrossRef] [PubMed]
  35. Zepp, R.G.; Sheldon, W.M.; Moran, M.A. Dissolved organic fluorophores in southeastern US coastal waters: Correction method for eliminating Rayleigh and Raman scattering peaks in excitation–emission matrices. Mar. Chem. 2004, 89, 15–36. [Google Scholar] [CrossRef]
  36. Chen, W.; Westerhoff, P.; Leenheer, J.A.; Booksh, K. Fluorescence excitation-emission matrix regional integration to quantify spectra for dissolved organic matter. Environ. Sci. Technol. 2003, 37, 5701–5710. [Google Scholar] [CrossRef]
  37. Murphy, K.R.; Stedmon, C.A.; Graeber, D.; Bro, R. Fluorescence spectroscopy and multi-way techniques. PARAFAC. Anal. Methods UK 2013, 5, 6557–6566. [Google Scholar] [CrossRef] [Green Version]
  38. Stedmon, C.A.; Markager, S.; Bro, R. Tracing dissolved organic matter in aquatic environments using a new approach to fluorescence spectroscopy. Mar. Chem. 2003, 82, 239–254. [Google Scholar] [CrossRef]
  39. Stedmon, C.A.; Markager, S. Tracing the production and degradation of autochthonous fractions of dissolved organic matter by fluorescence analysis. Limnol. Oceanogr. 2005, 50, 1415–1426. [Google Scholar] [CrossRef]
  40. Song, F.; Wu, F.; Feng, W.; Tang, Z.; Giesy, J.P.; Guo, F.; Shi, D.; Liu, X.; Qin, N.; Xing, B.; et al. Fluorescence regional integration and differential fluorescence spectroscopy for analysis of structural characteristics and proton binding properties of fulvic acid sub-fractions. J. Environ. Sci. 2018, 74, 116–125. [Google Scholar] [CrossRef]
  41. Sun, J.; Guo, L.; Li, Q.; Zhao, Y.; Gao, M.; She, Z.; Jin, C. Three-dimensional fluorescence excitation–emission matrix (EEM) spectroscopy with regional integration analysis for assessing waste sludge hydrolysis at different pretreated temperatures. Environ. Sci. Pollut. Res. 2016, 23, 24061–24067. [Google Scholar] [CrossRef] [PubMed]
  42. González-Brambila, M.; Monroy, O.; López-Isunza, F. Experimental and theoretical study of membrane-aerated biofilm reactor behavior under different modes of oxygen supply for the treatment of synthetic wastewater. Chem. Eng. Sci. 2006, 61, 5268–5281. [Google Scholar] [CrossRef]
  43. Chiang, K.-Y.; Chou, P.-H.; Hua, C.-R.; Chien, K.-L.; Cheeseman, C. Lightweight bricks manufactured from water treatment sludge and rice husks. J. Hazard. Mater. 2009, 171, 76–82. [Google Scholar] [CrossRef] [PubMed]
  44. Godoy, L.G.G.; Rohden, A.B.; Garcez, M.R.; Costa, E.B.; Dalt, S.; Oliveira Andrade, J.J. Valorization of water treatment sludge waste by application as supplementary cementitious material. Constr. Build. Mater. 2019, 223, 939–950. [Google Scholar] [CrossRef]
  45. Wang, D.; Liu, X.; Zeng, G.; Zhao, J.; Liu, Y.; Wang, Q.; Chen, F.; Li, X.; Yang, Q. Understanding the impact of cationic polyacrylamide on anaerobic digestion of waste activated sludge. Water Res. 2018, 130, 281–290. [Google Scholar] [CrossRef] [Green Version]
  46. Wang, Y.; Zhao, J.; Wang, D.; Liu, Y.; Wang, Q.; Ni, B.-J.; Chen, F.; Yang, Q.; Li, X.; Zeng, G.; et al. Free nitrous acid promotes hydrogen production from dark fermentation of waste activated sludge. Water Res. 2018, 145, 113–124. [Google Scholar] [CrossRef] [Green Version]
  47. Arnaldos, M.; Pagilla, K. Effluent dissolved organic nitrogen and dissolved phosphorus removal by enhanced coagulation and microfiltration. Water Res. 2010, 44, 5306–5315. [Google Scholar] [CrossRef]
  48. Park, T.; Ampunan, V.; Lee, S.; Chung, E. Chemical behavior of different species of phosphorus in coagulation. Chemosphere 2016, 144, 2264–2269. [Google Scholar] [CrossRef]
  49. Muisa, N.; Nhapi, I.; Ruziwa, W.; Manyuchi, M.M. Utilization of alum sludge as adsorbent for phosphorus removal in municipal wastewater: A review. J. Water Process Eng. 2020, 35, 101187. [Google Scholar] [CrossRef]
  50. Yang, Y.; Zhao, Y.Q.; Babatunde, A.O.; Wang, L.; Ren, Y.X.; Han, Y. Characteristic and mechanisms of phosphoate adsorption on dewatered alum sludge. Sep. Purif. Technol. 2006, 51, 193–200. [Google Scholar] [CrossRef] [Green Version]
  51. Matilainen, A.; Vepsäläinen, M.; Sillanpää, M. Natural organic matter removal by coagulation during drinking water treatment: A review. Adv. Colloid Interface Sci. 2010, 159, 189–197. [Google Scholar] [CrossRef]
  52. Edzwald, J.K.; Tobiason, J.E. Enhanced coagulation: US requirements and a broader view. Water Sci. Technol. 1999, 40, 63–70. [Google Scholar] [CrossRef]
  53. Murphy, K.R.; Hambly, A.; Singh, S.; Henderson, R.K.; Baker, A.; Stuetz, R.; Khan, S.J. Organic matter fluorescence in municipal water recycling schemes: Toward a unified PARAFAC model. Environ. Sci. Technol. 2011, 45, 2909–2916. [Google Scholar] [CrossRef] [PubMed]
  54. Baghoth, S.A.; Sharma, S.K.; Amy, G.L. Tracking natural organic matter (NOM) in a drinking water treatment plant using fluorescence excitation-emission matrices and PARAFAC. Water Res. 2011, 45, 797–809. [Google Scholar] [CrossRef] [PubMed]
  55. Sanchez, N.P.; Skeriotis, A.T.; Miller, C.M. Assessment of dissolved organic matter fluorescence PARAFAC components before and after coagulation–filtration in a full scale water treatment plant. Water Res. 2013, 47, 1679–1690. [Google Scholar] [CrossRef]
  56. Liu, R.; Liu, N.; Liu, X.; Yu, H.; Li, B.; Song, Y. Spectroscopic and microscopic characteristics of natural aquatic nanoscale particles from riverine waters. J. Geochem. Explor. 2016, 170, 10–20. [Google Scholar] [CrossRef]
  57. He, X.; Xi, B.; Li, X.; Pan, H.; An, D.; Bai, S.; Li, D.; Cui, D. Fluorescence excitation–emission matrix spectra coupled with parallel factor and regional integration analysis to characterize organic matter humification. Chemosphere 2013, 93, 2208–2215. [Google Scholar] [CrossRef]
  58. Guo, L.; Lu, M.; Li, Q.; Zhang, J.; Zong, Y.; She, Z. Three-dimensional fluorescence excitation–emission matrix (EEM) spectroscopy with regional integration analysis for assessing waste sludge hydrolysis treated with multi-enzyme and thermophilic bacteria. Bioresour. Technol. 2014, 171, 22–28. [Google Scholar] [CrossRef]
  59. Ryssov-Nielsen, H. Measurement of the inhibition of respiration in activated sludge by a modified determination of the ttc-dehydrogenase activity. Water Res. 1975, 9, 1179–1185. [Google Scholar] [CrossRef]
  60. Tan, X.; Liu, Y.; Yan, K.; Wang, Z.; Lu, G.; He, Y.; He, W. Differences in the response of soil dehydrogenase activity to Cd contamination are determined by the different substrates used for its determination. Chemosphere 2017, 169, 324–332. [Google Scholar] [CrossRef]
  61. Han, B.-C.; Jiang, W.-L.; Zhang, H.-L.; Wei, S.-L.; Liu, R.; Zhang, Y. Nitrogen removal enhancement and nitrous oxide emission reduction by activated sludge with pulse aeration. Process Saf. Environ. 2019, 129, 40–46. [Google Scholar] [CrossRef]
Figure 1. X-ray diffraction pattern of drinking water treatment sludge (DWTS).
Sustainability 12 06953 g001
Figure 2. Total dissolved nitrogen (TDN) and dissolved phosphorus (DP) concentration in the supernatant with different dosage and time of DWTS addition. (a,c): aerobic EAS; (b,d): anaerobic EAS.
Sustainability 12 06953 g002
Figure 3. The change of dissolved organic carbon (DOC) concentration in the supernatant with different dosage of DWTS during 27 days’ digestion. (a): aerobic EAS; (b): anaerobic EAS.
Sustainability 12 06953 g003
Figure 4. Effect of DWTS on the change of UV260 and specific ultraviolet absorbance (SUVA) values during 27 days’ digestion. (a): aerobic EAS; (b): anaerobic EAS.
Sustainability 12 06953 g004
Figure 5. Three components identified by PARAFAC analysis and Ex/Em loadings. C1: protein-tyrosine-like component; C2: protein-tyrosine-like and fulvic-like component; C3: fulvic-like and humic-like component.
Sustainability 12 06953 g005
Figure 6. Fmax values of the three components at the end of digestion for 27 days.
Sustainability 12 06953 g006
Figure 7. Excitation-emission matrix (EEM) for supernatant dissolved organic matter (DOM) fractions with different dosage of DWTS. (a,c,e): aerobic EAS; (b,d,f): anaerobic EAS.
Sustainability 12 06953 g007
Figure 8. Distributions of percent fluorescence response (Pi,n) in the supernatant samples. (a): aerobic EAS; (b): anaerobic EAS.
Sustainability 12 06953 g008
Figure 9. (a) Volatile suspended solid (VSS), (b) VSS/SS ratio and (c) dehydrogenase activity (DHA) in the precipitated sludge at the end of digestion for 27 days.
Sustainability 12 06953 g009
Table 1. pH changes of supernatant after bath tests.
Excess Activated Sludge (EAS) ConditionDayDWTS Dosage
SS = 0%SS = 2%SS = 5%SS = 10%
Aerobic06.456.436.446.48
35.735.785.955.65
65.926.036.066.16
115.905.995.935.88
185.205.245.435.66
275.615.685.775.93
Anaerobic06.456.436.446.48
36.496.416.416.41
66.346.436.386.27
116.286.216.186.14
186.566.566.576.54
276.566.666.596.61

