1. Introduction
China has achieved outstanding progress in economic development in recent years and has become the second largest economic entity in the world. However, this achievement is gained by depending on a long-term extensive economic growth mode, which to an extent has resource and labor-intensive characteristics [
1,
2]. With the rapid economic growth, energy consumption increases gradually, and the resource supply–demand gap expands gradually. Therefore, resource and energy supplies fall short to meet current social development. Moreover, the original extensive economic development mode may cause certain pressures on the ecological environment and natural resources [
3]. As the byproducts of economic development, environmental pollution and resource consumption have become a key barrier against sustainable development, and they have attracted wide attention from China and other developing countries [
4].
Water resources are an important strategic resource, forming the basis for survival and development of human society [
5]. Water resources are facing a serious global crisis as a response to population and economic growth, climatic warming, and poor water resource management [
6,
7]. Nearly two-thirds of the global population is suffering water shortage every year, and approximately 1 billion of the population faces a severe water shortage every year. Water shortage has become a key restriction against economic development, causing serious damage to the sustainable economic development of countries in the world [
8,
9,
10]. China does not have rich water resources, and the water resource per capita is only roughly 2000 m³. China is a water-shortage country. Moreover, the imbalance in water resource distribution per capita among different provinces is significant, and the hydraulic engineering system is not perfect yet. The supply–demand contradiction of water resources has become a heavy burden against the sustainable economic development of China [
11]. As the representative of developing countries, China achieves fast economic growth with progress in urbanization and industrialization. Although China’s economic development level is increased to an extent, it leads to increase of industrial wastewater emission year-by-year, thus gradually intensifying water pollution in the country. The national total pollutant emission amounted to 82.5 billion tons in 2018, and the investment for environmental pollution control accounted for 1.48% of China’s GDP [
11].
Green development is a topic in the current era. Its core is to realize higher economic output with small resource input while decreasing environmental pollution. The essence of green development is to realize comprehensively the harmonious and sustainable development of economy, society, and ecology by decreasing resource consumption and strengthening environmental protection and ecological governance [
12]. Recently, the government of China (GOC) also realized the importance of water conservation, water environmental protection, and economic development balance. In 2011, the State Council of China released a document on accelerating water conservancy reform in China, which explicitly stipulated strengthening water resource management and increasing comprehensive utilization of water resources [
13]. In 2012, the concept of green development was proposed for the first time on the 18th National Congress of the Communist Party of China [
14]. In 2016, the 13th Five-Year Plan suggested making green development a new motivation of economic growth [
15]. In September 2019, Xi Jinping, the president of China, further emphasized the necessity of conservation and intensive use of water resources on the forum of ecological protection and high-quality development in the Yellow River Basin. He pointed out that increasing water utilization and water pollution control are key links to realize global green economic development [
16]. The GOC is devoted to relieving water pollution by adopting policies, regulations, and other means. Nonetheless, water pollution has become a major source of environmental pollution at present, and it has brought serious challenges to national economic development and ecological environmental protection. The environmental pollution cost caused by water pollution has become a heavy pressure over the sustainable development strategy of China. Thus far, the dual pressures of water resource shortage and low water utilization have become one of the important constraints against social development in China [
17].
The concept of green efficiency of water resources is developed in accordance with combining China’s and global requirements on water resources and sustainable development for the water environment. Green efficiency of water resources refers to the comprehensive efficiency of equilibrium development by integrating social, ecological, environmental, and economic factors. It is not only influenced by objective factors such as regional distribution of water resources, policy constraints of government, regional economic development level, and sewage processing technologies, but also closely related with the water-saving consciousness and lifestyle of local residents [
18]. Hence, scientific green efficiency assessment of water resources, effective recognition of relevant influencing factors, and determining action mechanisms of different influencing factors are foundations to effectively prevent water environmental failure and improve water resource utilization. They are also important topics for developing countries to realize sustainable resource, environmental, and economic development. On this basis, this study focuses on how to make a scientific evaluation and improve green efficiency of water resources effectively.
Relevant scholars have carried out abundant studies on assessment of water resource efficiency, but attention to green efficiency assessment of water resources has been limited. Therefore, this study aims to further explore reasonable measurement of green efficiency of water resources that achieves harmonious economic–environmental–ecological development as well as action mechanism of relevant influencing factors based on previous associated studies. At present, evaluation indexes of green efficiency of water resources are incomprehensive. Only economic and environmental factors are considered. Influences of social benefits and industrial restructuring caused by sustainable development on green efficiency are ignored, thus resulting in poor reasonability for assessing sustainable green efficiency of water resources [
19,
20]. Constructing an input–output indicator system scientifically is the primary pointcut to evaluate green efficiency of water resources. Considering the current water shortage and water environmental pollution challenge against social and economic development, undesirable output brought by water pollution was integrated into the evaluation index system to determine the green efficiency of water resources that more accurately reflects the concept of sustainable development. Output related with social benefits brought by water resource utilization was involved to effectively judge green efficiency of water resources effectively and further seek the optimization route.
The remainder of this study is organized as follows.
Section 2 reviews research on efficiency of water resources systematically. This section also proposes the research idea of analyzing the evaluation system for green efficiency of water resources in Henan Province scientifically from the perspective of input–output index system construction and influencing factors.
Section 3 mainly interprets the measurement method of green efficiency of water resources, construction of SBM–DEA (slack-based measure and data envelopment analysis) model and input–output system, as well as construction of the Tobit regression analysis model and index system of influencing factors.
Section 4 is a case study based on Henan Province. Green efficiency of water resources in 18 cities of Henan Province is evaluated on the basis of statistical data in the last eight years. The evaluation results are also analyzed.
Section 5 summarizes conclusions and proposes relevant suggestions.
2. State of the Art
Green efficiency of water resources integrates connotation of economic efficiency and ecological efficiency. It aims to achieve the maximum economic output with the minimum resource consumption and environmental pollution. This is also an internal requirement of the harmonious development between energy, economy, and environment. Currently, few studies concern green efficiency of water resources. Scholars focus mainly on evaluation of water resource utilization. Based on literature review, many assessment methods of resource utilization have been developed worldwide. For example, Chen et al. used the DEA model to measure the water use efficiency based on Chinese provincial panel data from 2008 to 2013 [
21]. Omezzine et al. evaluated water efficiency in crop irrigation in Batinah, Oman, by SFA (stochastic frontier analysis) [
22]. Li et al. constructed an evaluation index system for resource and environmental efficiency in the west bank economic zone of Taiwan by using the analytic hierarchy process (AHP) and used it to evaluate resource and environmental efficiency of the region [
23].
Economics defines technical efficiency as the ability to increase output under a given input or the ability to reduce input at a given output [
24]. Because the analytic hierarchy process (AHP) is highly subjective, academia often uses the production frontier to evaluate resource efficiency. The production frontier mainly refers to the maximum output portfolio corresponding to a certain input under a certain technological level [
25]. The production frontier is usually expressed by a production function. According to whether the specific form of the production function is known or not, it can be divided into parametric and nonparametric methods. The parametric method is represented by stochastic frontier analysis (SFA), and the nonparametric method is represented by data envelopment analysis (DEA). Although they can both perform resource efficiency evaluation, each has its own advantages and disadvantages under different research backgrounds, as shown in
Table 1.
Due to the difficulty of constructing a function in advance and the multi-input and multi-output conditions that may be faced in the process of water resources efficiency evaluation, DEA, which belongs to mathematics, operational research, management science, and computer science, has advantages of estimating multiple input–output efficiencies and constant weights from subjective factors and data standardization, and thus became a mainstream method to estimate efficiency of water resources [
26].
Among existing studies, scholars have multiple options of DEA models to evaluate efficiency of water resources. For example, Yang and Jiang et al. analyzed and evaluated agricultural irrigation water utilization in China based on the traditional DEA model by using panel data gathered during 1998–2012, finding generally low utilization [
27]. Ren et al. proposed a two-stage DEA to analyze water resource utilization in 12 cities and autonomous prefectures in Gansu Province during 2003–2013. Although they found that water resource utilization in Gansu Province increased continuously during the study period, significant regional differences must be solved urgently [
28]. Sun et al. estimated industrial water utilization in 26 cities in the urban agglomeration of the Yangtze River Delta during 2005–2014 by using the SBM–DEA model and found that although no significant regional differences of industrial water utilization were noted in cities in Jiangsu Province, utilization was generally low. However, industrial water utilization in Shanghai was relatively high, and it was increasing at a stable rate [
29]. By reading and comparing relevant studies, the nonangled and nonradial problems can be solved efficiently. Besides, green efficiency of water resources can be evaluated by using the SBM–DEA model, which considers undesirable output.
According to literature review, most existing studies focus on green efficiency of water resources in industrial or agricultural fields. Using panel data from 38 local prefecture-level cities during 2007–2016, Ren et al. estimated green efficiency of water resources for agricultural uses in the Huaihe Ecological Economic belt based on the DEA–EBM (Epsilon-based measure) model, which considers radial and nonradial characteristics. They concluded the generally low water utilization in agricultural production in the study area, and it was declining gradually [
30]. Zhang et al. measured green efficiency of industrial water resources in Zhejiang Province through a DEA–SBM model containing undesirable output, aiming to seek a way for saving green water resources. The results pointed out that green efficiency of industrial water resources in Zhejiang Province declined initially and then increased as time went on. In addition, it was low in the south and north but high in the middle regions of Zhejiang Province. Specifically, the highest green efficiency of industrial water resources was in Hangzhou City, Shaoxing City, and Ningbo City, which have high economic development, as well as Zhoushan City, which has high tourism development [
31]. Research on regional comprehensive efficiency of water resources is relatively scant. For example, Zhao et al. measured efficiency of water resources in 31 provincial administrative regions in China during 2001–2014 through a two-staged SBM–DEA model. They concluded that efficiency of water resources in China declined gradually from eastern coastal regions to the central and western regions [
32].
The aforementioned studies emphasize utilization and conservation of water resources but neglect influences of ecological environment during green efficiency assessment of water resources. Moreover, water pollution is intensifying in recent years. A growing number of scholars begin to enlist water pollutants into efficiency evaluation of water resources as undesirable output of ecological environmental factors, aiming to achieve a more scientific efficiency of water resources and better reflect the green connotation of sustainable development. The literature review also reveals that research on green efficiency assessment of water resources in China and relevant influencing factors focus mainly on large river basins (e.g., Yangtze River economic belt) or national conditions by taking provincial capitals as the representative study areas. Green efficiency of water resources in arid regions in mainland China is hardly studied. Wang et al. took water pollutant into account when analyzing efficiency of industrial water resources and further analyzed green efficiency of water resources in 30 provinces of China by using the DEA model. The results demonstrated that green efficiency of industrial water resources in provinces of China was generally low, accompanied with evident regional distribution features [
33]. Deng et al. estimated green efficiency of water resources in 31 provinces of China during 2004–2013 by using the SBM–DEA model that considered sewage emission. They pointed out that green efficiency of water resources in economically developed provinces was relatively higher and that sewage emission efficiency in most provinces was low [
23]. Zhang et al. evaluated efficiency, wastewater governance efficiency, and two-staged comprehensive green efficiency of industrial water use in the Yangtze River economic belt during 2010–2015 by using the network SBM–Malmquist model. They found that comprehensive green efficiency improved satisfactorily in two stages. However, the wastewater control efficiency in the upstream region presented relatively insufficient growth [
34].
Based on the concept of green efficiency of water resources, social benefit output must be used as the desired output, and it should be enlisted in the evaluation index system for green efficiency of water resources to highlight sustainability of water resource utilization. Sun et al. included medical level, proportion of the aged, and proportion of residents with higher education background into the index composition of the social output dimension [
35]. With the human social development index (HDI) proposed by Tian as a basis, Yang et al. added in the environmental index to construct a human sustainable development index [
36,
37].
With the continuous deepening studies, we are exploring appropriate methods to discover the action mechanism of influencing factors on green efficiency of water resources, based on scientific and reasonable estimation and previous research results, which laid foundations to seek an effective way to improve green efficiency of water resources. For instance, Ding et al. analyzed the influencing factors of water resource utilization in different provinces of China through the DEA–Tobit model. They recognized main causes of regional differences in water utilization, which were economic development level, industrial and agricultural structure, abundance of water resources, and government intervention strength [
38].
To sum up, existing studies on green efficiency of water resources focus mainly on estimation method, model selection, and green efficiency assessment of industrial and agricultural water resources. However, few studies about green efficiency assessment of water resources consider environmental and ecological factors. Moreover, existing associated studies focus mainly on surrounding areas of large- and middle-sized river basins or the whole country of China, but arid regions in mainland China are hardly studied. With respect to the influencing factors of green efficiency of water resources, social benefits that may be brought from sustainable development and influences of industrial restructuring are ignored in the construction of the input–output system.
Given the limitations of existing studies, an input–output index system that considers social benefits was constructed by combining the concept of sustainable development, aiming to evaluate green efficiency of water resources more scientifically and reasonably. Additionally, influencing factors of green efficiency of water resources were chosen reasonably. Influencing directions and degree of different factors on green efficiency of water resources were explored through a Tobit regression analysis, which were conducive to determine the way to improve green efficiency of water resources.
3. Methodology
3.1. SBM–DEA Model
The DEA model is a quantitative analysis method developed by Charnes, Cooper, and Rhodes to make relative efficiency evaluation of decision-making units (DMUs) by using a multi-objective decision model under multi-inputs and multi-outputs [
39]. A traditional radial and angled DEA model may cause redundancy of input elements and cannot consider efficiency of DMUs comprehensively, so the efficiency of the evaluation object is overestimated [
40]. To address this defect, Tone constructed a nonradial and nonangled SBM model based on relaxation. This model not only avoids errors caused by radial and angle selection, but also overcomes the relaxation problem of input–output, thus increasing estimation accuracy [
41]. During estimation of green efficiency of water resources, multiple input and output indexes have to be included into the evaluation system, including the desired outputs, like economic added values and inevitable undesirable output (environmental pollution). Tone improved the SBM model and measured the relationship between input and output (including desired and undesirable outputs) comprehensively [
42]. In this study, the SBM–DEA model of undesirable output was applied to evaluate green efficiency of water resources. The construction of the SBM–DEA model is introduced as follows.
Suppose
n DMUs are available, and each one has three vectors of input, desired output, and undesirable output. These three vectors are
, and
. Then, the matrixes
and
can be defined as follows:
A production possibility set (
P) that contains undesirable output was constructed.
According to processing method of SBM model, the fractional planning form of SBM model that considers undesirable output is
where
, and
are the input variable, desired output variable, and undesirable output variable of the DMU.
, and
are slack variables of input, desired output, and undesirable output, and
is the weight vector. The value of the objective function (
ρ^*) is the green efficiency of water resources, which ranges between 0 and 1. When
, and the decision is efficient. When
, the DMU has efficiency loss, and the green efficiency of water resources can be improved by optimizing the inputs and outputs.
3.2. Construction of Input–Output System for the SBM–DEA Model
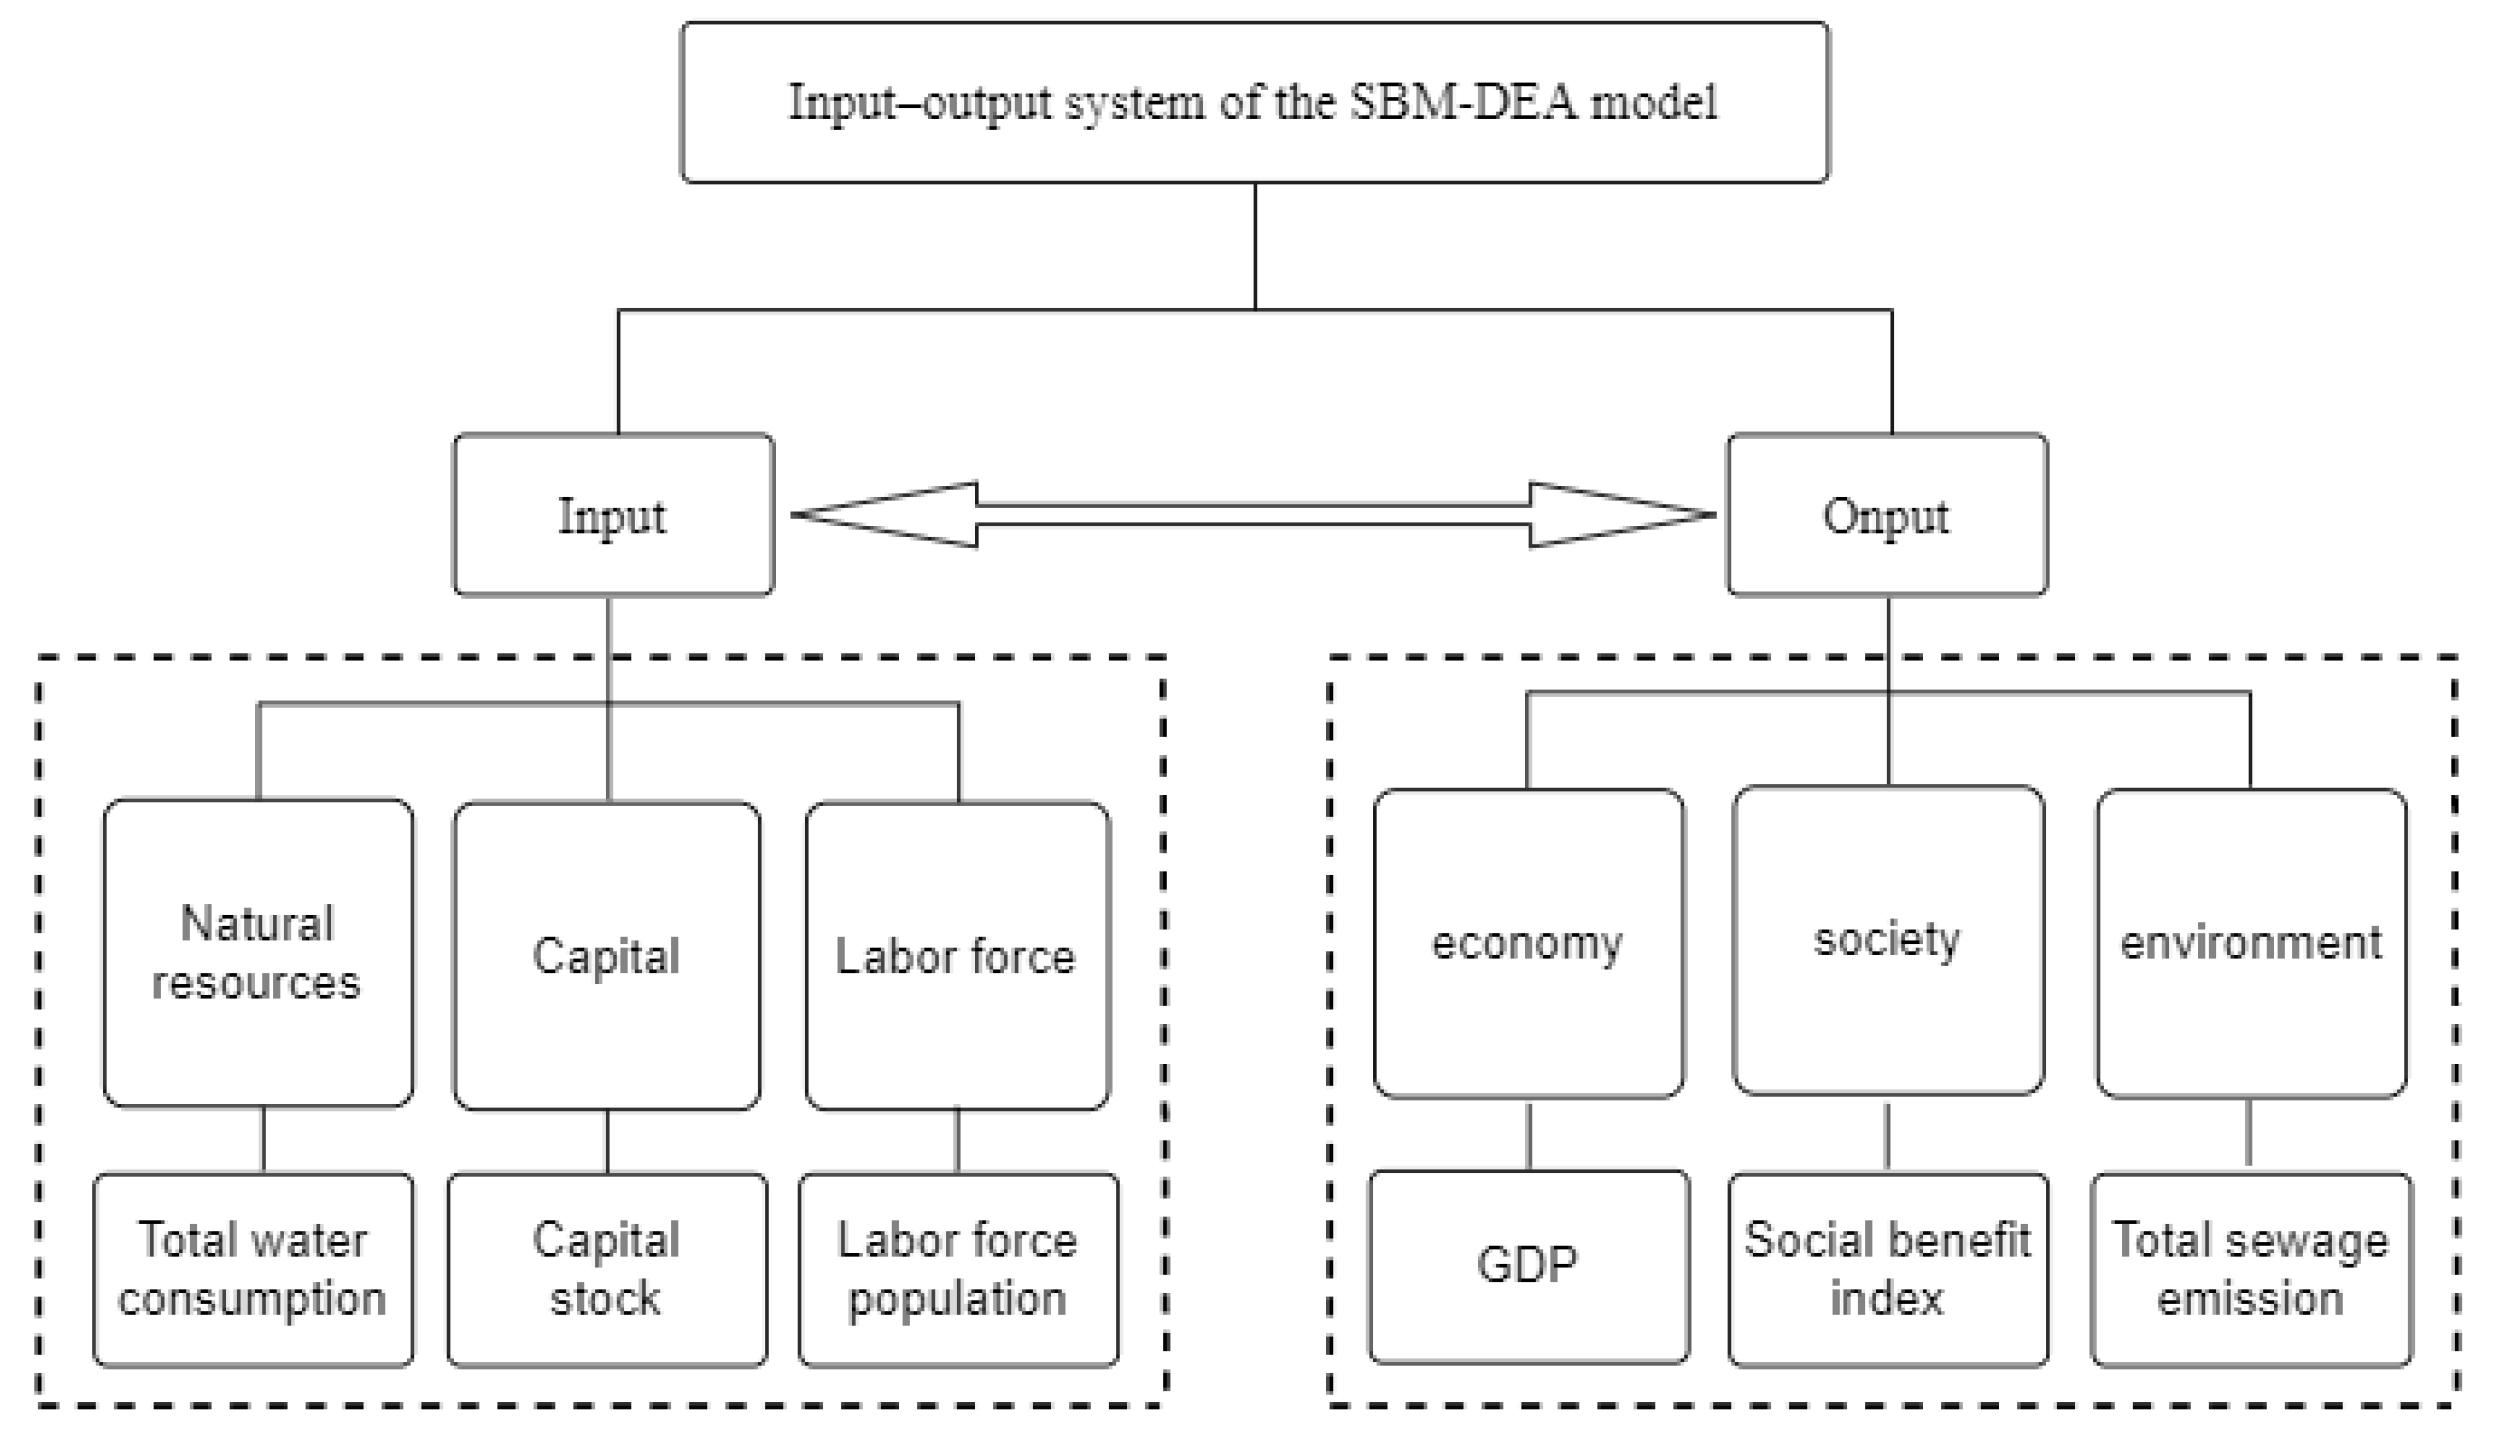
Through inquiry and review of relevant research journals and research results of many authoritative scholars concerning sustainable green development of water resources, three input indexes and three output indexes were selected according to specific national conditions of China in response to the philosophy of green development. They also follow the principle of systematicity, operability, and validity of the index system. An input–output index system was constructed (
Figure 1). Among normal evaluation methods, the method with current value and generation of economic benefits can be used as input and output indexes, such as regional gross national product and per capita disposable income. However, reactions of social benefits that cannot be measured by currency value in the index system are ignored. Hence, social benefit output is considered in construction of an input–output system in addition to the undesirable output caused by environmental pollution. The selection of specific indexes is introduced in the following text.
Input indexes selected in the SBM–DEA model can be divided into three types:
(1) Labor force population—the number of employees in the first, secondary, and tertiary industries obtained from inquiry of relevant statistical yearbooks is used as the labor force index of the current year.
(2) Capital stock—by inquiring relevant statistical yearbooks, the newly increased fixed investments of regions in different years are used as the capital stock index of the current year.
(3) Total water consumption—total consumption of different types of water resources in a region are derived by inquiring the local bulletin of water resources, and they are used as the total water consumption index of the region.
The selected output indexes in the SBM–DEA model also can be divided into three types:
(1) GDP—this variable is collected from official data released every year by the National Bureau of Statistics of China. In this study, deflator of GDP is used to adjust total GDP of different regions every year.
(2) Social benefit index—the comprehensive entropy of per capita disposal income, urbanization rate, the proportion of expenditures for scientific education in fiscal expenditure are determined by inquiring statistical yearbooks and data released by the Department of Science and Technology. This index is used as the desired output of green water uses in the social field.
(3) Total sewage emission—the total sewage emission of a region in different years, published in the water resource bulletin of the region, is used as the undesirable output of water pollution.
3.3. Tobit Regression Analysis Model
The Tobit regression analysis model, or truncation regression model or censoring regression model, is one type of constrained dependent variable regression. This model is the improved Probit regression model by James Tobin, and it has been widely applied in studying influencing factors of efficiency [
43]. This model uses the maximum likelihood method for estimation, and it can avoid inconsistency and deviation problems in parameter estimation [
44]. The mathematical expression is
where
is the latent variable,
is the observed practical dependent variable,
is an independent variable,
is a constant term,
refers to the correlation coefficient vector, and
is independent and
.
3.4. Construction of an Index System of Influencing Factors of Tobit Regression Analysis Model
Many factors may influence sustainable green efficiency of water resources of a region, such as natural environmental condition, economic development degree, environmental policy regulation, and scientific technological development level in the region [
45,
46,
47,
48,
49]. In the Tobit regression analysis model, green efficiency of water resources was used as the dependent variable and its influencing factors were used as independent variables. Based on relevant information inquiry, the following indexes were chosen by combining the philosophy of sustainable development to construct an index system of influencing factors on green efficiency of water resources:
- (1)
Water use intensity—it is expressed by water consumption per 10,000 RMB of GDP in different regions in different years.
- (2)
Government control intensity of water environment—it is expressed by the mean standard rate of water quality on the provincial section.
- (3)
Technological input—it is determined according to proportion of R&D expenses in GDP in different regions in different years.
- (4)
Abundance of water resources—natural water resource reserves in different regions are represented by per capita water resources.
- (5)
Marketization level—it is mainly expressed by the proportion of the tertiary industry in GDP in regions.
4. Case Study and Discussion of Results
4.1. Basic Conditions of the Case
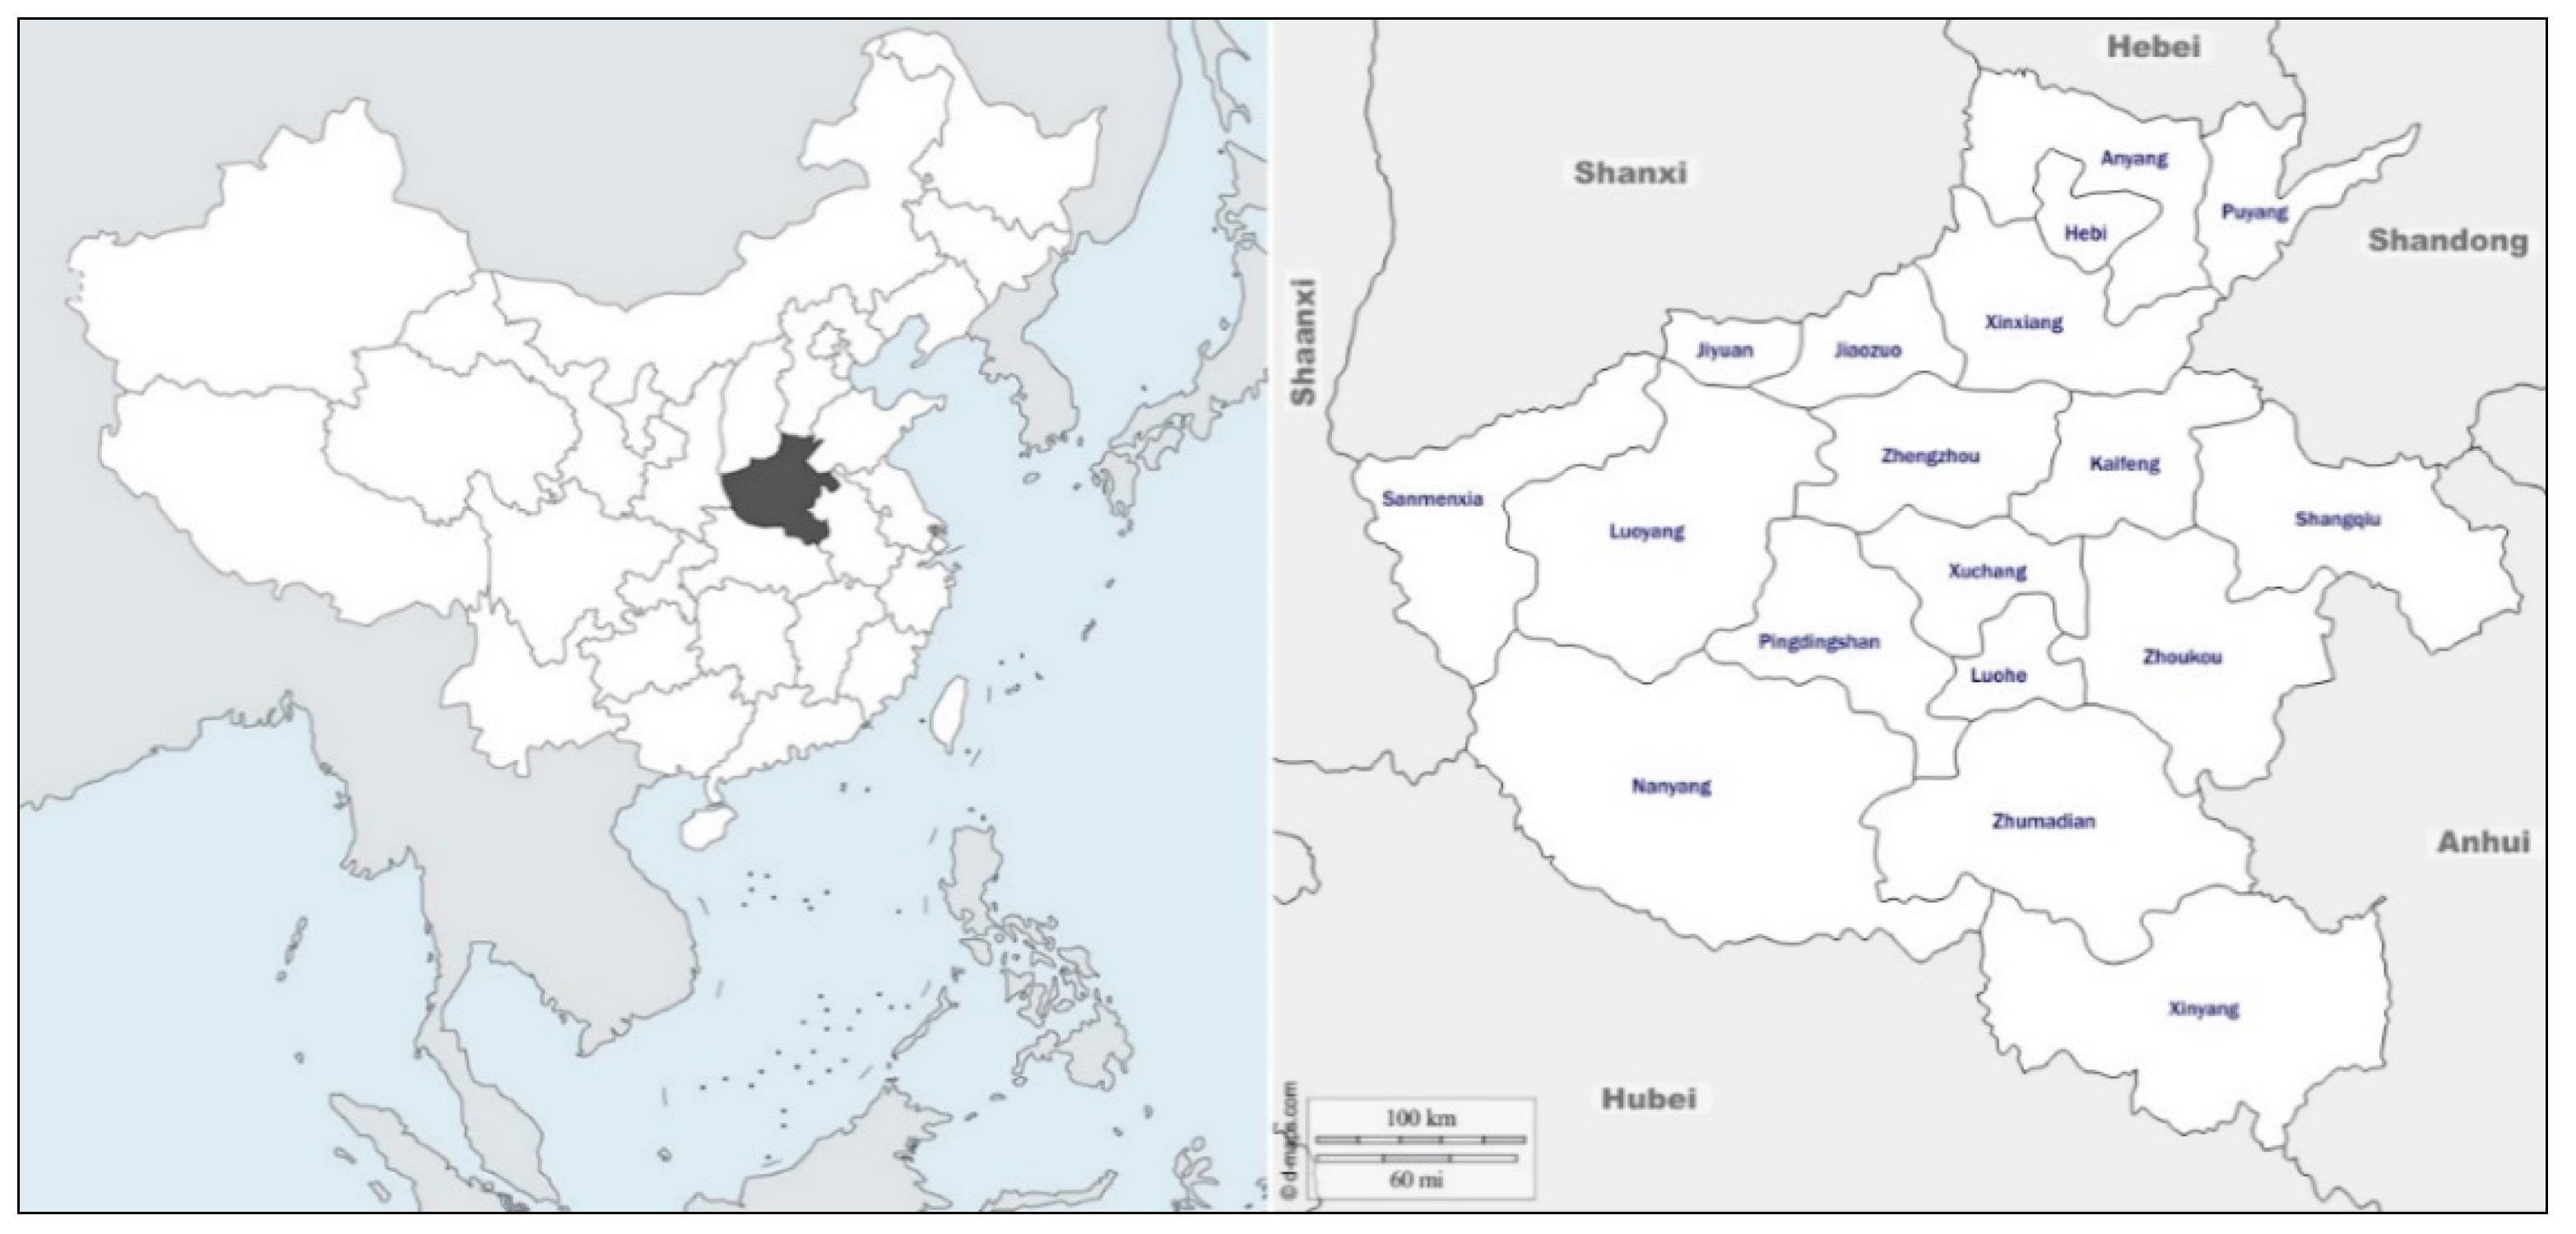
Henan Province, which is the intersection between open coastal regions and central and west regions in China (31°23′–36°22′ N, 110°21′–116°39′ E), was chosen as the study area. It is next to Anhui Province and Shandong Province on the east, Hebei and Shanxi on the north, Shaanxi on the west, and Hubei on the south. It is an important traffic hub and center of passenger flow, logistics flow, and information flow in China. The total area of Henan Province is 167,000 km
2, and it accounts for 1.74% China’s national territory area. The geographic positions of Henan Province and other cities are shown in
Figure 2.
Influenced by continental monsoon climates, Henan Province enjoys four distinctive seasons in a year, and it comprises the typical arid and semiarid regions in China. The total annual average water resource in Henan Province is 41.4 billion m3, which accounts for 1.43% of total national water resource. Moreover, due to the large population, the per capita water resource is only approximately 383 m³ in Henan Province, which is equal to 20% of the national average level and less than 4% of the global mean value. The water shortage is severe. Moreover, water shortage in Henan Province has intensified in recent years because of the rapid economic growth, fast urbanization, and sharp population growth. As a result, water demands of the Henan Province cannot be met. In addition, excessive development of groundwater decreased the annual water supply of watercourses and deteriorated the water environment. In a word, limited water resource is the main constraint against the sustainable social and economic development of Henan Province. Faced with serious water supply–demand contradiction, improving water utilization effectively and promoting sustainable development of water resources are essential choices of Henan Province in the future. Therefore, Henan Province must urgently adopt scientific and effective methods to measure local green efficiency of water resources and seek an effective means to improve green efficiency of water resources, aiming to provide managers with references for future policy making.
For scientific and reasonable green efficiency assessment of water resources in Henan Province, data of 18 prefecture-level cities of Henan Province (Zhengzhou, Kaifeng, Luoyang, Pingdingshan, Anyang, Hebi, Xinxiang, Jiaozuo, Puyang, Xuchang, Luohe, Sanmenxia, Shangqiu, Zhoukou, Zhumadian, Nanyang, Xinyang, and Jiyuan) during 2011–2018 were chosen as DMUs of the evaluation model. In this case study, the previously constructed SBM–DEA model was used. Input and output indexes were chosen with reference to the above text (
Table 2).
The data of 18 cities of Henan Province during 2011–2018 were collected from the Annual Report of Environmental Statistics of Henan Province (2011–2018), Bulletin of Water Resource Statistics of Henan Province (2011–2018), Statistical Yearbook of Henan Province (2011–2018), Water Resource Bulletin of different cities of Henan Province, Bulletin of National Economy and Social Development Statistics (2011–2018), and R&D funding published by the Department of Science of Technology of Henan Province from 2011 to 2018. Based on these data, green efficiency of water resources in Henan Province and influencing factors were analyzed.
4.2. Green Efficiency Assessment of Water Resources
Based on the abovementioned model and calculation method, a leading production function was set up using the collected sample data of 18 cities of Henan Province. Green efficiency of water resources in Henan Province during 2011–2018 was assessed with the SBM–DEA model according to Equations (1) and (2). Finally, the undesirable SBM–DEA model in the professional software MaxDEA Ultra 8 of the DEA model was applied to verify the calculated green efficiency of water resources. The detailed assessment results are listed in
Table 3. Columns 2–8 explain the green efficiency of water resources in 18 cities within the study period, whereas column 9 refers to the mean green efficiency of water resources of different prefecture-level cities. Similarly, rows 2–19 in
Table 3 are green efficiency values of water resources of different prefecture-level cities in different years, and row 20 is the provincial mean of green efficiency of water resources.
Table 3 reveals the following observations:
(1) During 2011–2018, the mean green efficiency of water resources of Henan Province is 0.504. The provincial mean and means of different cities in different years are lower than 1, indicating the generally low green efficiency of water resources and a large space for improvement in Henan Province. In the future, Henan Province must reduce water pollution, develop water resources reasonably under low pollution conditions, and increase green efficiency of water resources. Water resources should also be allocated more reasonably to assure water supply–demand balance.
(2) Actions that Henan Province are implementing, such as strengthening comprehensive water environmental governance and formulating sewage emission standards, not only enhance environmental protection consciousness of residents and enterprises objectively, but also explain the improved green efficiency of water resources in Henan Province during 2011–2015. However, green efficiency of water resources in Henan Province declined during 2015–2016 as a response to the rapid economic growth, urbanization, and industrialization.
(3) During 2017–2018, green efficiency of water resources in Zhengzhou City valued 1, indicating that water resources in Zhengzhou City achieved equilibrium among economic, social, and environmental benefits. The green efficiency value was ideal.
(4) Among 18 prefecture-level cities of Henan Province, only four cities once had or are having ideal green efficiency of water resources (value = 1). More than three-quarters of the cities never gained the best green efficiency of water resources during 2011–2018. Intuitively, the data also reflect the great regional differences in green efficiency of water resources in Henan Province.
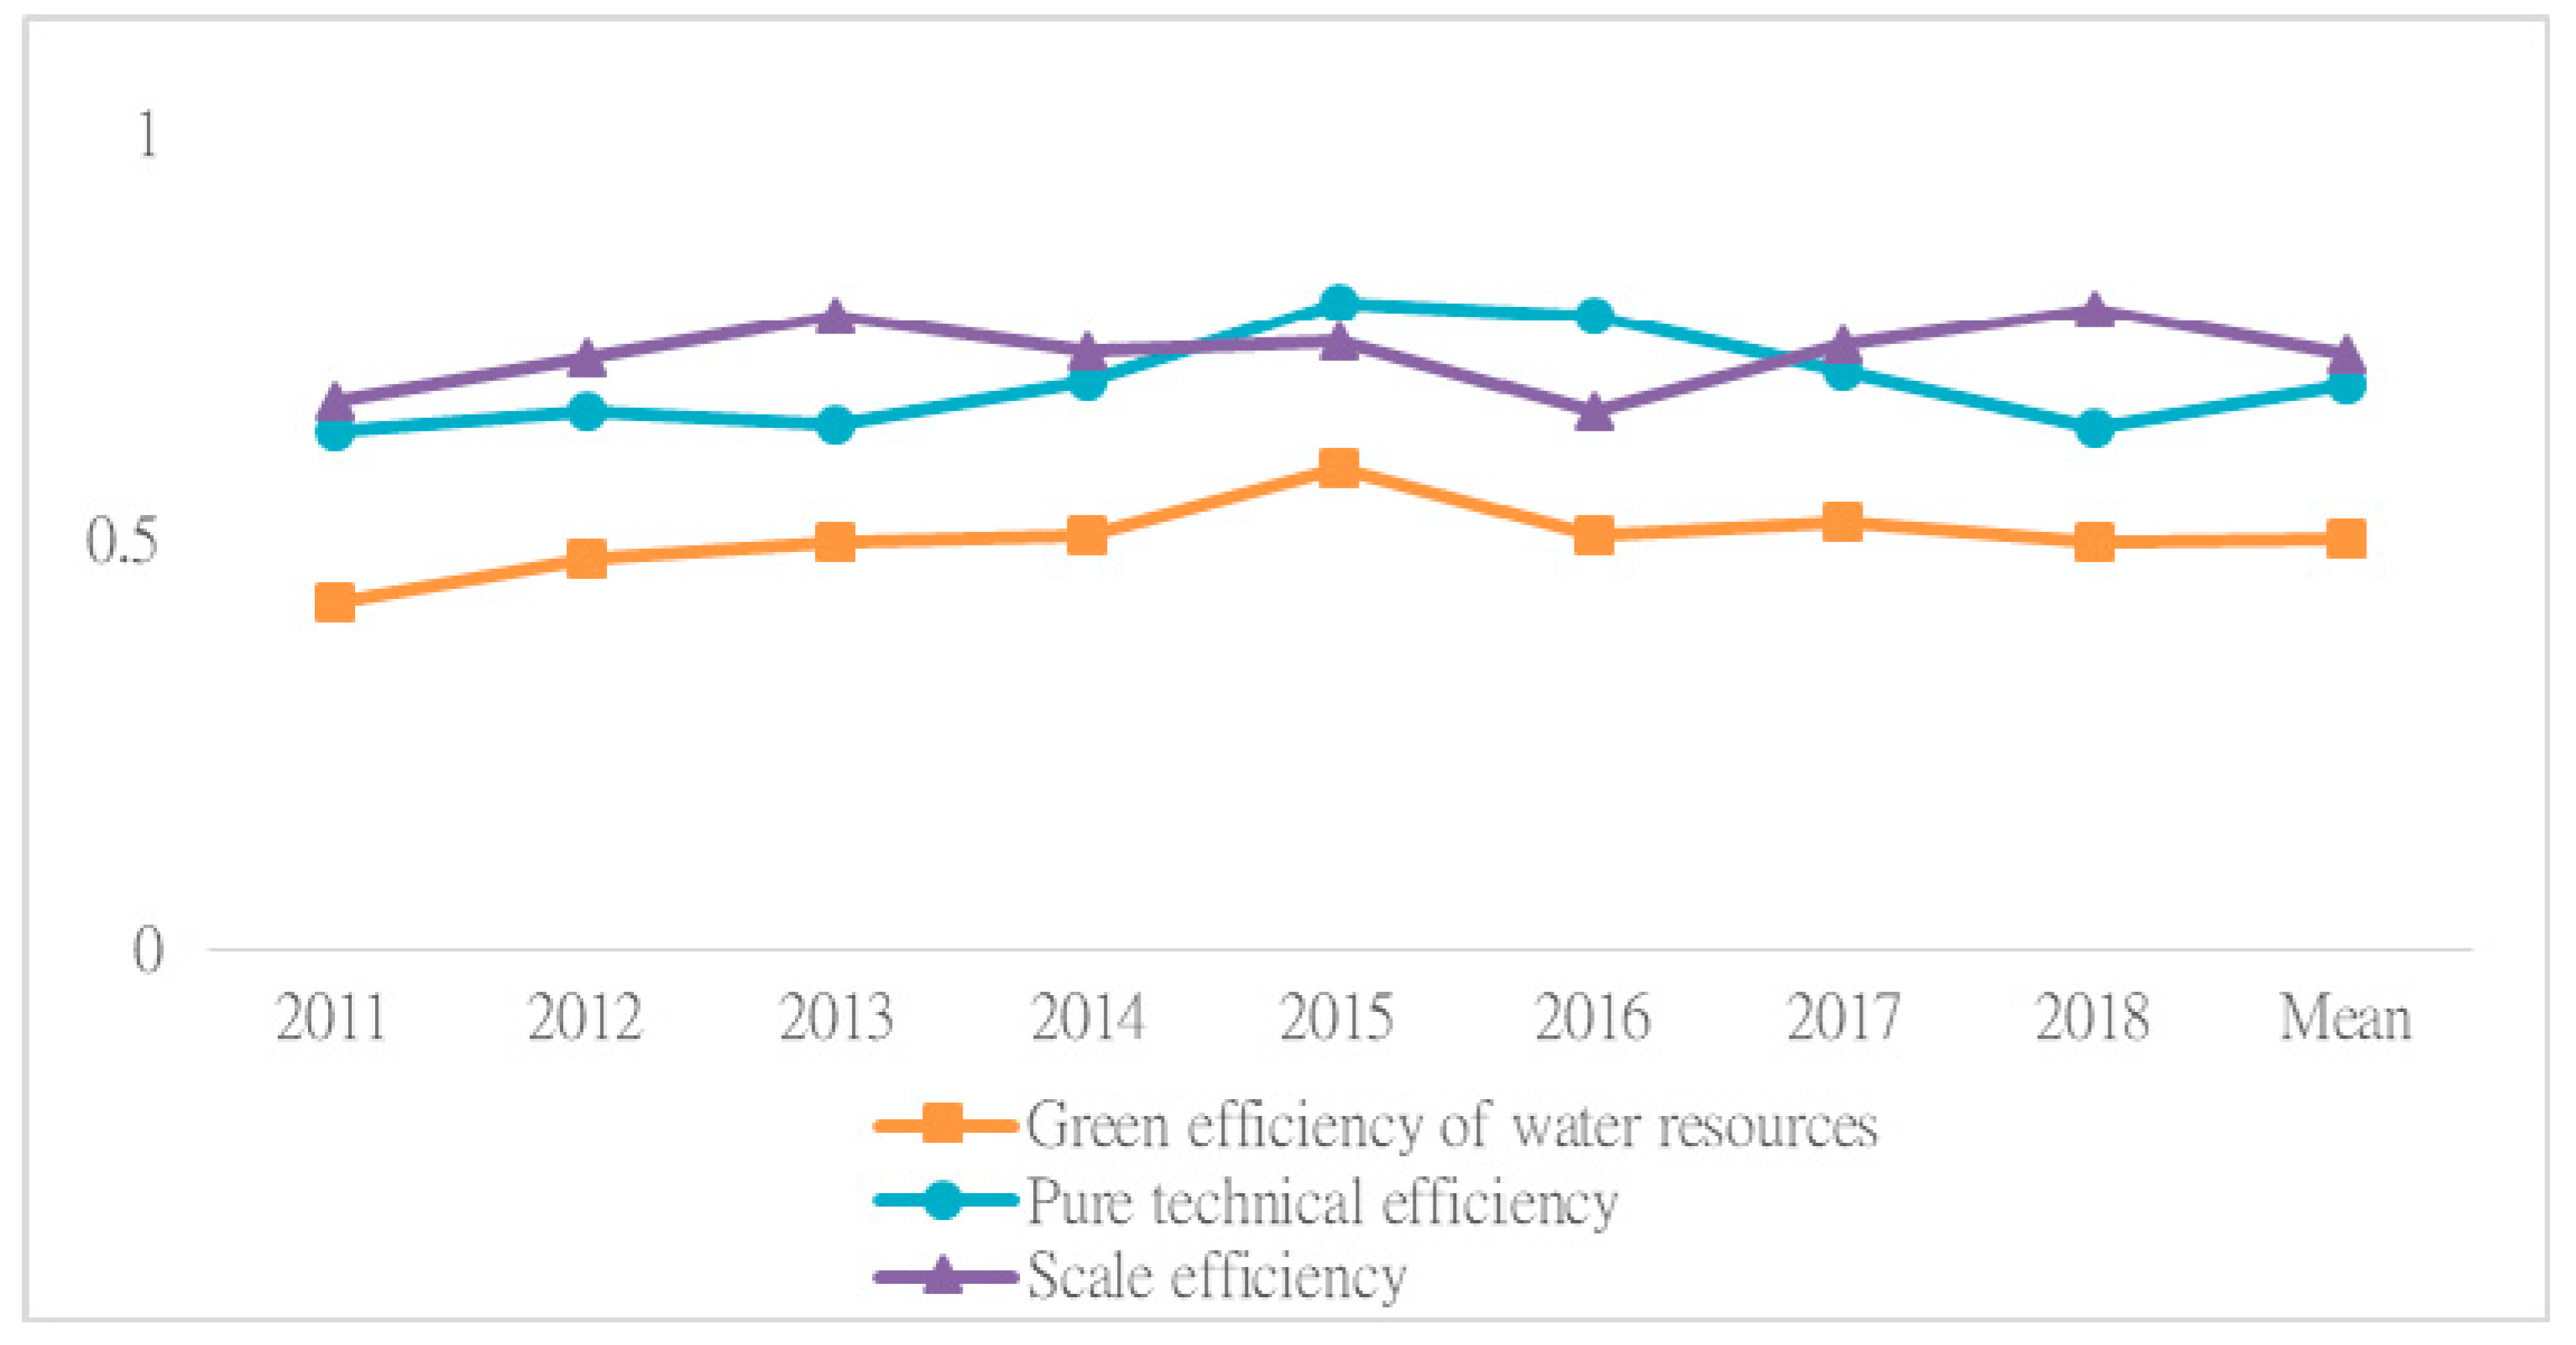
The decomposition results of green efficiency of water resources in Henan Province during 2011–2018 are shown in
Figure 3. In the study period, means of pure technological efficiency and scale efficiency in 18 cities of Henan Province are 0.692 and 0.728, respectively. The scale efficiency is higher than the pure technological efficiency. Hence, Henan Province should improve the level of water resource management and water pollution control technology in all cities under the premise of a reasonable water consumption scale. According to variation trend, green efficiency of water resources in Henan Province increased from 0.425 in 2011 to 0.498 in 2018, implying that water environmental governance in all cities had achieved preliminary effect and that all cities have gradually realized the importance of reasonable control of water use scale and water environmental protection. Specifically, the scale efficiency increased from 0.671 in 2011 to 0.783 in 2018, whereas the pure technological efficiency increased from 0.634 to 0.636, indicating that the growth of scale efficiency was the main contributing factor to the increased green efficiency of water resources in Henan Province. Moreover, technologies for water resource processing have a great space for progress.
The decomposition results of green efficiency of water resources in Henan Province during 2011–2018 are listed in
Table 4. On this basis, the study area can be divided into high-value, middle-value, and low-value areas in terms of green efficiency of water resources. The results are shown in
Table 5.
In
Table 5, green efficiency of water resources in Henan Province was at a low level, and the regional differences were great. During the study period, Zhengzhou, Xuchang, Sanmenxia, and Jiyuan were high-value areas, indicating that these cities integrated economic, social, and environmental developments in water resource use. Luoyang, Hebi, Jiaozuo, and Luohe were middle-value areas, indicating that green water–conservation society construction had achieved preliminary effect. However, scale efficiency and technological efficiency have space for further improvement. In the future, Henan Province should pay attention to the industrial aggregation effect and technological-driven effect to assure synchronous development between reasonable allocation of water resource and water pollution processing technology. The remaining 10 cities, including Kaifeng, Pingdingshan, Anyang, and Xinxiang, were low-value areas, with green efficiency of water resources lower than the provincial mean value (0.504). This demonstrates that green efficiency of water resources in most cities of Henan Province is low, revealing a great challenge in sustainable water utilization and water environmental governance. These cities have to further optimize resource configuration and improve water pollutant processing technology to increase local green efficiency of water resources.
4.3. Influencing Factors of Green Efficiency of Water Resources
After estimating the green efficiency of water resources in 18 cities of Henan Province, most cities belong to low-value areas, and Henan Province still has a large space to improve green efficiency of water resources. Facing this condition, green efficiency of water resources in different cities was further used as the explained variable, and appropriate influencing factors were chosen as the explanatory variables. Influencing factors of sustainable green efficiency of water resources were explored through a Tobit regression model.
Based on Equation (3), the analysis described above, and the Tobit regression model, the influencing factors of green efficiency of water resources in Henan Province were calculated by Stata 13.0 by using means of water consumption intensity, government water environmental control strength, technological input, abundance of water resources, and marketization level in 18 cities of Henan Province. The results are listed in
Table 6.
According to the regression results in
Table 6, the influencing mechanisms of different factors are analyzed as follows:
(1) The regression coefficient of water consumption intensity was −0.3162, and the regression coefficient of technological input was 1.2417. Water consumption intensity and technological input were significantly correlated with green efficiency of water resources in Henan Province. This was caused by the relatively high proportion of industrial and agricultural water consumption, poor water conservation consciousness of the public and production department, and backward water pollutant processing technologies in Henan Province. The province must pay attention to lower the water consumption intensity and increase the economic effect of water resources and investment technological R&D of the water environment. Improving water-saving, emission reduction, and sewage processing technology are key measures to increase green utilization of water resources and improve water environmental quality.
(2) The regression coefficients of abundance of water resources and marketization level were 0.2580 and 0.4073. Both failed to pass the significance test, probably because when water resources in a region abound, the public may ignore water conservation automatically. However, people’s consciousness of water saving has been increasing year-by-year recently, so the abundance of water resources influenced green efficiency of water resources slightly. Additionally, the proportion of tertiary industry in Henan Province has been increasing year-by-year, and the original extensive economic development mode had been changed. Nonetheless, the overall marketization level of Henan Province was not very high, and the regional differences were significant, resulting in limited influences of marketization level on green efficiency of water resources.
(3) The regression coefficient of government water environmental control strength was −0.3524, indicating that the green efficiency growth of water resources was inhibited if the government increased water environmental control strength. However, the degree of such influence was not very significant. This was because Henan Province implemented water pollution control for a short period, and most enterprises in the province were transforming and updating to green industries. In the short run, strict water environmental governance policies may lower the industrial output of Henan Province, and enterprises that adopted green production have not yet created relevant output. As a result, green efficiency of water resources was inhibited in Henan Province. In the long run, green efficiency of water resources in Henan Province will reach a new high when enterprises complete green production updating and form economic output.
5. Conclusions and Enlightenments
5.1. Conclusions
To realize sustainable economic and social development, an SBM–DEA model that contains undesirable output is constructed by combining the DEA to assess green efficiency of water resources. The action mechanisms of relevant influencing factors are investigated through a Tobit regression analysis model. Moreover, a case study based on Henan Province is carried out with panel data for 18 cities during 2011–2018. Green efficiency of water resources in Henan Province and impacts of different influencing factors are discussed. The following conclusions are drawn:
(1) Sustainable green efficiency of water resources refers to the comprehensive utilization of water resources under the premise of harmonious economic–social–ecological development. In the evaluation, social benefits are considered into the input–output system by combining economic and environmental factors. Doing so is conducive to better reflect connotation of sustainable development and make assessment results scientific and reasonable.
(2) The SBM–Tobit model is applicable to analyze the action mechanism of influencing factors, and it can analyze green efficiency of water resources scientifically and reasonably. Based on the conversion of a qualitative problem into quantitative calculation, the action routes of influencing factors on sustainable green efficiency of water resources in social development can be concluded. The SBM–Tobit model shows relatively good universality and feasibility. This research method provides a new idea and method to control water pollution, improves measurement of green efficiency of water resources comprehensively, and explores influencing factors. Some policy suggestions for controlling water pollution and promoting sustainable use of water resources in developing countries during the urbanization process are proposed.
In a word, the SBM–Tobit model that considers undesirable output is used to evaluate green efficiency of water resources and analyze influencing factors. The ways to improve green efficiency of water resources can be determined, and key attentions should be paid to the effects of influencing factors to lay the foundation for improving green efficiency of water resources of regions.
5.2. Limitations and Prospects
This study has two limitations, which lead to future research directions.
First, sustainable green use of water resources is a process of interaction among multiple subjects and multiple routes. It involves an extensive scope and abundant influencing factors. In the construction of an index system, only available statistical data with certain economic significance are chosen as indexes to overcome limitations in data acquisition and avoid influences of subjective factors on empirical test results. This approach may cause failures in comprehensive green efficiency assessment of water resources in a region. To further perfect the index system and increase the accuracy of efficiency assessment, future studies have to consider regional influences of energy-saving, environmental protection education, and urban development level.
Second, the applicability and generalization performance of the proposed model have to be further verified due to differences in geographical situation and climatic features in diverse regions, and long-term living habits of residents. In the future, the model must be further revised according to situations of study areas to enhance applicability.
5.3. Enlightenments to Management
According to the conclusions, the following enlightenments to water resource management can be gained.
First, it should as early as possible increase capital investment to R&D of technologies related to green efficiency of water resources, strengthen technological training, train and introduce scientific technicians, and break bottlenecks in sewage processing technology. Attention should be paid to strengthening exchanges among prefecture-level cities in water pollutant processing technologies, shrink gaps among prefecture-level cities in water-saving and emission-reduction technologies, and further drive improvement of green efficiency of water resources in Henan Province based on technological innovation.
Second, industrial structure optimization and decreased water consumption intensity are suggested. Imbalanced industrial structure, poor water-saving consciousness, and water pollution are direct causes of the high-water consumption intensity and poor water environment. Hence, it must remain with the optimization and updating strategy of industries, accelerate elimination of industries and enterprises with high water consumption and excessive sewage emission, and expand the tertiary industry that focuses on the service and high-tech industries. These courses of action will ultimately decrease excessive use of water resources and pollutant emissions.
Third, it should firmly adhere to strict water environmental governance policy. Strengthening water pollution and water consumption control can lower green efficiency of water resources in Henan Province in the short term, and doing so will surely stimulate transformation and updating of industries and enterprises in the long term, and further improve green efficiency of water resources. In turn, a good environmental control effect is one that urges the public to change their lifestyle and further strengthen their consciousness of water conservation.


