1. Introduction
In the field of production, including in tire manufacturing, a continuous development approach implies critical problems identification and prioritization [
1].
Organizational performance takes into account two main factors: (1) behavioral quality management practices, which include the commitment of management, employees, customers, and suppliers, and (2) technical quality management practices, including strategic planning, process management, benchmarking, and the analysis of information [
2]. The role of management is essential for the improvement of quality, as well as for the commitment to understanding the needs and to innovating the business processes [
3]. According to ISO 9001: 2015, understanding and managing the correlated processes within a management system support the increase of the organization’s efficiency, effectiveness and resources economy, the final aim being to obtain the desired results [
4].
The continuous improvement of quality and processes is a fundamental strategy in an organization, and such an approach brings many benefits regarding the optimization of the manufacturing time, cost reduction, and improvement of the overall activity. Process management aims to monitor and control the processes defined in an organization [
4]. Quality management practices, effectively supported by top management, lead to processes efficiency [
5]. Performance management can incorporate essential management models and practices to achieve the objectives [
6,
7].
The processes improvement depends on the management’s commitment and the employees’ efficiency. The relationship between management and the rest of the employees, focused on processes innovation, improvement and development, finally leads to efficiency and good quality for the products [
8]. The organization should determine the opportunities for improvement and therefore implement the needed actions. The development of opportunities should be identified by analyzing the quality management system and considering the process results. The process outcomes should be continuously measured and monitored using data extraction techniques [
9].
Globalization and competitiveness in the markets are growing, adding pressure on companies to reduce costs and to adapt rapidly to consumer preferences or market regulations [
10]. To have a successful improvement strategy, all stakeholders should be considered, and dedicated objectives and measures should be targeted [
11], including processes streamlining, too.
The main pillars for process improvement may be seen in
Figure 1.
Considering the accelerated evolutions that organizations must compete, rigorous attention should be paid to numerous factors affecting them, along with their processes. In this sense, companies have to pay attention to their products’ quality, to control the deadlines of manufacturing and delivery, as well as the costs linked with the rapid development of the market and the increasing and difficult-to-meet demands [
12].
Many studies show how quality management methods are used successfully in business development [
13], and in order to remain competitive, it is necessary to continuously consider the adaptation of business models [
14]. Developing a sustainable strategy [
15] involves focusing on three significant areas of interest: (1) environment protection by respecting the norms in the field, (2) social responsibility by adopting a correct strategy regarding business ethics, and (3) economic responsibility [
5].
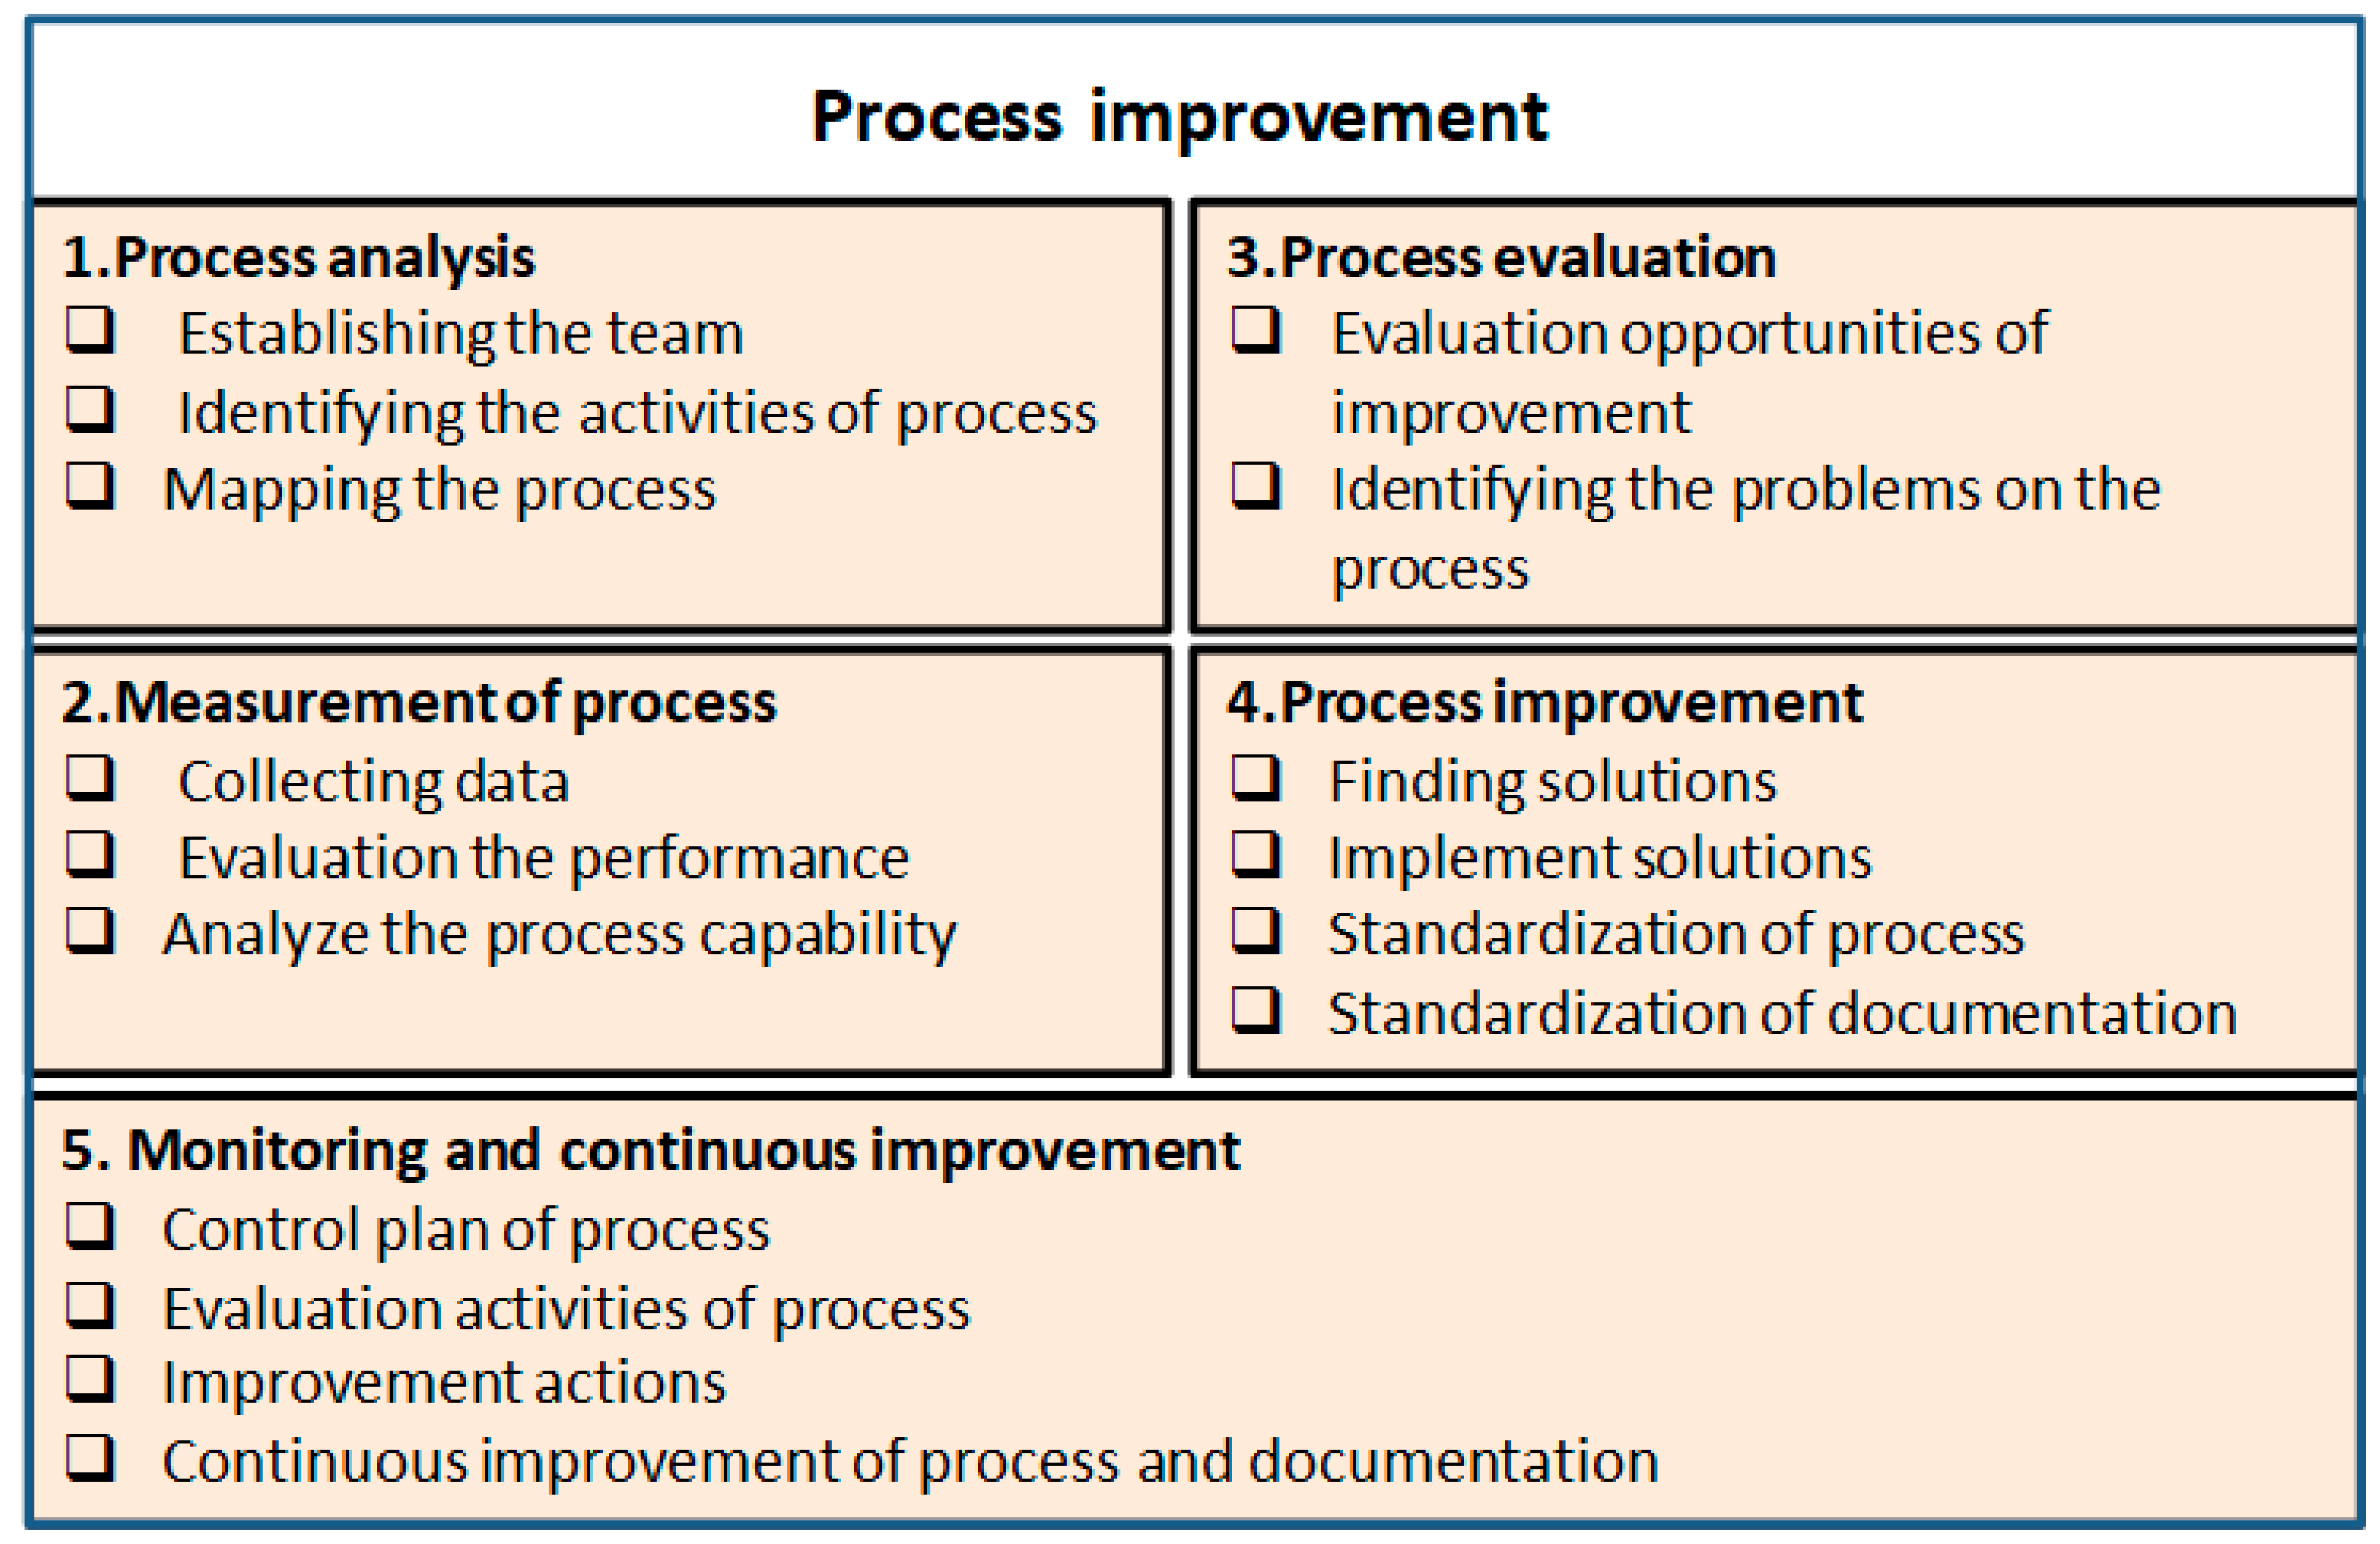
The development and improvement of processes may by structured in four main stages, as proposed in
Figure 2 [
16]. The first step, process planning and organization, consists of nomination of a team for identifying the process activities and for detecting the need for improvement.
The second stage, the process enhancement, concludes the process capability analysis by collecting data from the process activities. The third stage, process evaluation, uses quality assessment methods, such as brainstorming, Ishikawa charts, and Pareto charts, for identifying the problems’ root causes. The fourth stage, process improvement and monitoring, consists of implementing the identified solutions, updating the procedures, and standardizing the process. Finally, one may consider the fifth stage, aiming to sustain the process performance by monitoring and continuous improvement [
17].
In order to develop the manufacturing system in a sustainable environment, it appears important to evaluate the system and to understand the performance level in the industry, by taking into account the mentioned stages which are part of three major areas: economic, social and environmental. Our project has focused mainly on the economic area by addressing how to comply with the market regulations (Economic Commission for Europe (ECE)) and aiming to improve process performance.
In the manufacturing environment, organizations remain competitive when they are able to effectively solve problems that occur in production processes, such as production bottlenecks, inability to produce, poor product quality, high production costs [
18].
Process management is backed up by measurement and analysis activities, and is led by leadership and strategic process planning, paying great attention to the customer and market [
5]. In the industry with very high competitiveness between companies, the improvement of processes is essential, therefore systems of methods are integrated, in order to help identifying the factors and activities for improvement [
19]. Quality tools help to optimize manufacturing time, streamline processes, minimize losses, increase productivity and consequently improve quality. Organizations that use quality instruments are more efficient, flexible, and manage to deliver quality products at reduced costs.
Process optimization [
18] refers to eliminating costs with low quality, eliminating correction operations, waste, overproduction, bottlenecks, and to optimizing time. After identifying the components that slow down the processes or lead to high manufacturing costs or high production times, one may continue to the stage where the methods are identified, thus optimizing the productivity and streamlining the processes [
20].
The main benefits of applying continuous improvement are related to improving product quality, improving manufacturing times, optimizing costs, streamlining processes, and increasing competitiveness.
2. Case Study
2.1. Starting Situation
The case study, the process of tire manufacturing, presented multiple problems that need to be solved in order to improve the performance.
The starting point is given by the process deeper analysis, implemented by a dedicated team, to identify the process’ activities [
16], using the mapping method of processes (suppliers, inputs, process, outputs, customers) [
20].
The purpose of the team is to monitor and identify possible problems in the manufacturing process. This team works closely with the quality manager to establish and validate the improvement plan.
2.2. Description of the Tire Manufacturing Process
The tire manufacturing process is organized as presented in
Figure 3. The main stages present the following areas: mixing–compound–components–building–curing–finishing.
Process mapping is a tool for showing series of events that produce an end result (
Table 1). A process map shows the steps of activities and people who are involved in, and it offers a way to understand the process and the areas where improvement should be relevant. The representation reveals the inputs and the outputs for each stage of the process and the associated internal suppliers and customers.
In connection to
Figure 3, in
Figure 4, the tire manufacturing process is presented.
The two main ingredients of the tire are natural rubber and synthetic rubber. In addition, chemicals, textile materials and steel cord are used. The ingredients are combined depending on the type of tire being manufactured.
Mixing—The mixing area is organized vertically and represents a process where various types of rubbers are obtained for the next stage of the process. The materials obtained in the mixing area are made of natural rubber, synthetic rubber and various chemicals. The materials can be of several types depending on the type of tire [
22]. The ingredients are mixed by applying mechanical work, and blended so as to obtain a homogeneous mixture.
Compound—Ingredients are brought together in the required composition of rubber compound, so as to obtain the different mix of ingredients in accordance to the concerned component properties.
Components—During this process, all components are prepared for the curing stage. In compound area, the following components are obtained: tread sidewall, liner, filler, bead, steel belt, plies, chafer.
Building—The building process involves two operations: the first one, where the tire carcass is obtained by assembling inner liner with sidewalls and body plies, and the second one, where inflated carcass is applied on the belt and tread components. All parts from components area are used in the building sector, and the output of this process is a carcass, the semi-finished product.
Curing—The curing process is used to obtain the final shape of the tire and the tread pattern. It involves the chemical cross-linking of rubber and vulcanizing agents, the result being an elastomer. Curing is performed using heat and pressure in the mold of tire.
Finishing—In this manufacturing stage, final measurements are implemented. The tire is measured for force variation (uniformity measurement) in conditions of automatically mounted on wheel halves, inflated, and then run on a simulated road. Tire balance measurement means similar tires automatically mounted on wheel halves, and then rotated at high speed [
23].
2.3. Identifying Improvement Opportunities
Identifying opportunities for improvement begins with understanding the process by mapping it. The production flow is presented, the activities are analyzed and monitored. Finally, possibilities for developing the process are identified [
18].
2.4. Identifying Problems
The team responsible for monitoring activities in all stages, gathering opinions of all employees implied in the manufacturing process, finalized the identification of issues. Mapping the manufacturing processes, many problems can be identified, but among the critical ones, there are bottlenecks that lead to the interruption of production [
24] and eventually lead to decreased production capacity, decreased performance and increased costs [
18].
Following the analysis mentioned above, several problems were identified in the newly established area for preparing the molds for the curing process. The team dedicated to this project identified several interruptions, due to various causes that delayed the preparation of the molds for the curing process.
Taking into account the newly established area in the factory, several problems appear and lead to the extent of the manufacturing time; consequently, productivity decreases. The main objective targets are identifying the root causes of blockage leading to production shutdown, identifying productivity decrease, and slowing down the capacity of the entire production system. This type of problem leads to higher costs, but also to an inefficient process, as the expected results are not achieved [
25].
2.4.1. Root Cause Analysis
The causes that lead to the process slowing or even blocking can be multiple, starting from problems related to workers, working methods, procedures, and mode of operation, to the used equipment and how equipment is handled. Following the application of the Ishikawa diagram [
20], the possible causes that lead to the occurrence of blockage in the curing area are identified.
The mold washing machine is essential for the curing process, because each mold must be washed before entering in the curing cycle. The machine wear contributes to process slowdown, as maintenance should be frequent. Lack of procedures lead to errors in the machine settings. Sometimes, washing substances are not appropriately dosed; consequently, the molds are not washed well and cannot be used in the curing process, so the washing process should be repeated. All these issues can lead to increased tire manufacturing time, or may even block manufacturing for certain types of envelopes.
As can be seen in
Figure 5, following the performed monitoring and analysis, the curing process was slowed down or blocked, due to several possible causes.
Ishikawa diagram: the diagram was used for detecting the causes which lead to blockages of the curing process. These causes are identified as follows: without a procedure for setting the machine, the operators set the washing program arbitrarily, or use an inappropriate quantity of chemical solution. The lack of procedure and operating mode can definitely lead to the problem. Non-standardized activities lead to increased processing time, production blockage and losses with non-conform products [
26].
After analysis, the causes related to people can be revealed, such as lack of training, insufficient staff, lack of motivation, or carelessness.
Pareto chart: following determination of the causes that lead to the problem, the Pareto method (
Figure 6) was applied, in order to identify the associated roots.
After monitoring and analyzing the process, the main issues appear due to the activities in the mold preparation area. As seen in
Figure 6, the main causes leading to the problems were identified, grouping the causes in function of their occurrence during the monitoring period. After identifying the causes using the Ishikawa diagram, the Pareto diagram was used to highlight the 80% causes generating problems. The dedicated team made the classification of the causes by monitoring the activities for two weeks. Several issues have been identified, such as lack of procedures, workspace organizational problems, lack of training, machine settings and wear, insufficient staff, carelessness or storage of the molds. The first three causes lead to nearly 80% identified problems (
Figure 6).
The lack of procedures attracts many problems related to time, quality of tires, process stability, delivery of activities’ outputs and the training of new employees.
Several non-documented activities in the curing area were identified, such as:
lack of procedures for mounting and dismantling the molds,
washing molds at the washing machine,
washing mold rings on the machine,
sand blasting of the sidewalls of molds,
unlocking spring-winds of molds,
transport of molds in the hydraulic presses, these leading to production time increase and to inefficient process.
The workspace organization appears to be very important; it directly influences the activity in the working area and adds a lot of benefits in terms of efficiency. After monitoring and analyzing the process, opportunities for organizing workspace were identified, such as:
no delimitation of workspaces and pedestrian routes,
lack of labels for shelves of molds stored,
incorrect storage of tools,
incorrect storage of used screws and trash in the workspace.
Lack of training and insufficient staff—The main identified problems were the blockages of curing activity, long lost time for some activities, which means lost production time. When a manufacturing process stops for an unplanned event, it accumulates downtime of production.
Besides the problems related to the working procedures and organizational workspace, in this area, other problems generating the process blockage were found, such as problems in the washing machine molds. Each mold must be washed before entering the curing cycle, but unfortunately, the machine has poor capacity for washing all the molds necessary for the curing process.
Therefore, the number of molds washed and prepared for entry into the curing cycle was monitored for 15 days (
Figure 7). Several causes were found to be related to the washing machine: no working procedure was drafted, and each worker sets the machine in a different way. Moreover, the quantities of the cleaning substances were different. As seen in
Figure 7, the number of washed molds was not the same every day, and the expected results were not achieved, with an impact on shut down production.
2.4.2. ECE Changes on the Sidewalls of Molds
The abbreviation ECE comes from Economic Commission for Europe, which helps to standardize regulations in member countries. The ECE regulations include rules regarding sidewall symbols, tire markings, speed index and load index, durability and tire noise.
In accordance with ECE regulations, the company must modify the sidewalls of the molds with the ECE symbols to show compliance with the European norm. The sound produced by tires can be considered a sort of environmental pollution. That is why this regulation also refers to the noise that tires make.
In
Table 2, the ECE symbol can be identified by inserting the letter “E” or “e”, followed by a numeric code in a rectangle or a circle. The letter represents the ECE, and the number indicates the country where the tire was registered. As seen in
Figure 8, each country has its own number [
26].
The initial code is followed by a two-digit series. This refers to the series of regulations for tire certification, in line with different standards depending on the category.
For example, “02” is regulation for passenger tires and “00” for commercial tires vehicles. Other specific information, such as noise limits or wet traction, may be revealed as a second ECE symbol. As seen in
Table 2, tires that meet the regulations regarding noise and wet traction limits may have the second ECE symbol [
27].
The manufacturer has to comply with European regulation, so the ECE symbol visible on the tire sidewall proves the product certification. The company must receive the approval of the independent laboratory after performing the tests and confirming the validation of setting in place the manufacturing process. As a result, the ECE mark may be applied on the manufactured tires.
According to the management requirements, the changes must be made by week 15 with the application of the ECE norm (
Figure 9). Modifications to the mold sidewalls are made by the supplier, who has agreed to a plan for all changes. The molds sidewalls must be prepared for sending to the supplier for ECE modifications and, for this process, a plan depending on the production planning must be followed. The main issue in this process is preparing the number of molds planned for modification and sending them to the supplier.
According to the agreed plan between the tires plant and the supplier, ECE modifications will be planned as in
Figure 9. For planning compliance, the tires’ company must send 50 sidewalls per week to the supplier to be modified. As seen in
Figure 9, the supplier modified the received sidewalls and respected the agreement, but the company were not able to send the agreed number of sidewalls according to the planning.
The problems come due to the lack of organization and process standardization. From discussions with the operators, the main issue was the molds identification in the deposit. Due to many molds in the deposit, lack of procedures, and lack of labels on the shelves, much time was spent searching the correct molds.
3. Improvement Plan
The improvement must be correlated with the results’ analysis from the monitoring stage. The areas for actions are identified and the objectives for improvement are directly related to the main issues found, i.e., standardization in the mold preparation area for the curing process, drafting of working procedures, increased number of molds washed per day.
3.1. Implementation of 5S Method
In order to organize the activity and the working space of the mold preparation area, the improvement method 5S was implemented.
Sort step—In the first step of 5S, a broad investigation of all items in the working area (materials, tools, equipment, furniture etc.) is implemented, so as to separate what needs to be present versus what may be removed.
Before sorting the items, analyzing the area of molds’ preparation, several irregularities were identified, as seen in
Figure 10, such as a lack of labels on shelves and on the screw drawers. Different types of screw dimensions lead to increase in the mold assembly time.
Organizational problems were identified in the area around the washing machine, too, such as lack of layouts for washing machine trolleys and lack of layouts for containers with chemical solutions of washing machine (
Figure 11); these affected the mold washing activity.
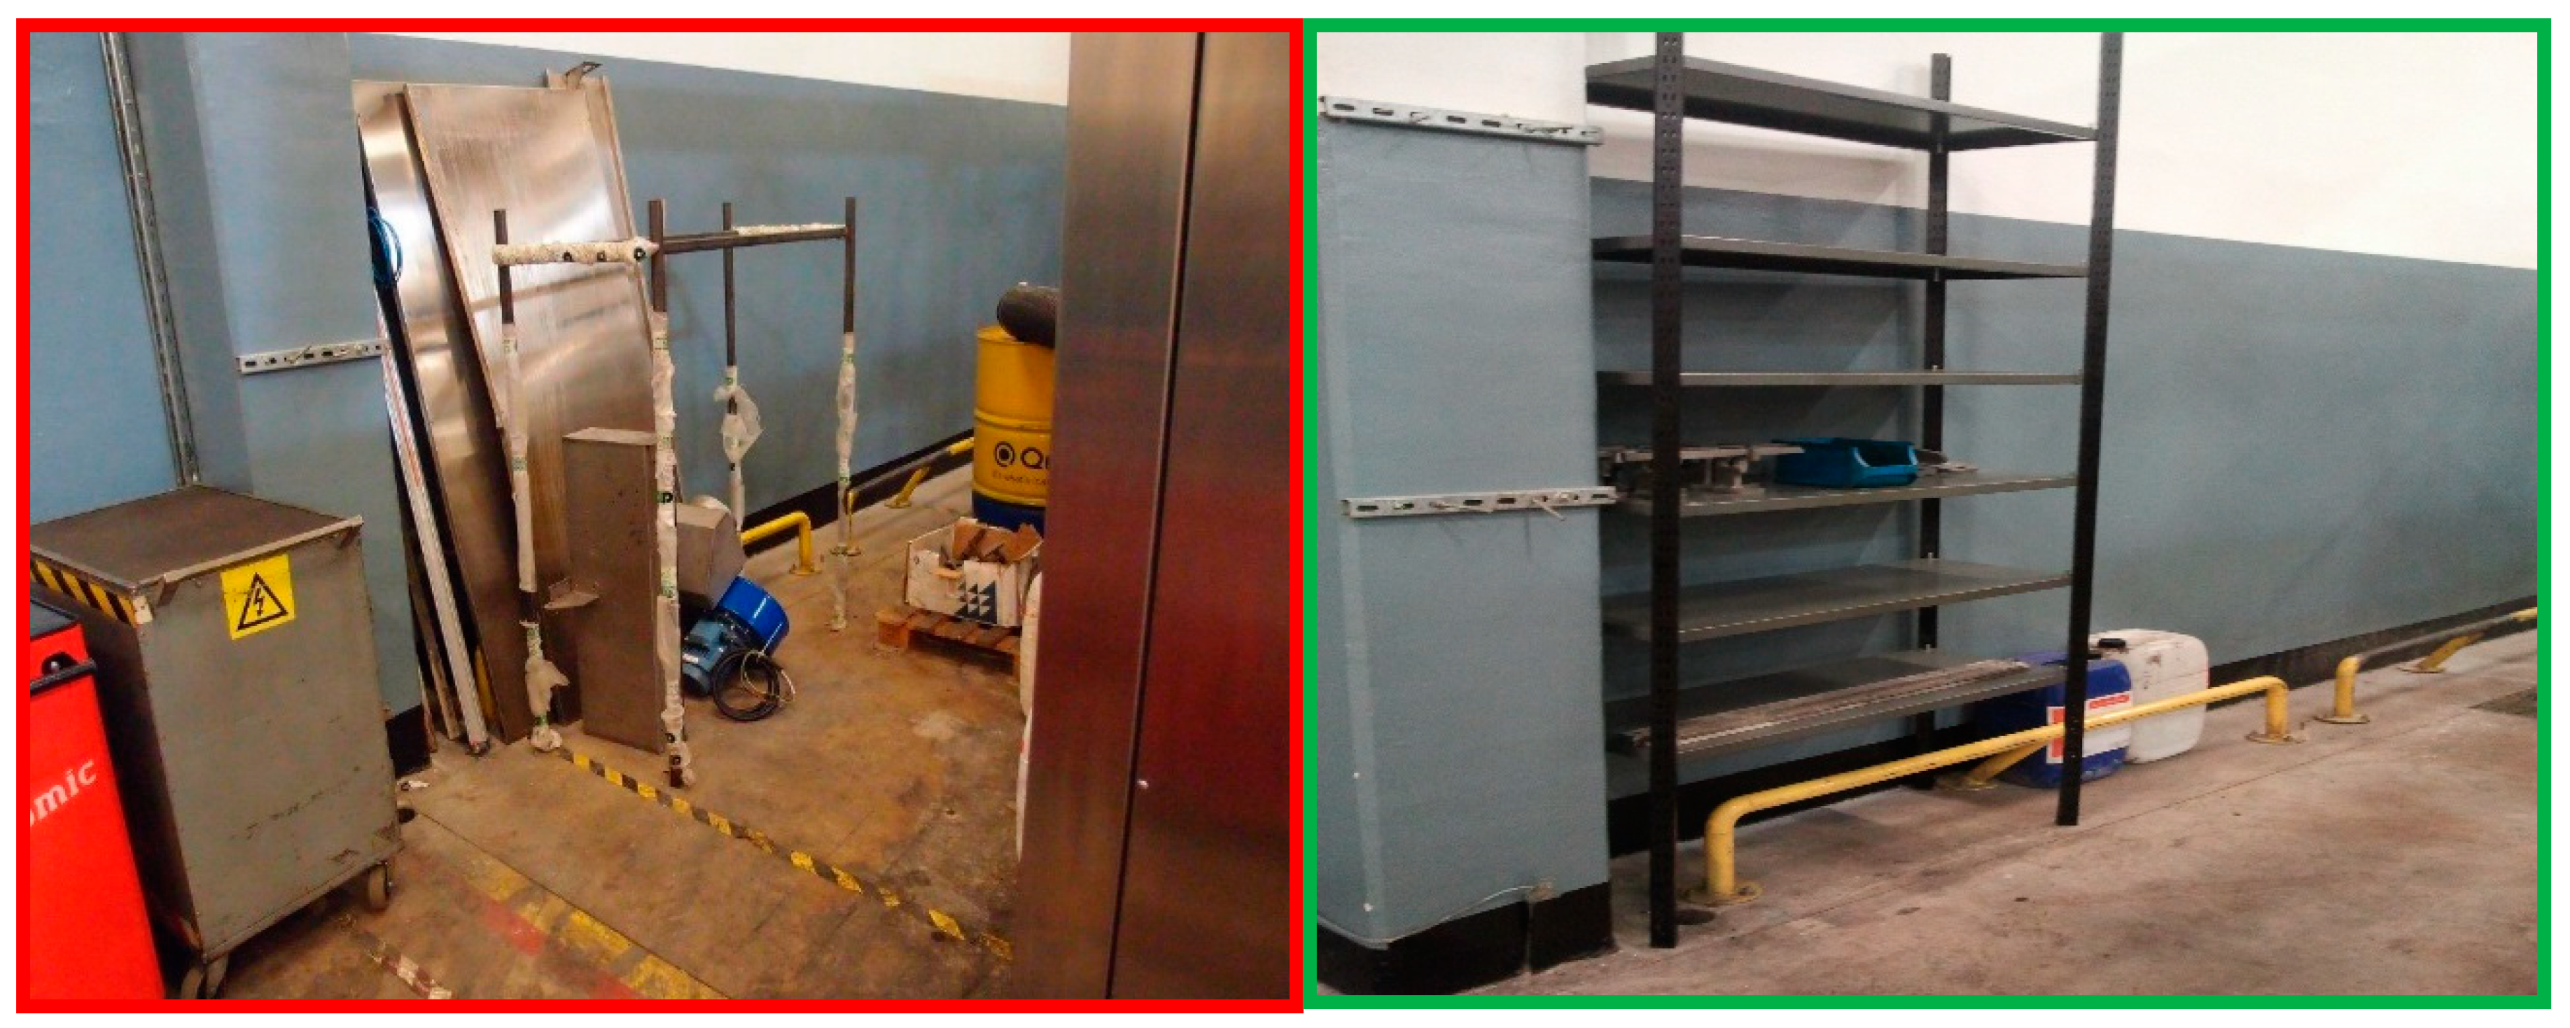
In the tool trolley area, as seen in
Figure 12, organizational problems were found, such as a lack of layouts for operator trolleys and trash. At this stage, all objects were identified and sorted. Objects that can be removed were stored, as seen in
Figure 13. Finally, in the sorting stage, all objects were identified, and their status to remain in the molds’ preparation area or to be eliminated was decided.
Straighten—Setting in order consists of arranging all objects in the right place so as to allow efficient use. In this phase, the ordering operations were carried out in the area. Working tools, mold components, fixing screws and other equipment must be located close to the area where these are used. Through all these organizational measures, employees spend less time looking for parts and items for their activities.
The screws ordering was done by sorting each screw and placing them according to the size (
Figure 14), so as to avoid searching and choosing the right screw for the assembly and mounting of molds on vulcanization presses.
After sorting the screws according to size, to facilitate quick access, they were placed in trays, and these were placed on shelves near the area where they were used (
Figure 15).
Shine—In the cleaning phase, the trash was collected, as well as useless things, cloths, broken screws and worn parts to be thrown away (
Figure 16).
Standardize—The aim of the standardization phase was to implement and reinforce of good habits in the working area; this is why the phase was documented and maintained.
Labels were created and applied for the screws arranged in trays (
Figure 17) or storage lockers (
Figure 18). The creation of labels ensures efficiency when searching for the needed screws and maintaining the habit of order, too.
Dedicated areas are established, with drawn layouts for the containers with chemical solutions for the molds washing machine (
Figure 19).
Similarly, areas with drawn layouts for the molds washing trolleys, as seen in
Figure 20, help to standardize the activity in the area, and to carry out the mold washing process regularly.
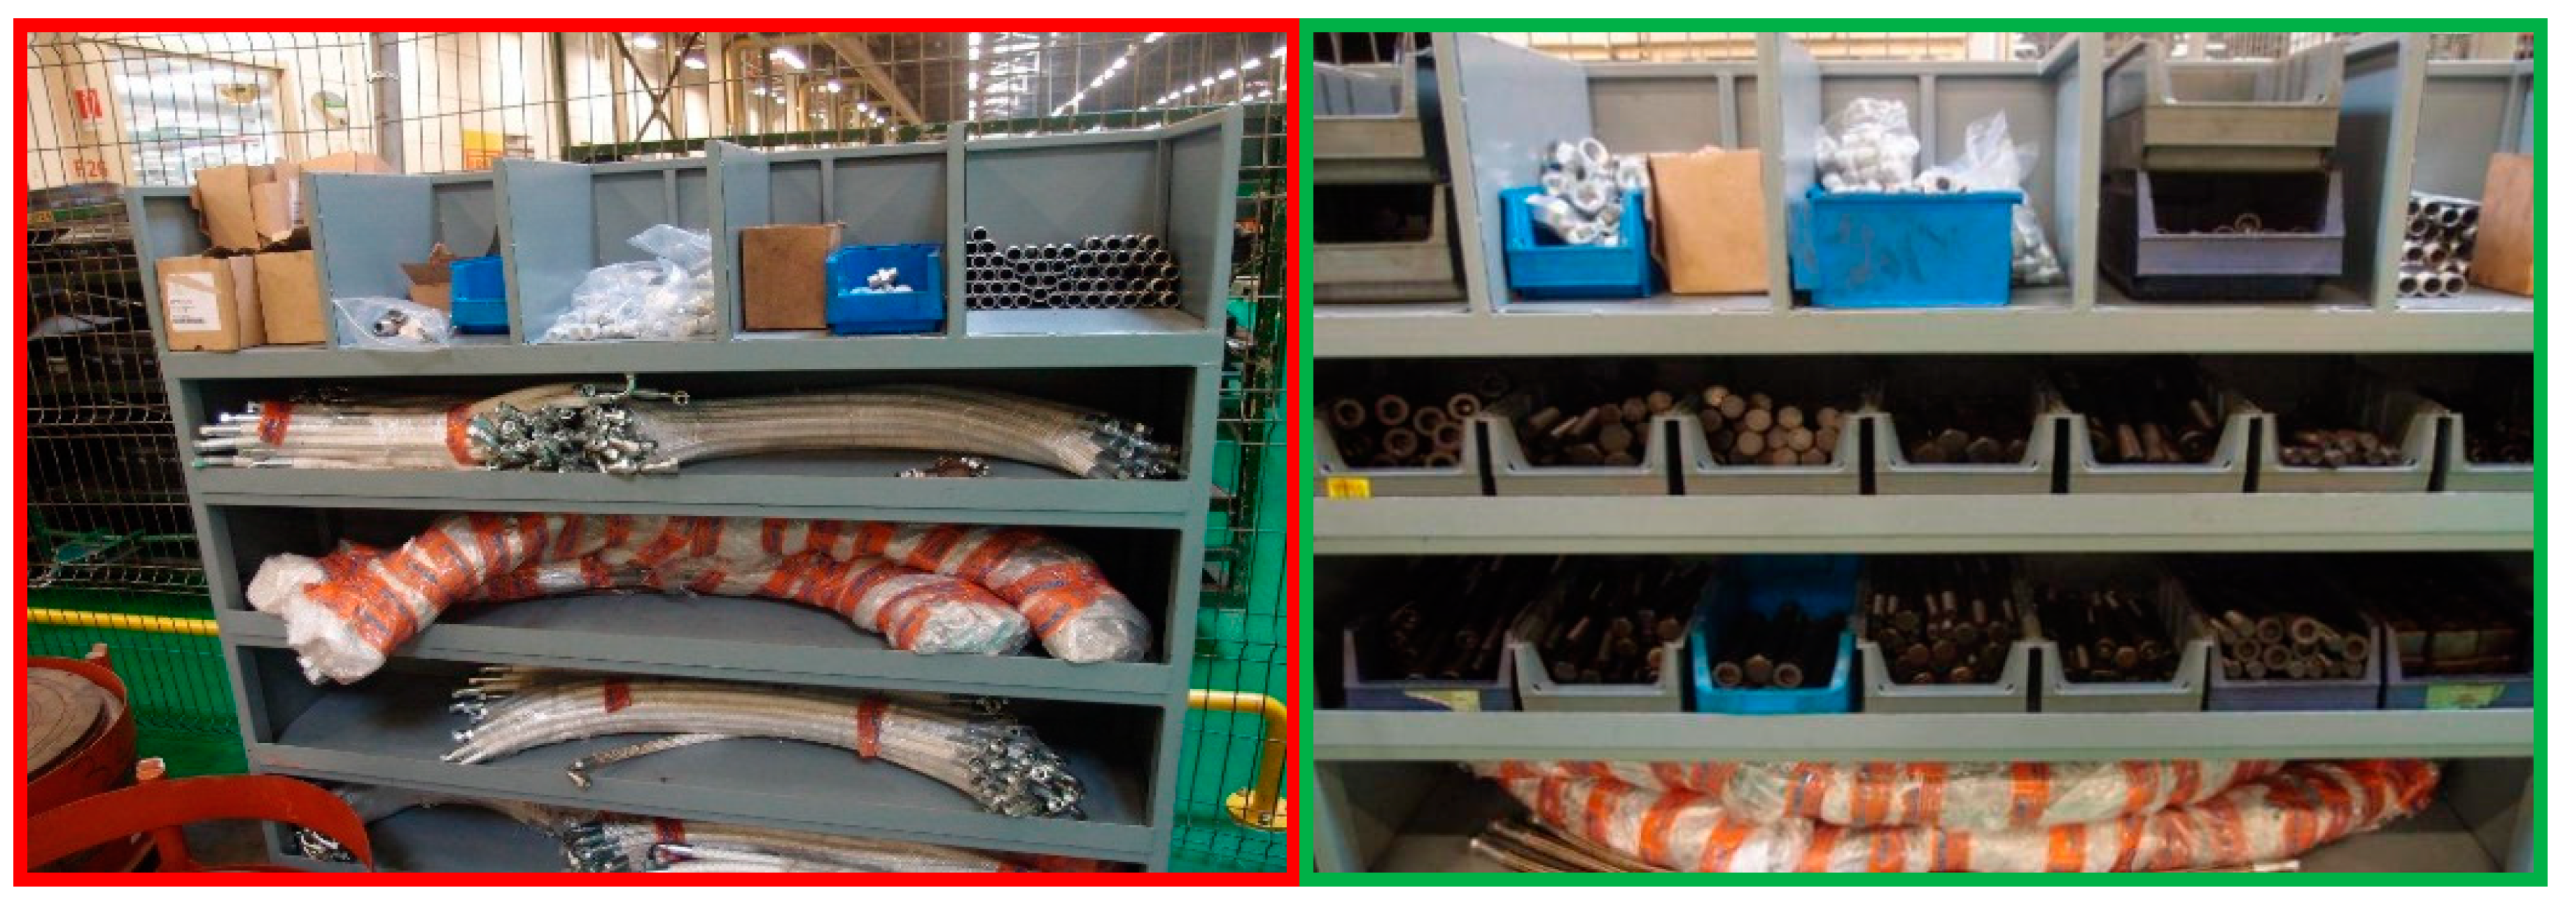
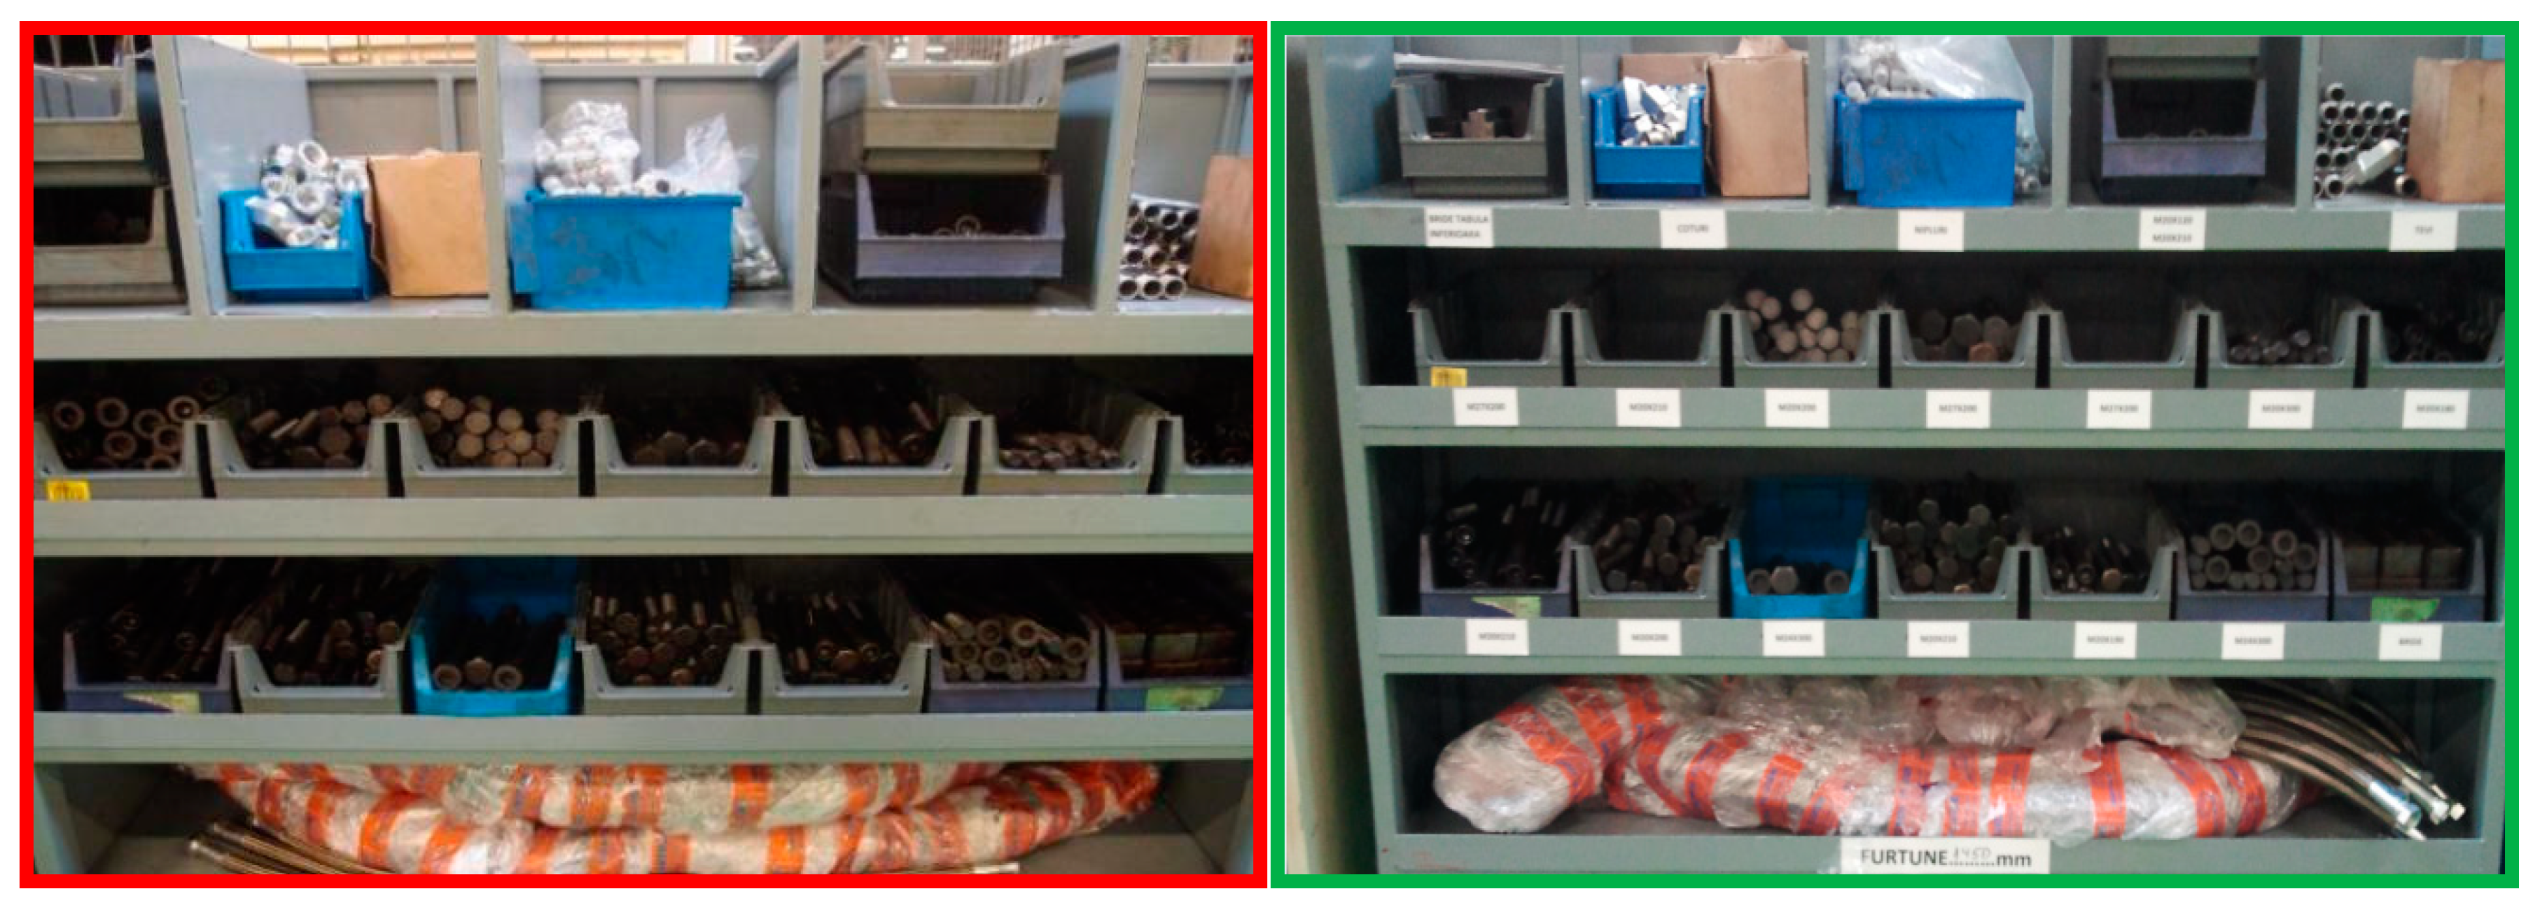
Labels for shelves with molds are essential for the curing process. Many molds of different sizes with particular specifications are stored in the mold area, so in order to avoid wasting time after mold cleaning, detailed labeling appears essential (
Figure 21).
Sustain—This step involves implementing good behaviors and habits in activities. Changing the habits is definitely very difficult and appears to be the major action for the effectiveness of the 5S method implementation.
The workers will tend to operate as in the past, so the main objective is to change those habits. For updating the good habits, a training topic named one point lesson (OPL) was chosen to present the new organized habit on each aspect of an equipment, machine, operating mode or testing procedure. OPL presents, in comparison, previous versus improved working organization, so as to stimulate people to proceed correctly (
Figure 22).
3.2. Standardization of Activities through Working Procedures
The process standardization implies drafting the necessary procedures for the activity, in order to increase productivity and reduce production times, but also to improve organizational performance [
28].
The activities standardization consists of procedures’ drafting following activities organization, presents regulated working practices, helps to better understand the activities, and facilitates continuous improvement.
For drafting working procedures, the area of mold preparation was monitored for three weeks, to identify best practices and to standardize processes.
The first step in carrying out the procedures has been to monitor the activity for several consecutive days, to observe how each operator from each shift works. In order to identify the problems and to find the optimal solutions, the working procedures of the operators were timed.
Based on the problems found in each particular case, operators were invited into meetings to identify the appropriate solutions. As no procedures were applied for the respective operations, each operator worked as he thought, so a lot of working time and energy were spent inefficiently.
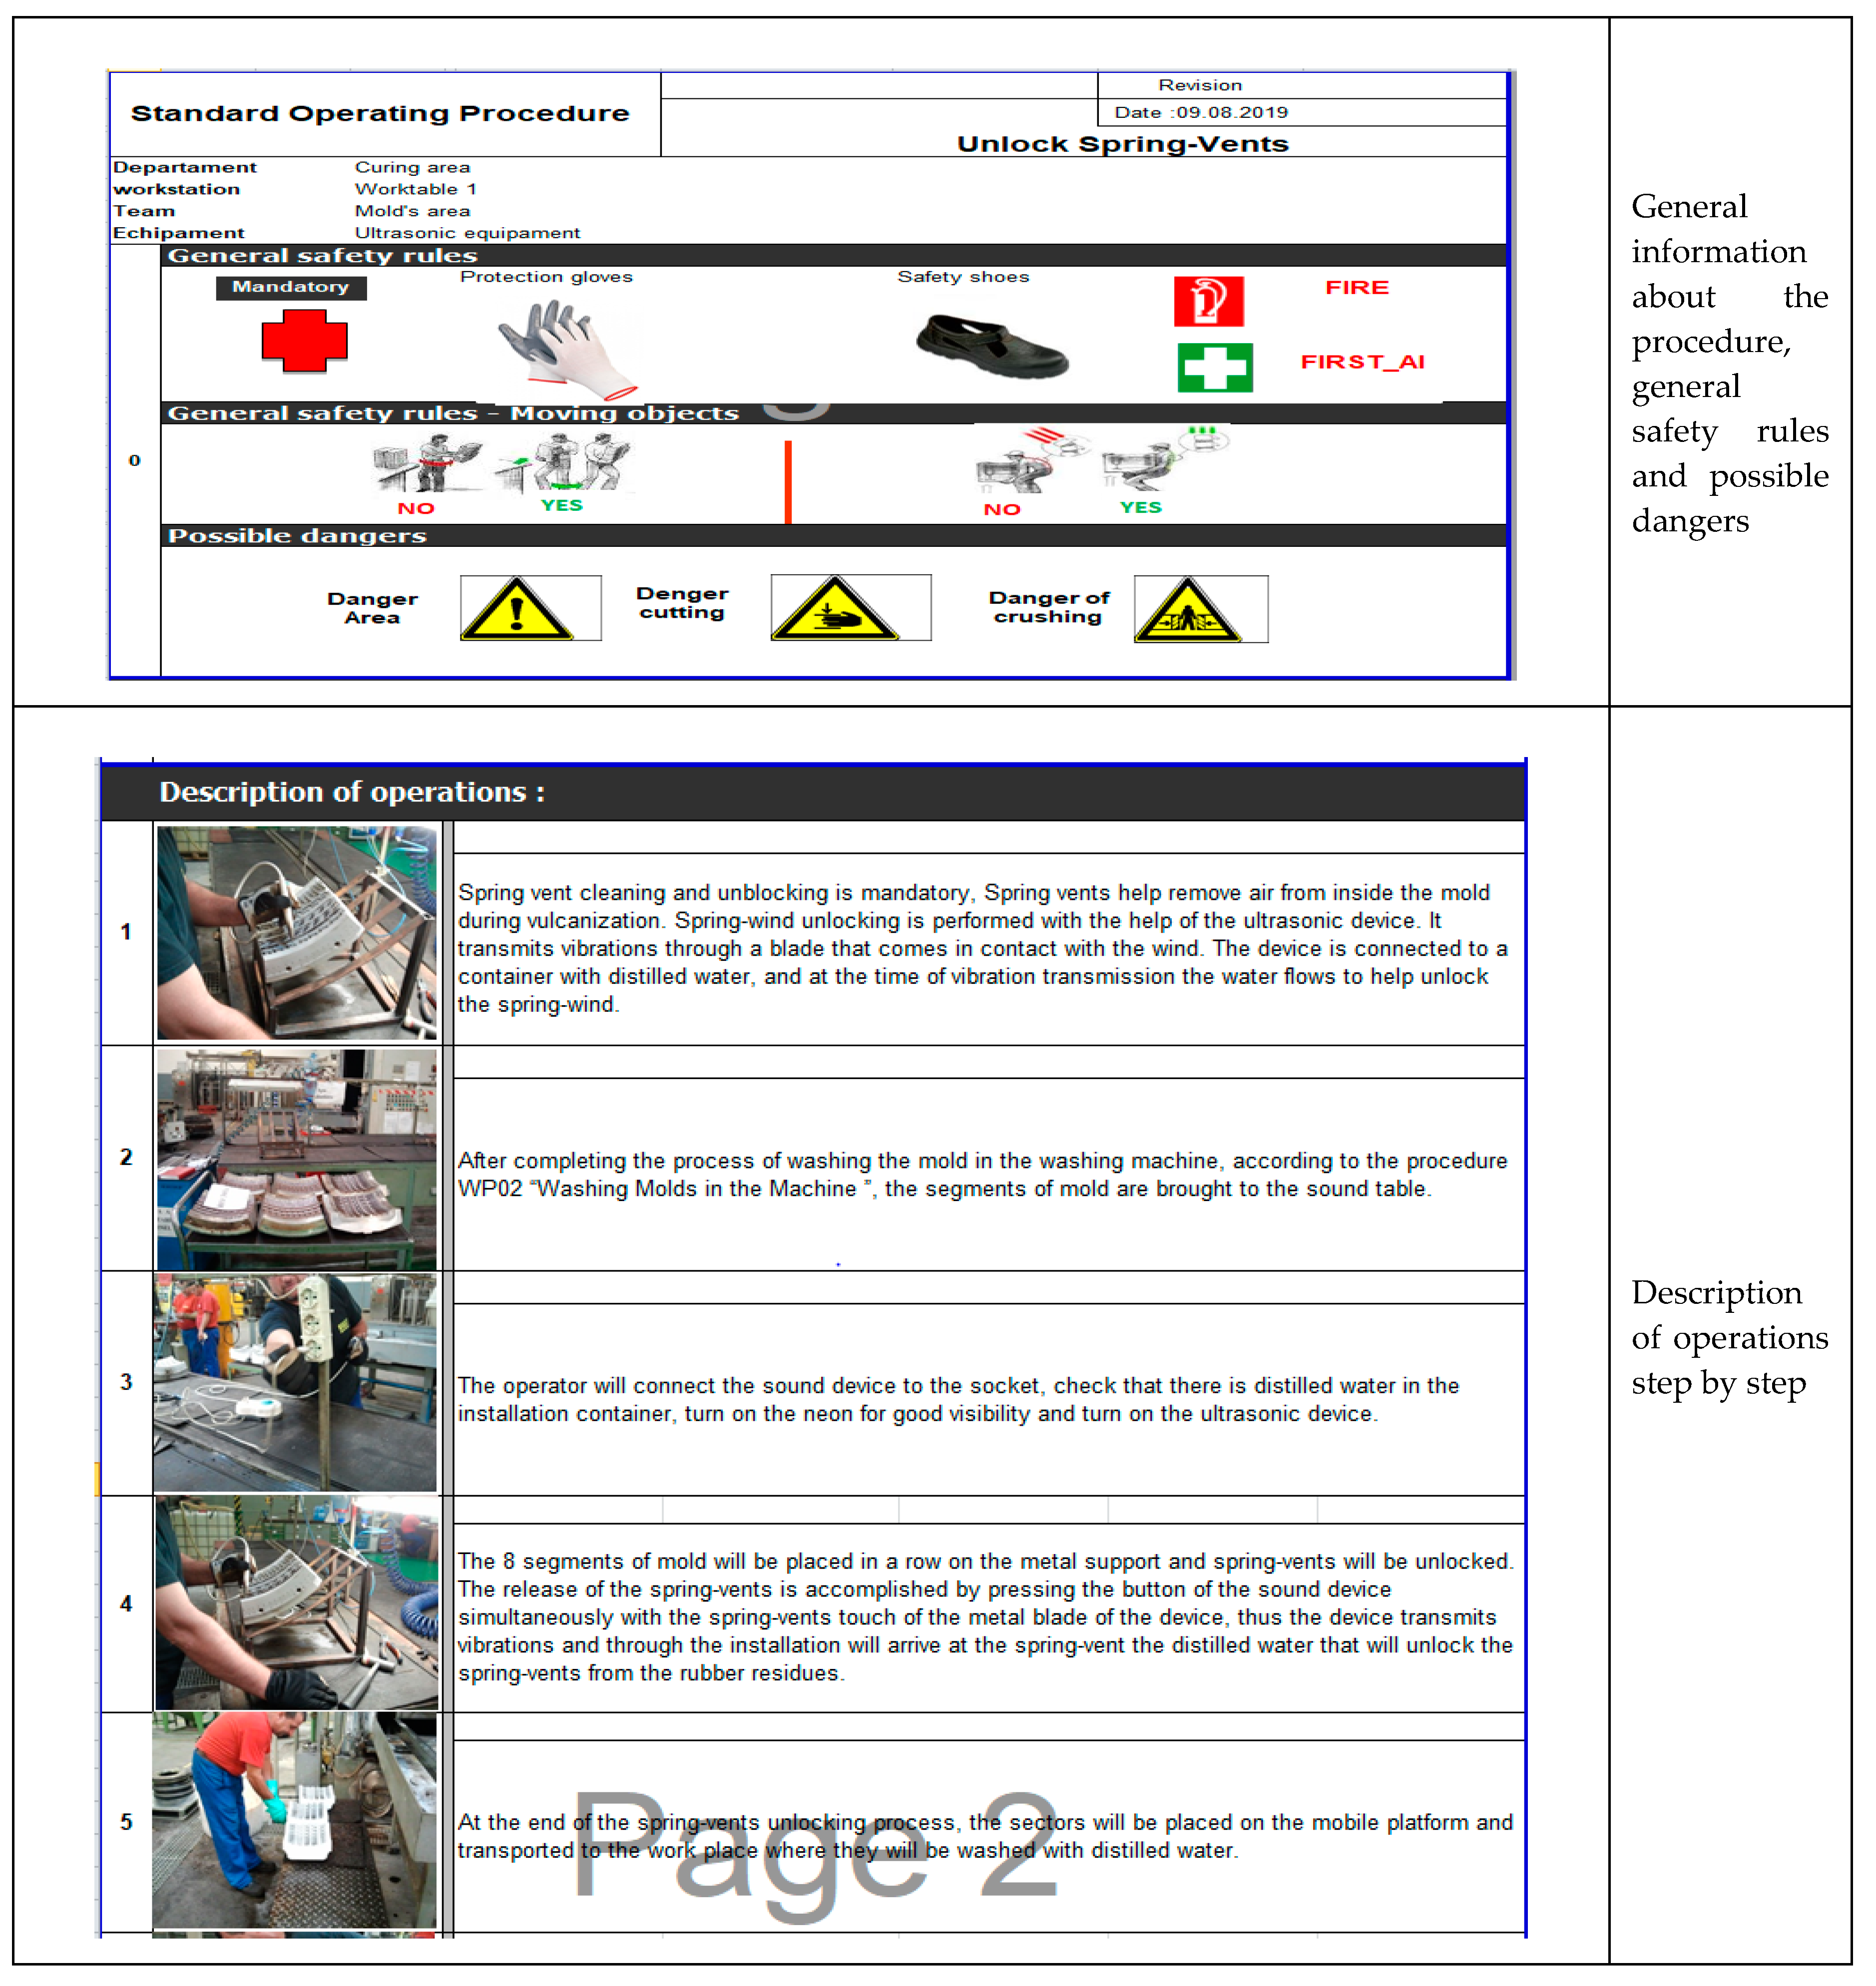
To facilitate the understanding of the processes and their standardization, documentation using the standard operating procedure (SOP) was chosen. SOP is a set of step-by-step instructions to clarify (through accurate descriptions) the operations to be performed during the production process necessary to carry out an activity in a more efficient way, and to save time. SOP represents an instruction manual, which explains, with images and text, step by step, how to perform the activities of a specific process.
The dedicated team has discussed with the operators about the encountered problems. After monitoring the activities in the area of preparation of the molds for the hardening process for 15 consecutive days, the dedicated team established improvement measures together with the quality manager. These measures were validated by top management.
The activities of the operators from several shifts were monitored to identify the problems of the process, and to find better solutions. At the end of the monitoring, several opportunities for improvement regarding the standardization of activities were identified. One may conclude that the work processes related to the preparation of the molds need to be standardized.
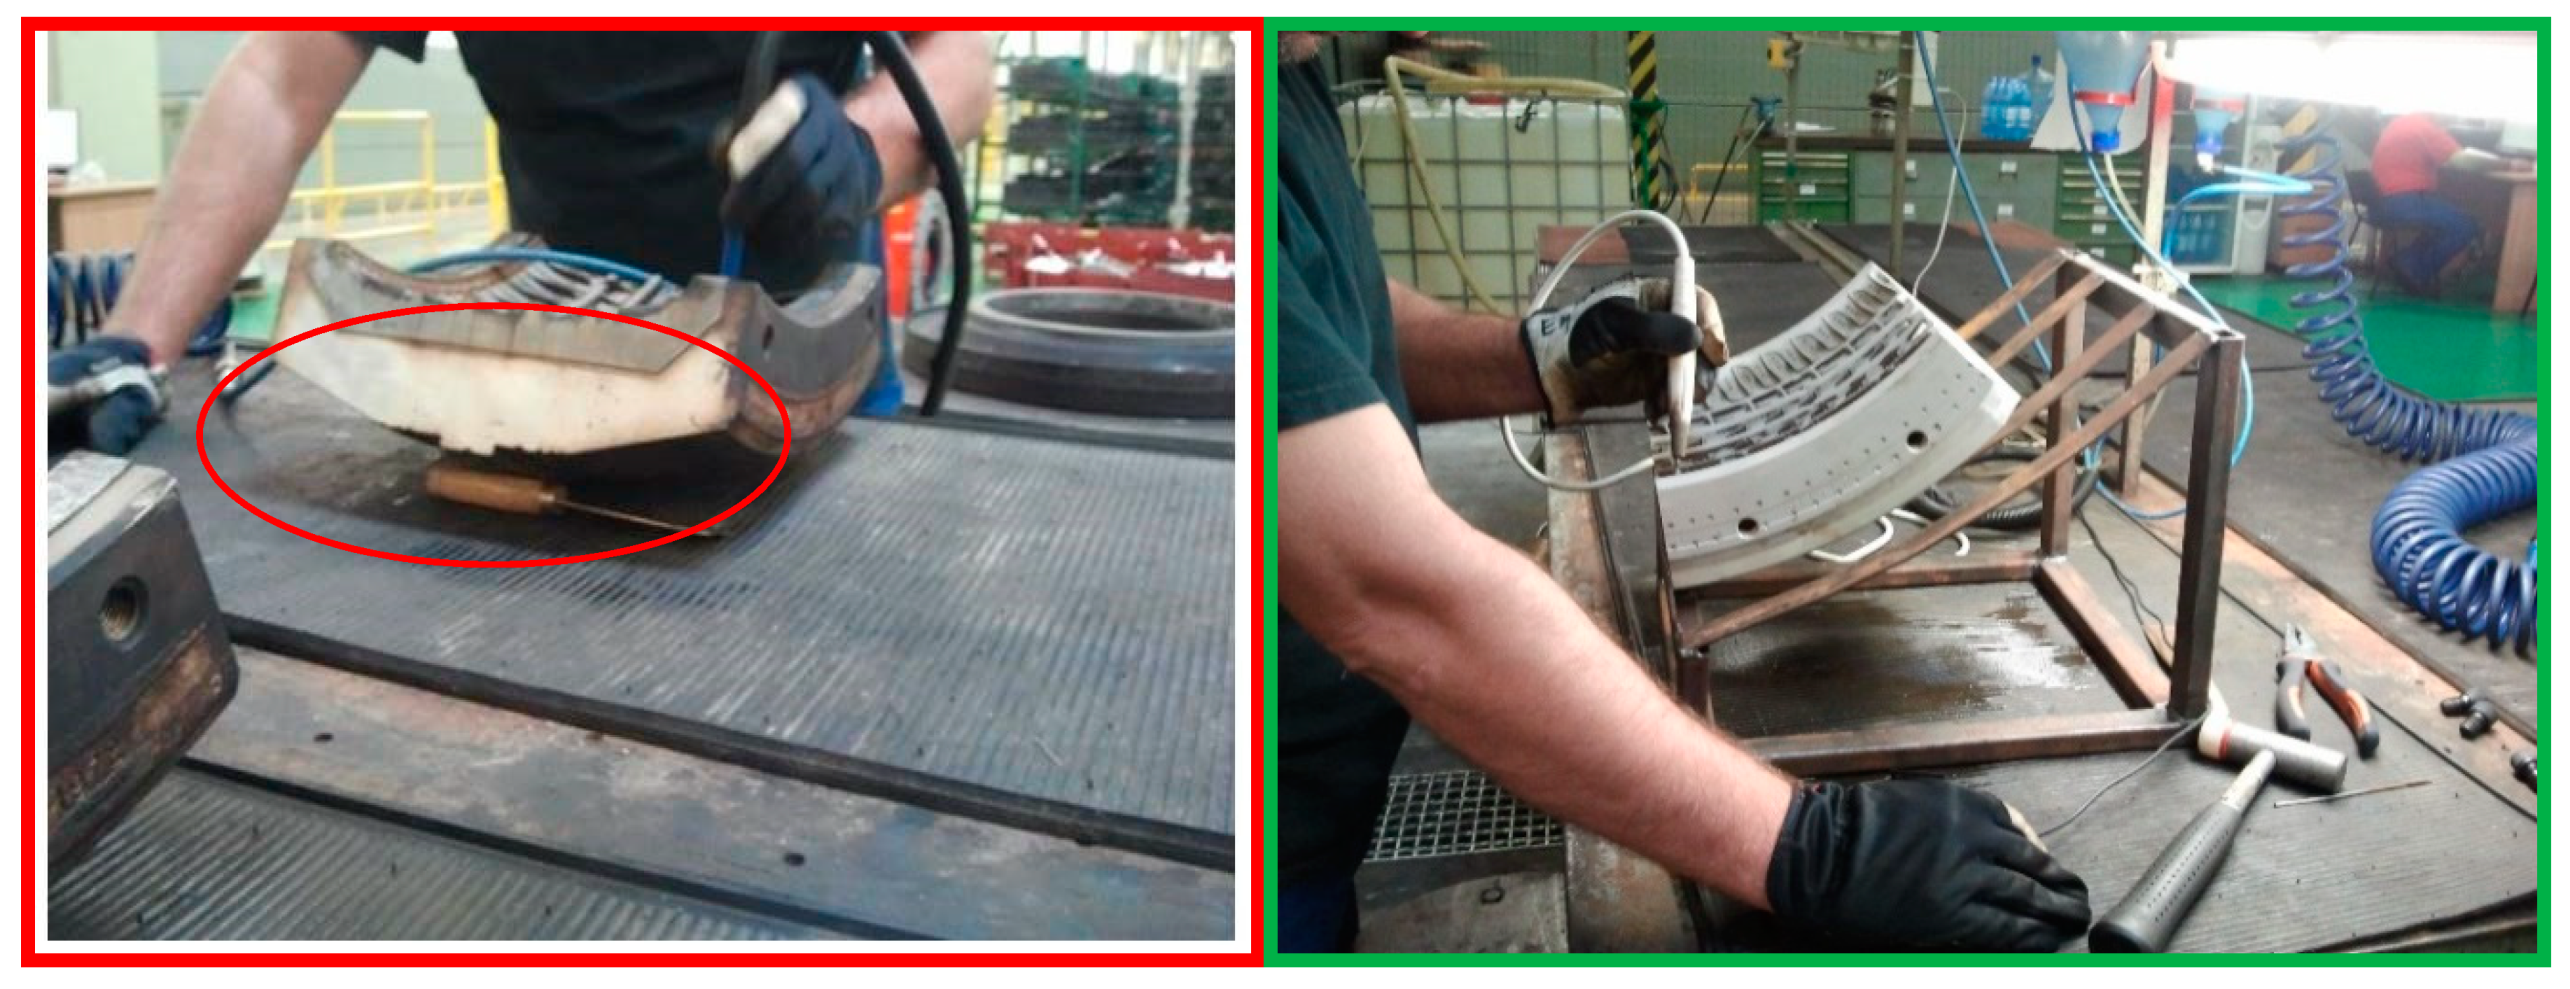
An example of the standard operating procedure for unlocking spring-vents is provided. Spring-vents are small valves allowing the air from the mold to be removed during the curing process. For drafting the procedure, the activities were monitored, and the time was registered for several consecutive days and during the various shifts. Opportunities were identified for improving the time or for the working operation mode, as seen in
Figure 23.
At step 4 of the procedure below, initially the mold segments were placed directly on the worktable for cleaning. Due to the cylindrical shape of the mold segments, they were not in a fixed position during the cleaning operation.
As seen in
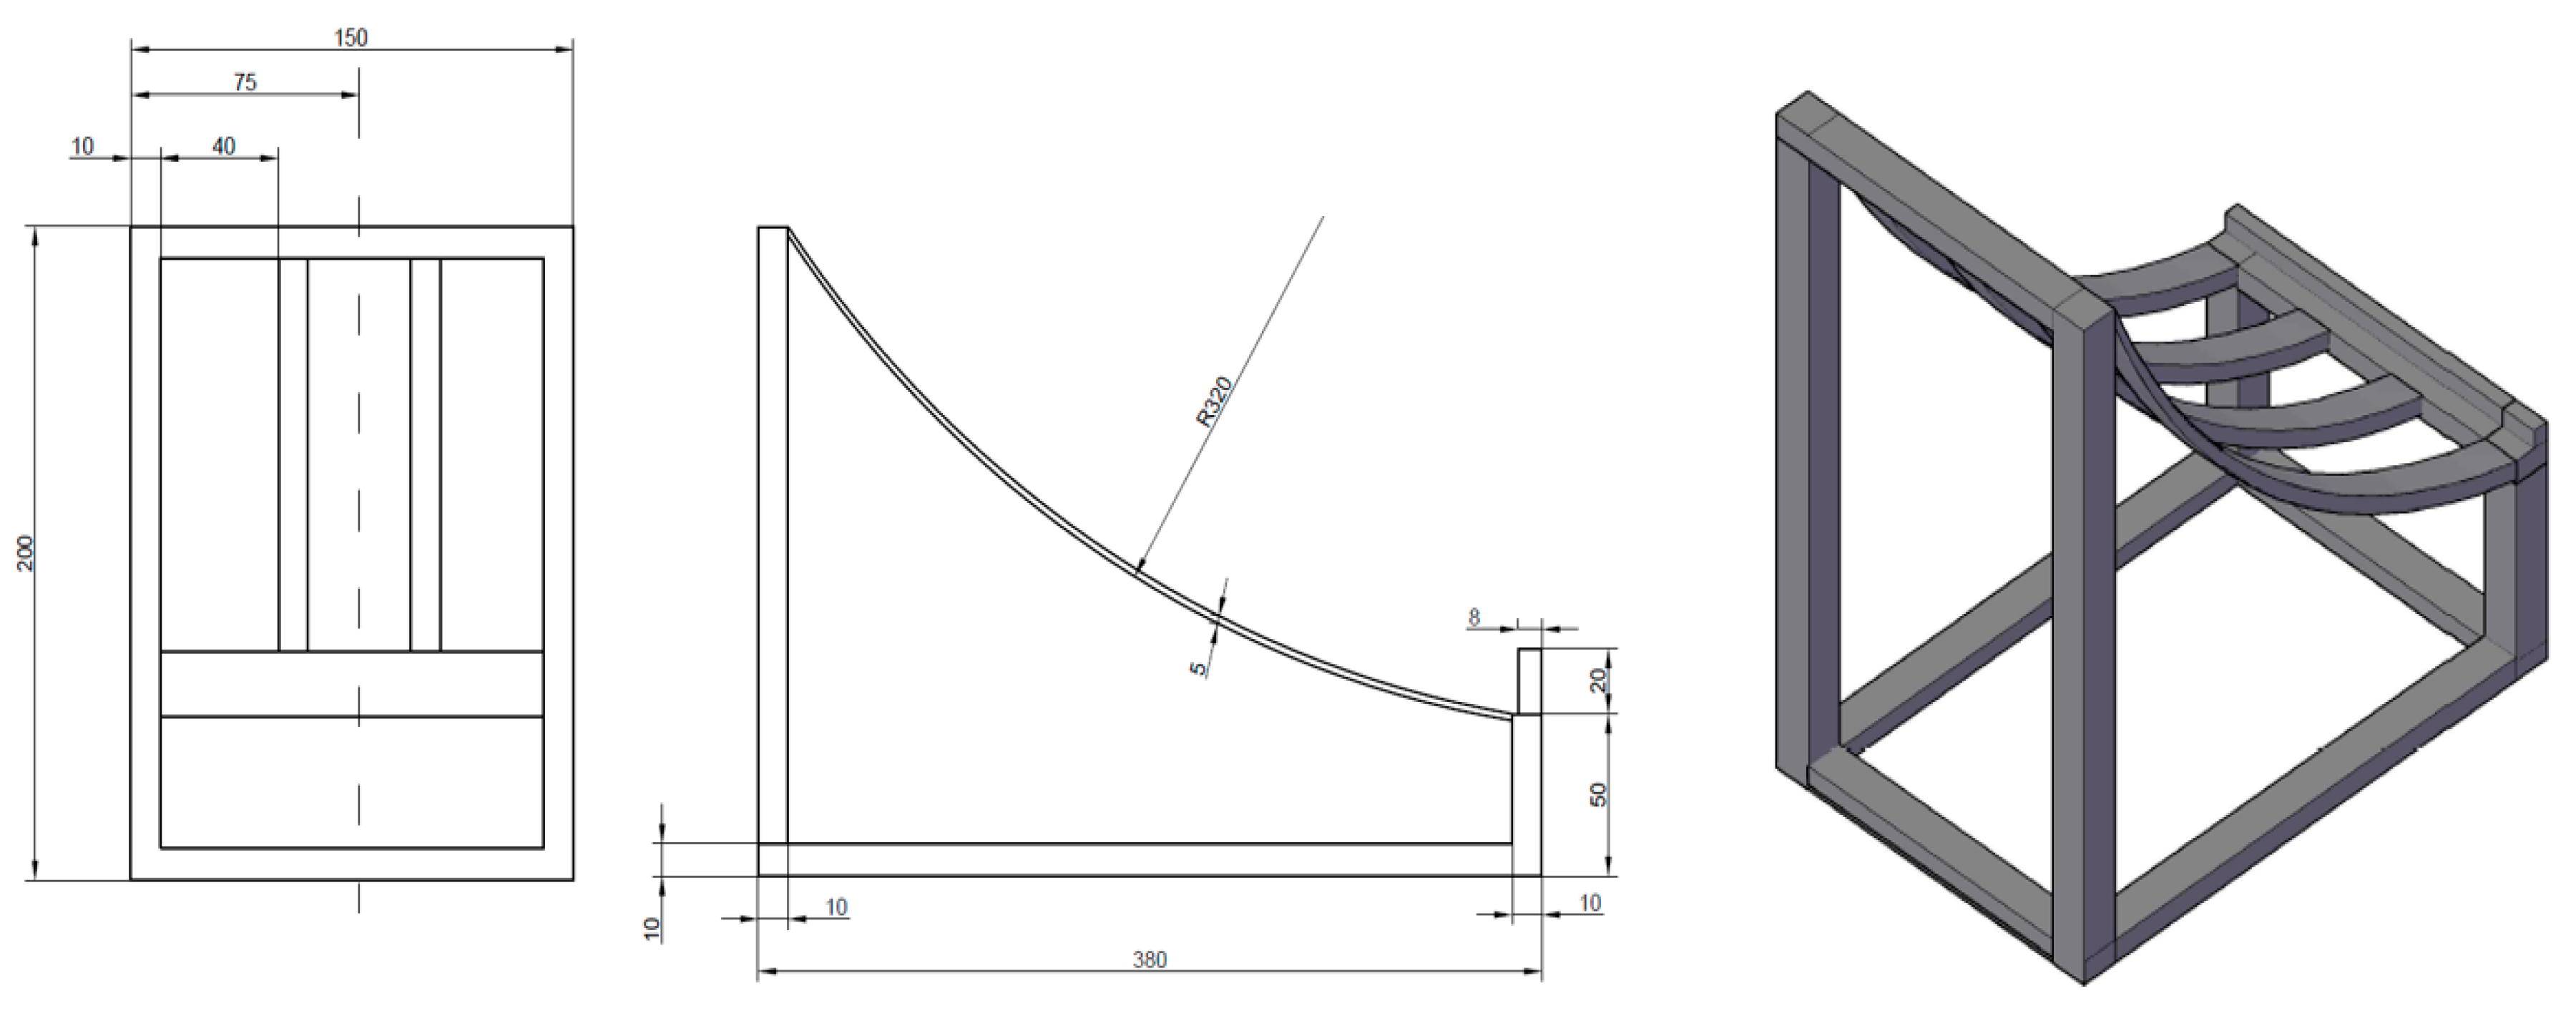
Figure 23, the operator used to fix with an object and re-position frequently the part, wasting time and leading to increased cleaning time for the unlocking of spring-vents. The solution to this issue was to create a support for the mold segments (
Figure 24). Considering that the mold sectors have different sizes, the support should be designed according to the larger size of the existing mold segment. SOP, given in
Figure 25, may be considered an example; the processes may be improved and then documented in a standardized way.
4. Improvement Plan Results
A results analysis takes into account data analysis and the actions carried out previously, correlated with the processes’ performance and the products quality [
4].
Improving the processes in the curing area taking more measures to minimize process blockages, as seen in the analysis and measurement phase, through Ishikawa and Pareto diagrams, were mainly due to several factors.
Improvement measures were taken for each factor mentioned above. Due to the lack of working procedures, all activities in the molds’ preparation area were monitored, then the standard operating procedure was documented and, applying the 5S method, the workspace organizational problems were solved. Considering that the major identified problem responsible for the process blocking was due to the washing machine, after the improvement plan implementation, the number of molds washed daily was measured for 15 days.
After applying the procedures and organizing the workspace, the number of washed molds is higher and almost the same every day, as given in
Figure 26; this shows the benefit result of the improvement and the process standardization.
Analyzing the results of the improvement plan (
Figure 26) within 15 days, we can see a 39% increase in the number of molds (blue versus red column). The solutions sustained, and the obtained results will be supported through the continuous adaptation of the working procedures, training, and internal audit actions. A new iteration may be applied similarly, identifying the problem, then the root causes and then implementing an improvement plan.
The planning evolution of the ECE changes can be noticed due to the organization of workspace through the 5S method and creating labels on the shelves of molds. As seen in
Figure 27, in order to make possible the changes, an extension of 2 weeks, (week 16 and 17) was adopted, in which the remaining sidewalls were modified until the improvement measures were taken.
Project Implementation
In
Figure 28, the project summary may be followed. One may see the identified problems by the team of 3 members who monitored, analyzed, and proposed solutions to improve the process.
The project implementation was carried out over three months. The team responsible for implementing the improvement project, consisting of 3 members, worked closely with the operators of the two work shifts to understand the problems and identify optimal solutions. Improvement solutions were approved by the quality manager, closely involved in the project, too. The three-week monitoring phase was required to collect data from the process, followed by another three weeks to implement 5S, OPL, and draft procedures. Procedures were implemented, and then a stage of monitoring and collecting data from the process to verify the project progress followed (
Figure 29).
The results can be seen in reducing the time for each of the activities in the area of preparation of molds by up to 25%, increasing the number of washed molds by 39%, streamlining and facilitating work, standardizing processes, facilitating employee training and ensuring worker safety.
Comparing the situation before with those after the improvement and the obtained results, one may notice the improvement of the times for carrying out various activities in the area of mold preparation, and the increase of the number of washed molds that led to the main objective, removing blockages from the process. Furthermore, following the improvement process, the activities were standardized by performing the procedures and the workspace was organized, which led to the reduction of working times by up to 25%.
5. Conclusions
The case study presents the process-based approach, through which the organization continually monitors the processes and maintains their improvement. Thus, continuous improvement has been supported by the quality management system and the tools used to keep processes and product quality under control. For increasing the management system efficiency and effectiveness, processes of deeper understanding, monitoring, and managing are focused on.
Within the improvement plan, the processes were carefully monitored, in order to identify their steps. Quality tools were used, such as suppliers, inputs, process, outputs, customers (SIPOC) for mapping processes and identifying interactions between processes. Furthermore, quality tools such as Ishikawa and Pareto diagrams were used to identify the causes that lead to problems. After identifying the problems and their associated root causes, steps have been put in place to make processes more efficient and leaner, with improved production times. An essential role of the applied methods was also the good habits maintenance and the high level of rigor in carrying out the activities.
Activities standardization realized by drafting the necessary procedures, adopting the SOP model (standard operating procedure), in which images and text were used with the description of each stage of the activity to facilitate the processes understanding by the operators. The process improvement made possible the ECE modifications, too, so the company was able to achieve its objectives in the tire market, and in relation to the competitors.
Finally, one may consider the quality management an essential in performance development of processes with support of top management and contribution from all employees through engagement and focus on continuous improvement. The sequences of the proposed methodology may be applied in other industries or services [
29,
30,
31].


