Abstract
Balochistan is a semi-arid region. The assessment of water quality is very important, as the majority of people depend on groundwater for drinking purposes. The present study involves the quality assessment and mapping of drinking water in the five selected major coal mining sites in the four districts of Balochistan. A total of 50 samples were collected from these five coal mining sites in two seasons: i.e., summer and winter. A physicochemical analysis was carried out for groundwater samples: i.e., pH, electrical conductivity (EC), total dissolved solid (TDS), CO3, HCO3-, Cl-, Ca2+, Mg2+, Na+, K+, Cd, Cr, Co, Cu, Fe, Pb, Mn, Hg, Ni, and Zn. Thematic maps were used to depict the spatial distribution of significant variables and were compared with WHO standards (2011) during both seasons. The majority of parameters crossed the safe permissible limit of WHO standards. The water quality index (WQI) was calculated for the whole monitoring data obtained from both seasons from the perspective of drinking water in each of the selected sites. Moreover, a principle component analysis (PCA) and correlation matrix was carried out for the data analysis in order to identify the source of pollution and correlation among the variables. The results suggested that the overall quality of water from the selected coal mining sites deteriorated due to the overexploitation of coal mines and mining activity. The current investigation provides a comprehensive picture of the current status of water quality in and around the selected coal mines of Balochistan.
1. Introduction
The large coal deposits scattered across Pakistan are known to have about 185,175 million tons [1]. These coal reserves are of different ranks, among which, 97% are of lignite rank [2]. The types of coal from different regions of Pakistan vary from low rank lignite coal to high rank volatile bituminous coal [3]. Thus, looking at the vast coal resources, policy makers in Pakistan have realized the importance of coal by explaining the government’s plans to meet about 20% of its energy demand in the near future. Coal mines play a very significant role in amplifying Pakistan’s economic wealth. There are a large number of coalfields in Balochistan. However, the main coalfields are Deragi, Sor-Range, Chamalang, Duki, Harnai, Khost, Sharagh, Mach, and Ziarat. The present research covered coal mine fields in Chamalang, Duki, Harnai, Sharagh, and Khost: the four districts of the province. The total coal reserves of the province reach to about 217 million tons. The coal of Balochistan is found to be classified into two types according to its ranks—i.e., sub-bituminous to bituminous—with a considerable heating value that ranges from 9637 to 15,499 Btu/lb.
Coal mining areas are currently being overexploited due to coal excavation; the improper handling of waste disposal results in groundwater contamination [4]. The coal seam that is being excavated is generally lower than the level of the water table [5]. When exposed to water or air, these mineral rocks produce acid that continuously leach the sulphide. This causes the contamination and acidification of the underground water resources and is undoubtedly considered as one of the most significant water quality problems related to coal mining [6]. In the semi-arid regions of Balochistan, groundwater is the only source of water. The decline in the water quality and quantity and the increasing demand due to overpopulation has a profound effect on the existing freshwater resource, resulting in water shortage in the major part of the country [7,8]. In a certain area of the Balochistan and Sindh province of Pakistan, many people already have no means to access the safe drinking water and are forced to use brackish water for daily consumption [9]. In Balochistan, the water table is annually dropping by 3.5 m and, soon, this source will be completely exhausted [10,11].
Contamination due to heavy metals in groundwater occurs due to the natural weathering process of mineral rocks that bear minerals. Anthropogenic activities, such as coal mining, mineral excavation, industrial effluent, and fertilizers, significantly contribute to the heavy metal pollution of groundwater [4]. In the current study, heavy metal analysis data were integrated with geographic data to model the spatial distribution of heavy metal in the groundwater. The global information system is an effective tool for loading a huge volume of data to correlate and use further for spatial analysis [11]. GIS technology has been recommended and proposed by many scientists all over the world [12,13,14,15,16,17] to determine the spatial distribution of heavy metal and identify the source of pollution. The present research aims to understand the quality of groundwater based on heavy metal concentration and is depicted by means of an interpolation technique [18].
In the mid-twentieth century (1965), Horton initially started the categorization of water quality [19]. Furthermore, in 1970, the Brown group introduced a water quality index (WQI) similar to Horton’s index. However, various modifications have been considered by scientists and experts for the water quality index (WQI) concept [20]. Basically, a water quality index (WQI) is a significant tool that is either developed for irrigation water or for drinking water. It is a water rating scale based on a single number-like grade that is derived through the testing of different parameters of water, which depicts the overall water quality [21]. The major advantages of these indices are to provide significant information of water quality to policy makers, the public, and concerned authorities in a very precise and effective manner [22]. Similarly, a statistical approach—i.e., principle component analysis (PCA)—is widely applied and used by many scientists all over the world [23,24,25,26]. As such, it offers a statistical approach for the interpretation of large and complex water quality data, the ease of understanding the ecological status, and the factors involved in demeriting the overall water system [27]. In the current study, the level of heavy metal contamination in the groundwater of the five selected coal mining fields scattered across four districts of Balochistan was assessed by a principal component analysis (PCA). Throughout the world, contamination due to coal mining activities is a major concern. Many studies have been conducted globally to significantly explain the consequences of large-scale coal excavation. The current research was conducted in a coal mining area of Balochistan that has not been explored and investigated before to check the current state of water for drinking purposes.
2. Materials and Methods
2.1. Study Area
Pakistan’s largest province, Balochistan, covers an area of 347,190 km2 and is the driest province among all provinces. It is geographically bounded by 24°, 53′ and 32°, 06′ North latitudes and 60°, 52′ and 70°, 17 East longitudes [28]. The terrain of the district consists of East–West aligned mountains ranging in ground elevation from 924 to 3136 meters above the mean sea level (MSL). The climate of the province is semi-arid continental and varies dramatically from very cold winters to hot summers [17]. It has diversified rainfall, recording between 200 and 350 mm per year. The temperature varies greatly with the location and elevation from sea level, from between −3 to 38 Celsius, but the daily maximum, mean, and minimum temperatures recorded are 27, 31, and 16 Celsius, respectively [29]. Balochistan is present in the Triassic strata, which are characterized by different tectonic metallic and sedimentary basins, such as Sulaiman, Indus suture, Kirthar, and Balochistan basin. The rocks of the study site are mainly composed of igneous, ultra-mafic, and sedimentary types [30]. Balochistan is the custodian of a large reservoir of natural gas and barite. Besides these resources, large deposits of silica, magnesite, and sulphur are also present. The study area hosts large deposits of coal of different types—mainly bituminous to sub-bituminous [3].
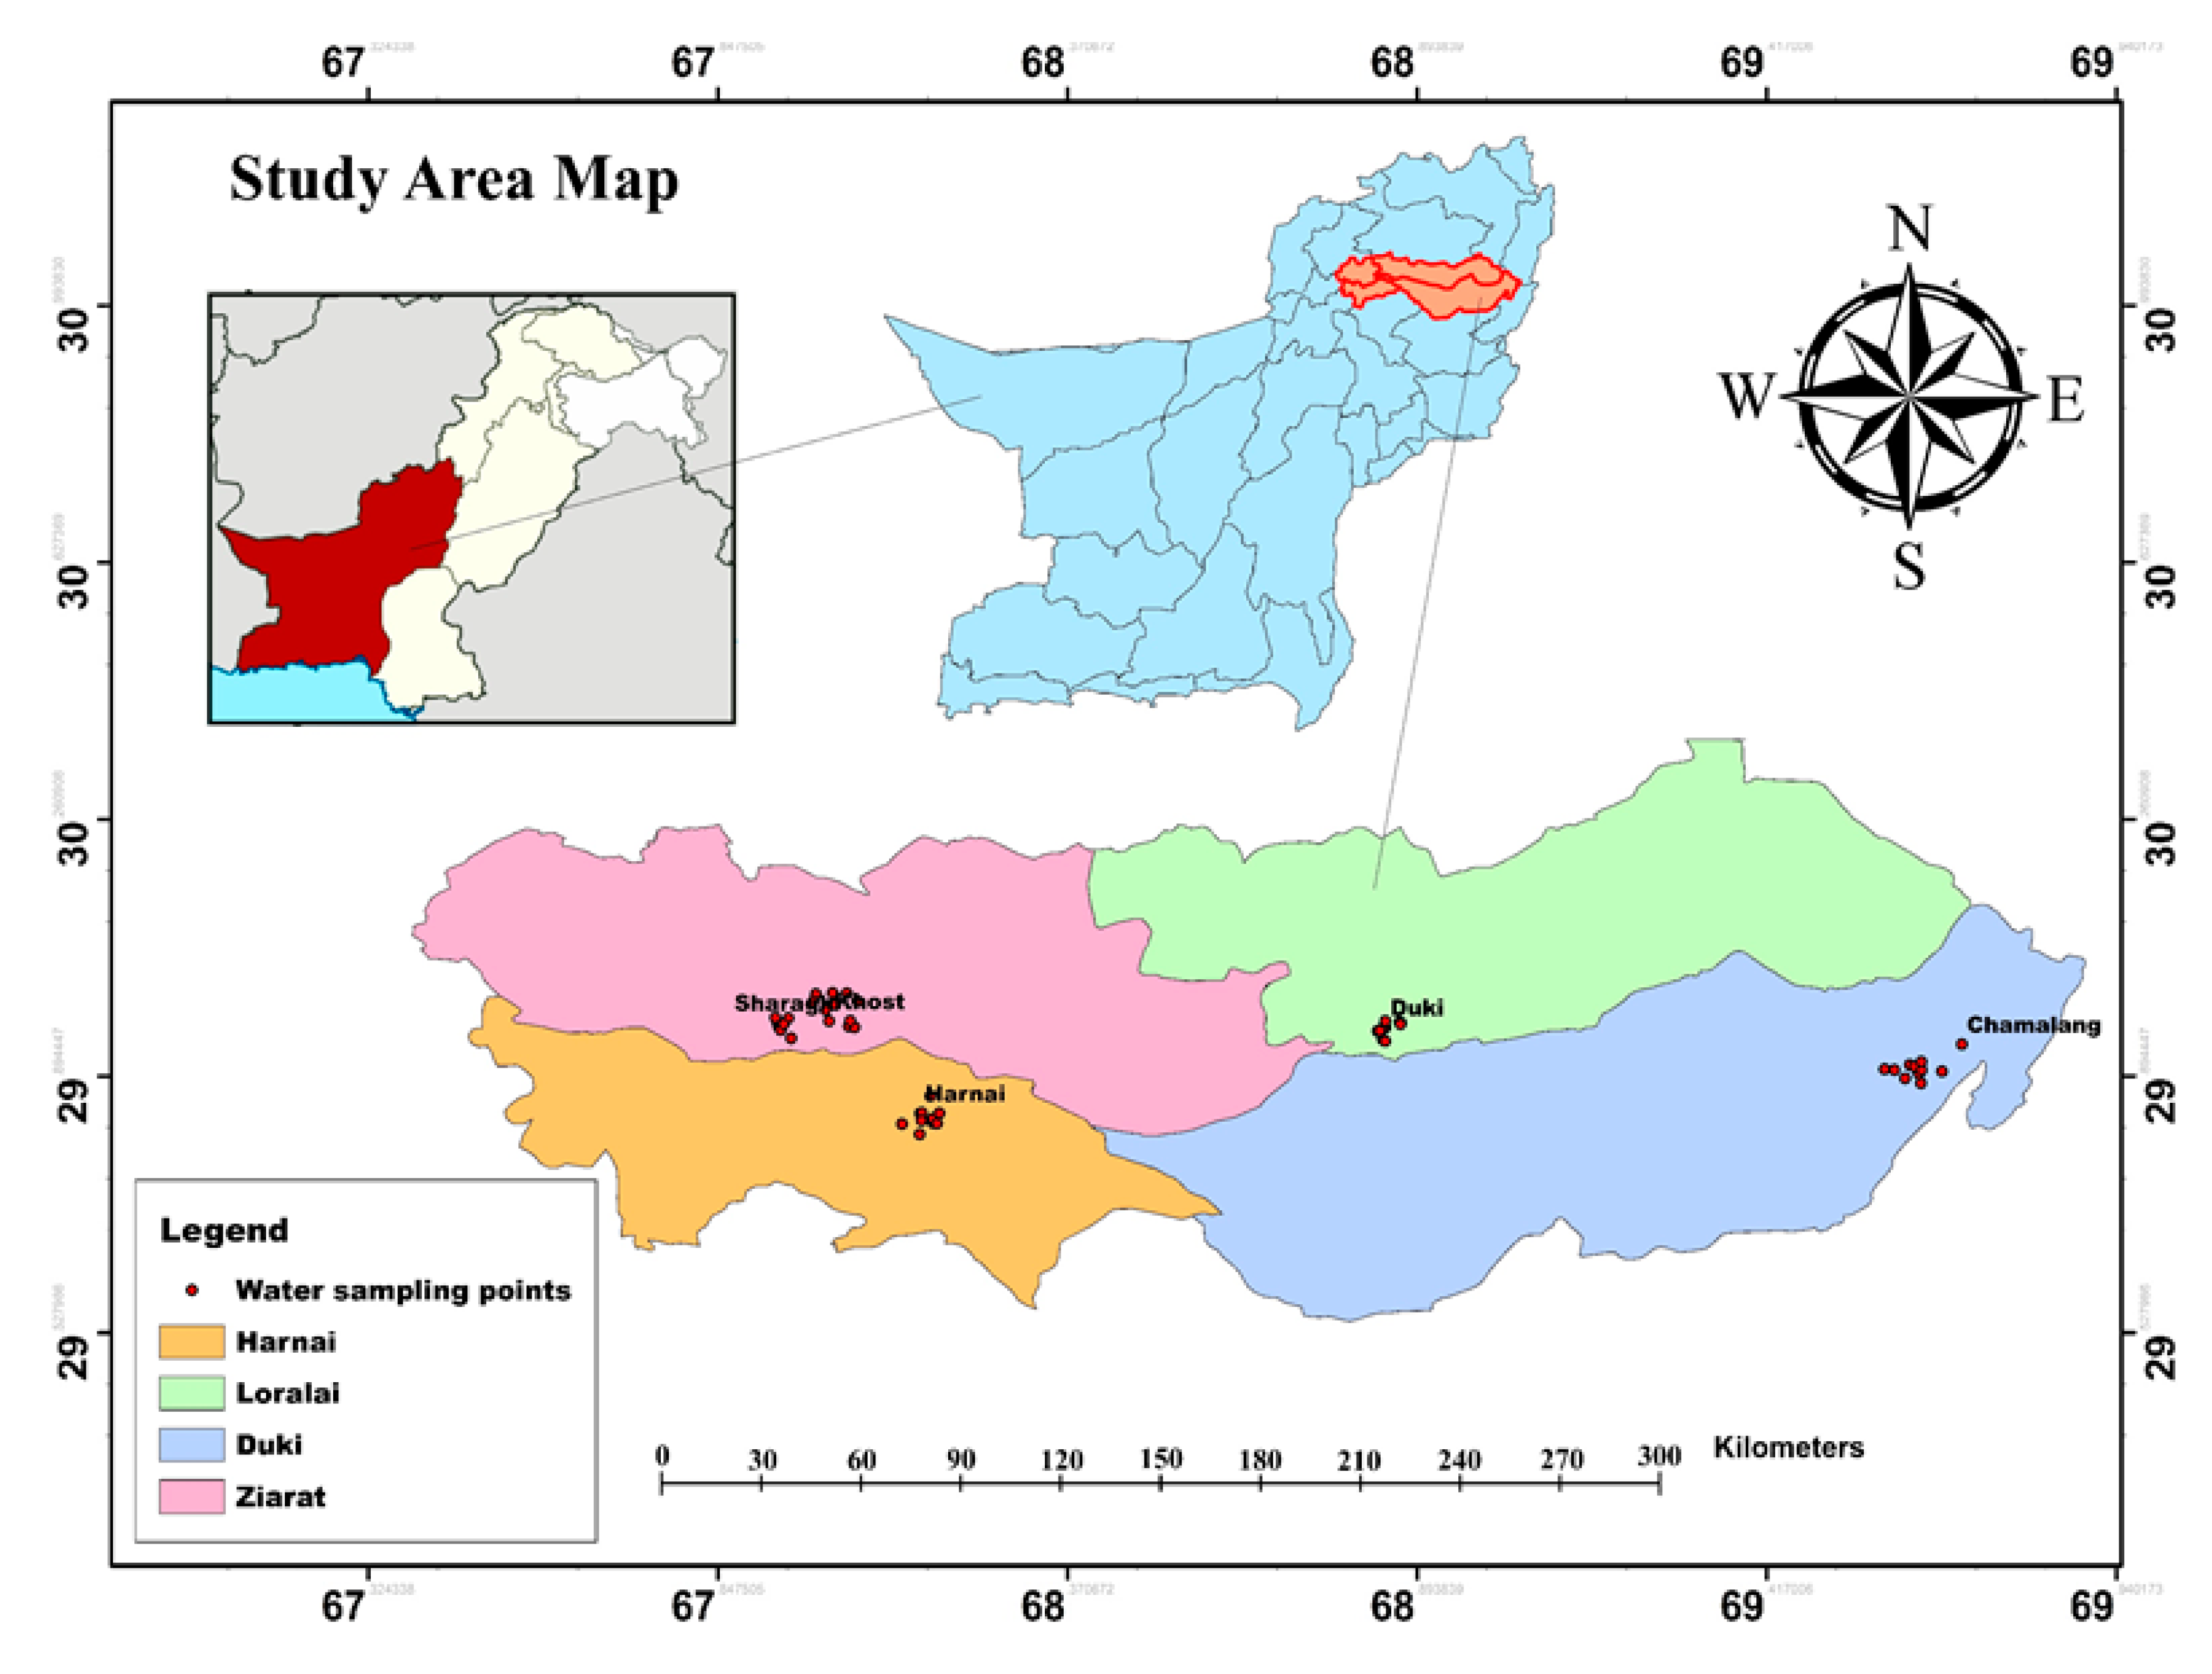
The main coalfields of Balochistan are Deragi, Sor-Range, Chamalang, Duki, Harnai, Khost, Sharagh, Mach, and Ziarat (Figure 1). The thickness of the coal seams ranges from 0.3 to 2.3 meters. Among these coal mining fields, five coal mining locations were selected, which are scattered across four districts of the province: i.e., Chamalang (Dist. Loralai), Duki (Dist. Duki), Harnai (Dist. Harnai), Sharagh (Dist. Ziarat), and Khost (Dist. Ziarat).
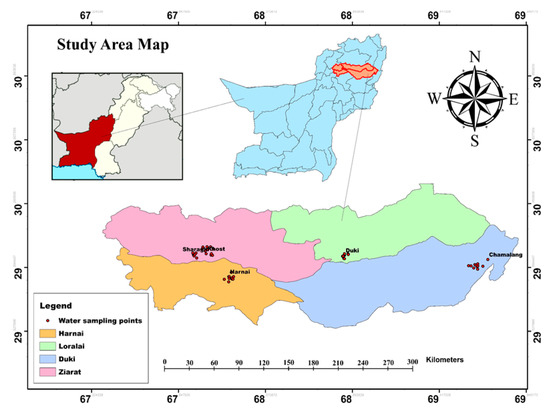
Figure 1.
Baseline map of the study site with sampling spots.
2.2. Water Sampling and Analysis
Water sampling was carried out in two seasons (2017–2018). The first sampling was done during the summer season in July, 2017, and the second was during winter in January, 2018. A total of 100 groundwater samples were collected, with fifty (50) samples in one season from all the possible water resources. Duplicates of 10 water samples were collected from each coal field. In the coal mining fields, the surface water resources were limited and the only sources of drinking water were karazes, springs, dug and Persian wells, and freshwater aquifers. During field sampling, some samples were collected directly from the bore holes and some were collected from the water tanks consumed by the mine workers. The depth of the groundwater throughout the study ranged from 250 to 300 ft deep.
Sedimentary rocks are extensively exposed in all the hydrologic basins of the region and mainly consist of calcareous and arenaceous. The Cenozoic and Mesozoic rocks are mainly composed of limestone, sandstone, and shale, which are widely exposed in all the river basins. This formation and distribution of sedimentary rocks represent different hydrogeological characteristics at different depths and levels. In all the hydrologic basins of Balochistan Province, such types of formations are widely exposed [31].
For the current research, physicochemical parameters (i.e., pH, total dissolved solid (TDS), and electrical conductivity (EC)), anions (i.e., Cl- and HCO3-), various heavy metals (i.e., Cd, Cu, Co, Cr, Hg, Zn, Pb, Ni, Fe, and Mn), and several light metals (i.e., Ca2+ and Mg2+) were tested for each groundwater sample. Analyses were performed by following the standard protocols of American Public Health Association (APHA, 1992, 1998). The pH, EC, and TDS were measured with a multi-meter. Na+ and K+ were analyzed by using a flame photometer. Cl- and HCO3- were measured by following the titration method (APHA, standard protocol, 1992). A flame atomic absorption spectrophotometer (220 spectra AA, Varian) was used to detect mercury (Hg), whereas the remaining heavy metals were analyzed via an atomic absorption spectrophotometer (AA-7000 Shimadzu).
2.3. Spatial Distribution of Heavy Metals
During the field sampling of both seasons, each sampling point was located by means of a handheld portable GPS device. Excel sheets were prepared with sample coordinates and analyzed data. Prepared excel sheets were incorporated into ArcGIS 10.2 system software, and a raster interpolation technique, known as inverse distance weighted (IDW), was used to delineate the spatial distribution of water pollutants: i.e., heavy and light metals.
2.4. WQI
More than 50% of the world’s population depends upon groundwater as a source of drinking water [32]. The chemistry of groundwater is used as a tool to investigate the status of water for drinking or for irrigation purposes [18]. For the current study, the water quality index was computed for a total of one hundred (100) groundwater samples taken from the selected coal mining fields across the four districts during two seasons (i.e., summer and winter). The WQI was calculated in order to assess the suitability of groundwater for drinking purposes around the coal mines. The grading system followed by Ketata-Rokbani [33] was used to classify drinking groundwater, as shown in Table 1.

Table 1.
Water samples grading based on water quality index (WQI).
For computing the WQI, relative weight (Wi) was assigned for the selected parameters based on their significance and adverse effects on human health. The WHO permissible standards (2011) and relative weight (Wi) for each variable is shown in Table 2. Each tested parameter in the current research was assigned a weight (wi) from 1 to 5, as represented in Table 2 [22]. Five numbers represented the minimum (1) and maximum (5) weight of the selected pollutant due to their importance and ability to deteriorate the status of water. The key variables considered in the current study were pH, EC, TDS, HCO3-, Na+, Ca2+, Mg2+, K+, Cl-, Cd, Cr, Pb, Cu, Mn, Fe, Zn, Ni, and Hg.

Table 2.
Relative weight assigned to each analyzed parameter for groundwater sample.
Relative weight (Wi) was calculated as:
where Wi is the relative weight, wi is the weight assigned to each of the individual variables, and n is the number of variables.
The second step involved the development of the rating scale—i.e., (qi)—by dividing the recorded concentration of the individual parameter (Ci) by the WHO standard (Si); the obtained value is then multiplied by 100.
where Ci is the recorded concentration of the individual parameter and Si is the WHO standard for each parameter.
In the third and final step, SI was calculated for each water quality variable by multiplying Wi with qi. The sum of SI was equal to the water quality index (WQI).
SI = Wi × qi
SI was calculated for each water quality variable and the summation of SI was equal to the water quality index (WQI), as formulated in Equation (4).
WQI = ∑SI
2.5. Principal Component Analysis
The principal component analysis is a powerful method that attempts to elucidate the variance of a large data set with inter-correlated variables [34]. It determines the connotation between different parameters, resulting in the summarization of data set dimensionality. From the original parameter’s covariance matrix, the PCA uses the eigen vectors and eigen scores. Basically, eigen values of the principal components are the degree of their related variance; the contribution of original variables in the principal components is specified by loadings and the individual modified observations are called scores [34]. In the current study, a PCA was used to find the pattern of variance using XL STAT (2019).
3. Results
The overall concentration and ranges of the seasonal physicochemical analysis of groundwater samples are presented in Table 3 (summer data) and Table 4 (winter data).

Table 3.
Experimental results of physicochemical parameters of water sample (summer season).

Table 4.
Experimental result of physicochemical parameters of water sample (winter season).
3.1. Spatial Analysis of Groundwater
3.1.1. pH and EC
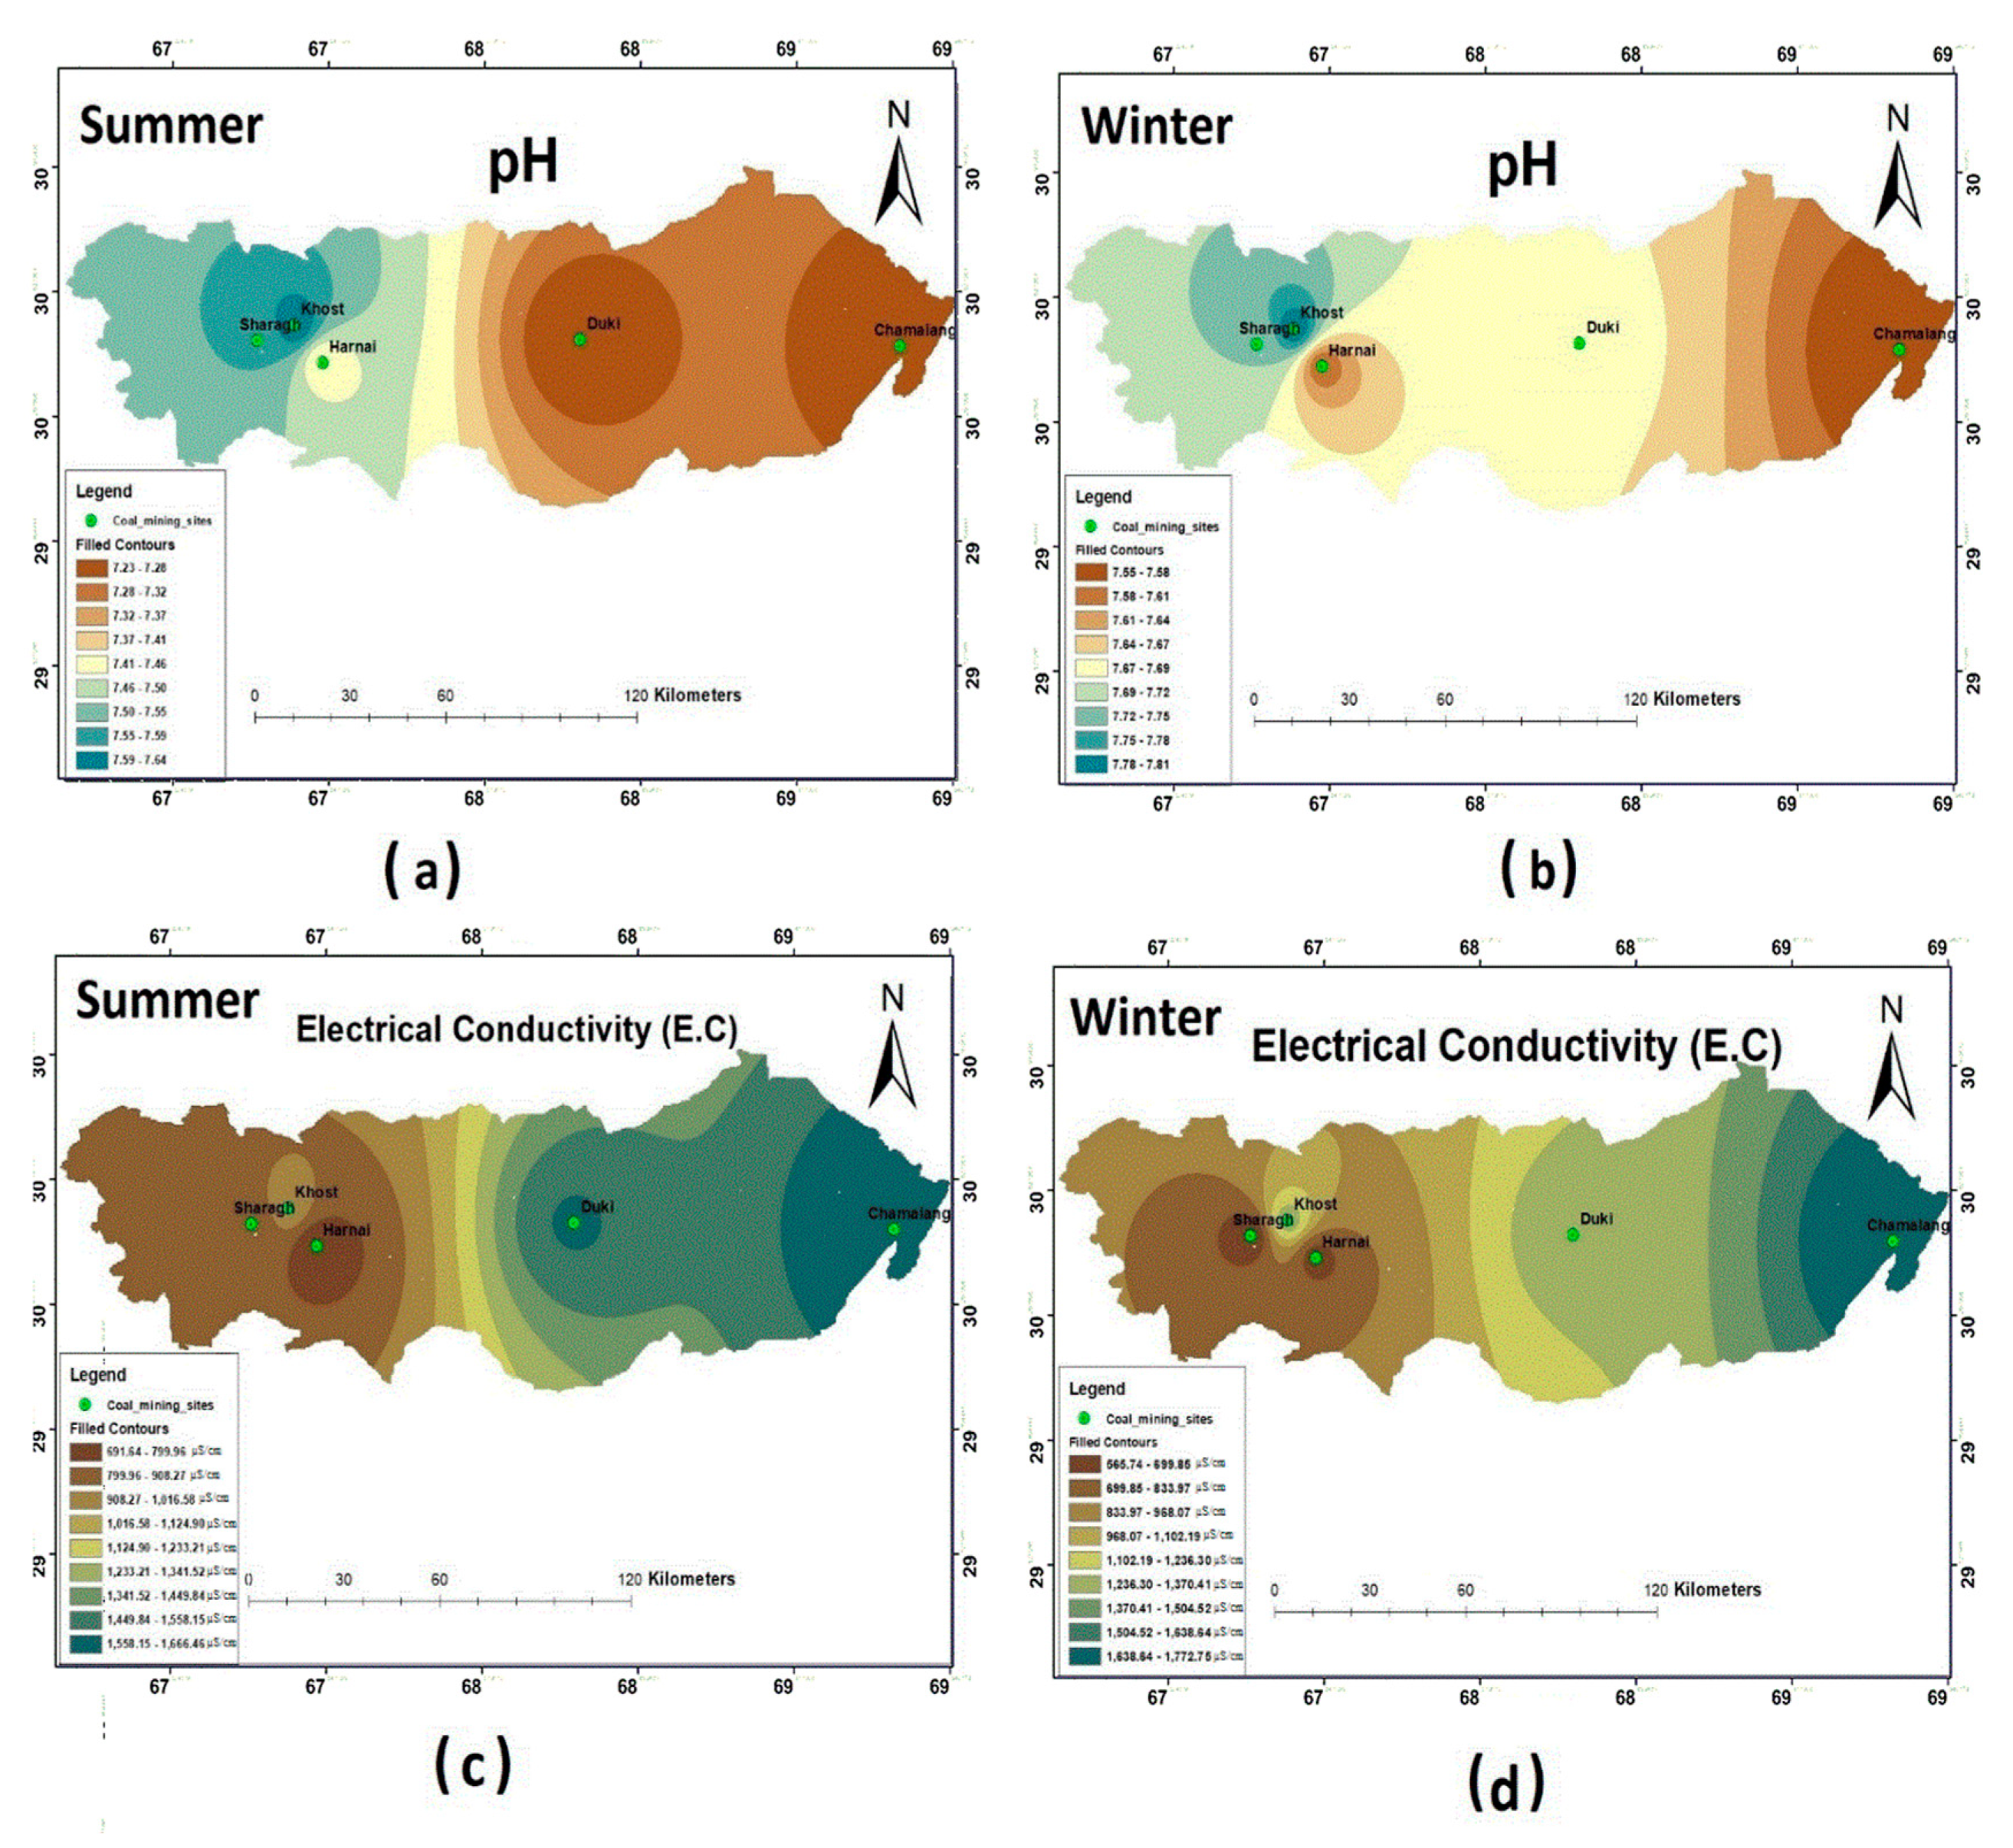
Water samples from all the selected coal mining fields during summer showed that the pH was within the permissible limits (6.5–8.5) of WHO (2011). However, the highest pH was reported in Khost: i.e., 7.69. During winter, the pH values were within the permissible limit of WHO standards. Relatively, a higher pH was reported in Harnai and Khost: i.e., 7.9. The spatial distributions of pH for both seasons are shown in Figure 2, which clearly depicts that the Khost water samples had higher pH values during both seasons. As assigned by WHO (2011), the maximum permissible limit for EC is about 1500 µS/cm. During the sampling seasons, it varied widely across the selected study sites ( Table 3; Table 4). The results showed that the EC values for all the study sites were within the permissible limit, except for Chamalang and Duki, which showed higher values of EC during both the seasons. Figure 2c,d shows that Chamalang and Duki had a higher value of EC during both sampling seasons.
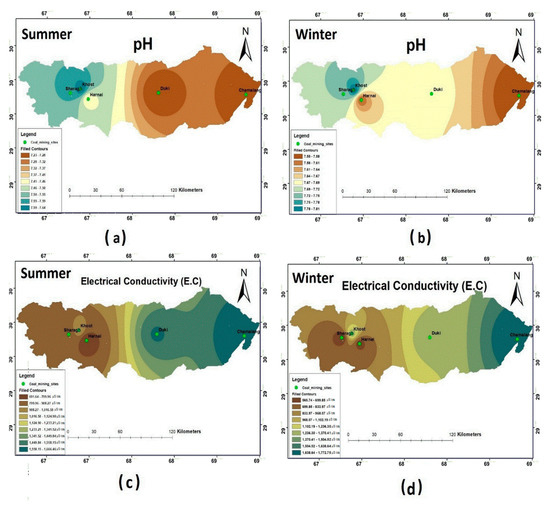
Figure 2.
Spatial distribution of (a) pH summer; (b) pH winter; (c) electrical conductivity (EC) summer; (d) EC winter.
3.1.2. TDS and HCO3-
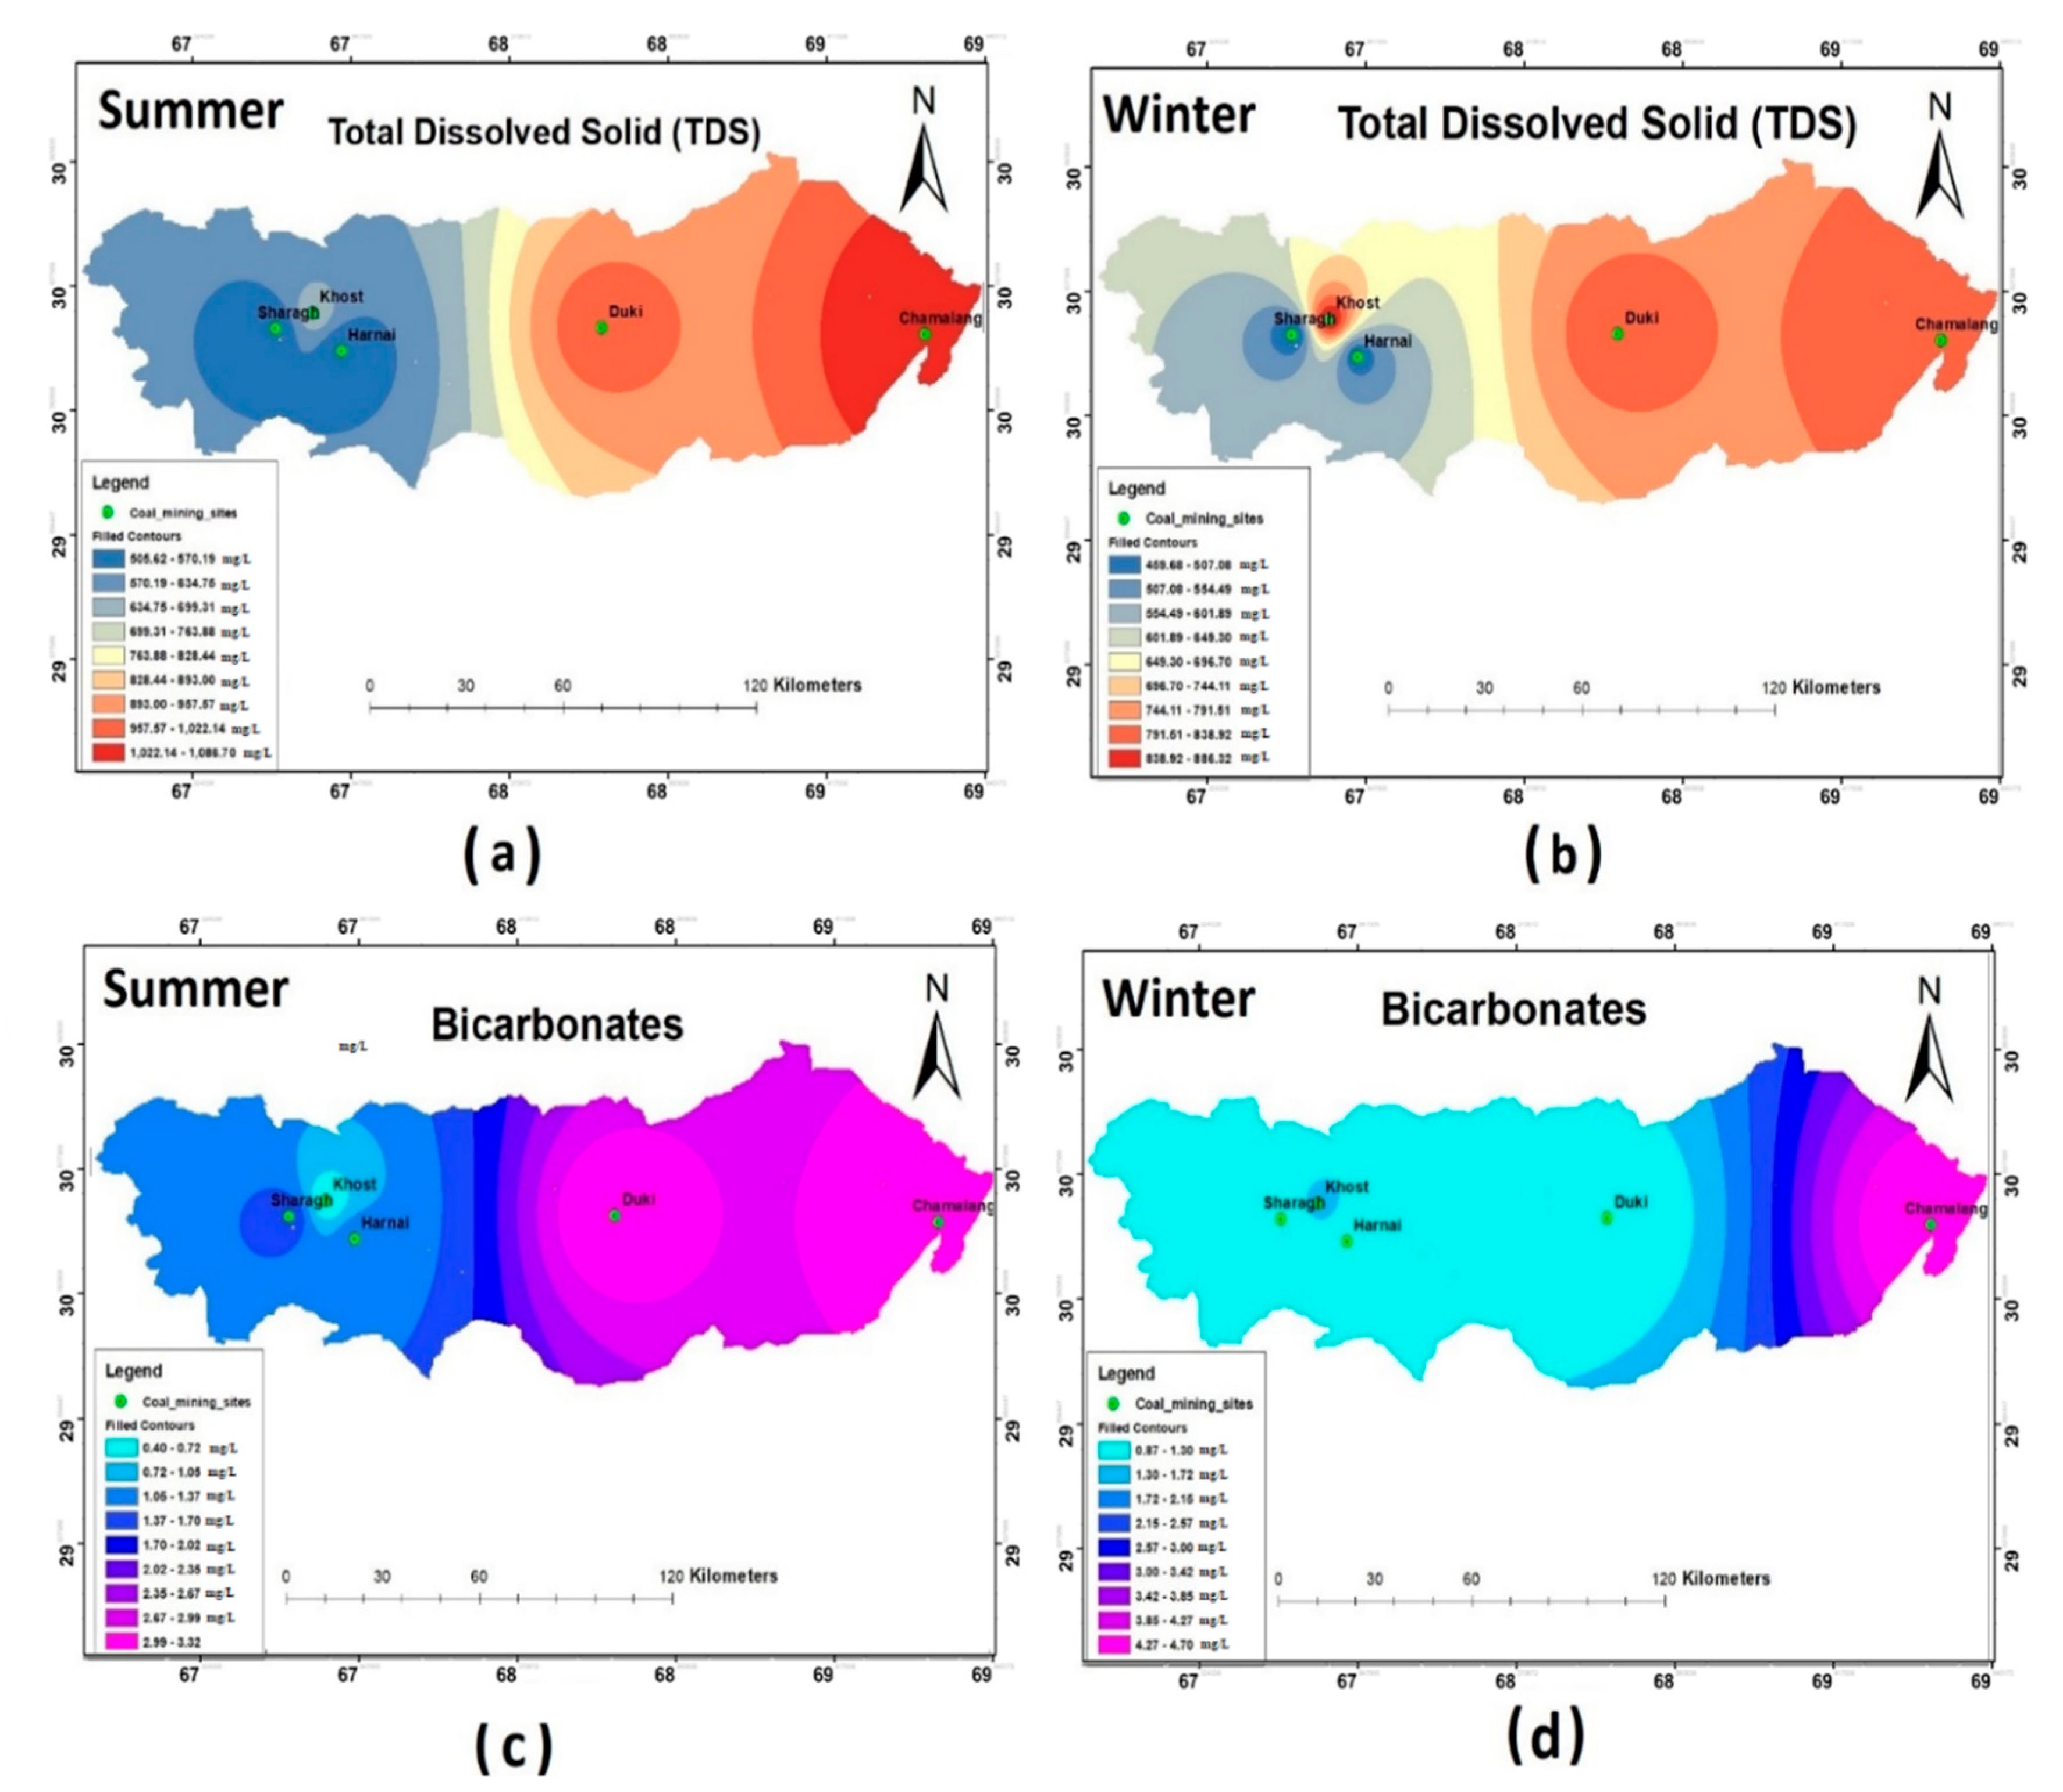
The TDS values of the water samples during both the seasons were within the allowable range of WHO (2011), except for Chamalang and Duki. TDS was widely distributed across the four districts, as depicted in Figure 3a,b. The spatial distribution of HCO3- showed that the measured concentrations were within the WHO permissible limits during both the sampling seasons. However, the highest HCO3- concentration was reported in Chamalang.
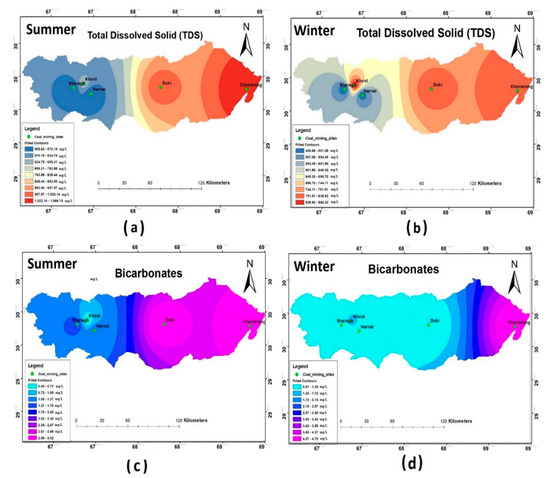
Figure 3.
Spatial distribution of (a) total dissolved solid (TDS) summer; (b) TDS winter; (c) HCO3- summer; (d) HCO3- winter.
3.1.3. Ca2+ and Mg2+
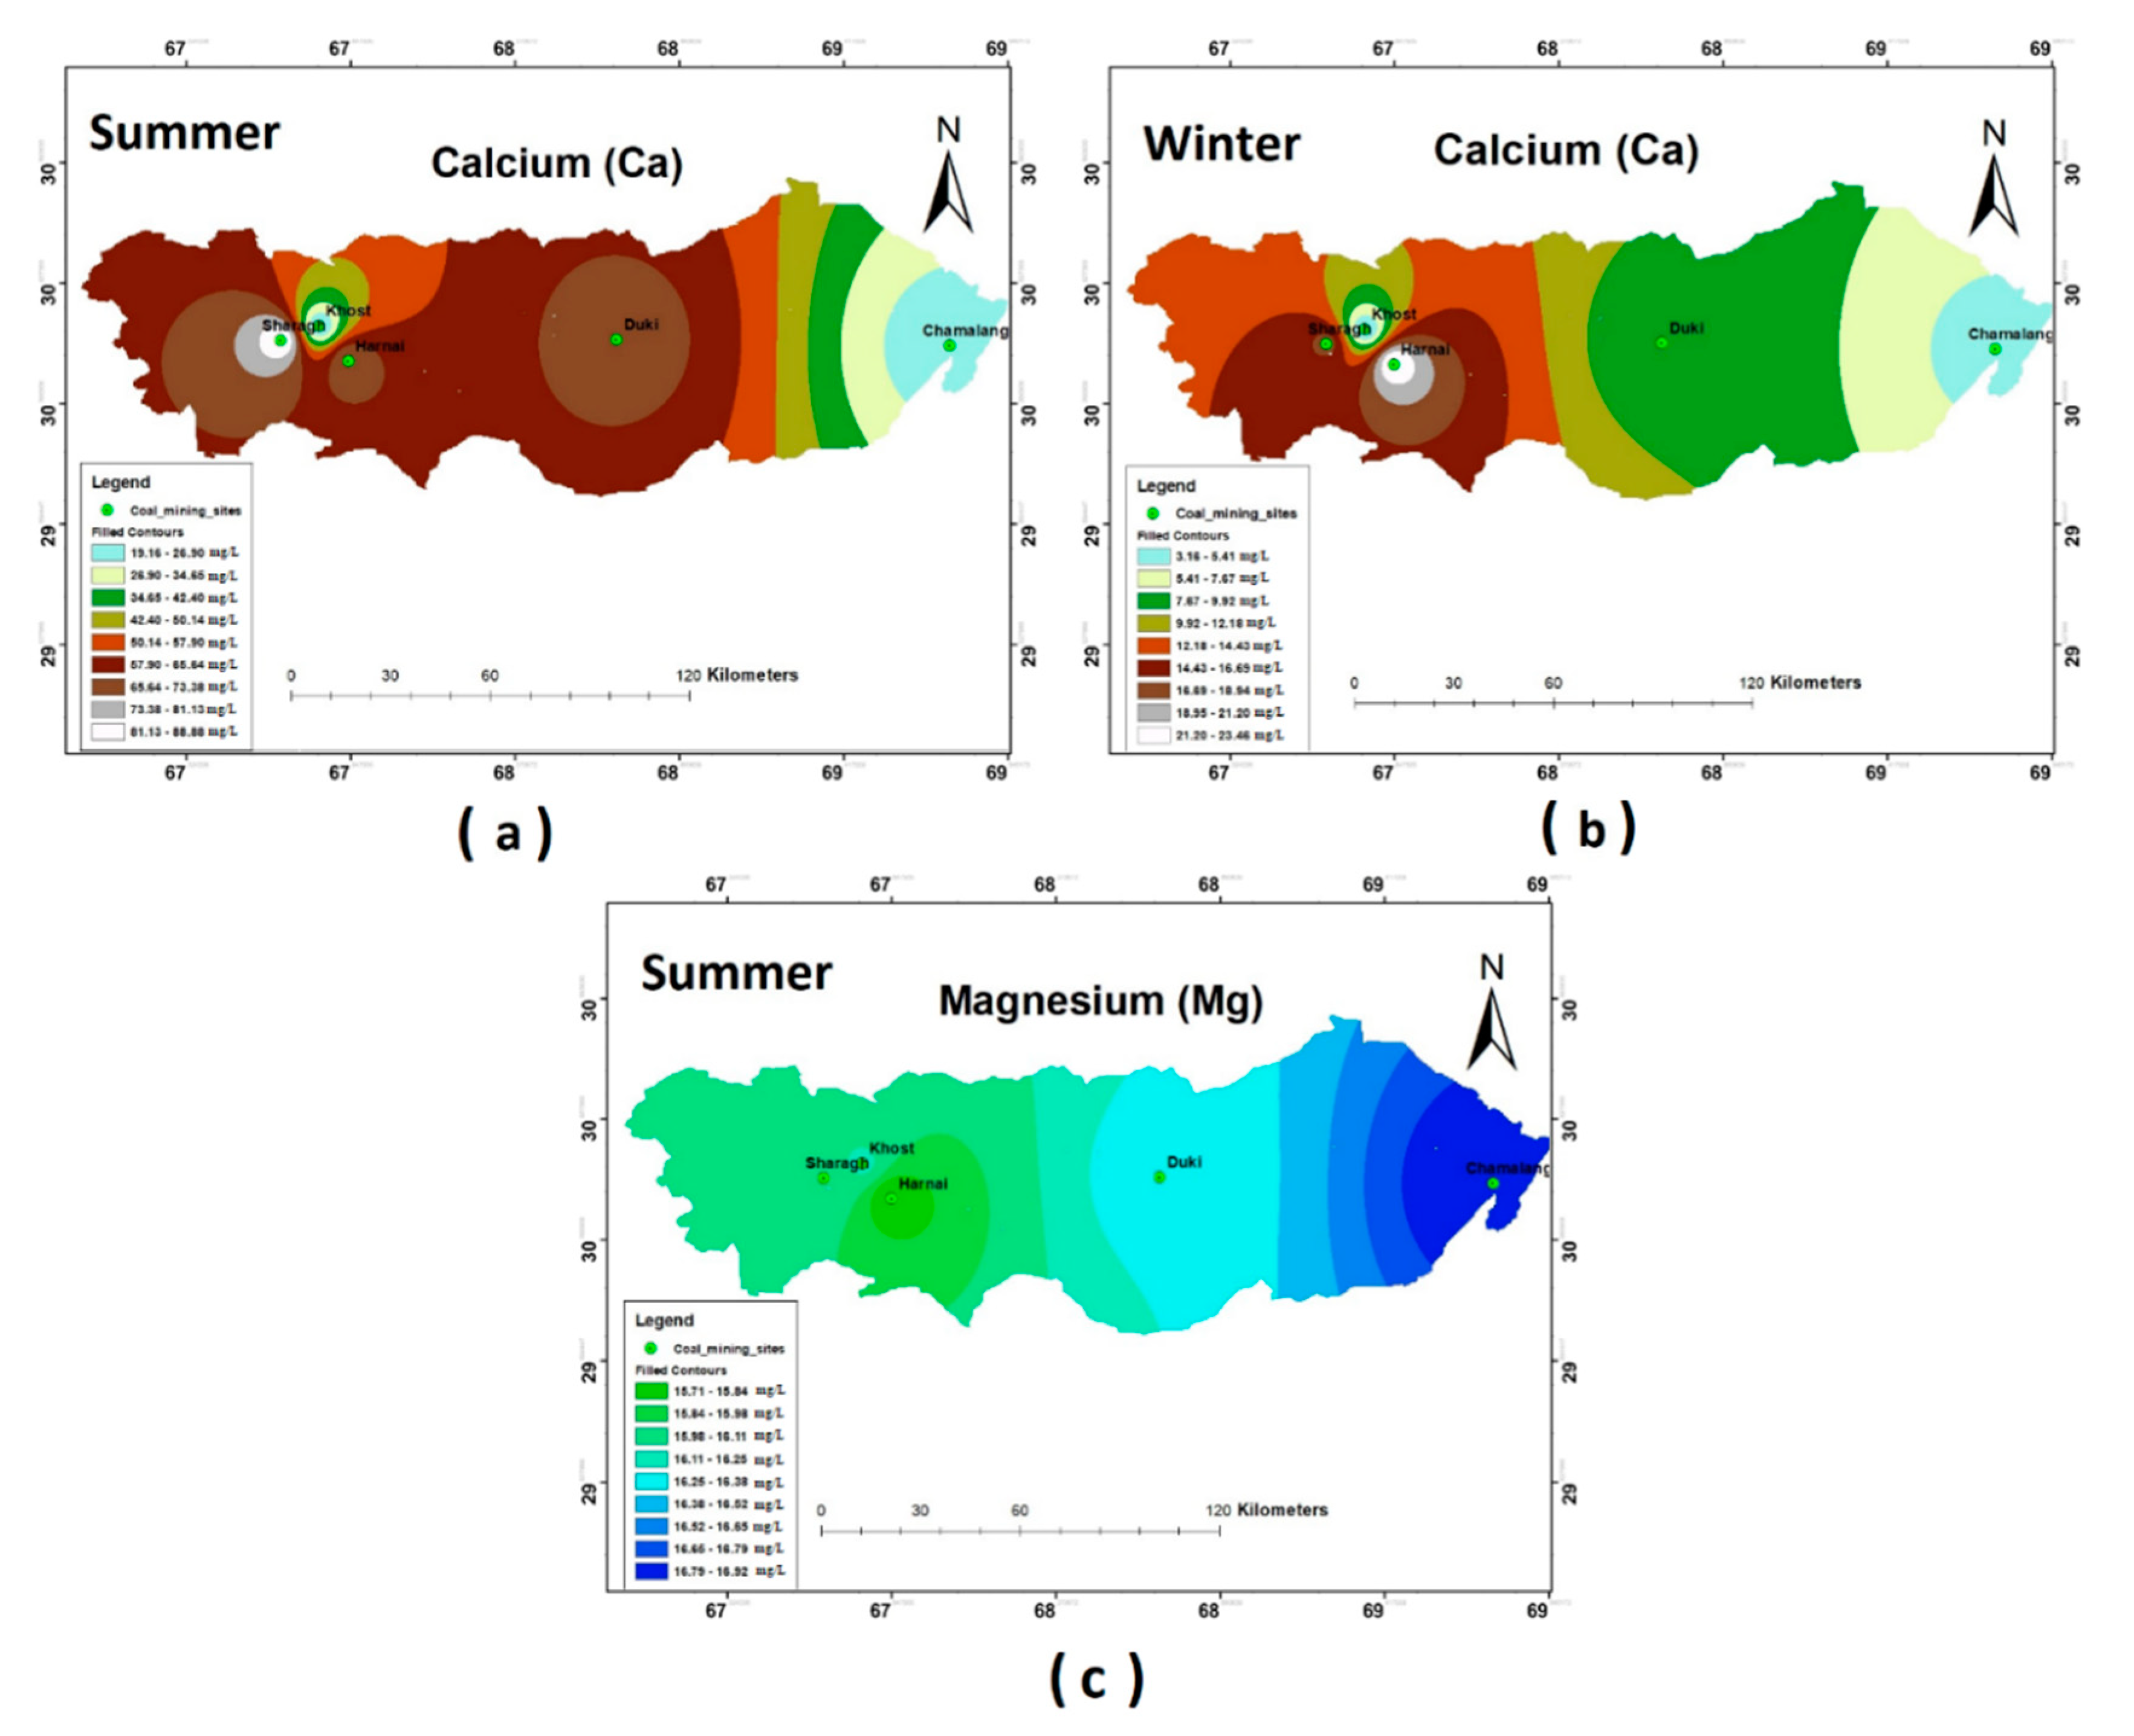
The concentrations of Ca2+ and Mg2+ in the groundwater of most study sites—i.e., Duki, Harnai, and Sharagh—exceeded the WHO (2011) prescribed limits during the summer season, while during the winter season, the measured Ca2+ and Mg2+ concentrations were found to be in accordance with WHO standards. The spatial distribution of these ions varied across the five selected stations, as shown in Figure 4a–c. No significant result was observed for Mg2+ during the winter season.
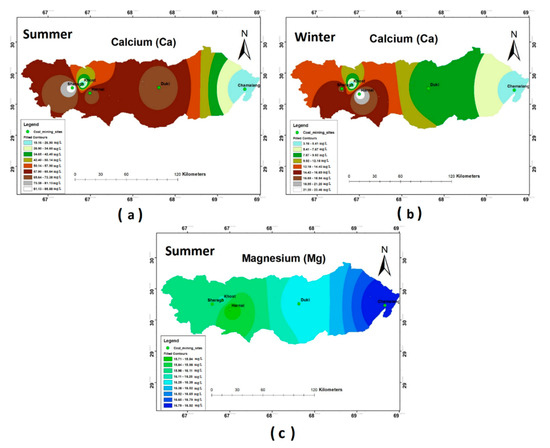
Figure 4.
Spatial distribution of (a) Ca summer; (b) Ca winter; (c) Mg summer.
3.1.4. Cd, Cr, Pb, Zn, Ni, and Hg
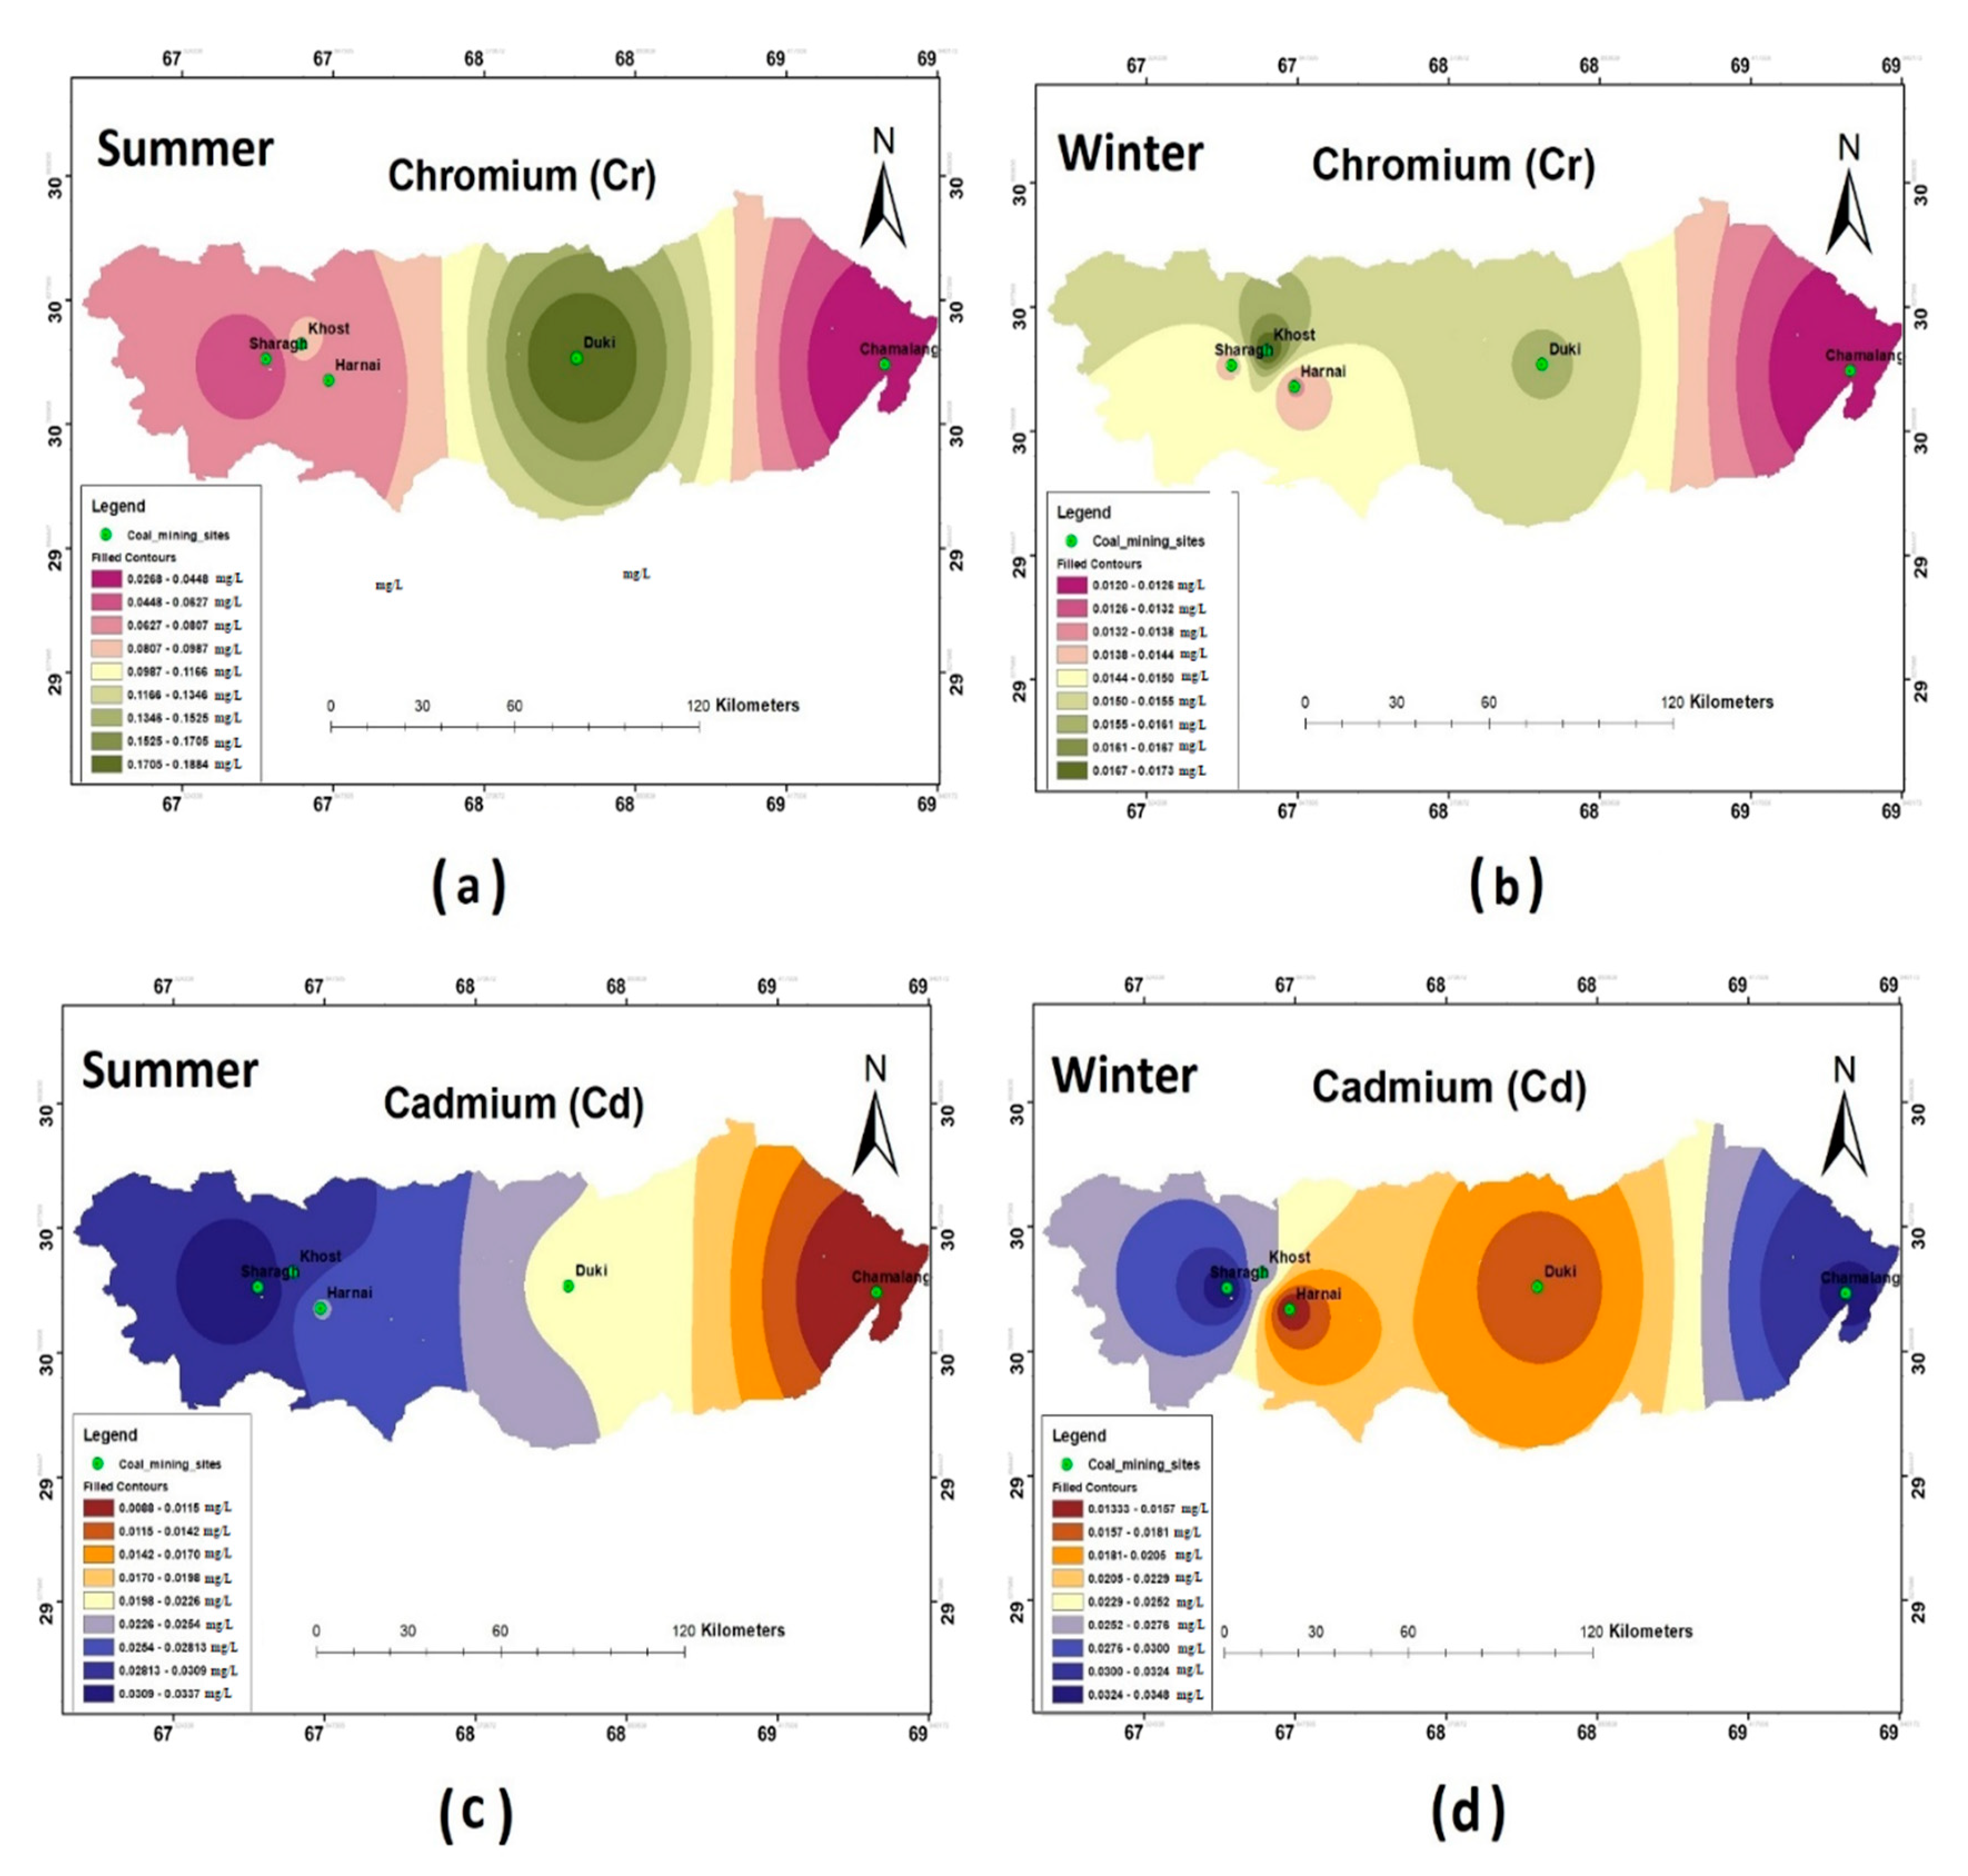
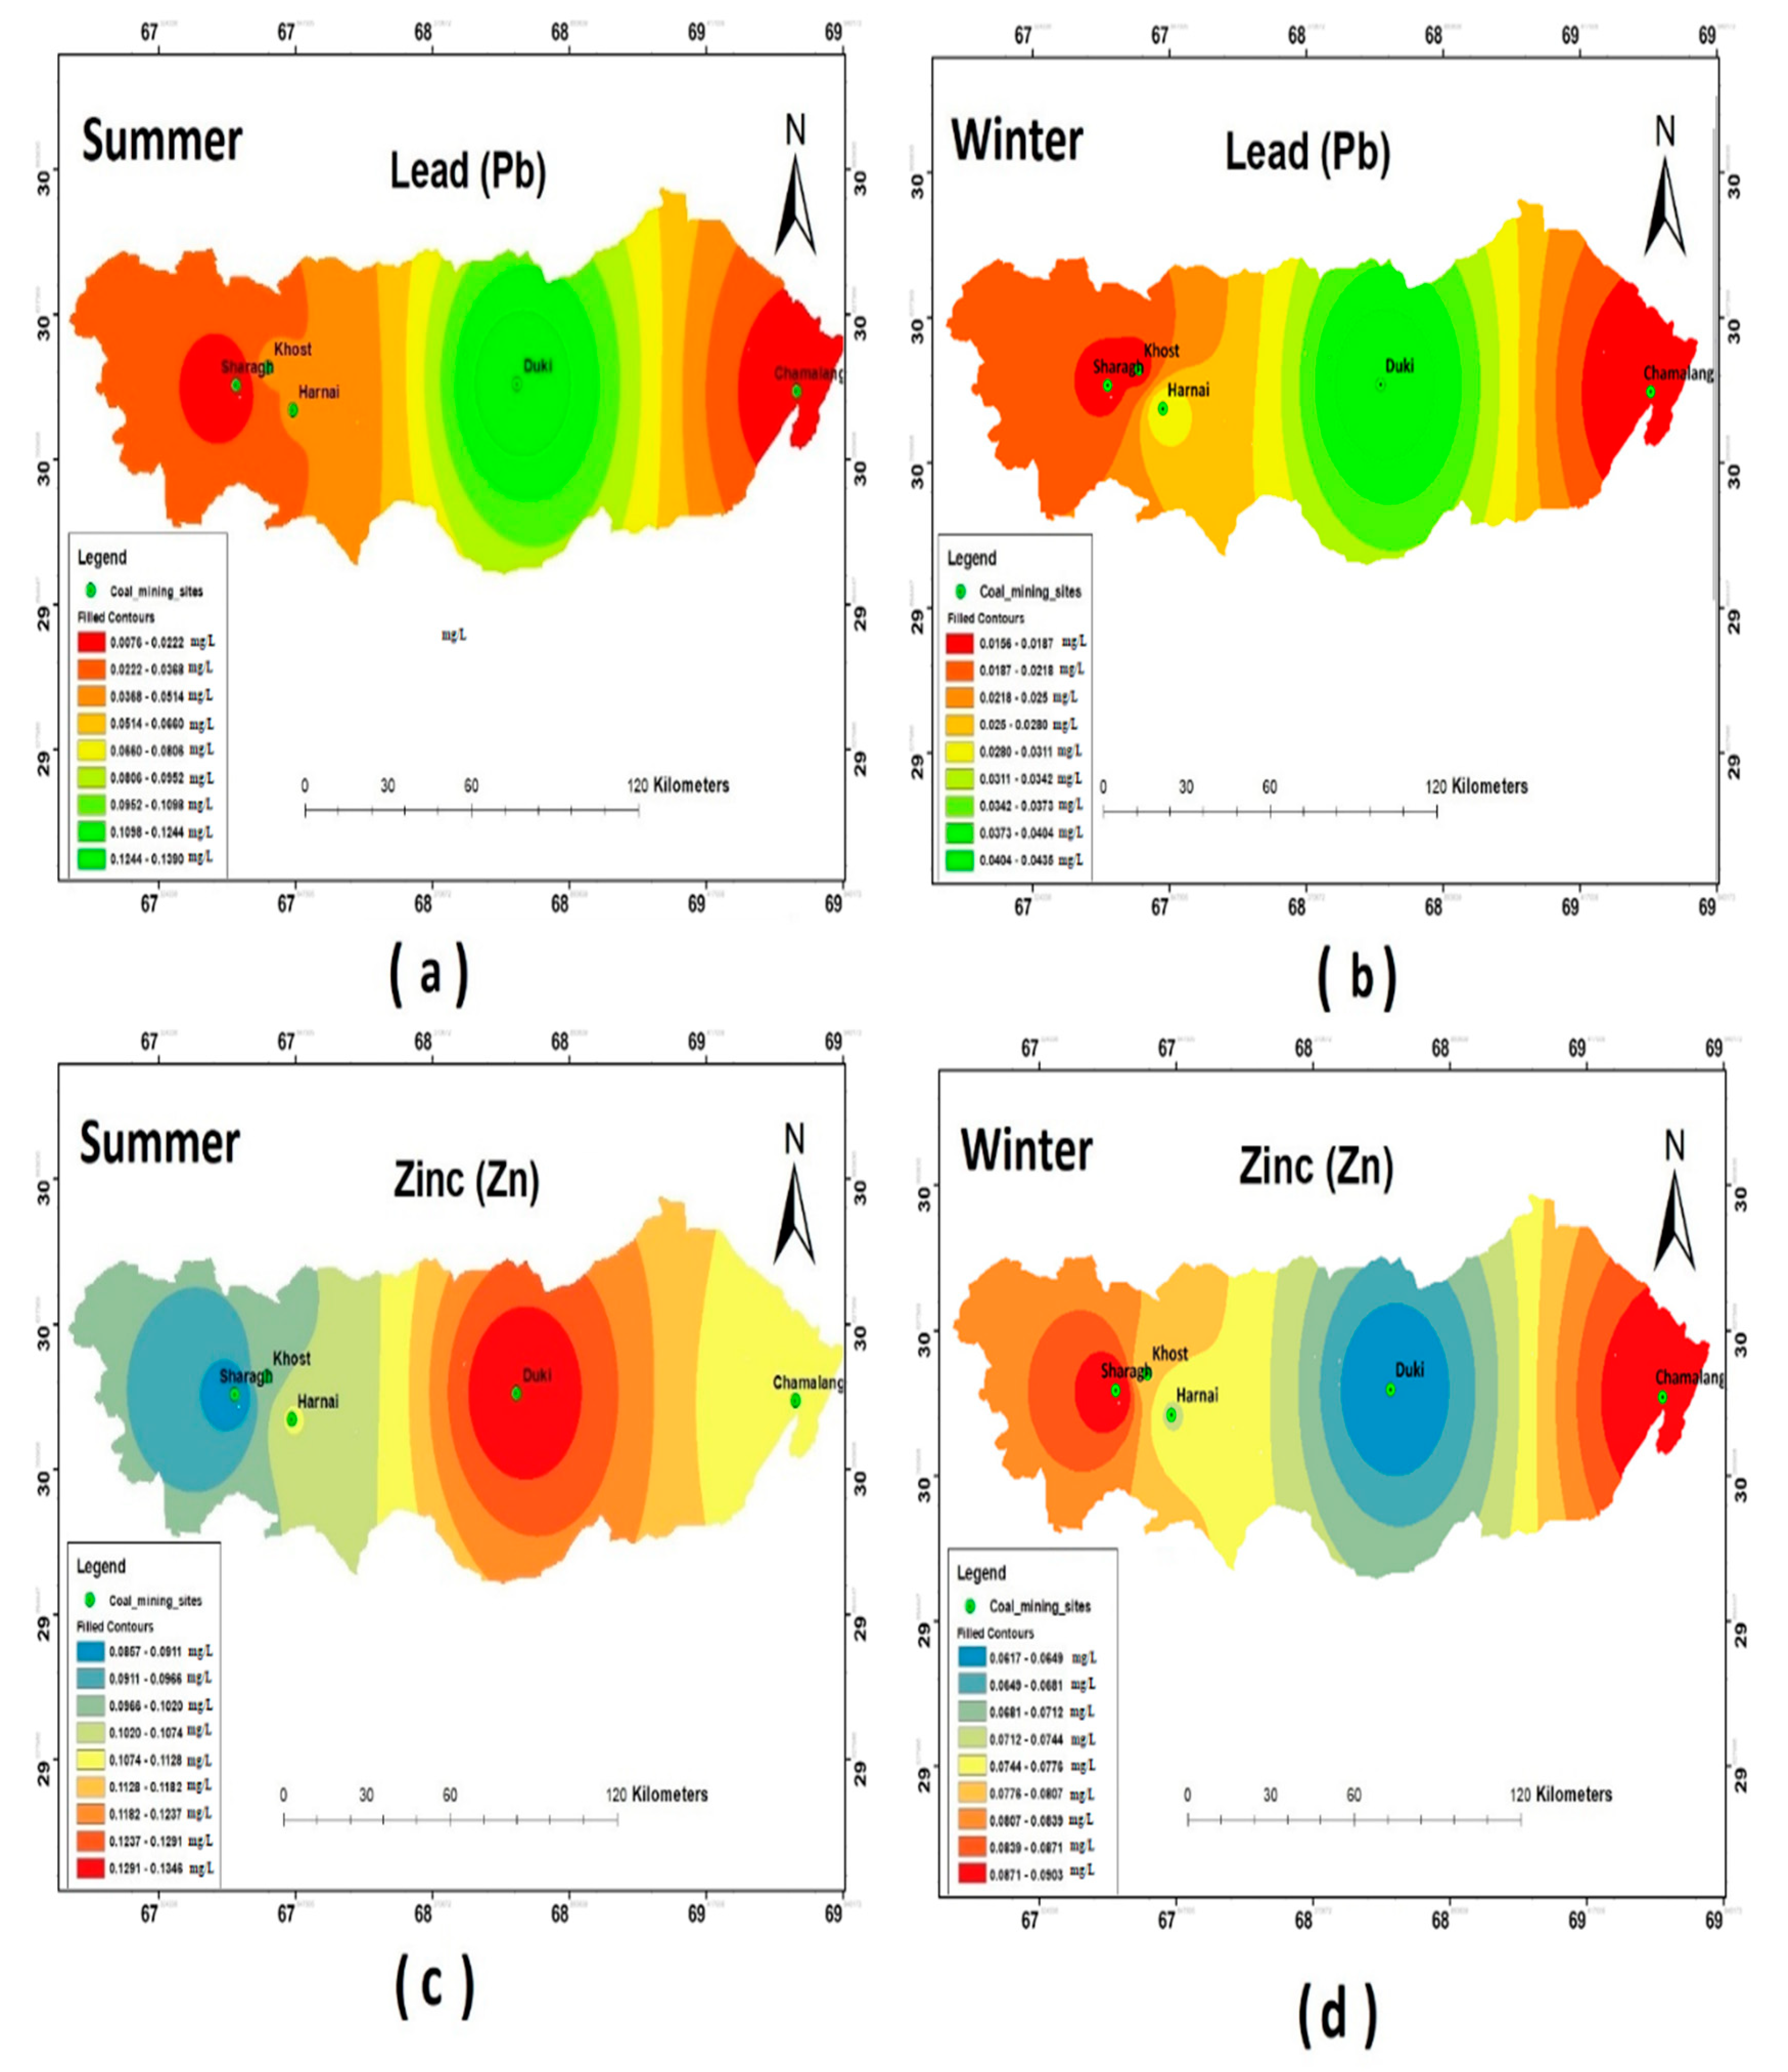
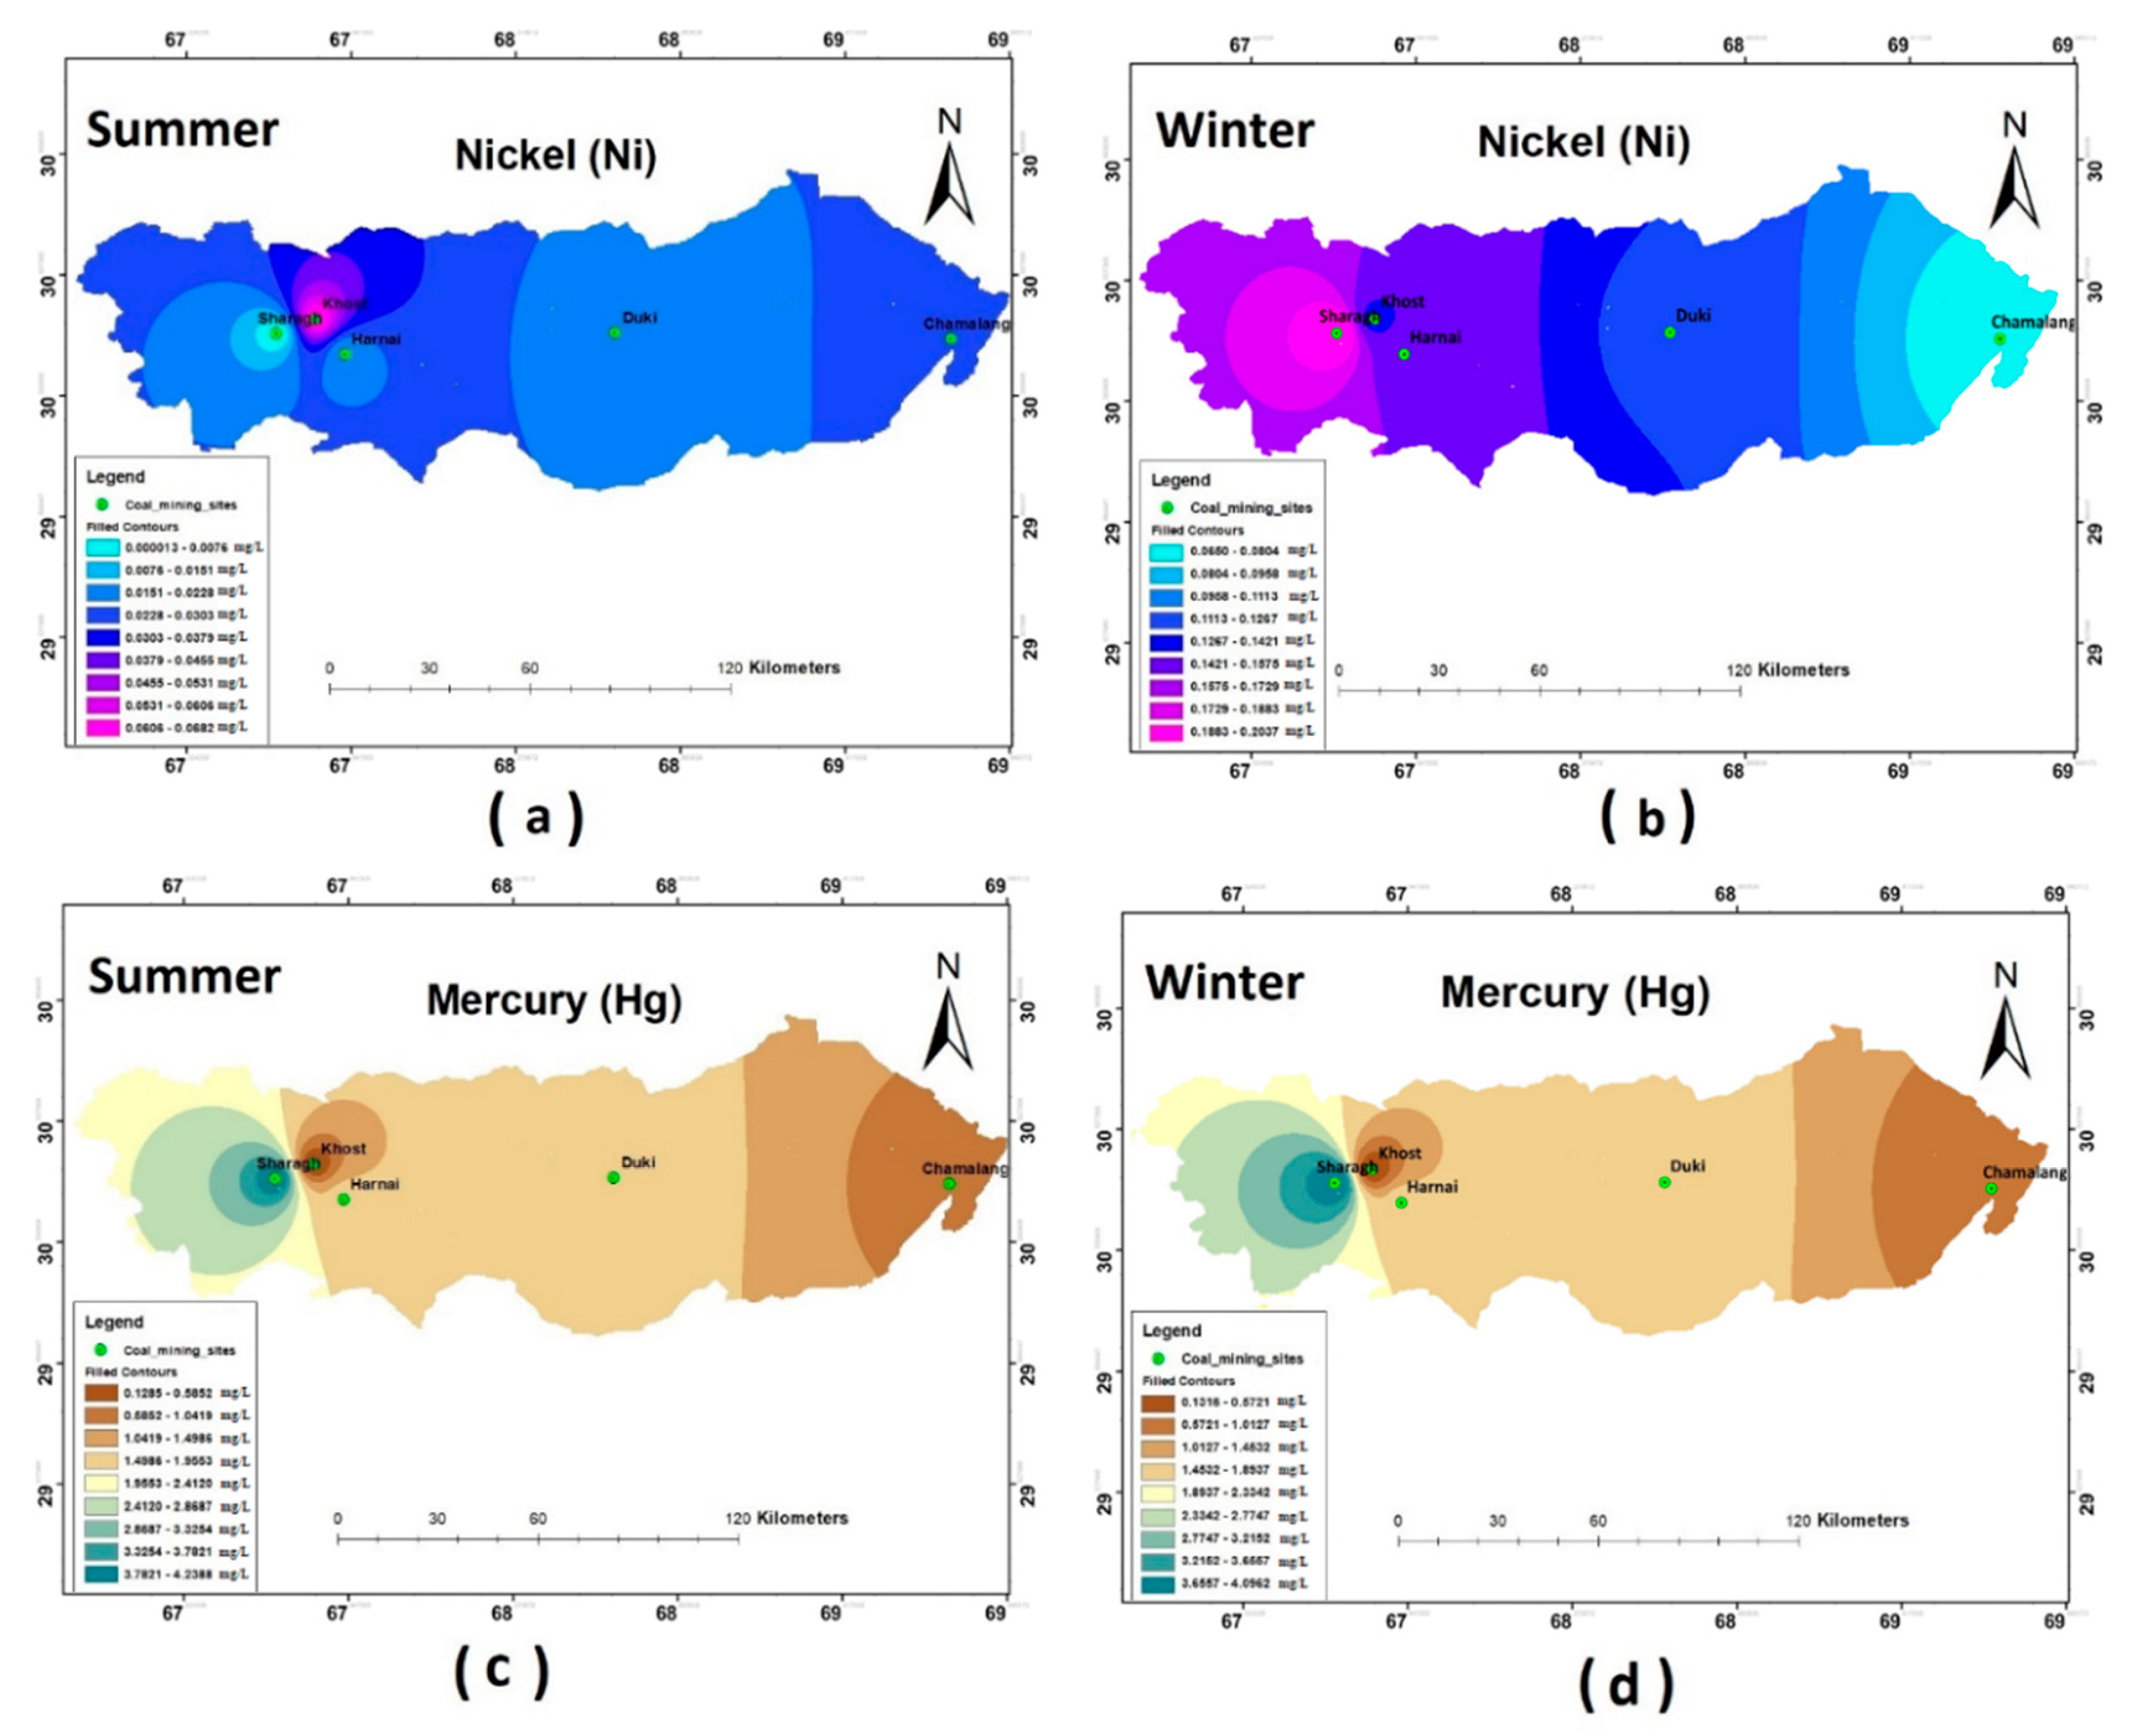
The results of the heavy metal analysis showed that the concentrations of Cd, Cr, Pb, and Ni during both the seasons (i.e., summer and winter) were above the permissible limits set by WHO standards (2011) in all the study sites. The Hg and Zn were an exception and were present in the safe WHO limits (see Figure 5, Figure 6 and Figure 7).
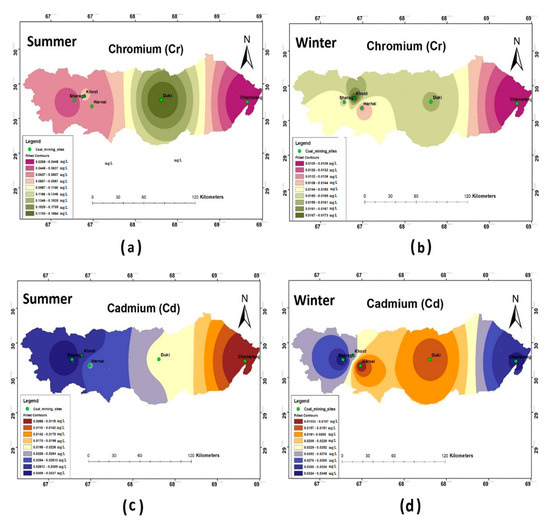
Figure 5.
Spatial distribution of (a) Cr summer; (b) Cr winter; (c) Cd summer; (d) Cd winter.
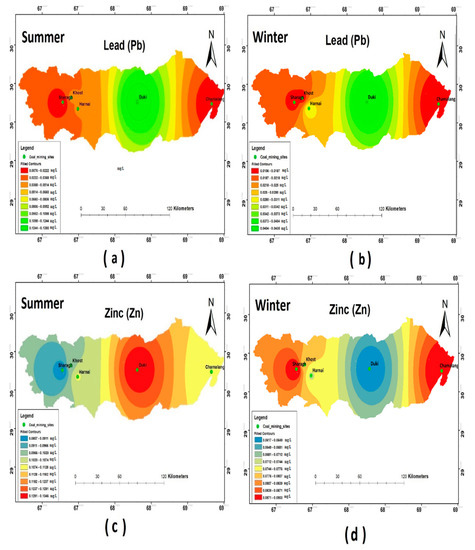
Figure 6.
Spatial distribution of (a) Pb summer; (b) Pb winter; (c) Zn summer; (d) Zn winter.
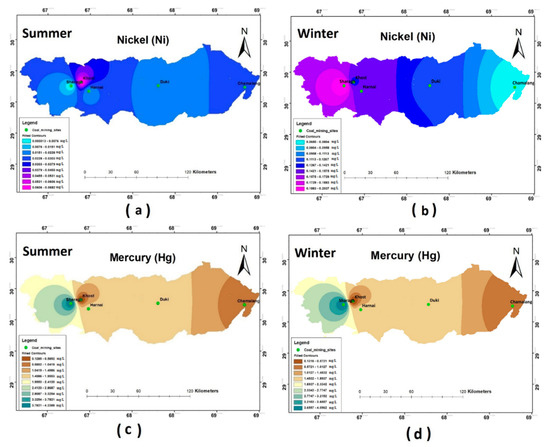
Figure 7.
Spatial distribution of (a) Ni summer; (b) Ni winter; (c) Hg summer; (d) Hg winter.
3.2. Water Quality Index
The computed WQI for the groundwater sample for the current study ranged between 68 and 483 (Chamalang), 75–523 (Duki), 67–152 (Harnai), 122–207 (Sharagh), and 92–201 (Khost). The WQI calculated for the current study illustrated the overall water quality of coal mining sites—i.e., from poor water to very poor water—as shown in Table 5.

Table 5.
Quality of drinking groundwater according to WQI grading of the whole study area.
The obtained results for the study locations can be attributed to the elevated levels of certain heavy metals and other physical parameters. As the study locations were functional coal mining sites, the excavation of coal and various mining activities might have had some profound effect on the groundwater. Wastes, such as overburdens (top layer of unconsolidated material above coal seam), from the coal mines are dumped near the coal mines. The sludge containing many minerals and heavy metals can leach into the environment or break open and contaminate an area. Activities, such as the removal of overburden and cleaning raw coal for industrial use, produce waste, which is traditionally dumped and will eventually pollute the water ecosystem [35].
3.3. Statistical Analysis
3.3.1. Principal Component Analysis
In the current study, a principal component analysis was carried out for 16 parameters selected for the groundwater quality assessment of all study sites during both seasons. Through the analysis, many principal components were generated, among which only the principle components that had an eigenvalue greater than 1 were retained. Table 6 shows the result of the principal component analysis. According to the results, the maximum (4) components were responsible in contributing to about 66.5% of the total variance.

Table 6.
Factor loadings with their variance and eigenvalue of each tested variable for the groundwater sample.
The very first component of the PCA revealed that it was responsible for about 25.9% variance and with the eigenvalue of 5.18. The most important parameters comprised by the first component that governed the groundwater chemistry were pH (0.78), Mg (–0.73), Cr (–0.64), Ni (0.83), and Zn (–0.79). The second component of PCA was comprised of about 18.8% variance with an eigenvalue of 3.8. Strong positive and negative loadings for EC (0.60), Ca (−0.77), and Hg (–0.61) were accounted for by factor 2, respectively. The third component of PCA was comprised of about 11.9% variance with an eigenvalue of 2.37. Unlike other components, the third component of PCA was only dominated by positive loadings: i.e., Cu (0.62). Similarly, the fourth component of PCA was comprised of about 10.1% with an eigenvalue of 2.01, having one positive loading for Cd (0.69) and one negative loading for Fe (–0.61).
3.3.2. Correlation Matrix Analysis
The correlation matrix was used to determine the degree of interrelationship between various water quality variables. It showed the extent of dependency of each parameter with one another [36]. The correlation matrix analysis’s results are presented in Table 7 for both of the seasonal sampling sessions of the selected coal mining sites.

Table 7.
Correlation matrix of the physicochemical variables of groundwater.
An exploration of the current results allowed the correlation pattern among the variables to be uncovered. An irregular pattern of correlation was observed, as depicted in Table 7. Strong and positive associations were shown by some variables, as well as negative and lack of associations. The whole hydrochemistry of the aquifers of the study region were governed and controlled. One of the most significant variables (i.e., pH) showed a negative association with almost all the variables (i.e., EC, TDS, HCO3-, Ca2+, Mg2+) and heavy metals (Cr, Co, Cu, Fe, Pb, Zn). The negative correlation of pH with the micronutrient (i.e., Cr, Co, Cu, Fe, Pb, and Zn) indicated that these micronutrients were only available at a lower pH but at a higher pH, their availability was restricted [37].
EC and TDS had a very strong and positive association among themselves and with other variables, such as HCO3-. The positive maximum association between EC and TDS was mainly because of the TDS, as it is the main driver for conductivity, and the main constituents of TDS are the ions present in the groundwater system [38]. Ni was negatively correlated with most of the parameters, including HCO3-. Similarly, positive correlations of EC and TDS with other water quality parameters were observed in different studies conducted through the world [39,40,41].
The hardness of groundwater depends upon the total concentration of divalent cations—i.e., Ca2+ and Mg2+ [42]. A very strong positive correlation between Ca2+ and Mg2+ is clearly depicted in Table 7 and both the cations also showed a positive interrelationship with Cr, Pb, and Zn. Generally, Ca+ and Mg+ ions were the dominant ions found in the natural water resources [43]. Ca2+ and Mg2+ showed a negative correlation with carbonates. A higher level of mineralization (Cr, Pb, and Zn) usually indicate a higher level of acidity during the nitrification process, which leads to the dissolution of carbonates with the enrichment of Ca2+ and Mg2+ in the groundwater source [42]. This interaction derives information on the geological origin of Ca2+ and Mg2+ in the aquifers [44]. The study area was found to be rich with respect to mineral accumulation and the spatial analysis carried out for these minerals in selected coal mining sites confirmed their concentration, distribution, and, most importantly, their correlation. Ample similar research throughout the world is present to confirm the present study results [45,46,47,48].
4. Discussion
Groundwater quality is considered as a function of natural—as well as anthropogenic—activities [49]. Documentation of groundwater quality in a region where it is the only source of drinking water is of utmost importance. The results from the current study suggested that the deterioration of drinking water is influenced by natural—as well anthropogenic—activities around the coal mines of Balochistan. Coal resources are, economically, the cheapest source of energy in the region, and this has led to the overexploitation of coal resources. The overall results of the current study were in line with a similar study reported in the Thar coalfield of Pakistan [50]. The slight increase of pH during the summer season in the groundwater might be due to the calcareous nature of the underlaying aquifers of the study area. This can be attributed to the discharge of a large quantity of electrolytes and minerals from coal mining waste and the interaction of water with the bed rocks [51]. The higher value of EC in the underground water samples might be due to the dissolution of minerals and interaction of water with the bed rocks. Water EC provides an important indication of the amount of nutrients dissolved in water solution. However, a higher EC level can lead to salt toxicity. The higher concentration of TDS in the water samples was mainly because of the dissolved inorganic salts and the small amount of organic substances. TDS levels in the groundwater can also be a measure of salinity level. Lowering the TDS concentration will lower the salinity, and a higher conc. of TDS (>1000) could indicate a very high salinity level [52]. However, the measured TDS values showed a reduced water quality, with significant health issues for mineworkers.
This varied distribution of HCO3- and Cl- in groundwater of the study area might be due to the dissolution of minerals from the sedimentary rocks and the weathering of calcite in the parental mineral rock most commonly found in local geology [53]. The results of the current study for HCO3- and Cl- are in line with other similar studies conducted in other parts of the country [54]. High HCO3- levels in water can lead to an increase in the pH level. Elevated levels of Ca2+ and Mg2+ in some of the sampled groundwater may be due to the cationic exchange with sodium. Calcium is naturally present in drinking water as calcium carbonate or calcium chloride. The results of the current study are in line with other similar studies conducted in other parts of the country [54,55]. While the source of magnesium is dolomite and magnetite rocks, metals are released and distributed in the aquatic ecosystem from different natural sources (e.g., volcanic activity, ore deposits, bed rocks erosion, and weathering) and anthropogenic sources (e.g., mining, agricultural activities, smelting, industrial influx, etc.) [56]. This can be attributed to the release of acid mine draining directly into the water resource. The acid drainage from coal mines or coal disposal piles contain a significant amount of metals [57]. The presences of these elements are because of the leaching of minerals, such as silicates and sulfides. These minerals are directly associated with layers of coal body and parent rocks—i.e., siltstones, shales, limestones, and sandstones [58]. Similar research on quantifying these metals and apportioning the source of their distribution in the groundwater can be seen in various parts of the world [59,60,61]. The elevated concentrations of the majority of the selected parameters during the winter season can be attributed to the high rainfall that triggers the phenomenon of leaching in higher rates than before. The previous studies conducted globally indicated that untreated mine waste is the main source of heavy metals and can leach the underground water resource while the surface water is polluted by the surface runoff during the wet season [62,63,64,65].
From the analysis, many principal components were generated. According to the results, the maximum (4) components were responsible for contributing to about 66.5% of the total variance. The very first component of PCA revealed that it was responsible for about 25.9% variance, with the eigenvalue of 5.18. The most important parameters comprised by the first component that governed and controlled the whole groundwater chemistry were pH (0.78), Mg (–0.73), K (–0.71), Cr (–0.64), Ni (0.83), and Zn (–0.79). The second component of PCA was comprised of about 18.8% variance with an eigenvalue of 3.8. Strong positive and negative loadings for EC (0.60), Na (0.78), and Ca (–0.77) and Hg (–0.61) were accounted for by factor 2, respectively. The third component of PCA was comprised of about 11.9% variance with an eigenvalue of 2.37. Unlike other components, the third component of PCA was only dominated by positive loadings: i.e., carbonates (0.62) and Cu (0.62). Similarly, the fourth component of PCA was comprised of about 10.1% with an eigenvalue of 2.01, having one positive loading for Cd (0.69) and one negative loading for Fe (–0.61).
In the current study, the correlation matrix showed positive as well as slightly negative correlations among various heavy and light metals. As clearly shown in Table 7, micronutrients, such as Cd, Cr, Co, and Cu, had a very strong positive correlation among themselves, and a positive association towards Hg and Zn was also observed [63]. This positive association among these heavy and light metals was because of the same origin or source [22]. These heavy metals abundantly originated from solid waste, such as lead batteries, steel scarps, cans, and tins [40]. Coal mining sites can be considered as the point source for the release of these metals into the groundwater system. During coal mining, heavy machinery for excavation is used, so it might be suggested that coal mines and coal mining activities are a source of release for these metals and, thus, deteriorate the water system. In the study area, waste from the underground coal mines was dumped just outside the mines contaminating the soil surface. Interaction of this waste with rainwater can lead to the leaching of these heavy metals, resulting in the accumulation of the majority of pollutants in groundwater, which, in turn, can pollute the whole water system. Similarly, trends of correlation between heavy metals that cause pollution in the water resources have also been spotted in various other studies [66,67,68].
5. Conclusions
A successful evaluation for groundwater quality in the five selected coal mining sites scattered across the four districts of Balochistan was accomplished through the analysis of physicochemical parameters in two seasons. An analysis of these parameters indicated that many parameters were beyond their permissible limits according to the WHO standards (2011) except for a few variables. Results computed from the WQI were high for all the selected sites, which indicated the deteriorated status of drinking water quality around coal mines. In the current study, a correlation between physicochemical variables and heavy metals revealed that during both the seasons, natural as well as manmade sources (i.e., coal mining activities) were the main source of pollution of these metals in the groundwater reservoirs. Therefore, the results suggested that the deterioration of drinking water is influenced by natural as well anthropogenic activities around the coal mines of Balochistan. Looking at the economic value of coal, these coal mines are functional almost 24 hours a day, so the continuous activity can lead to even more deterioration of the water system. Different scientifically proven methods should be adopted prior to the dumping of mine waste. This research can provide baseline data for concerned authorities, as well as the public, for contaminant prevention, remediation, planning management strategies, and for future environmental monitoring.
Author Contributions
Conceptualization, A.A. and S.S.A.; methodology, A.A. and S.S.A.; software, A.A; formal analysis, A.A.; resources, A.A.; data curation, A.A.; writing—original draft preparation, A.A.; writing review, S.S.A.; supervision S.S.A. All authors have read and agreed to the published version of the manuscript.
Funding
This research received no external funding.
Acknowledgments
The first author most graciously acknowledges Fatima Jinnah Women University, Rawalpindi and Higher Education Commission (HEC) of Pakistan for providing Indigenous fellowship throughout her Ph.D. studies.
Conflicts of Interest
The authors declare no conflict of interest.
References
- Khan, A.R.; Khan, M.H.; Santosh, K.S.; Sibtain, S.F. Desulphurization of lignitic coals using aqueous cupric chloride. Pak. J. Sci. Ind. Res. 2003, 46, 73–77. [Google Scholar]
- Ali, H.M.Z.; Khan, M.K. Ranking of Paleocene age coal salt range, Punjab and its application in coal fired power plants. Sci. Int. 2015, 27, 1243–1246. [Google Scholar]
- Malkani, M.S. A review of coal and water resources of Pakistan. Sci. Technol. Dev. 2012, 31, 202–218. [Google Scholar]
- Gupta, S.K.; Nikhil, K. Ground water contamination in coal mining areas: A critical review. Int. J. Eng. Appl. Sci. 2016, 3, 69–74. [Google Scholar]
- Lloyd, P.J. Coal Mining and the Environment; Energy Research Institute, University of Cape Town: Cape Town, South Africa, 2002. [Google Scholar]
- Munnik, V.; Hochmann, G.; Hlabane, M.; Law, S. The Social and Environmental Consequences of Coal Mining in South Africa: A Case Study; Environmental Monitoring Group: Cape Town, Africa, 2010. [Google Scholar]
- Khair, S.M.; Mushtaq, S.; Culas, R.J.; Hafeez, M. Groundwater markets under the water scarcity and declining watertable conditions: The upland Balochistan Region of Pakistan. Agric. Syst. 2012, 107, 21–32. [Google Scholar] [CrossRef]
- Ishaque, W.; Shaikh, S. Water and energy security for Pakistan a retrospective analysis. Grassroots 2017, 51, 1. [Google Scholar]
- Ullah, R.; Malik, R.N.; Qadir, A. Assessment of groundwater contamination in an industrial city, Sialkot, Pakistan. Afr. J. Environ. Sci. Technol. 2009, 3, 12. [Google Scholar]
- Van Steenbergen, F.; Kaisarani, A.B.; Khan, N.U.; Gohar, M.S. A case of groundwater depletion in Balochistan, Pakistan: Enter into the void. J. Hydrol. Reg. Stud. 2015, 4, 36–47. [Google Scholar] [CrossRef]
- Khair, S.M.; Mushtaq, S.; Reardon-Smith, K. Groundwater Governance in a Water-Starved Country: Public Policy, Farmers’ Perceptions, and Drivers of Tubewell Adoption in Balochistan, Pakistan. Groundwater 2015, 53, 626–637. [Google Scholar] [CrossRef] [PubMed]
- Balakrishan, A.; Ramu, D.A.; Murugesan, A. Spatial distribution of heavy metal concentration in groundwater in and around Palk strait seashore area using GIS techniques. Int. J. Innov. Res. Sci. Eng. Technol. 2013, 2, 7650–7656. [Google Scholar]
- Ozyazici, M.A.; Dengiz, O.; Ozyazici, G. Spatial distribution of heavy metals density in cultivated soils of central and east parts of black sea region in Turkey. Eurasian J. Soil Sci. 2017, 6, 197–205. [Google Scholar] [CrossRef]
- Ungureanu, T.; Lancu, G.O.; Pintilei, M.; Chicos, M.M. Spatial distribution and geochemistry of heavy metals in soils: A case study from the NE area of Vaslui county, Romania. J. Geochem. Explor. 2017, 176, 20–32. [Google Scholar] [CrossRef]
- Qi, J.; Zhang, H.; Li, X.; Lu, J.; Zhang, G. Concentrations, spatial distribution and risk assessment of soil heavy metals in Zn-Pb mine district in southern China. Environ. Monit. Assess. 2016, 188, 1–11. [Google Scholar] [CrossRef]
- Vince, T.; Szabo, G.; Csoma, Z.; Sandor, G.; Szabo, S. The spatial distribution pattern of heavy metal concentrations in urban soils- a study of anthropogenic effects in Berehove, Ukraine. Cent. Eur. J. Geosci. 2014, 6, 330–343. [Google Scholar] [CrossRef]
- Santos-Frances, F.; Martinez-Grana, A.; Zarza, C.A.; Sanchez, A.G.; Rojo, P.A. Spatial distribution of heavy metals and the environmental quality od soil in the northern plateau of Spain by Geostatistical methods. Int. J. Environ. Res. Public Health. 2017, 14, 568. [Google Scholar] [CrossRef]
- Mahmoudabadi, E.; Sarmadian, F.; Moghaddam, R.N. Spatial distribution of soil heavy metals in different land uses of an industrial area of Tehran (Iran). Int. J. Environ. Sci. Technol. 2015, 12, 3283–3298. [Google Scholar] [CrossRef]
- Maleki, A.; Amini, H.; Nazmara, S.; Zandi, S.; Mahvi, A.H. Spatial distribution of heavy metals in soil, water and vegetables of farms in Sanandaj, Kurdistan, Iran. J. Environ. Health Sci. Eng. 2014, 12, 1–10. [Google Scholar] [CrossRef]
- Poonam, T.; Tanushree, B.; Sukalyan, C. Water quality indices—important tools for water quality assessment: A review. Int. J. Adv. Chem. 2015, 1, 15–29. [Google Scholar]
- Tyagi, S.; Sharma, B.; Singh, P.; Dobhal, R. Water quality assessment in terms of water quality index. Am. J. Water Res. 2013, 1, 34–38. [Google Scholar]
- Khanoranga; Khalid, S. An assessment of groundwater quality for irrigation and drinking purposes around brick kilns in three districts of Balochistan province, Pakistan. J. Geochem. Explor. 2019, 197, 14–26. [Google Scholar]
- Shabbir, R.; Ahmad, S.S. Use of geographic information system and water quality index to assess groundwater quality in Rawalpindi and Islamabad. Arab. J. Sci. Eng. 2015, 40, 2033–2047. [Google Scholar] [CrossRef]
- Loska, K.; Wiechula, D. Application of principal component analysis of source of heavy metal contamination in surface sediments from the Rybnik Reservoir. Chemosphere 2003, 51, 723–733. [Google Scholar] [CrossRef]
- Gergen, I.; Harmanescu, M. Application of principal component analysis in the pollution assessment with heavy metals of vegetable food chain in the old mining areas. Chem. Cent. J. 2012, 6, 1–13. [Google Scholar] [CrossRef] [PubMed]
- Zhiyuan, W.; Dengfeng, W.; Huiping, Z.; Zhiping, Q. Assessment of soil heavy metal pollution with principal component analysis and geoaccumulation index. Procedia Environ. Sci. 2011, 10, 1946–1952. [Google Scholar] [CrossRef]
- Decena, S.C.P.; Arguilles, M.S.; Robel, L.L. Assessing heavy metal contamination in surface sediments in an urban river in the Philippines. Pol. J. Environ. Stud. 2018, 27, 1983–1995. [Google Scholar] [CrossRef]
- Poyraz, B.; Taspinar, F. Analysis, Assessment, and principal component analysis of heavy metals in drinking water of indusrial region of Turkey. Int. J. Environ. Res. 2014, 8, 1261–1270. [Google Scholar]
- Das, S.; Nag, S.K. Application of multivariate statistical analysis concepts for assessment of hydro geochemistry of groundwater-a study in Suri I and II blocks of Birbhum District, west Bengal, India. Appl. Water Sci. 2017, 7, 873–888. [Google Scholar] [CrossRef]
- Safi, G.M.; Gadiwala, M.S.; Burke, F.; Azam, M.; Baqa, M.F. Agriculture productivity in Balochistan province of Pakistan: A geographical analysis. J. Basic Appl. Sci. 2014, 10, 292–298. [Google Scholar] [CrossRef]
- Malkani, M.S.; Alyani, M.I.; Khosa, M.H.; Buzdar, F.S.; Zahid, M.A. Coal resource of Pakistan, new coalfields. Lasbela Univ. J. Sci. Technol. 2016, 5, 7–22. [Google Scholar]
- Syed, M.A. Hydrogeology and groundwater resources of Balochistan Pakistan. An overview. Acta Mineral. Pak. 1997, 8, 30–38. [Google Scholar]
- Singh, K.P.; Malik, A.; Sinha, S.; Singh, V.K.; Murthy, R.C. Estimation of source of heavy metal contamination in sediments of Gomti river (India) using principal component analysis. Water Air Soil Pollut. 2005, 166, 321–341. [Google Scholar] [CrossRef]
- Nouri, J.; Mahvi, A.H.; Jahed, G.R.; Babaei, A.A. Regional distribution pattern of groundwater heavy metals resulting from agricultural activities. Environ. Geol. 2008, 55, 1337–1343. [Google Scholar] [CrossRef]
- Ketata-Rokbani, M.; Gueddari, M.; Bouhlila, R. Use of geographical information system and water quality index to assess groundwater quality in El Khairat deep aquifer (Enfidha, Tunisian Sahel). Iran J. Energy Environ. 2011, 2, 133–144. [Google Scholar]
- Bian, Z.; Wang, H.; Mu, S.; Leng, H. The impact of disposal and treatment of coal mining wastes on environment and farmland. In Proceedings of the International Conference Waste Management, Environmental Geotechnology and Global Sustainable Development, Ljubljana, Slovenia, 28–30 August 2007; pp. 1–15. [Google Scholar]
- Panaskar, D.B.; Wagh, V.M.; Muley, A.A.; Mukate, S.V.; Pawar, R.S.; Aamalawar, M.L. Evaluating groundwater suitability for the domestic, irrigation, and industrial purposes in Nanded Tehsil, Maharasgtra, India, using GIS and statistics. Arab. J. Geosci. 2016, 9, 1–16. [Google Scholar] [CrossRef]
- Lomaglio, T.; Hattab-Hambli, N.; Miard, F.; Lebrun, M.; Nandillon, R.; Trupiano, D.; Morabito, D. Cd, Pb, and Zn mobility and (bio) availability in contaminated soils from a former smelting site amended with biochar. Environ. Sci. Pollut. Res. 2017, 25, 25744–25756. [Google Scholar] [CrossRef]
- Singh, V.K.; Bikundia, D.S.; Sarswast, A.; Mohan, D. Groundwater quality assessment in the village of Lutfullapur Nawada, Loni, District Ghaziabad, Uttar Pradesh, India. Environ. Monit. Assess. 2012, 184, 4473–4488. [Google Scholar] [CrossRef]
- Bahar, M.M.; Reza, M.S. Hydrochemical characteristics and quality assessment of shallow groundwater in a coastal area of southwest Bangladesh. Environ. Earth Sci. 2010, 61, 1065–1073. [Google Scholar] [CrossRef]
- Kumar, S.K.; Bharani, R.; Magesh, N.S.; Godson, S.; Chandrasekar, N. Hydro geochemistry and groundwater quality appraisal of part of south Chennai coastal aquifers, Tamil Nadu, India using WQI and fuzzy logic method. Appl. Water Sci. 2014, 4, 341–350. [Google Scholar] [CrossRef]
- Arslan, H. Application of multivariate statistical techniques in the assessment of groundwater quality in seawater intrusion area in Bafra Plain, Turkey. Environ. Monit. Assess. 2013, 185, 2439–2452. [Google Scholar] [CrossRef]
- Jalali, M. Nitarte pollution of groundwater in Toyserkan, western Iran. Environ. Earth Sci. 2011, 62, 907–913. [Google Scholar] [CrossRef]
- Singh, A.K.; Mondal, G.C.; Kumar, S.; Singh, T.B.; Tewary, B.K.; Sinha, A. Major ion chemistry, weathering processes and water quality assessment in upper catchment of Damodar River basin, India. Environ. Geol. 2008, 54, 745–758. [Google Scholar] [CrossRef]
- Thilagavathi, R.; Chidambaram, S.; Prasanna, M.V.; Thivya, C.; Singaraja, C. A study on groundwater geochemistry and water quality in layered aquifers system of Pondicherry region, southeast India. Appl. Water Sci. 2012, 2, 253–269. [Google Scholar] [CrossRef]
- Belkhiri, L.; Boudoukha, A.; Mouni, L.; Baouz, T. Application of multivariate statistical methods and inverse geochemical modeling for characterization of groundwater—A case study: Ain Azel plain (Alegria). Geoderma 2010, 3, 390–398. [Google Scholar] [CrossRef]
- Hussain, Y.; Ullah, S.F.; Akhter, G.; Aslam, A.Q. Groundwater quality evaluation by electrical resistivity method for optimized tube well site selection in an ago-stressed Thal Doab Aquifer in Pakistan. Model. Earth Syst. Environ. 2017, 3, 15. [Google Scholar] [CrossRef]
- Chapagain, S.K.; Pandey, V.P.; Shretha, S.; Nakamura, T.; Kazama, F. Assessment of deep groundwater in Kathmandu Valley Using Multivariate statistical techniques. Water Air Soil Pollut. 2010, 1, 277–288. [Google Scholar] [CrossRef]
- Prajankar, P.N.; Tambekar, D.H.; Wate, S.R. Seasonal variation in groundwater quality of Yavatmal District, India. Eur. J. Chem. 2011, 8, 870–874. [Google Scholar]
- Ali, J.; Kazi, T.G.; Tuzen, M.; Ullah, N. Evaluation of mercury and physicochemical parameters in different depths of aquifer water of Thar coalfield, Pakistan. Environ. Sci. Pollut. Res. 2017, 24, 17731–17740. [Google Scholar] [CrossRef]
- Sharma, T.K.; Singh, R. Seasonal variation in Physico-chemical parameters of water in Laxmi Taal, Jhansi, India. Int. J. Curr. Microbiol. Appl. Sci. 2016, 5, 308–315. [Google Scholar] [CrossRef]
- Aleem, M.; Shun, C.J.; Li, C.; Aslam, A.M.; Yang, W.; Nawaz, M.I.; Ahmad, W.S.; Buttar, N.A. Evaluation of groundwater quality in the vicinity of Khurrianwala industrial zone, Pakistan. Water 2018, 10, 132. [Google Scholar] [CrossRef]
- Avci, H.; Dokuz, U.E.; Avci, A.S. Hydrochemistry and groundwater quality in a semiarid calcareous area: An evaluation of major ion chemistry using a stoichiometric approach. Environ. Monit. Assess. 2018, 190, 1–16. [Google Scholar] [CrossRef]
- Ahmad, Z.; Qadir, A. Source evaluation of physiochemically contaminated groundwater of Dera Ismail Khan area, Pakistan. Environ. Monit. Assess. 2011, 175, 9–21. [Google Scholar] [CrossRef] [PubMed]
- Naeem, M.; Khan, K.; Rehman, S.; Iqbal, J. Environmental assessment of ground water quality of Lahore area, Punjab, Pakistan. J. Appl. Sci. 2007, 7, 41–46. [Google Scholar]
- Campaner, V.P.; Luiz-Silva, W.; Machado, W. Geochemistry of acidmine drainage from a coal mining area and processes controlling metal attenuation in stream waters, southern Brazil. An. Acad. Brasil. Cienc. 2014, 86, 539–554. [Google Scholar] [CrossRef]
- Cheng, W.; Lei, S.; Bian, Z.; Zhao, Y.; Li, Y.; Gan, Y. Geographic distribution of heavy metals and identification of their sources in soils near large, open-pit coal mines using positive matrix factorization. J. Hazard. Mater. 2019, 387, 121666. [Google Scholar] [CrossRef] [PubMed]
- Rasool, A.; Xiao, T.; Farroqi, A.; Shafeeque, M.; Masood, S.; Ali, S.; Fahad, S.; Nasim, W. Arsenic and heavy metal contamination in the tube well water of Punjab, Pakistan and risk assessment: A case study. Ecol. Eng. 2016, 95, 90–100. [Google Scholar] [CrossRef]
- Rehman, W.; Zeb, A.; Noor, N.; Nawaz, M. Heavy metal pollution in various industries of Pakistan. Environ. Geol. 2008, 55, 353–358. [Google Scholar] [CrossRef]
- Wongsasuluk, P.; Chotpantarat, S.; Siriwong, W.; Robson, M. Heavy metal contamination and human health risk assessment in drinking water from shallow groundwater wells in an agricultural area in Ubon Ratchathani province, Thailand. Environ. Geochem. Health. 2014, 36, 169–182. [Google Scholar] [CrossRef]
- Tiwari, A.K.; Maio, M.D.; Singh, P.K.; Mahato, M.K. Evaluation of surface water quality by using GIS and a heavy metal pollution index (HPI) model in a coal mining area, India. Bull. Environ. Contam. Toxicol. 2015, 95, 304–310. [Google Scholar] [CrossRef]
- Wang, Z.; Sun, R.; Zhang, H.; Chen, L. Analysis and assessment of heavy metal contamination in surface water and sediments: A case study from Luan River, Northern China. Front. Environ. Sci. Eng. 2014, 9, 240–249. [Google Scholar] [CrossRef]
- Zhang, S.; Liu, G.; Sun, R.; Wu, D. Health risk assessment of heavy metals in groundwater of coal mining area: A case study in Dingji coal mine, Huainan coalfield, China. Human Ecol. Risk Assess. Int. J. 2016, 22, 1469–1479. [Google Scholar] [CrossRef]
- Ahamad, A.; Raju, N.J.; Madhav, S. Heavy metal contamination in groundwater and associated human health risk in the industrial region of southern Sonbhadra, Uttar Pradesh, India. Am. Geophys. Union Fall Meet. 2018, 2018, GH33C-1264. [Google Scholar]
- Okegye, J.I.; Gajere, J.N. Assessment of Heavy Metal Contamination in Surface and Ground Water Resources around Udege Mbeki Mining District, North-Central Nigeria. J. Geol. Geophys. 2015, 4, 1–7. [Google Scholar]
- Mansouri, B.; Salehi, J.; Etebari, B.; Moghddam, H.K. Metal concentrations in the groundwater in Birjand flood plain, Iran. Bull. Environ. Contam. Toxicol. 2012, 89, 138–142. [Google Scholar] [CrossRef] [PubMed]
- Bai, J.; Cui, B.; Chen, B.; Zhang, K.; Deng, W.; Gao, H.; Xiao, R. Spatial distribution and ecological risk assessment of heavy metals in surface sediments from a typical plateau lake wetland, China. Ecol. Model. 2011, 222, 301–306. [Google Scholar] [CrossRef]
- Sharma, R.K.; Agrawal, M.; Marshall, F. Heavy metal contamination of soil and vegetables in suburban area of Varani, India. Ecotoxicol. Environ. Saf. 2007, 66, 258–266. [Google Scholar] [CrossRef]
© 2020 by the authors. Licensee MDPI, Basel, Switzerland. This article is an open access article distributed under the terms and conditions of the Creative Commons Attribution (CC BY) license (http://creativecommons.org/licenses/by/4.0/).

