1. Introduction
Rural roads play a crucial role in the economic and social development of societies, linking rural communities to education, health services and markets. Rural poverty alleviation in developing countries depends on the synergy and simultaneous improvement of rural infrastructure, productive sectors, social and economic services. All of these provided by an appropriate macroeconomic framework and good governance policies [
1]. While in developed countries, rural roads are generally structurally designed low traffic facilities connecting towns with low populations with the primary and secondary network, in developing countries rural roads are commonly low-volume roads designed to meet the social and economic needs of the rural population [
2]. Moreover, in a three-level hierarchy network, these are secondary and tertiary roads in rural areas. Tertiary roads serve as an access route or link in a road transport chain with one end in the agricultural fields or villages and the other in the town market. Whereas, secondary roads have a double function, providing access and mobility by connecting the primary network to population, goods and services in rural areas.
Rural roads management can be defined as the process that covers all those activities involved in providing and maintaining rural roads at an adequate level of service [
3]. During the last decade, considerable efforts have been made to evaluate the benefits of managing rural roads under a sustainable approach [
4,
5,
6,
7]. The Southern African Development Community (SADC), in its Low-Volume Sealed Roads Guidelines, proposes that sustainable systems should ideally include political, social, institutional, technical, economic, financial and environmental dimensions. The guidelines suggest that long term goals of sustained economic growth and poverty alleviation in the region have failed in the past because one or more of these seven key dimensions were missing or inadequate in their management [
8]. Moreover, a sustainable management approach has to consider these key aspects throughout the whole life cycle of the rural road network. This considers the identification of optimum strategies at various management levels and the implementation of these strategies.
Rural road networks are traditionally managed under the assumption of predominant climatic conditions, prevailing stresses and strains affecting infrastructure during service life and the natural context where they are located. At the same time, transportation models assign traffic to the road network considering that all links are connected. However, empirical evidence has proven that natural hazards and human-induced phenomena commonly interrupt connectivity between links of rural roads. Natural hazards affecting road networks are commonly earthquakes, landslides, floods, intensive rains, tsunamis, and volcanic eruptions, among others. In particular, hydro-meteorological events result in recurrent impassability issues in rural roads, especially critical in a globally changing climate [
9,
10,
11]. Meanwhile, geological hazards, such as seismic and volcanic events, may result in major long-term effects as priority of rural roads is postponed to attend the primary network [
12,
13,
14]. Disruptions caused by natural hazards result in traffic detours and travel delays, increasing vehicle operating costs and inducing direct and indirect economic losses especially in highly vulnerable areas and access dependent, such as rural communities in developing countries.
Although efforts have led to a global rethinking of traditional rural roads management under a sustainable and systemic approach, limited research has been made to integrate these findings to risk assessment of rural road networks exposed to natural hazards. Risk assessment for sustainable infrastructure management systems should include a holistic approach, given the multiple uncertainties and dimensions involved [
14]. According to Haimess [
15], risk assessment for the sustainable management of infrastructure is a complex process due to three main factors: uncertainties behind risk quantification, the multidisciplinary nature of decision-making processes, and the multi-objective purpose when allocating resources. Badurdeen et al. [
14] poses that a sustainable infrastructure management system strongly depends on effective risk management in exposed contexts and, from a sustainable approach to asset management, it is necessary to consider the impacts in other dimensions such as social and environmental. Moreover, the incorporation of risk aspects for the sustainable management of infrastructure has been recently studied considering its relevance and applicability to different assets [
16,
17].
Given that rural roads are spatially distributed complex systems that provide accessibility and mobility to rural communities exposed to multiple natural hazards, it is essential that risk management of these networks should be addressed under a sustainable approach [
18]. Dimensions such as the socio-economic vulnerability of served population, environmental context and hazard exposure, as well as the physical vulnerability of rural roads, have to be consistently integrated under a sustainable risk management approach. A major concern in rural areas, especially in developing countries, is the socio-economic context of their population, which is highly vulnerable in a phase of a natural event. Koks et al. [
19] and Cutter et al. [
20] propose social aspects for the development of sustainable risk reduction strategies. The Hazard-of-Place model developed by Cutter [
21] is the first approach to jointly consider the vulnerability of the territory exposed to a natural hazard. Risk and mitigation actions interact in the models in order to shape the potential hazard condition in the area of study. This potential hazard condition interacts with both the geographical context and the social aspects of the territory. Such interactions result in biophysical and social vulnerability, respectively. The fact of incorporating social variables into the model indicates that although certain areas have a similar level of exposure to a hazard and environment, the affected society and its ability to face the event, their knowledge and their economic socio-economic condition can lead to significant variability of the resulting consequences between different zones and populations, impacting their total vulnerability (place vulnerability).
Available rural road management systems are mostly focused in the preservation and maintenance of pavements and bridges under the assumption of normal operation and absence of extreme natural events. In this sense, the main outcome of these management systems is to maintain the connectivity and level of service, while minimizing road user and agency costs [
22,
23,
24]. Some road management systems also account for other costs, such as emissions and accidents under multicriteria optimization methods. However, this type of analysis lacks of a broader approach where the effects of natural hazards to road users and rural population should also be considered.
The evidence presented previously remarks the lack of a sustainable approach for risk management of road networks in rural areas, since the technical and economic aspects are usually the drivers in decision making under normal operating conditions. Instead, a framework for the sustainable management of rural roads is required, considering the effect of natural hazards in the rural road network operation, the affected population and the inherent infrastructure fragility. The objective of the study is to propose a sustainable risk management framework for rural roads that accounts for the social vulnerability of rural population, the physical vulnerability of rural roads and the environmental context in terms of natural hazards. The proposed framework is applicable to rural road networks exposed to major natural events that permanently or temporarily disrupt traffic flow in the system. Through the selection of the case study attention is given to rural roads in developing countries, due to the socio-economic condition of rural population and high vulnerability in the context of natural events. The proposed risk management framework is scaled at the network level rather than an element-based analysis, or project level approach, considering the interdependencies between road links, the variability of road infrastructure types in the rural context, and the impacts on network accessibility and mobility due to natural events.
The study first discusses risk and vulnerability concepts that should be considered in rural contexts under a sustainable approach. The proposed framework is then described in detail, considering input data requirements, risk management models, proposed management processes and expected outcomes. Finally, the proposed framework is applied to a case study considering a rural road network located in Chile, which is exposed to volcanic hazard, specifically laharic flows. A real case scenario is finally analyzed from a simulation of the 2015 Villarrica eruption that interrupted the network operation as a consequence of bridge failure.
2. Vunerability and Risk to Natural Hazards Applied to Rural Contexts
Vulnerability refers to the susceptibility of exposed elements such as physical or capital assets, as well as human beings and their livelihoods, to experience harm, suffer damage or loss when impacted by single or compound hazardous events [
25,
26,
27]. A similar definition for road vulnerability is proposed by Berdica [
28], who defines it as the susceptibility of road networks to reduce their level of service (LoS). LoS is defined in this context as the ability of road networks to provide mobility and accessibility as defined by AASHTO [
18]. Murray et al. [
29] discusses several methodologies to assess vulnerability of road networks, which are extensive for risk and resilience estimation. The methods define the typology of the approaches as scenario-specific, strategy-specific, simulation, and mathematical modeling. The first two approaches are related to the effects of a reduction in the LoS in an area of a road network or the estimation of the vulnerability of the entire road network. Vulnerability can be estimated using deterministic or probabilistic methods. Deterministic methods commonly use vulnerability indexes that consider the current condition of road assets [
30,
31]. Probabilistic models are based on asset vulnerability, defined by damage states, and hazard intensity [
32]. Fragility curves are widely used in structural engineering, whereas specific models have been developed for road assets such as bridges, tunnels and embankments.
Authors have defined risk under different approaches and disciplines. Sanhueza et al. [
33] define risk as the consequences originated by a natural hazard; Renn [
34] defines it as the uncertain consequence of a natural event and Aven [
35] proposed deterministic and probabilistic definitions of risk as the combination of the probability of an event, natural or not, and its consequences over population. What is common in all definitions is that risk is the product of the natural event (hazard) and its consequences. In order to measure physical risk, it is necessary to evaluate how the system responds to external stimulations such as natural events.
Several methods have been proposed to assess vulnerability and risk of road networks. The most common procedure is the estimation of the cost of a closed network link or route. In this case the increase of travel time and operating cost is induced by re-routing traffic in the network, leading the risk problem to a traffic assignment problem or to a topological problem. Lleras-Echeverri and Sanchez-Silva [
36], Sakakibara et al. [
37], Taylor et al. [
38], Bell et al. [
39], Rocco and Ramirez-Marquez [
40], Luping and Dalin [
41], Taylor and Susilawiti [
42], Islam et al. [
43], proposed models for vulnerability assessment of road networks based on these principles.
Social vulnerability is a critical aspect to be accounted for the sustainable risk management in rural contexts. Risk to natural hazards traditionally considers the physical damage of exposed structures and the operational consequences due to system disruptions [
44]. This approach obviates social vulnerability, assuming that the exposed population is homogeneous [
19,
45]. According to Tate [
46] and Solangaarachchi et al. [
47], quantifying social vulnerability is essential for mitigation planning, recovery and for the better understanding of risk. Major floods and hurricanes in latest years, like Katrina and Rita, have evidenced the relevance of considering social impacts for the sustainable management of natural hazards [
48,
49,
50]. The effects of natural events are dependent on the socio-economic conditions and vulnerability of local communities, especially in rural environments [
51]. Cutter et al. [
20] remark that existing models to estimate social costs and benefits have limitations that preclude their consideration in traditional cost-benefit analysis.
There is not a unique definition of social vulnerability in the context of communities exposed to natural hazards. Cutter [
21] defines social vulnerability as the probability that an individual or community will be exposed to an adverse effect caused by a natural hazard. Meanwhile, Smit and Wandel [
52] define social vulnerability as the susceptibility of a society to suffer the impacts caused by natural events.
There are three different approaches to evaluate social vulnerability [
53]: damage matrices, fragility functions, and vulnerability indicators. The latter are widely used in the social sciences field [
53,
54]. Under this approach one of the most commonly used indicators is the Social Vulnerability Index (SoVI) developed by Cutter et al. [
25] in USA and applied in different countries such as Brazil [
51], Portugal [
55], Italy [
56] and China [
57].
Social vulnerability is commonly related to territory considering the hazard or environment. Frigerio et al. [
56] combines social vulnerability and seismic hazard creating a risk matrix which crosses social vulnerability levels with different seismic zones in Italy. Fekete [
50] proposes a composite risk index that considers social vulnerability, flooding hazard and exposed critical infrastructure.
The U.S. Army Corps of Engineers has incorporated the social dimension to flood risk management, in collaboration with other agencies, to reduce the consequences and thus manage the residual risk, based on recent experiences such as hurricane Katrina, Mississippi and Missouri River flooding [
20]. SoVI has been successfully incorporated in these experiences, moreover, it may be potentially included into cost–benefit analyses as a weight for the present value of the benefits.
3. Sustainable Risk Management Framework for Rural Roads
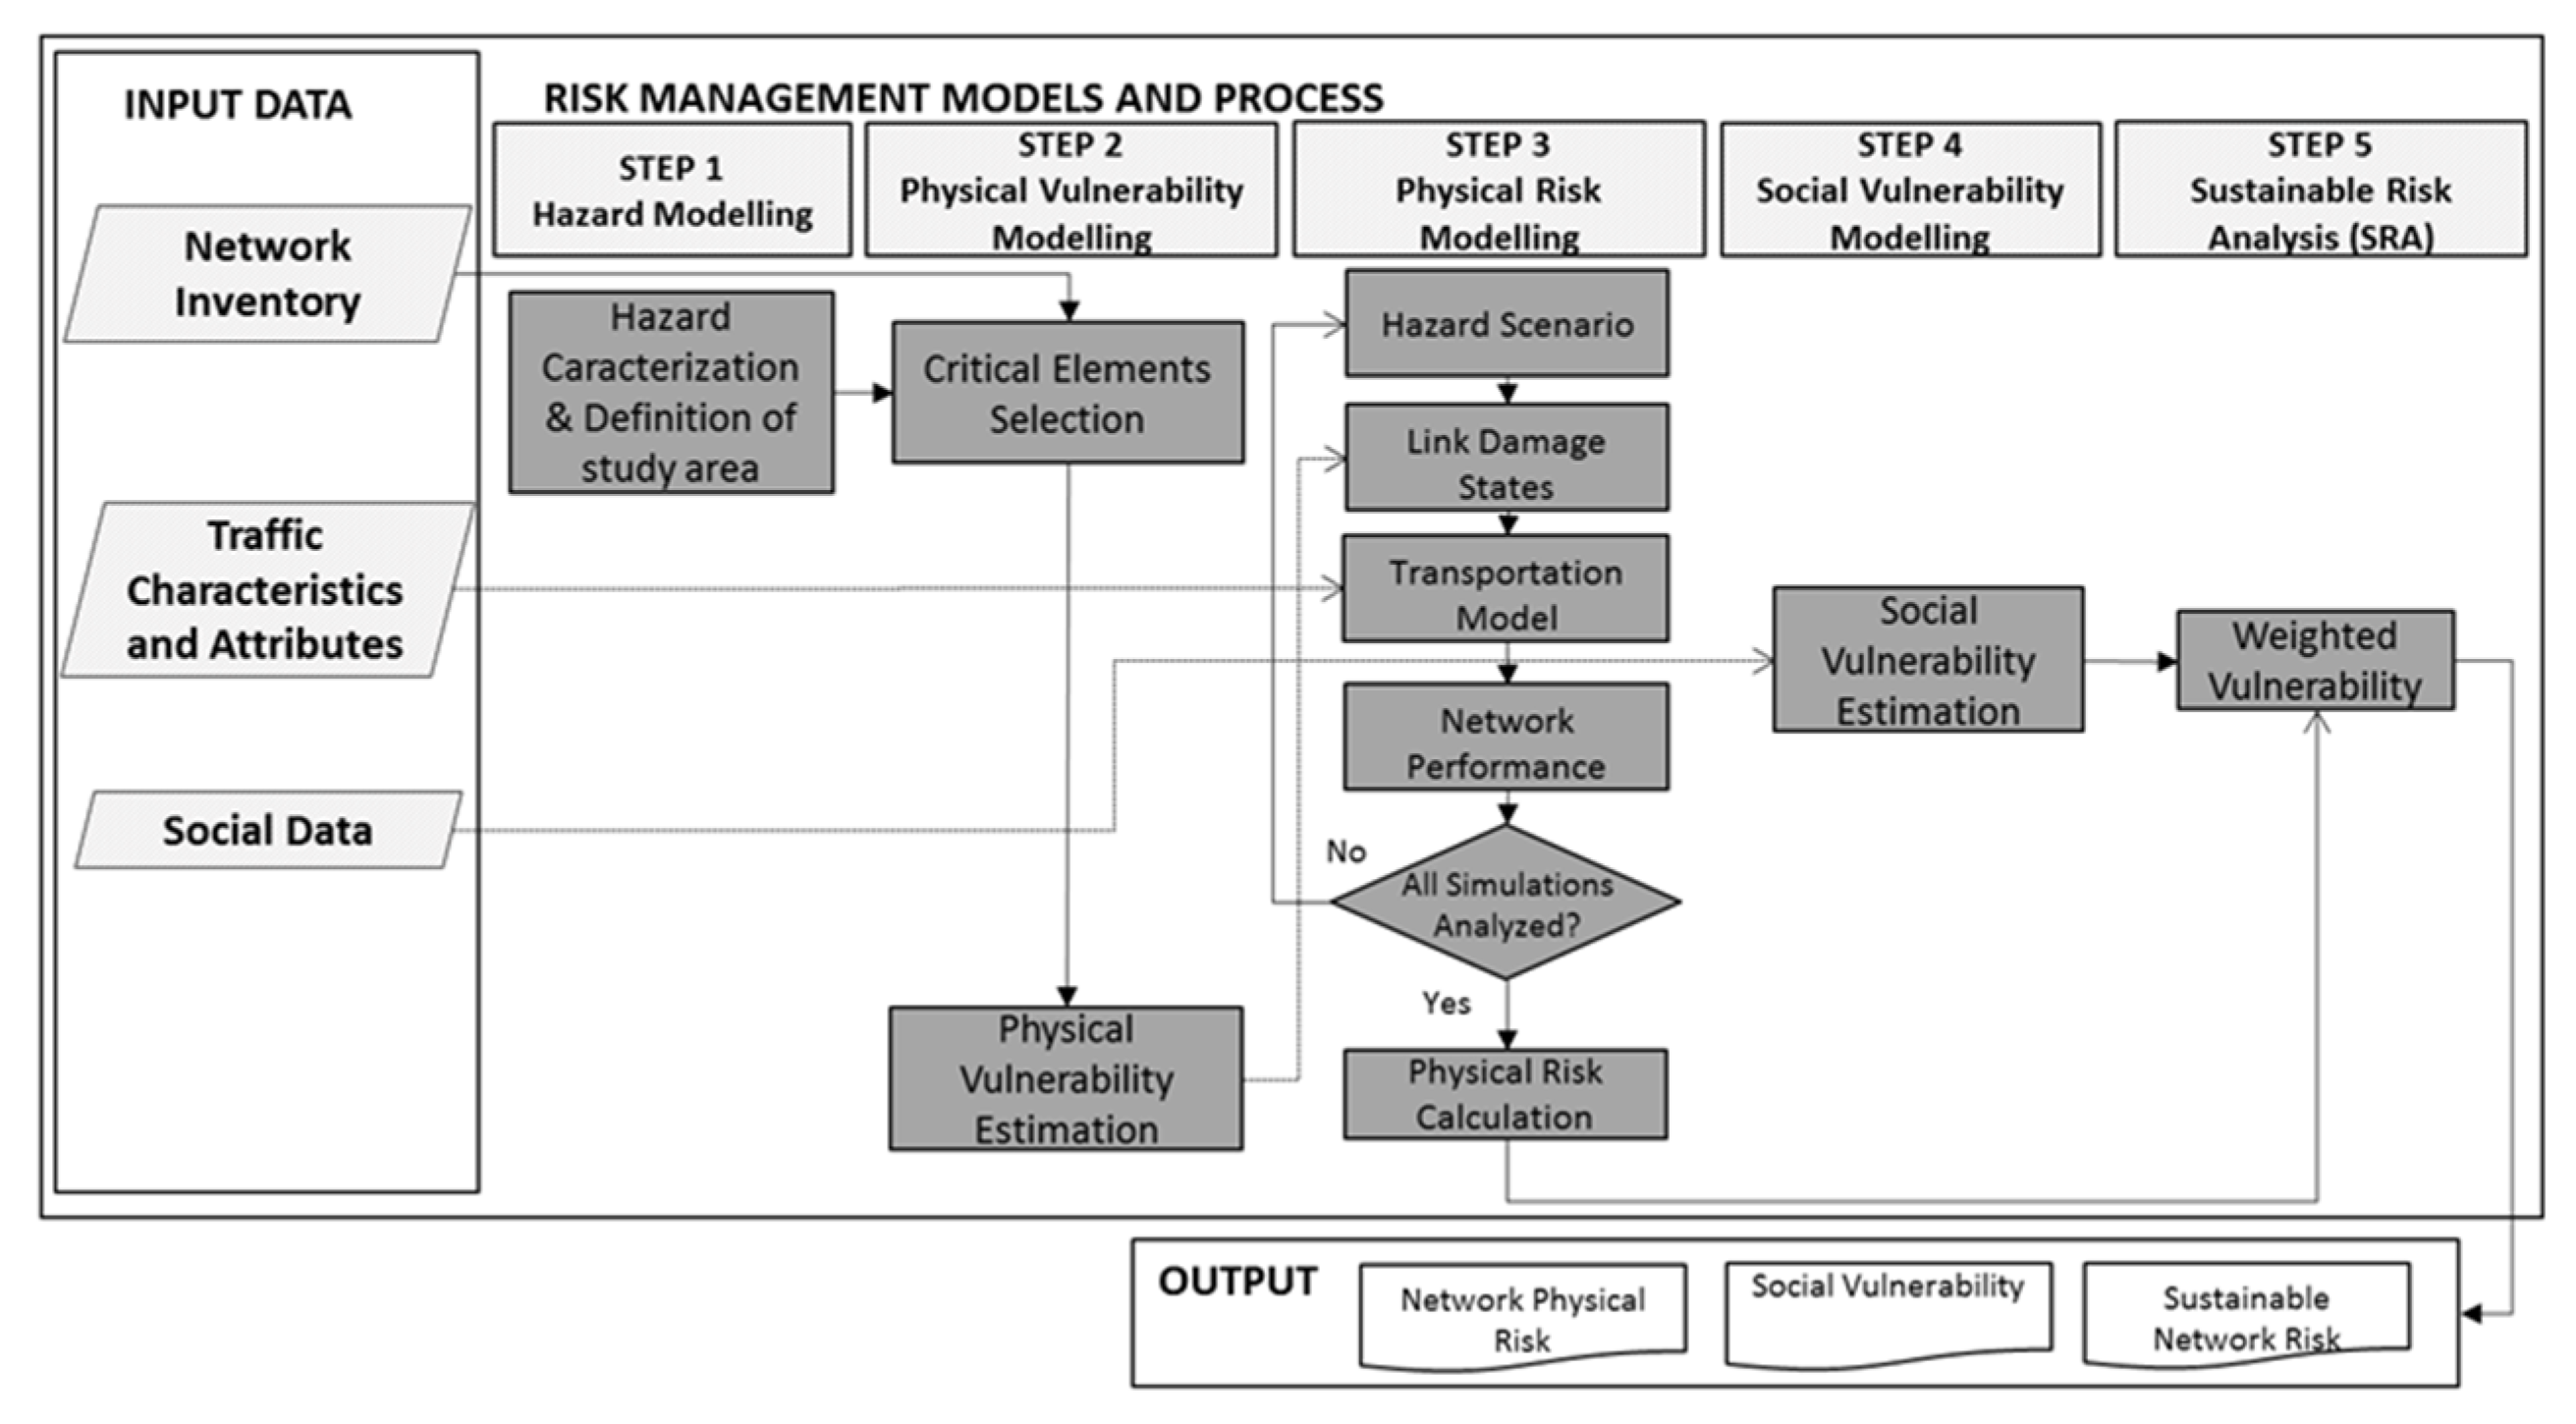
The framework proposed in this section is a comprehensive procedure to sustainably assess risk of rural road networks exposed to natural hazards, by integrating the environmental dimension of the natural hazard, the social vulnerability of exposed population and the physical vulnerability of road infrastructure. The framework includes three types of components: input data, risk management models and processes, and outputs, as presented in
Figure 1. The management models accounted by the framework consider hazard modeling and characterization, evaluation of social vulnerability for the selected study area, evaluation of physical vulnerability of the exposed road infrastructure, estimation of physical risk of the evaluated network and the final sustainable network risk assessment by integrating social vulnerability to network physical vulnerability.
The framework consists of an iterative procedure for a given hazard affecting exposed rural road infrastructure and served population. The framework can be applied for a specific scenario or for probabilistic scenarios accounting for the uncertainty occurrence of a natural event and its impact on exposed infrastructure and population. As presented in
Figure 1, the management process accounts for five modeling steps. The first step in the process is Hazard Modeling, which includes the hazard simulation and the definition of the study area. The study area is preliminarily defined by the analyst based on an expected hazard, however, the exposed area for both infrastructure and population is then determined given the hazard characteristics and territory under study.
The second step in the proposed framework is Physical Vulnerability Modeling, which requires network inventory data and suitable vulnerability models to assess fragility of rural road infrastructure exposed to the selected hazard. Inventory data includes: type of exposed infrastructure (e.g., bridges, tunnels, platform, etc.), characteristics of this infrastructure (e.g., materials, design type, age, etc.), spatial location of the network in the studied area, and network condition (if required by the selected vulnerability model), among others. Vulnerable elements for the hazard under study are defined as critical elements, and for each of these the probability of failure is estimated considering locally calibrated vulnerability models. Examples of these models are fragility curves and vulnerability indicators, which should account for the probabilistic trend of infrastructure performance or the expected damage level given a certain hazard type and intensity. It must be noted that to estimate risk, the overall rural network must be accounted for, and not only the links exposed to the hazard, recalling the fact that the affected links are part of a system or alternative route. The outcomes of this stage include probability of damage states or probability of failure of exposed infrastructure.
Physical Risk Modeling is the third step of the process. The objective of this step is to estimate the consequences of infrastructure damage over a specific measure of network LoS, which could be, for example: travel time between areas of interest, traffic volume, and overall network travelling speed, among others. For physical risk evaluation, hazard scenarios are required. To evaluate the hazard, a recurrence model or pre-defined scenarios are necessary to estimate the intensity measure at the location of exposed road assets. Link damage states or probabilities of failure are obtained from the previous stage, and estimated for each intensity measure, given the specific physical scenario. A traffic assignment model is then applied to estimate the effects of the simulated hazard over network performance and LoS. For this, traffic characteristics and attributes are required as input data. These include traffic volumes per vehicle type, travel times, travel speeds, and roads’ capacity, among others. Based on available traffic data and the selected traffic assignment model, a network performance measure in terms of LoS is obtained given the simulated hazard. This process is repeated for all scenarios of interest, resulting in the physical risk of the rural road network.
Social Vulnerability Modeling is the fourth step of the management process. For this, a reliable methodology should be first selected to assess rural population vulnerability considering available social data. This model could be either calibrated in terms of a damage matrix, fragility functions, or a vulnerability indicator. It is, however, recommended that available data can be categorized according to the area under study, defining variability between communities and characteristics of the territory. For this, it is essential to identify a proper scale of available social data (e.g., at municipal level, county level, etc.), which should be implemented in a Geographic Information System (GIS). Required data for the social vulnerability assessment could be obtained from census data, productive activities information surveys, or socio-economic surveys applied in rural areas. The expected result of this process is the modeled social vulnerability, displayed in GIS and with clear identification of vulnerability levels according to a variability measure (e.g., in terms of standard deviation between territories).
The fifth and last step is the Sustainable Risk Analysis (SRA) where social vulnerability is combined with network physical vulnerability accounting for simulated hazard scenarios. This process requires the previous analysis of both physical and social vulnerabilities in the rural network under study.
The outputs of the management process are the network physical risk, the social vulnerability, and the sustainable network risk, displayed in a GIS platform. The proposed framework can result in a risk management system if programmed in a computational tool, allowing a broader analysis of scenarios and extending the analysis to a stochastic approach subject to the probability of occurrence of certain hazards.
4. Application of the Sustainable Management Framework to a Rural Road Network Exposed to Volcanic Hazard
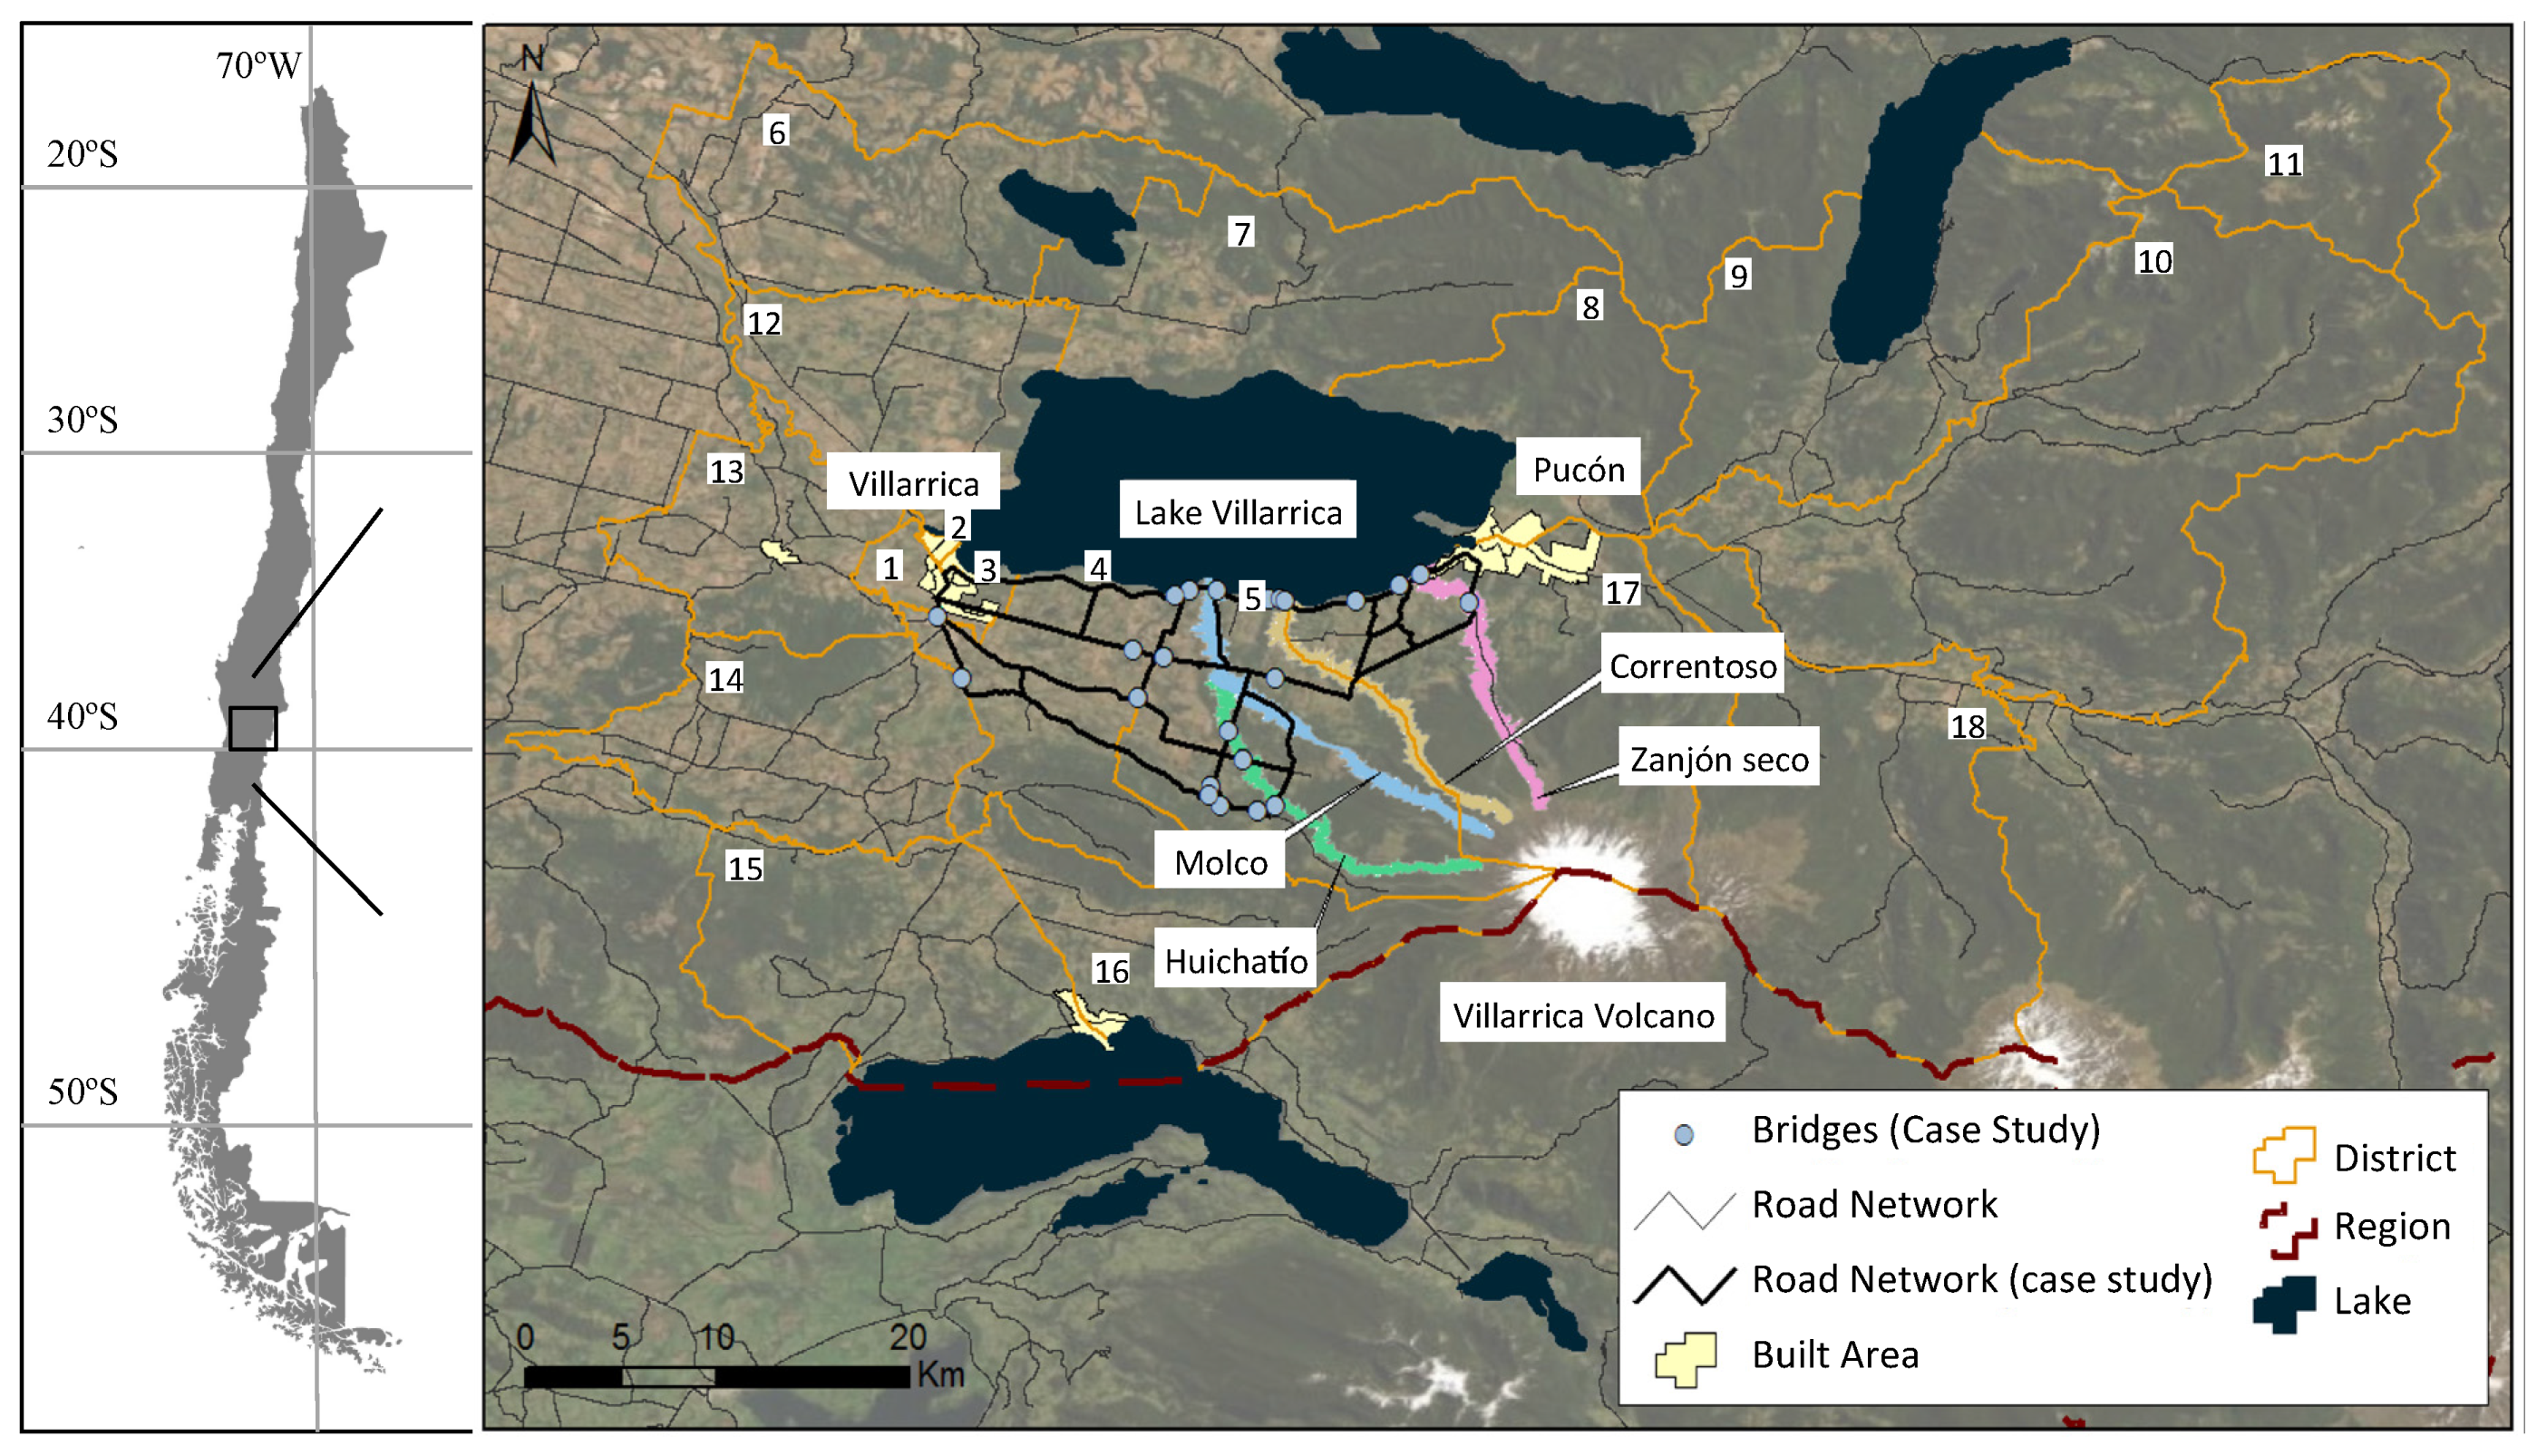
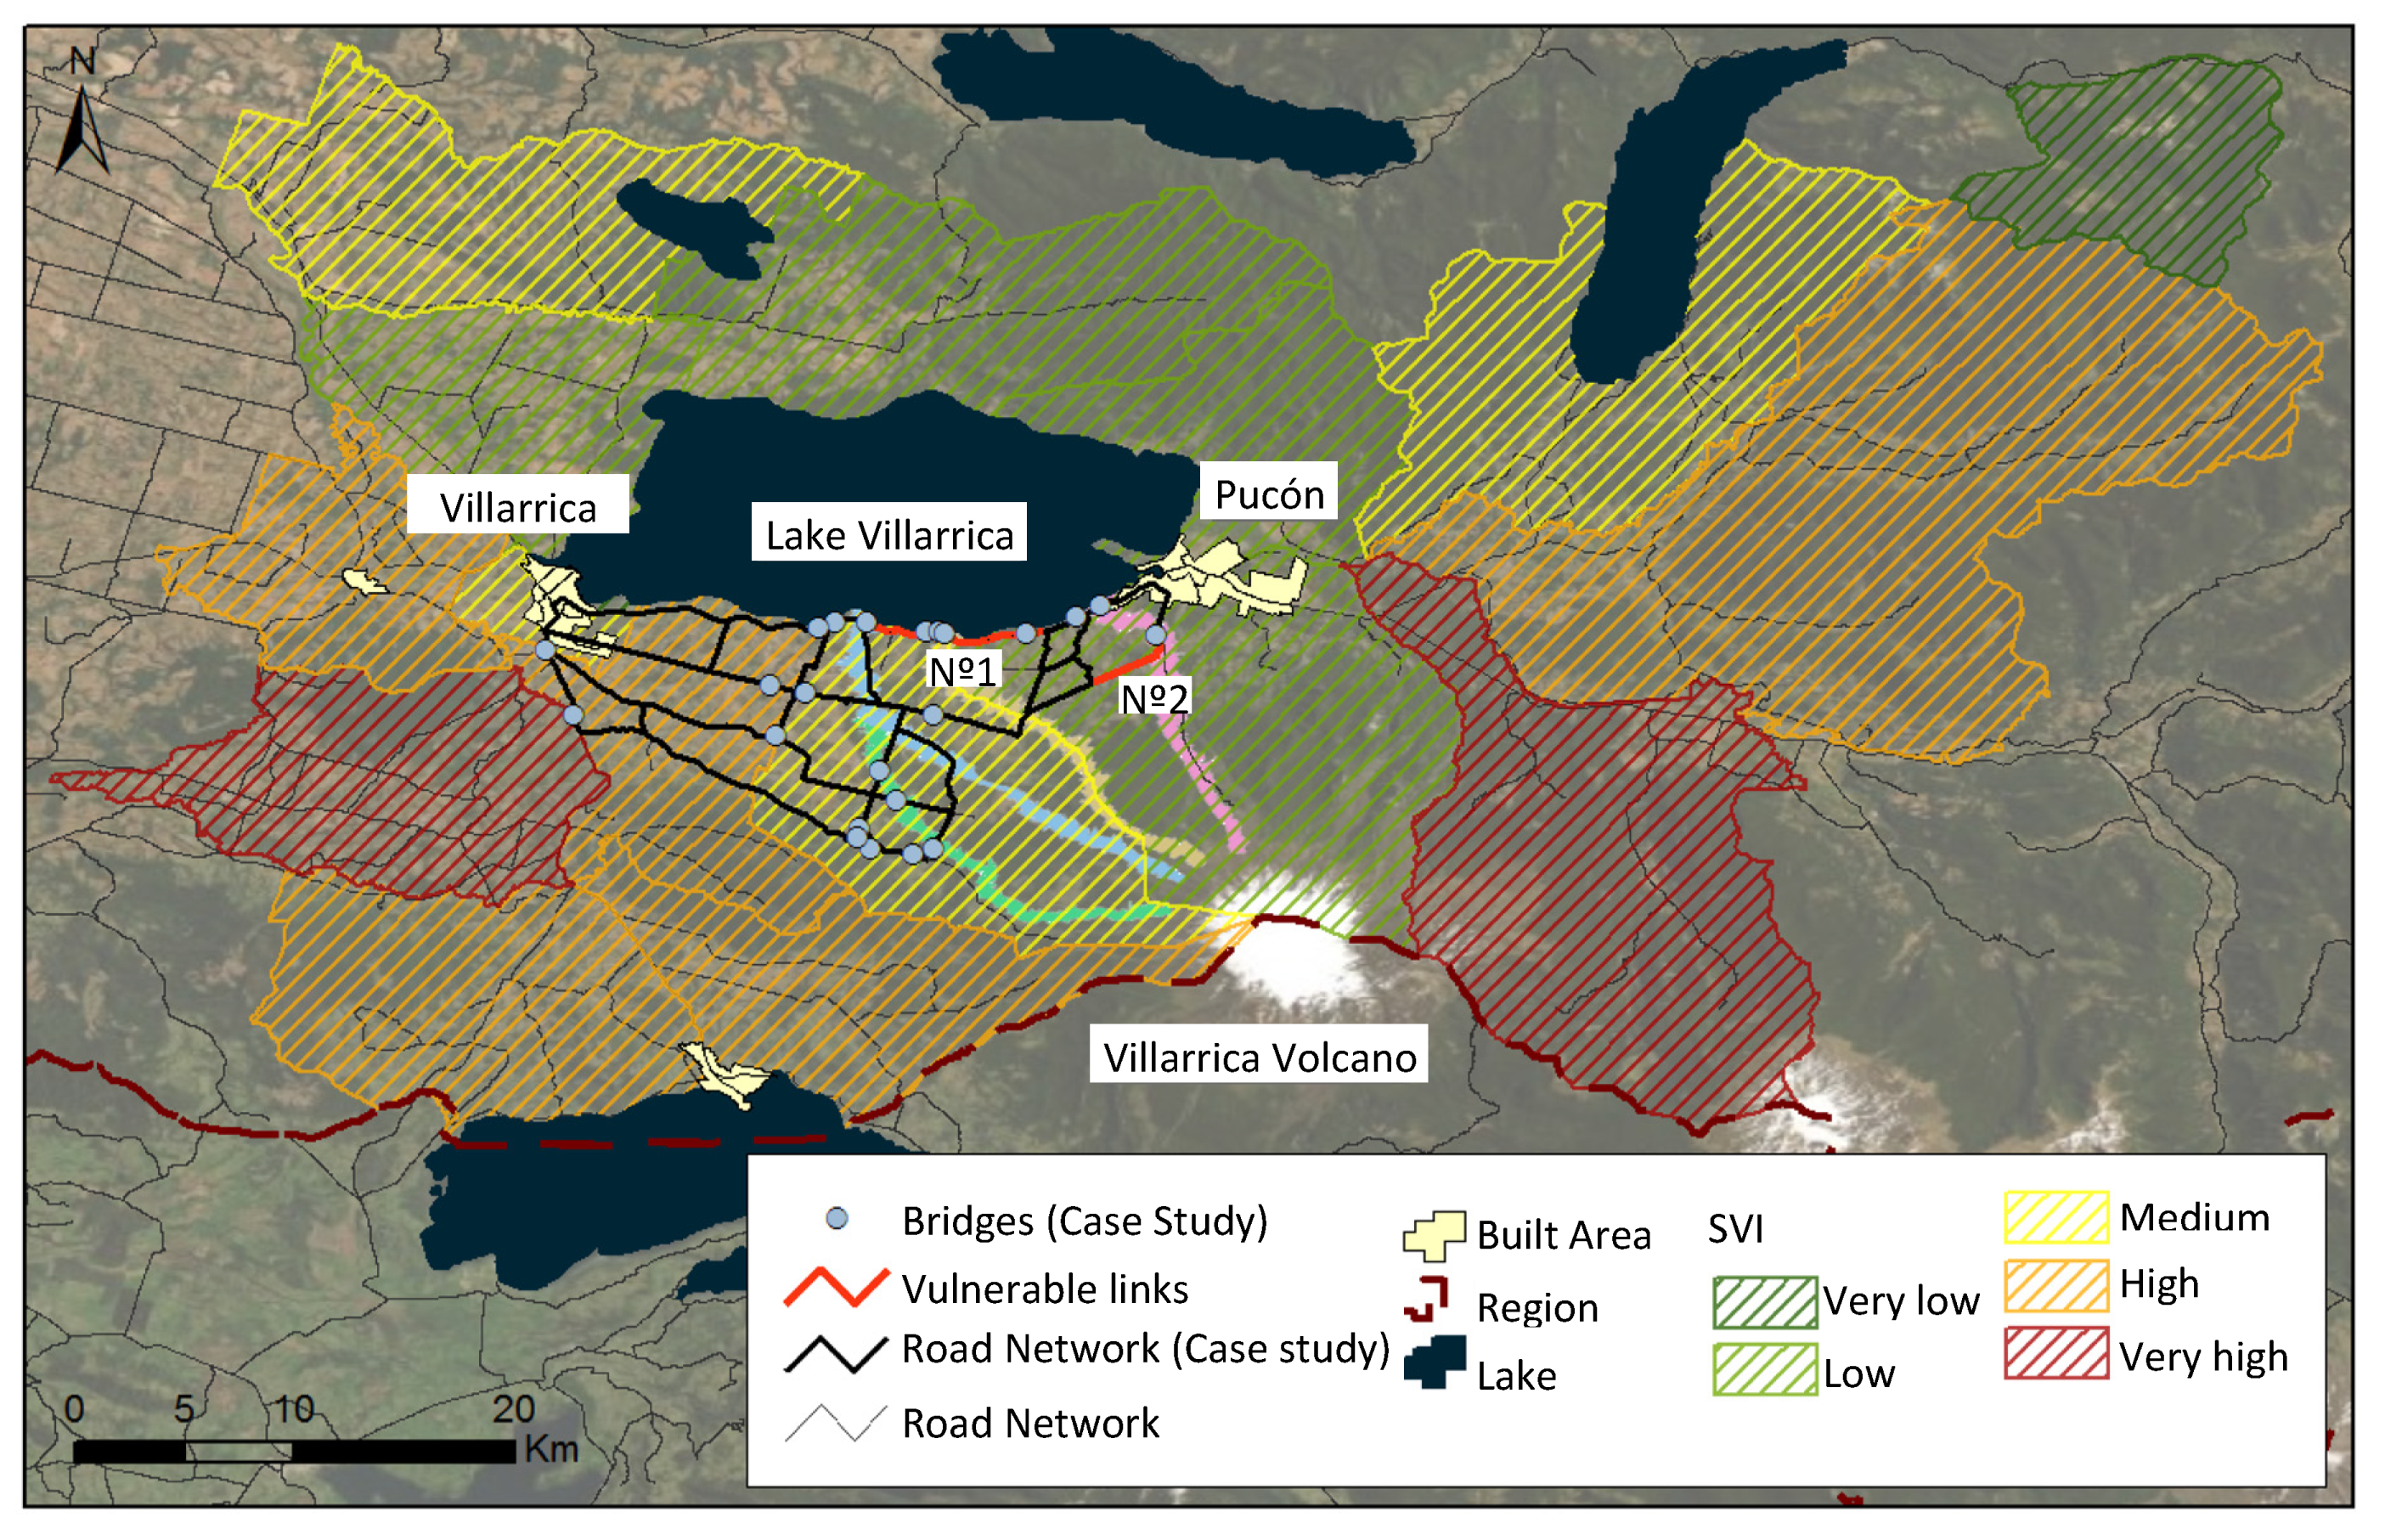
The objective of this section is to apply the proposed framework to a rural road network exposed to volcanic eruptions and the area around Villarrica volcano, in Chile, is selected as a case study (
Figure 2). The studied rural network connects the towns of Villarrica and Pucón providing access to both rural population living in the Andean Range and the huge touristic flow during the summer and winter seasons. Census districts in the study area have been represented by numbers as presented in
Figure 2.
The Villarrica volcano is one of the most active volcanos in South America and scores the highest threat in Chile [
58]. About 100 small eruptions have been recorded since XIV century [
59] and more than 30 eruptions occurred in the last century [
60]. Recent events have been mostly effusive or slightly explosive Hawaiian to Strombolian eruptions [
61], although the geological record even includes highly explosive Plinian eruptions [
62,
63]. Multiple eruptive products and styles are related to a particular eruption typology being lahars (volcanic debris flows) one of the most frequent and disrupting processes observed in ice/snow capped stratovolcanoes [
64]. As a consequence, eruptions have historically generated permanent losses to rural population and road infrastructure, especially in the north slope of the volcano, which is the only connection to rural areas and border crossing to Argentina in the East [
65]. The road network that connects Villarrica and Pucón is predominantly used by rural population that daily travels to both towns for work, school and access to basic services. During the summer and the winter season at some extent the network is also highly demanded by tourists that visit the area. The middle slope in this sector is also populated and communities from Segunda Faja and El Cerdúo are highly exposed [
65]. Both sectors are accessed by alternative routes to the main road connecting Villarrica and Pucón and have been affected by recent eruptions. In 1971 there were significant human and material losses, including permamnent damages of the road network, whereas in 2015 bridge failures and collapses were observed. In the context of a volcanic eruption, the road network is essential for the evacuation of population, however, it is highly exposed to the effects of an event especially concerning laharic flows. An increase in the travel time between the towns of Villarrica and Pucón would result in severe consequences to the population during and after an eruption. Response estrategy during eruptions includes safety zones in the rural sector to avoid transit to the towns, but access to these places could also affected by disruption of secondary roads. This is especially critical to rural communities for their evacuation during an event and their recovery after an event.
4.1. Step 1: Hazard Modeling
Volcanic eruptions produce operational restrictions and physical damage to road infrastructure. Eruptive events could be composed by lahars, lava flows, pyroclastic fall and pyroclastic density currents, some of them coeval or triggered in a cascading behaviour. Lahars are discrete, rapid, gravity-driven flows of saturated, high-concentration mixtures containing water and solid particles of rock, ice, wood, and other debris that originate from volcanoes [
66,
67]. Primary lahars triggered have killed about 37,451 people worldwide since the XVII century [
68]. Lahars occur in both tropical/subtropical regions subject to heavy rains and ice/snow capped volcanoes. For the latter the presence of ice/snow is a condition, but high emission rates of magma (empirically > 100 m
3) are also required in order to melt the ice/snow that mobilize loose sedimentary material. Volcanic debris transported by lahars make these flows the most destructive process to road infrastructure [
69]. According to Wilson et al. [
70], bridges and culverts are road infrastructure elements most exposed and vulnerable to lahars. Volume of lahar flows depends on both the water supply and sediment budget. Thus, eruptions after the winter season contain ice and snow and produce higher volume lahars. Transported volume is proportional to the inundated and cross-sectional area according to an empirical relation [
71] and hence high volume lahars produce higher probability of collapse in bridges and culverts.
The lahars generated in the eruptions of the Villarrica volcano in the years 1949, 1964, 1971 and 2015 generated permanent damage in bridges in the north slope of the volcano, which directly affected the quality of life of rural population dependent of the network during the recovery phase. This exposed area contains four main source and corridors of lahars, corresponding to four river channels (Huichatio, Molco, Correntoso and Zanjón Seco rivers) [
66].
To reduce complexity derived from the variety of volcanic processes the procedure uses eruptive escenarios. Eruptive scenarios are based on the eruptive style and primary defined by the Volcanic Explosivity Index (VEI) [
72]. The global catalog (VOTW4.3) shows that VEI follows a log normal distribution over time [
73], and thus the eruptive scenarios have an implicit relative probability. Based on the eruptive record, three types of eruptions are recognized: Plinian, Subplinian and Hawaiian-Strombolian, with recurrence in the range of milennia, centuries and years, respectively. Snow cover in the winter season can reach several meters in the source area and is therefore relevant for the water supply and resulting volume of lahars. Historical events provide analogs for the selected scenarios and constrains for the most relevant parameters. Based on previous attempts by consultants [
74,
75] and site-specific assesments [
76], each of three eruption types can be splitted in two (winter and summer) and hence six scenarios are considered.
The lahar volumes in each scenario in each of the selected streams are presented in
Table 1. Each scenario has different lahar volumes, which distribute differently in each river channel, resulting in specific probabilities of bridge failure depending on their location and exposure.
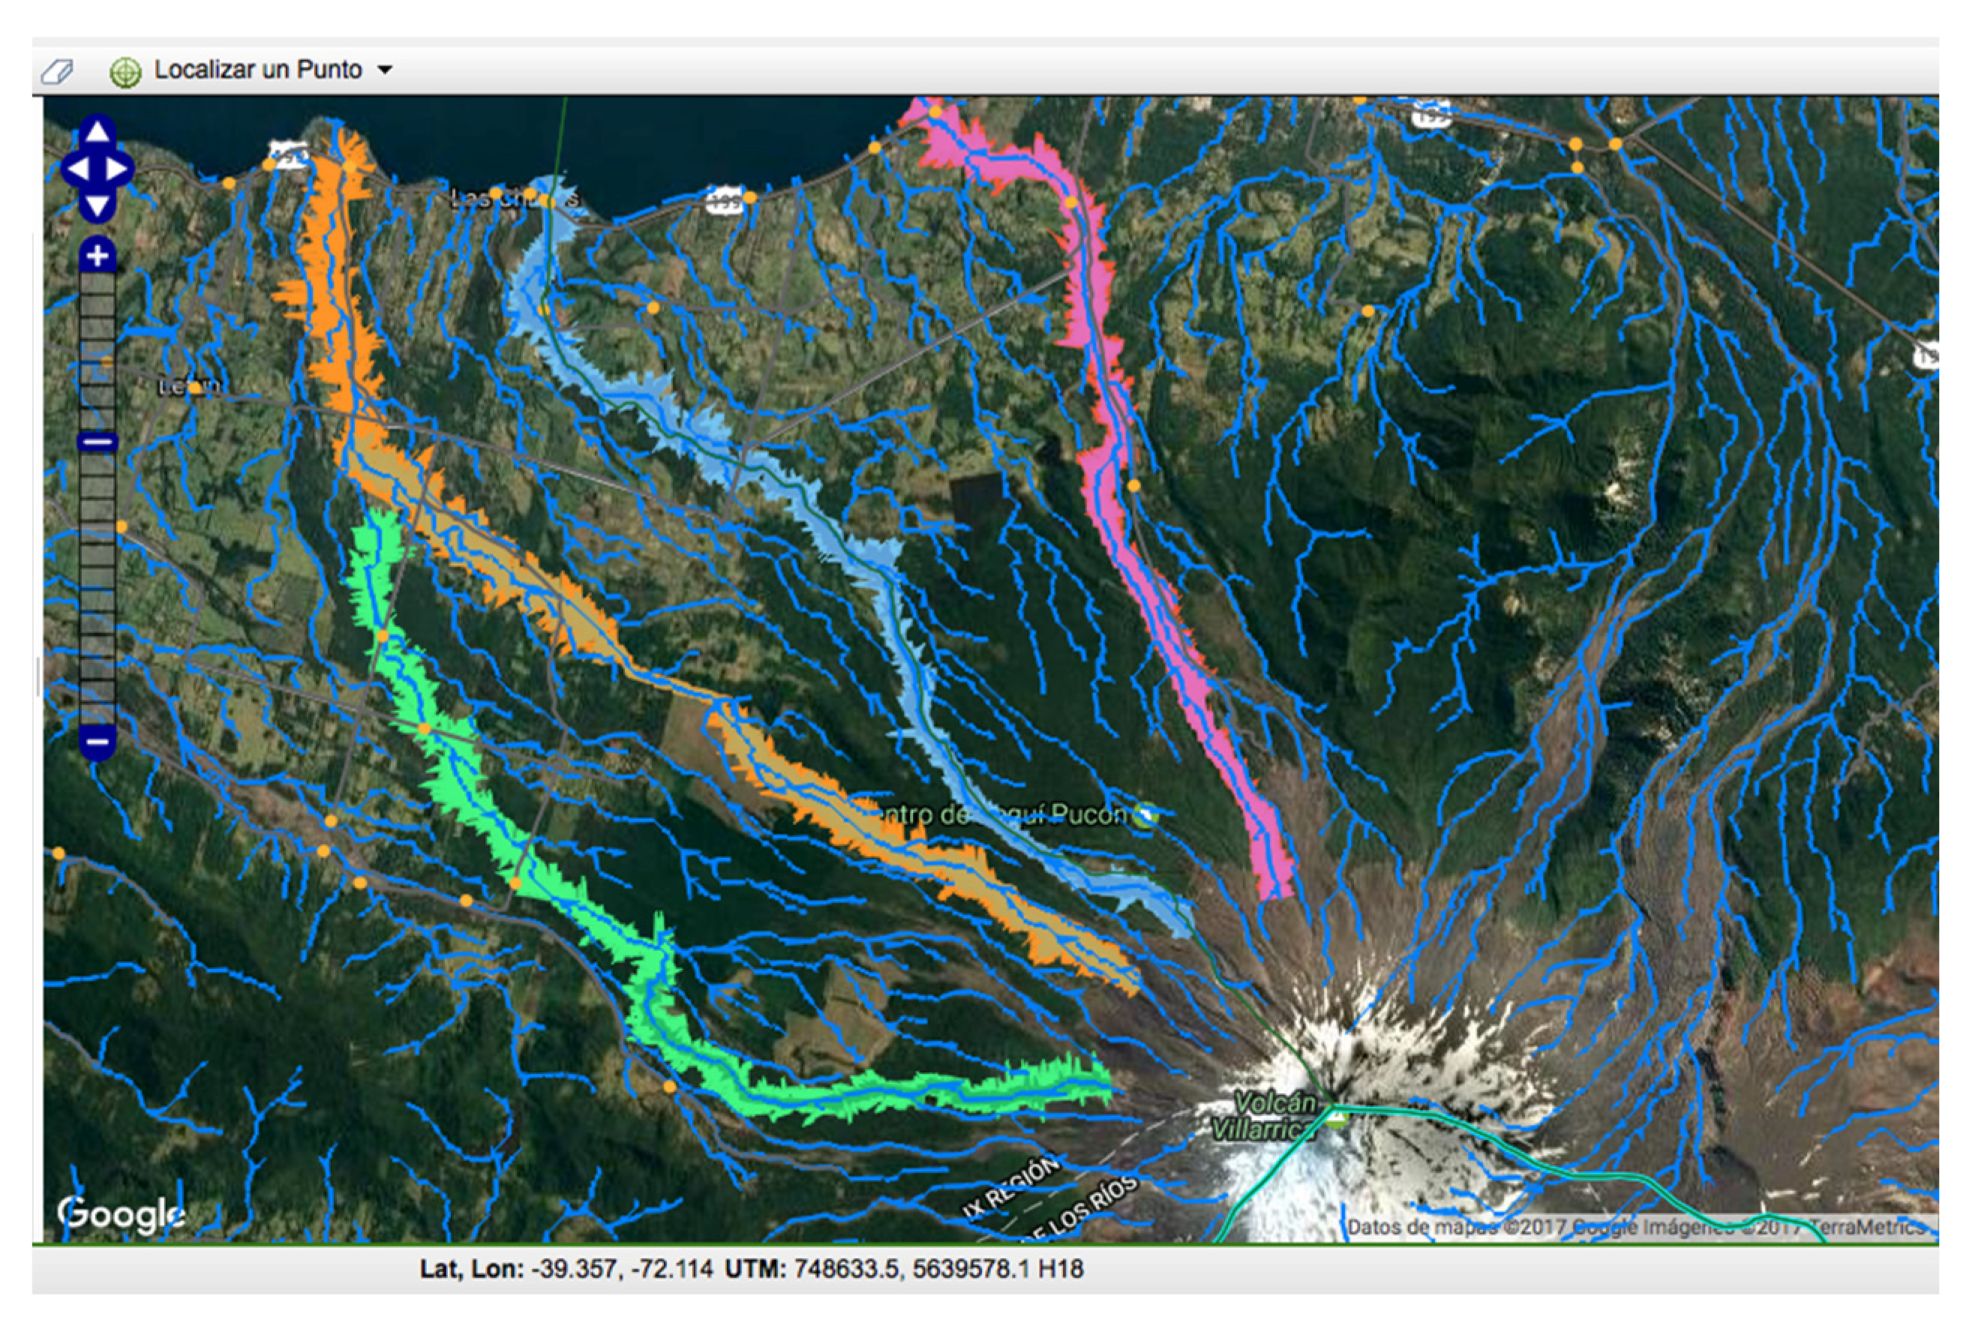
To estimate the path of each lahar channel, the LAHARZ computational tool is used in this study, which is a GIS program for automated mapping of lahar-inundation hazard zones. For each lahar volume, the tool estimates the path according to the digital elevation model (DEM) of the region, whose resolution is 12.5 m and was obtained from the ALOS Research and Application Project of EORC, JAXA. As an example,
Figure 3 represents the path of the four lahar channels obtained for a Hawaiian-Strombolian eruption after winter. The lahar channels considered in this study are the ones located in the north part of the Volcano. The main scope of the case study is to apply the proposed risk management framework to a rural road network that presents high vulnerability and exposure to laharic flows, as well as considerable exposed population and traffic flow, which is the case of the network that connects the towns of Villarrica and Pucón.
4.2. Step 2: Physical Vulnerability Modeling
Once the environmental aspects describing the hazard have been modelled, the physical vulnerability of the exposed rural network is estimated in terms of bridge fragility. Fragility curves express the probability that the damage state (
) of a system exceeds different levels (
= slight, moderate, extensive or complete), given a certain hazard intensity (
) [
77].
Dagá et al. [
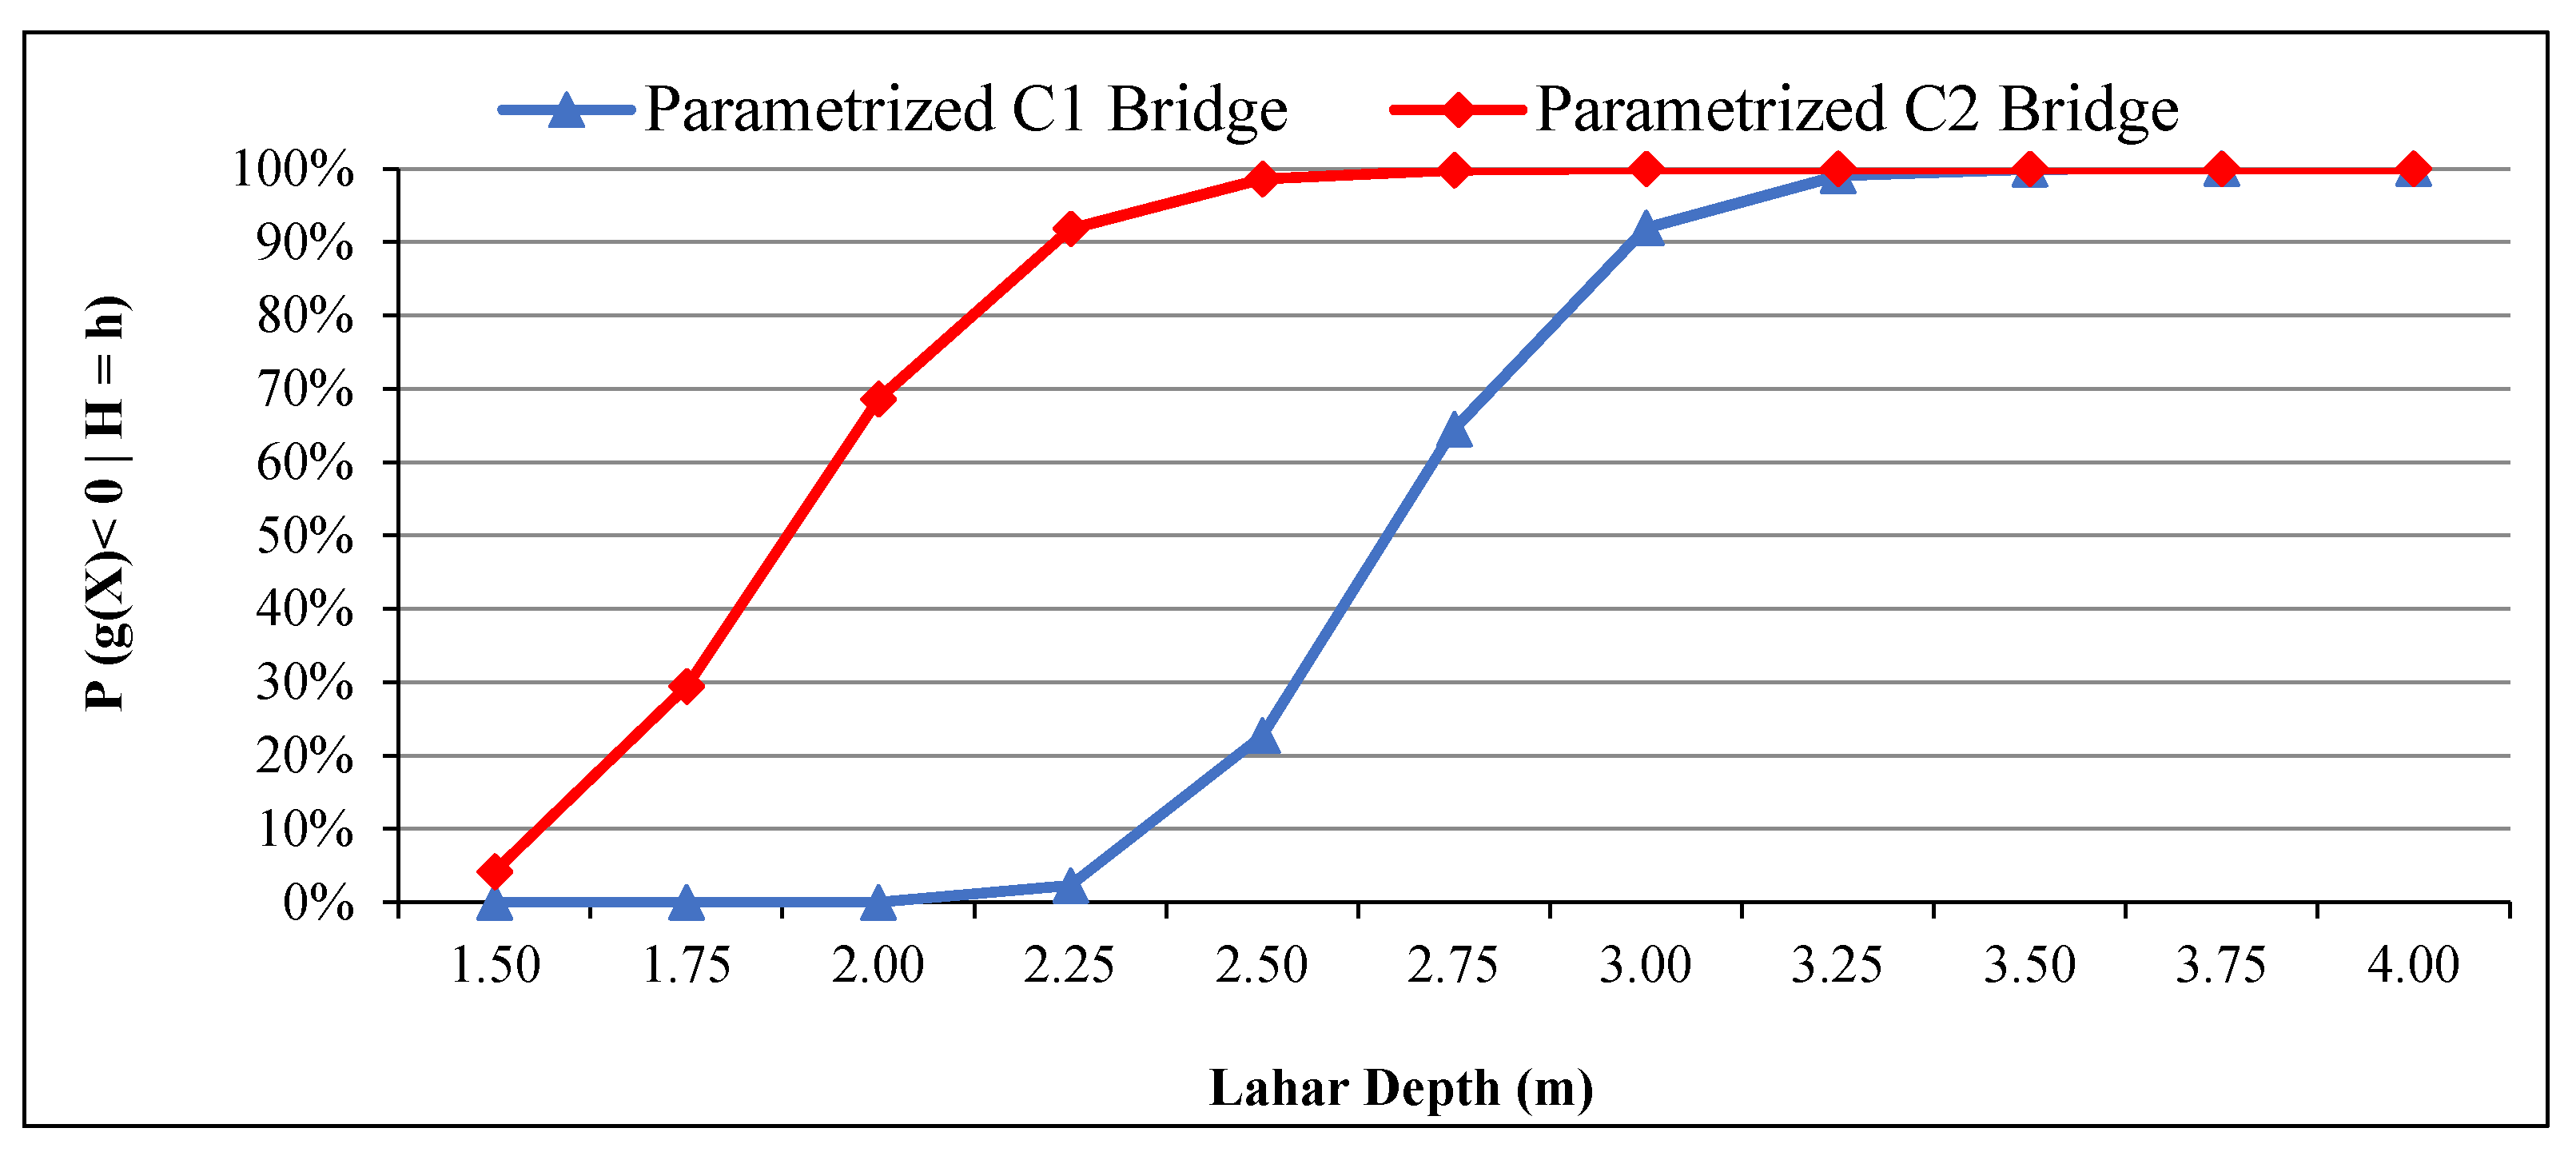
78] developed fragility curves for Chilean bridges exposed to lahars, integrating existing analytical models that represent the demand and supply of the system bridge-lahar. Bridge fragility curves were developed for a complete damage state level considering the lahar height as the hazard intensity measure (IM). Dagá et al. [
78] defined two bridge categories: bridges with one span (C1) and bridges with multiple spans (C2). Fragility curves of each bridge category were parameterized assuming a cumulative lognormal distribution.
Figure 4 presents fragility curves of the two bridge categories. These fragility curves were validated in the study area by Dagá et al. [
78] considering the type of exposed bridges to laharic flows in the network under study. Fragility curves were developed under a probabilistic approach where different physical attributes of bridges and their variability were considered in the mechanism of failure. Therefore, the curves represent a set of bridges differentiated by the presence of piers, which is the most vulnerable element when exposed to laharic flows. Other attributes such as material, length and width, among others are included in the respective probability of each fragility model.
In order to identify bridges reached by lahars per scenario and to determine lahar height in the river section, the LAHARZ computational tool was used. This software uses an algorithm based on semi-empirical equations and the Digital Elevation Model (DEM) to geo-reference the area exposed to lahars.
The lahar depth (
hLahar) of each scenario was calculated through the cross-sectional equation of LAHARZ [
71], calibrated empirically by Instituto Nacional de Hidraulica [
75] for the case of the Villarrica volcano. Equation (1) assumes a rectangular flow and is a function of the lahar volume (
) and the flow width (
).
Determined the lahar height and the bridge category (without piers C1 or with piers C2), the failure probability of each bridge in each scenario can be calculated through fragility curves. In this case study, the failure of a bridge makes the road link impassable for vehicles, making the overall route where the link is located unfeasible. Each scenario produces a specific lahar height in each bridge; then it is possible to calculate the vulnerability as a probability of collapse. The failure of just one bridge results in the collapse of the link that contains the bridge. The probability of failure when there are several bridges in a link is the probability that at least one bridge collapses, as presented in Equation (2).
where
E = collapse of link
E and
= collapse of bridge
B in link
e.
To estimate the damage state of each bridge from fragility curves, as well as the damage state of the network and its performance, 10,000 Monte Carlo simulations were iterated. In each simulation and for each bridge, a random number (sib: random number in the simulation s for the bridge b) between 0 and 1 represents the probability to collapse. If rs,b ≤ P(Bb), then the bridge b collapses in the simulation s as well as the link that contains the bridge. On the other hand, if rs,b > P(Bb), the bridge does not collapse. Every simulation generates a different link damage state given the probabilities of failure. If any link collapses, the travel time to pass through the link that contains the link is infinity or the capacity equal to zero. This procedure may be applied to any hazard and road infrastructure as long as the fragility to a certain hazard has been calibrated.
4.3. Step 3: Physical Risk Evaluation
To evaluate volcanic risk in a rural road network, a performance index or consequence measure needs to be estimated for each scenario of interest, in this case volcanic lahars. Once the hazard has been described and the probability of failure or damage of each exposed infrastructure per scenario is known, the consequences in the network due to traffic reassignment are estimated in terms of travel time delays.
4.3.1. Network Model
In order to represent the rural road network, graph theory has been used, where each node of the graph represents an intersection or a source in the road network (for example a town) and each link represents the connection between two nodes. Each link contains the following information:
- −
Highway Capacity: the capacity of the road depends on the type and the condition of the roads and is measured in terms of passenger-car/hour/lane (pc/h/ln). For paved two-lane highways, a capacity of 1400 pc/h/ln was considered. For unpaved roads, a capacity of 600 pc/h/ln was considered. In this network, 28 out of 38 links are unpaved rural roads with low capacity.
- −
Free–flow travel time: for each link, the information of the free flow travel time (time spent at the theoretical speed of traffic when density is zero, that is, when no vehicles are present) was obtained considering the length of the link and the project speed (speed that allows to define the minimum geometrical criteria under safety conditions).
- −
Physical vulnerability: the information of the fragility of each bridge was attached to every link. Every link contains the information of how many bridges it has and how vulnerable they are (in terms of fragility parameters). In this case study, the damage states of the bridge are two: collapse and no-collapse.
4.3.2. Traffic Assignment Model
The traffic assignment model considered for the analysis is based on the well-known user equilibrium principle first proposed by Beckmann et al. [
79], where each user minimizes the travel time. This approach considers that each user previously knows the minimum route. The traffic flows are obtained by solving the following optimization problem:
Subject to
where
w is a origin-destination pair;
W is the set of all origin-destination pairs;
P corresponds to all possible routes in the road network;
Pw is the subset of
P with all routes that connect origin-destination pair
w;
p is a specific route in the road network;
Tw represents the demand on the origin destination pair
w;
hp is the flow in the route
p;
fa is the flow in link ‘
a’;
A is the set of all links in the road network;
ta is the travel time on the link
a and
is the Kronecker delta of whether link ‘
a’ belongs to route
p (the value is 1 if it belongs and 0 in other cases).
To consider the time variation due to increased traffic, a function (Equation (8)) developed by the U.S. Bureau of Public Roads has been used and the criteria of the Highway Capacity Manual [
80] to estimate the different coefficients.
where
ci is the designed capacity of link
i,
is the travel time in free flow conditions on link
i, and
/
are parameters that depend of the type of road. In this study,
is 0.38 and
is 5, which are the recommended values according to HCM [
80]. Note that if a link collapses, the optimization of the total travel time considers the assigned flow for that link equal to zero. The main assumptions and limitations of the traffic assignment model are described below:
- −
All users are assigned in the route that minimizes their travel times. This supposes a previous knowledge of the traffic conditions by all the users, which is representative to a mid- to long-term traffic condition post event, during the recovery phase of the network.
- −
Congestion in the model is not completely considered as the analysis is performed in rural roads presenting low volume traffic, and accounting that users have information about disruptions in the network as described previously. Only the variable cost is considered, depending on the travel time, of traveling through each of the roads as a function of the assigned flow. The congestion is considered only in a range where the vehicle flow has not reached saturation.
- −
The model considers Average Annual Daily Traffic (AADT) for the analysis, which implies that the hourly variation within the same day is not considered in the analysis.
- −
Light vehicles are considered as an equivalent vehicle and all heavy vehicles are evaluated in terms of equivalent vehicles according to the conversion proposed by the HCM. This assumes that the effect of load restrictions on bridges is indirectly considered in terms of traffic volumes.
4.3.3. Network Performance
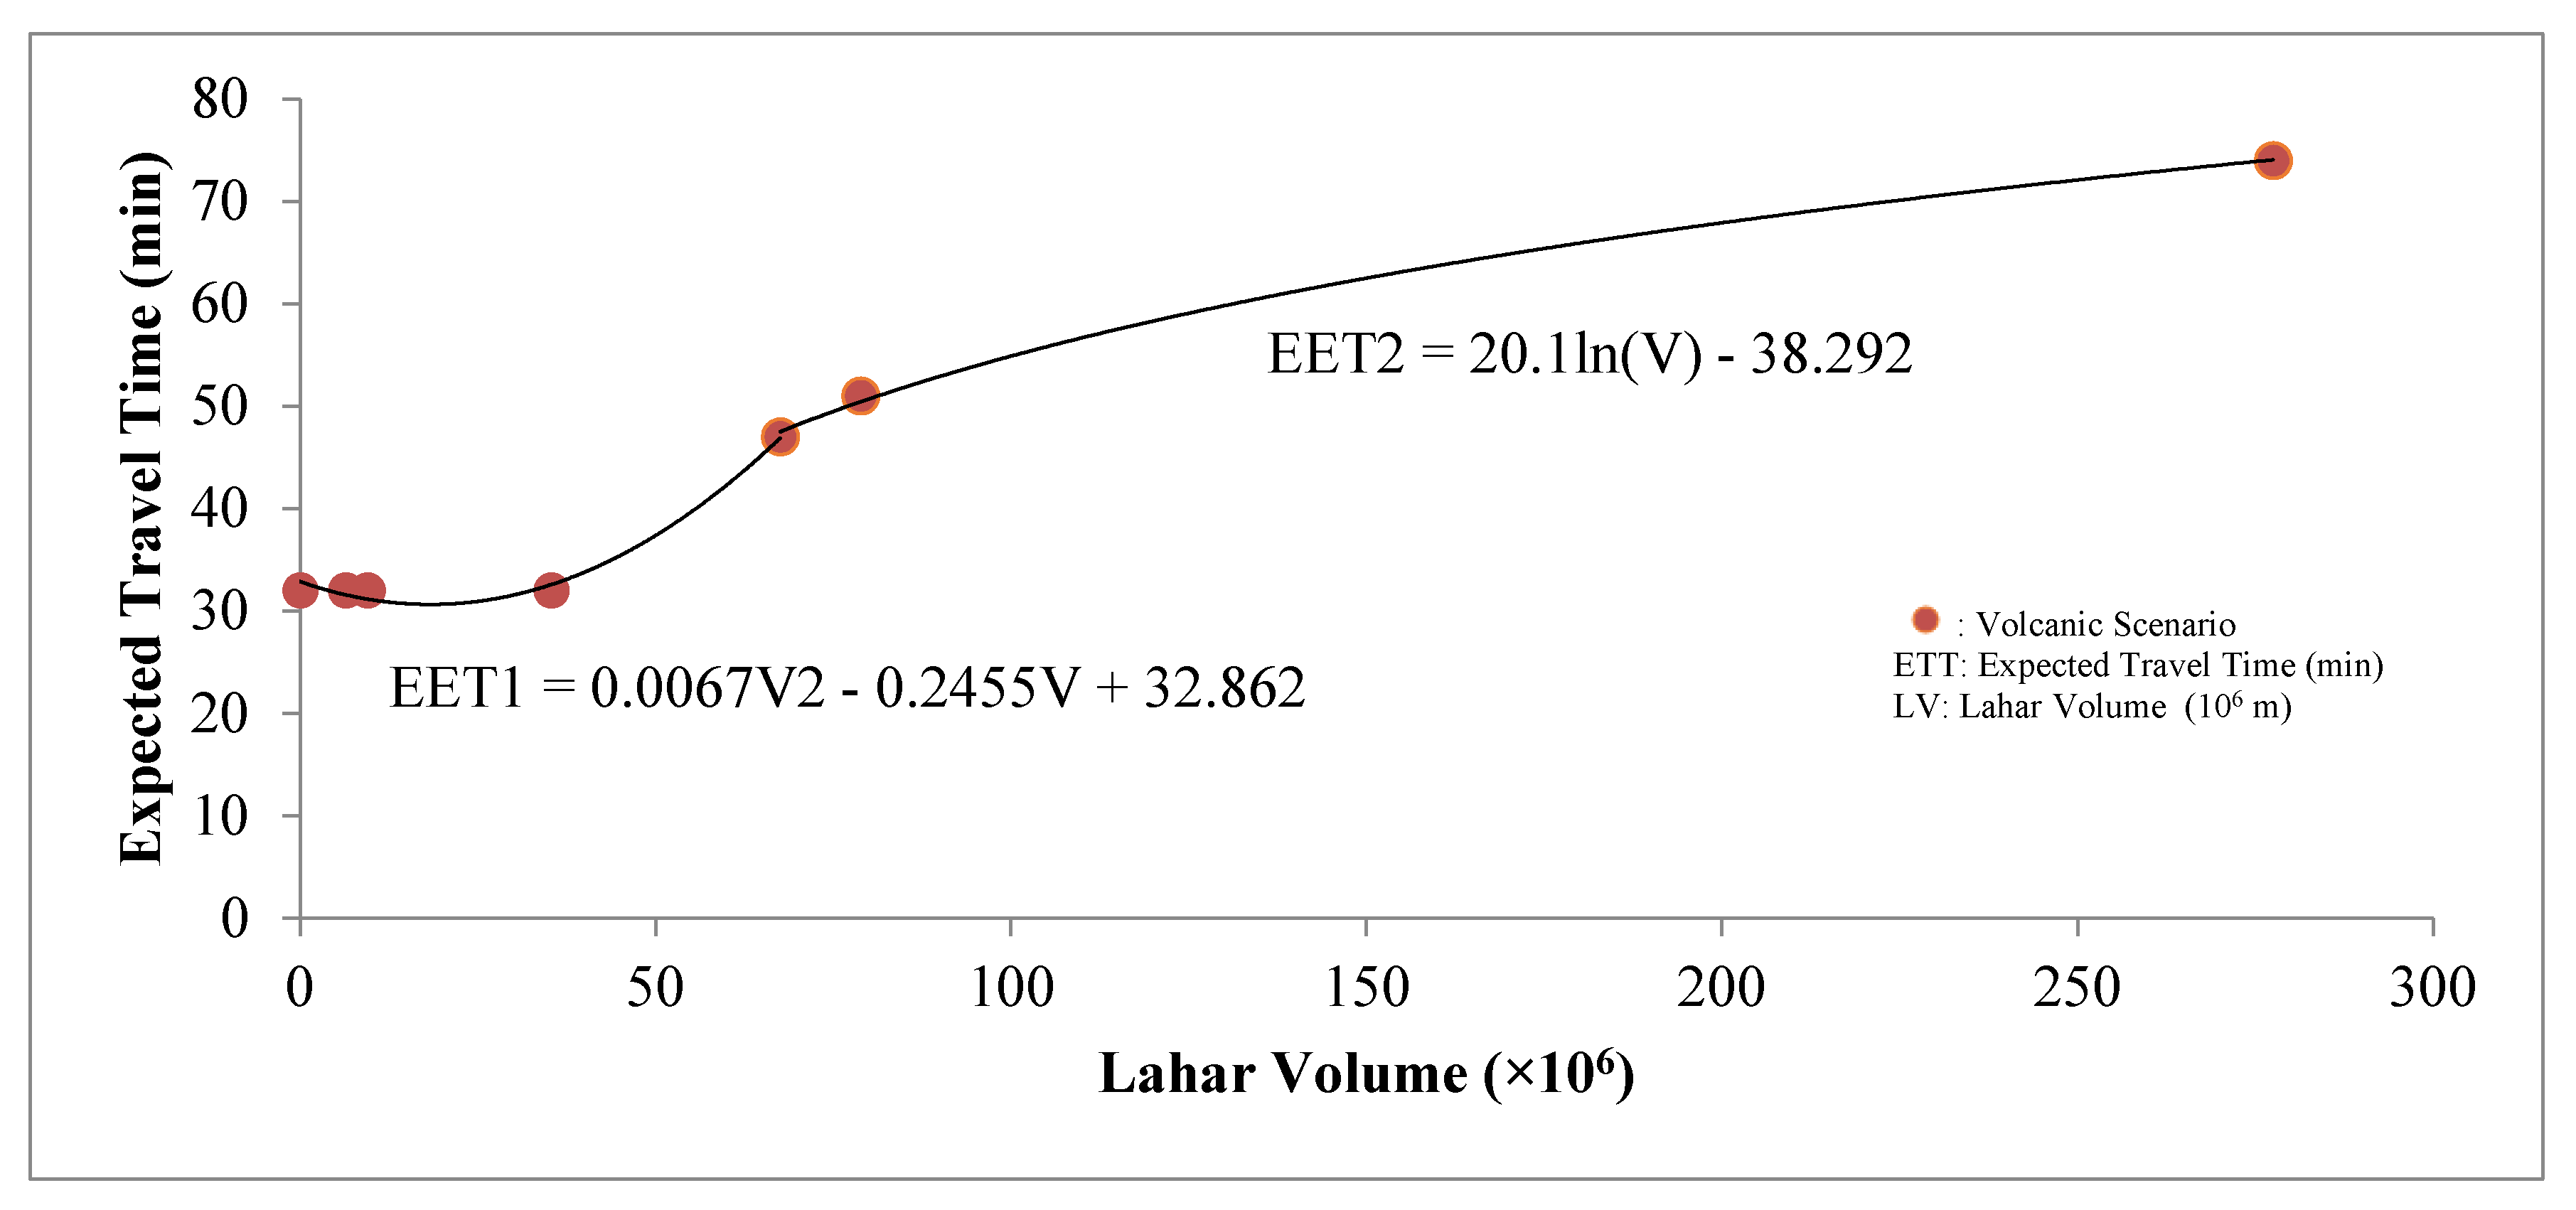
The performance index considered in this study is the expected travel time (ETT) between the towns of Villarrica and Pucón. The traffic data was provided by the Chilean Ministry of Public Works (MOP), and corresponds to the Annual Average Daily Traffic (AADT), which considers seasonal and hourly variability. The traffic considered in the study is 8000 vehicles per day moving from Villarrica to Pucón. In order to estimate the index per scenario, 10,000 simulations were iterated. In each simulation, the transportation model gave the equilibrium of the network and so the travel time between the cities was calculated as the minimum. The expected travel time is calculated as the shortest path (in terms of travel time) considering the circumstance of the damage state (for each simulation), this is, considering that some links may be impassable due to the volcanic scenarios and a detour is required to connect Villarrica and Pucón, and therefore an increase of travel time product of the detour and the potential congestion by the new path. At the end of the simulation, the expected travel time for the scenario was the mean of all simulations.
Figure 5 presents the relation between lahar volume and expected travel time between Villarrica and Pucón.
The algorithm for estimating the network performance between the cities of interest was computed in python language. The algorithm mainly uses the network library to manage the road/graph information. The algorithm starts evaluating fragilities using a Monte Carlo approach given the lahar heights for each bridge. For each damage configuration, the traffic assignment is estimated according to the user equilibrium principle.
4.4. Step 4: Social Vulnerability Modeling
In order to quantify the social vulnerability of the exposed population, the calibration of an index is the most frequently used method. This approach has three different data structures: deductive, hierarchical, and inductive. The first structure was highly used when social vulnerability indexes were first developed; however, currently the inductive structure is the most commonly used method given that it may objectively determine social variables based on household data and Census [
46].
The inductive process consists in reducing a large number of variables in few factors that explain social vulnerability [
56]. In order to reduce those variables, Principal Component Analysis (PCA) or Factor Analysis (FA) are used in literature [
25,
50,
81,
82,
83].
The development of the index for this case study is based on the national Census applied in Chile in 2002 in the Municipalities of Villarrica and Pucón at the district level. Analyzed districts are represented in
Figure 6, whereas the 20 variables extracted from the national household database for the construction of the index are shown in
Table 2.
Statistically significant factors were selected from PCA under the Kaiser Criterion, which consists of retaining those factors whose associated eigenvalue is greater than 1. These factors explain 90.2% of variance within the analyzed population. Selected variables are listed as follows, whereas their standard deviations are presented in parenthesis.
- −
F1: Economic Activities and Households. The dominant variable is percentage of population employed in service activities (−0.944)
- −
F2: Special Needs Population and Illiteracy. The dominant variable is percentage of population with at least one type of disability (0.903)
- −
F3: Native Population. The dominant variable is percentage of native population (0.833)
- −
F4: Age and Unemployment. The dominant variable is percentage of population under 15 years old (0.804)
- −
F5: Single Sector Reliance: The dominant variable is percentage of population employed in industry and construction (0.909)
The Social Vulnerability Index (SoVI) of the case study is obtained from the sum of these five factors as recommended by Cutter [
25]. Finally, results were standardized with z-score and categorized in five vulnerability levels according to their standard deviations. The results are presented in
Table 3, where Very Low vulnerability represents a standard deviation less than −1; Low Vulnerability, between −1 and −0.5; Medium, between −0.5 and 0.5; High, between 0.5 and 1 and Very Light, greater than 1 standard deviation.
It is important to note that this Social Vulnerability Index is a relative measure [
25]. It indicates the relative differences in social vulnerability between the territories analyzed. Thus, the numerical values associated with SoVI are dependent on the area of study. For this reason, in
Table 4, an absolute value has been assigned to each category of SoVI in order to combine it with the physical vulnerability independently of the area of study and to allow comparing the results with other cases.
4.5. Step 5: Sustainable Risk Analysis
The objective of this section is to analyze the influence of social vulnerability in decision making and the potential integration to a sustainable risk index considering the physical aspects and natural hazard. Physical fragility has been measured using fragility curves for each bridge and it is represented as a probability of failure of each bridge for each simulated volcanic scenario. On the other hand, social vulnerability is a spatial dimension independent of the volcanic scenarios.
To analyze the influence of social vulnerability in decision-making and the tools that can be used for the consideration of both dimensions in the rural context, it is necessary to highlight two bridges that present a similar physical fragility, but different social vulnerability such as the Correntoso and Zanjón Seco bridges. For the Hawaiian-Strombolian scenario after winter season (scenario N°2), the probability of collapse corresponds to 9.6% for the Correntoso bridge and 13.6% for the Zanjón Seco. However, the bridge that has a lower probability of collapse (Correntoso) presents a medium social vulnerability, while the Zanjón Seco presents a low social vulnerability but a slightly higher probability of collapse.
Physical and social dimensions combined with the exposure to a natural hazard represent the sustainable approach for risk decision-making. Each procedure has been explained in the preceding four steps. The objective of combining these three dimensions is to account for the socio-economic consequences in decision making of rural roads risk management. The physical risk, measured as a deterioration of the rural roads network performance, is independent on how that deterioration affects the different communities and its dependency to critical infrastructure through the road network. Therefore, a weighted vulnerability is finally estimated as the product of physical risk and social vulnerability, resulting in the sustainable risk analysis.
Table 5 presents a summary of the application of the proposed framework considering the six volcanic scenarios, the combined probability of failure of all bridges contained in the main links of the rural road network, the social vulnerability of exposed population served by these links, and the expected travel times of the two most vulnerable links connecting the towns of Villarrica and Pucón that result from the risk analysis. Shaded scenarios represent the eruption of 2015, discussed in the following section.
5. Validation and Discussion of Results
In order to validate the effect of both social vulnerability of rural population and physical risk, the eruption of Villarrica volcano of 2015 is modelled. The eruption is representative of a Hawaiian-Strombolian process. In this case, the probabilities of collapse for each bridge were obtained from fragility curves and compared to empirical data post event, whereas the probability of failure of the affected links was obtained from the combined probabilities of failure of exposed bridges. The probabilities of failure of exposed bridges are: Correntoso Bridge 9.6%, Zanjón Seco 13.6%, and Molco 8.5%.
Values of probability of failure for road links are estimated considering the proposed graph model. For example, Correntoso and Molco bridges are located in the same link, so the probability of collapse is calculated as follows:
Once the probability of collapse of exposed bridges is known, it is combined with the social vulnerability of districts where the affected links are located. For this, weights have been assigned to the different levels of SoVI. For example, link N°2 (presented as N°2 in
Figure 6) is located in Cementerio district associated with a SoVI of 2 (Low), while link N°1 is located between Loncotraro and Cementerio districts with SoVI of 3 (Medium) and 2 (Low), respectively. In this case, the SoVI weight is calculated based on the length of the link (Li) in each district as presented in Equation (11).
Physical vulnerability for link N°1 presents a failure probability of 17.3%, where SoVI is equal to 2.46. The weighted vulnerability for that link is equal to 0.425. While link N°2 is composed just for one bridge, that makes the physical vulnerability equal to the probability of failure of that bridge. The social vulnerability of the territory in which the bridge is located is constant and equal to 2. The weighted vulnerability for that link is equal to 0.272.
Figure 6 illustrates the described case for the complete rural network and the sustainable risk analysis.
Social vulnerability analysis evidence dependency in the scale considered and the database where critical factors were obtained. Given that a single database was used, namely the national Census of 2002, certain dimensions could have been omitted in the analysis, such as risk perception and socio-economic dimensions not accounted by the Census, which are highly recommended to be addressed in future analyses. Regarding the considered scale, the administrative division of the district was determined in terms of availability and quality of data. Regarding the results obtained after the application of the index, we can determine that the districts where the main urban centers are located, Pucón and Villarrica towns, have different SoVI levels. The first of them (Cementerio district) presents a low vulnerability, while Estación district (where Villarrica town is located) presents a medium level. As expected, predominantly rural districts presented higher levels of social vulnerability, confirming the need to address the social dimension in rural contexts for sustainable risk management. One aspect to be highlighted is that the district of Cementerio, despite being one of the closest to the Villarrica volcano, has a low SoVI level. This is evidence of the need to include sociological variables in future analyses such as hazard risk perception.
Physical vulnerability of rural road infrastructure can be estimated in terms of its fragility to a certain hazard, where the probability of failure or damage state can be estimated with fragility curves. In this case study, bridges are the most vulnerable road elements in the presence of a volcanic eruption, where laharic flows are the main volcanic process affecting them. It can be noted that bridges with multiple spans are more vulnerable to laharic flows.
In order to measure physical risk of rural roads, it is necessary to evaluate network performance. In the case study, this was addressed in terms of expected travel time between the two main towns exposed to the volcanic hazard. Physical risks in terms of expected travel time (see
Figure 5) and lahar volume are directly correlated, evidencing high travel time delays in the presence of high intensity events. The road network presents different standards in terms of LoS: the main and direct route connecting critical nodes (towns of Pucón and Villarrica) have better conditions in terms of travel speed, road standard and capacity, when compared to alternative routes. According to the transportation model and the congestion analysis, a failure in the main route (the route in the shores of Villarrica Lake) produces a considerable increment in the expected traffic according to Equation (8) given that capacity is considerably lower and reassigned traffic flow is higher than the expected in normal conditions of equilibrium. Scenarios N°1, N°3 and N°4 of this analysis do not present any effect in the expected travel time due to lahar intensity related to each scenario. In other words, in these scenarios, bridges never fail and, therefore, traffic is not re-assigned. After a lahar volume of 35 × 10
6 m
3, expected travel time increases as the lahar volume does. The approach to sustainably assess network risk considered the weighted vulnerability value combining social, environmental and physical dimensions. Weighted vulnerability is sensitive to social vulnerability, resulting in an increment of expected vulnerability for similar physical vulnerabilities when a territory and its population present lower social characteristics prone to lower capabilities to recover. In particular, as referred to in the case study, the link with the highest physical vulnerability (collapse probability equal to 17.3%) is also the link with the highest social vulnerability (SoVI equal to 2.46) compared to link N°2 (physical vulnerability equal to 13.6% and SoVI equal to 2). This process results in a higher overall vulnerability, under a sustainable approach, versus what would have been expected under a physical risk perspective. The proposed framework then emphasizes the strategic importance of most vulnerable links (in terms of both physical and social dimensions) in a rural road network, resulting in a contribution to define mitigation policies for decision makers, under a sustainable approach. Particularly, in this case study, the link with the highest physical vulnerability is related to the highest social vulnerability, which may justify a clear priority of investment.
6. Conclusions
This study proposes a sustainable risk management framework for rural roads exposed to natural hazards. The framework considers a comprehensive procedure to sustainably assess risk of rural road networks by integrating the environmental dimension of the natural hazard, the social vulnerability of the exposed population and the physical vulnerability of road infrastructure. The proposed framework is applied to a rural road network, in a developing country, exposed to volcanic hazard. Outcomes demonstrate that rural populations present high social vulnerability levels compared to urban populations, resulting in a slower recovery when exposed to natural events. Therefore, the fact of considering social vulnerability under a sustainable risk management approach is critical in rural contexts, which commonly are managed under a physical vulnerability perspective. Moreover, when integrating the social dimension in the rural context, roads providing access to highly vulnerable communities should be given attention specially when presenting considerable physical risk levels. Also, it is important to highlight that under a sustainable approach for managing rural road networks, the probabilistic consequences given by the uncertain occurrence of natural hazards should be included.
From the case study, the following conclusions and recommendations were derived:
- −
Sustainable risk analysis is based on the quality of input data. For example, physical vulnerability modelling requires fragility curves of exposed road infrastructures calibrated to representative natural hazard scenarios. In the case study, fragility curves for laharic flows were calibrated for exposed bridges in the area of study. Uncertainty in fragility curves produces variations in the results of the overall risk analysis and the consequent vulnerabilities. Similarly, social variables are related to household information of rural communities; therefore, the representativeness of significant social variables is related to the accuracy on how household data is collected.
- −
One of the main characteristics of the framework is its multidisciplinary nature since it relates the environmental context of the natural hazard, social characteristics of rural population, and physical dimensions inherent to exposed infrastructure. In addition, it uses geological and physical models for hazard estimation, as well as engineering models for the analysis of traffic assignment and vulnerability of structures. Moreover, the proposed framework is applicable to different types of natural hazards such as seismic or hydro-meteorological events.
- −
The evaluation of social vulnerability accounts for users and non-users of the road network in the risk management process. This is especially important in rural contexts where rural population may not be frequent road users or may travel in non-motorized vehicles, which traditionally are not accounted in roads management. The level of service of rural roads, however, directly affects the quality of life, adaptability, and recovery of rural population in the context of natural events.
- −
The models presented in this research aim to solve each of the framework requirements. Future challenges to improve the proposed framework include traffic variability in the assignment model, the dependency of rural communities on the road network, and the importance of road links in providing access to other critical infrastructure in the rural environment.
One limitation of the proposed framework is that although it is applicable to any hazard, it currently does not reflect a multi-hazard scenario affecting the territory. As it is currently conceived, each hazard should be analyzed independently following the proposed framework. Another limitation of the model is the traffic assignment model, which assumes informed users regarding traffic conditions, representing the mid- to long-term effect during the recovery phase of the network, but not the emergency condition during and immediately after the event. In addition, caution should be taken interpreting social vulnerability in the case study, as it is representative of the population characteristics in the selected area, as well as the use of fragility models, which should be validated before applying them to other volcanic conditions.
This study opens opportunities of future research for each stage of the proposed framework. For instance, the study of other natural hazards and their recurrence, the assessment of other fragility curves for other road assets, the dependence of society to other critical networks and their dependence on rural road networks, the evaluation and optimization of mitigation strategies, and application to multi-hazard scenarios, among others.
Author Contributions
Conceptualization, A.C., T.E. and H.d.S.; Data curation, E.A., M.C., J.D. and L.E.L.; Formal analysis, E.A., M.C. and J.D.; Funding acquisition, A.C. and T.E.; Investigation, A.C., T.E., E.A., M.C. and J.D.; Methodology, A.C., T.E., E.A., M.C., J.D., H.d.S. and L.E.L.; Supervision, A.C., T.E. and H.d.S.; Validation, A.C., T.E., E.A., M.C. and J.D.; Writing—original draft, A.C., E.A., M.C. and J.D.; Writing—review & editing, T.E., H.d.S. and L.E.L. All authors have read and agreed to the published version of the manuscript.
Funding
Authors would like to acknowledge the National Agency of Research and Development of Chile (ANID) for funding the FONDEF Project “Research and Development of Models to Quantify and Mitigate the Risk of Natural Hazards in the National Road Network” (grant no. ID14I20309/Fondef/ANID), the FONDECYT Project (grant no. 1181754/FONDECYT/ANID), and the Research Center for Integrated Disaster Risk Management (CIGIDEN) (grant no. ANID/FONDAP/15110017).
Acknowledgments
Authors express their gratitude to the institutions that participated and contributed to these research projects, the Highways Department of the Ministry of Public Works of Chile, the National Geology and Mining Service of the Chilean Ministry of Mining, the National Emergency Office of the Ministry of Interior and Public Security (ONEMI) and the Chilean Association of Public Private Partnerships (COPSA).
Conflicts of Interest
The authors declare no conflict of interest.
References
- Lebo, J.; Schelling, D. Design and Appraisal of Rural Transport Infrastructure: Ensuring Basic Access for Rural Communities (In English); World Bank Publications: Washington, DC, USA, 2001; Available online: http://documents.worldbank.org/curated/en/227731468184131693/Design-and-appraisal-of-rural-transport-infrastructure-ensuring-basic-access-for-rural-communities (accessed on 14 August 2020).
- Plessis-Fraissard, M. Planning Roads for Rural Communities. In Transportation Research Record: Journal of the Transportation Research Board, No. 1989; Transportation Research Board of the National Academies: Washington, DC, USA, 2007; Volume 1, pp. 1–8. [Google Scholar] [CrossRef]
- Haas, R.; Hudson, R.; Zaniewski, J. Modern Pavement Management; Krieger Publishing Company: Malabar, FL, USA, 1994; Available online: https://www.scribd.com/document/332448898/Modern-Pavement-Management (accessed on 7 August 2020).
- Chamorro, A.; Tighe, S. Development and Application of a Sustainable Management System for Unpaved Rural Road Networks. Transp. Res. Rec. 2019, 2673, 891–901. [Google Scholar] [CrossRef]
- Grootaert, C.; Malmberg, C. Socioeconomic Impact Assessment of Rural Roads: Methodology and Questionnaires; Impact Evaluation report; INFTD, World Bank: Washington, DC, USA, 2002; Available online: http://citeseerx.ist.psu.edu/viewdoc/download?doi=10.1.1.201.1700&rep=rep1&type=pdf (accessed on 7 August 2020).
- Archondo-Callao, R. Evaluating economically justified road works expenditures on unpaved roads in developing countries. Transp. Res. Rec. 2007. [Google Scholar] [CrossRef]
- Faiz, A.; Faiz, A.; Wang, W.; Bennett, C. Sustainable rural roads for livelihoods and livability. Procedia–Soc. Behav. Sci. 2012. [Google Scholar] [CrossRef]
- SADC. Guideline Low-volume Sealed Roads. Southern African Development Community: Gaborone, Botswana. 2003. Available online: https://www.ssatp.org/sites/ssatp/files/publication/LVSR-Guideline-FullText.pdf (accessed on 7 August 2020).
- Versini, P.; Gaume, E.; Andrieu, H. Assessment of the susceptibility of roads to flooding based on geographical information–Test in a flash flood prone area (the Gard region, France). Nat. Hazards Earth Syst. Sci. 2010. [Google Scholar] [CrossRef]
- Pregnolato, M.; Ford, A.; Wilkinson, S.; Dawnson, R. The impact of flooding on road transport: A depth-disruption function. Transp. Res. Part D 2017, 55, 67–81. [Google Scholar] [CrossRef]
- Hackl, J.; Ham, J.; Heitzler, M.; Adey, B.; Hurni, L. Estimating network related risks: A methodology and an application in the transport sector. Nat. Hazards Earth Syst. Sci. 2018, 18, 2273–2293. [Google Scholar] [CrossRef]
- Giuliano, G.; Golob, J. Impacts of the northridge earthquake on transit and highway use. J. Trans-Portation Stat. 1998, 1, 1–20. [Google Scholar]
- Bil, M.; Sedonik, J.; Kubecek, J.; Vodak, R.; Bolova, M. Road Network Segments at Risk Vulnerability Analysis and Natural Hazards Assess-Ment. 2014. Available online: https://www.pdfs.semanticscholar.org/d58c/aabae5b34e6af63c9a475c71dd0d17cd6df0.pdf (accessed on 7 August 2020).
- Badurdeen, F.; Shuaib, M.; Liyanage, J. Risk modeling and analysis for sustainable asset management. In Engineering Asset Management and Infrastructure Sustainability; Springer: London, UK, 2012; pp. 61–75. [Google Scholar] [CrossRef]
- Haimes, Y.Y. Risk Modeling, Assessment, and Management; John Wiley & Sons Inc.: Hoboken, NJ, USA, 2004; Available online: https://onlinelibrary.wiley.com/doi/book/10.1002/0471723908 (accessed on 14 August 2020).
- Liyanage, J.P. Sustainability risk management: Managing business risk in complex environments through systematic operations and maintenance performance specifications. In Proceedings of the 18th European Maintenance Congress: Euromaintenance 2006, Basel, Switzerland, 20–22 June 2006; Congress Center: Basel, Switzerland, 2004; pp. 677–682. [Google Scholar]
- Van der Lei, T.; Wijnia, Y.; Herder, P. Towards an asset management framework of asset characteristics, asset environment, lifecycle phases, and management. In Engineering Asset Management and Infrastructure Sustainability; Springer: London, UK, 2012. [Google Scholar] [CrossRef]
- AASHTO: American Association of State Highway and Transportation Officials: Guide for Design of Pavement Structures; AASHTO: Washington, DC, USA, 1993; Available online: https://habib00ugm.files.wordpress.com/2010/05/aashto1993.pdf (accessed on 7 August 2020).
- Koks, E.E.; Jongman, B.; Husby, T.G.; Botzen, W.J.W. Combining hazard, exposure and social vulnerability to provide lessons for flood risk management. Environ. Sci. Policy 2015, 47, 42–45. [Google Scholar] [CrossRef]
- Cutter, S.L.; Emrich, C.T.; Morath, D.P.; Dunning, C.M. Integrating social vulnerability into federal flood risk management planning. J. Flood Risk Manag. 2013, 6, 332–344. [Google Scholar] [CrossRef]
- Cutter, S.L. Vulnerability to environmental hazards. Prog. Hum. Geogr. 1996, 20, 529–539. [Google Scholar] [CrossRef]
- Robinson, R.; Danielson, U.; Snaith, M. Road Maintenance Management, 1st ed.; Palgrave: London, UK, 1998; Available online: https://trid.trb.org/view/536844 (accessed on 7 August 2020).
- De Solminihac, H.; Echaveguren, T. Chamorro. Gestión de Infraestructura Vial. (In Spanish), 3rd ed.; Ediciones UC: Santiago, Chile, 2018; Available online: https://www.jstor.org/stable/j.ctvkjb4dw (accessed on 7 August 2020).
- Muhlrad, N.; Vallet, G.; Butler, I.; Gitelman, V.; Doveh, E.; Dupont, E.; Thomas, P.; Talbot, R.; Papadimitrou, E.; Yanis, G.; et al. Analysis of road safety management systems in Europe. In Proceedings of the TRA 2014–Transport Research Arena: 5th Conference: Transport Solutions from Research to Deployment, Paris, France, April 2014; p. 10. [Google Scholar]
- Cutter, S.; Boruff, B.; Shirley, W. Social vulnerability to environmental hazards. Soc. Sci. Q. 2003, 84, 242–261. [Google Scholar] [CrossRef]
- Birkmann, J. Measuring Vulnerability to Natural Hazards–Towards Disaster Resilient Societies; ARIA: Malvern, UK, 2010; Volume 7, pp. 956–961. [Google Scholar]
- Birkmann, J.; Cardona, O.; Carreño, M.; Barbat, A.; Pelling, M.; Schneiderbauer, S.; Kienberger, S.; Keiler, M.; Alexander, D.; Zeil, P.; et al. Framing vulnerability, risk and societal responses: The MOVE framework. Nat. Hazards 2013, 67, 193–211. [Google Scholar] [CrossRef]
- Berdica, K. An introduction to road vulnerability: What has been done, is done and should be done. Transp. Policy 2002, 9, 117–127. [Google Scholar] [CrossRef]
- Murray, A.; Matisziw, T.; Grubesic, T. A methodological overview of network vulnerability analysis. Growth Chang. 2008, 39, 573–592. [Google Scholar] [CrossRef]
- Xia, J.; Chen, M.; Liu, R. Framework for Risk Assessment of Highway Network. In Proceedings of the 84th Annual Meeting of the Transportation Research Board, Washington, DC, USA, 9–13 January 2005; 2005. Available online: https://trid.trb.org/view/1157120 (accessed on 7 August 2020).
- Ezzell, B.C. Infrastructure Vulnerability Assessment Model (I-VAM). Risk Anal. 2007, 27, 571–583. [Google Scholar] [CrossRef]
- Kennedy, R.P.; Cornell, C.A.; Campbell, R.D.; Kaplan, S.; Perla, H.F. Probabilistic seismic safety study of an existing nuclear power plant. Nucl. Eng. Des. 1980, 59, 315–338. [Google Scholar] [CrossRef]
- Sanhueza, R.; Felez, J.; Azocar, G.; Echaveguren, T. Including natural risk concepts in road maintenance planning. In Proceedings of the 8th International Conference on Managing Pavement Assets, Santiago, Chile, 15–19 November 2014; Volume 171, pp. 1–14. [Google Scholar] [CrossRef]
- Renn, O. Risk Governence. White Paper No 1, Geneva: International Risk Governance Council. 2005. Available online: https://irgc.org/wp-content/uploads/2018/09/IRGC_WP_No_1_Risk_Governance__reprinted_version_3.pdf (accessed on 7 August 2020).
- Aven, T. On how to define, understand and describe risk. Reliab. Eng. Syst. Saf. 2010, 95, 623–631. [Google Scholar] [CrossRef]
- Lleras-Echeverri, G.; Sánchez-Silva, M. Vulnerability analysis of highway networks, methodology and case study. Proc. ICE–Transp. 2001, 147, 223–230. [Google Scholar] [CrossRef]
- Sakakibara, H.; Kajitani, Y.; Okada, N. Road Network robustness for avoiding functional isolation in disasters. J. Transp. Eng. 2004, 130, 560–567. [Google Scholar] [CrossRef]
- Taylor, M.A.; Sekhar, S.V.; D’Este, G.M. Application of accessibility based method for vulnerability analysis of strategic road networks. Netw. Spat. Econ. 2006, 6, 267–291. [Google Scholar] [CrossRef]
- Bell, M.G.; Kanturska, U.; Schmöcker, J.D.; Fonzone, A. Attacker-defender models and road network vulnerability. Philos. Trans. A Math. Phys. Eng. Sci. 2008, 366, 1893–1906. [Google Scholar] [CrossRef] [PubMed]
- Rocco, C.; Ramirez-Marquez, J.E. Vulnerability metrics and analysis for communities in complex networks. Reliab. Eng. Syst. Saf. 2011, 96, 1360–1366. [Google Scholar] [CrossRef]
- Luping, Y.; Dalin, Q. Vulnerability Analysis of Road Networks. J. Transp. Syst. Eng. Inf. Technol. 2012, 12, 105–110. [Google Scholar] [CrossRef]
- Taylor, M.A. Remoteness and accessibility in the vulnerability analysis of regional road networks. Transp. Res. Part A 2012, 46, 761–771. [Google Scholar] [CrossRef]
- Islam, M.S.; Swapan, M.S.H.; Haque, S.M. Disaster risk index. How far should it take account of local attributes? Int. J. Disaster Risk Reduct. 2013, 3, 76–87. [Google Scholar] [CrossRef]
- Flanagan, B.E.; Gregory, E.W.; Hallisey, E.J.; Heitgerd, J.L.; Lewis, B. A Social Vulnerability Index for Disaster Management. J. Homel. Secur. Emerg. Manag. 2011, 8. [Google Scholar] [CrossRef]
- Jonkman, S.N.; Van Gelder, P.; Vrijling, J.K. An overview of quantitative risk measures for loss of life and economic damage. J. Hazard. Mater. 2003, 99, 1–30. [Google Scholar] [CrossRef]
- Tate, E. Social vulnerability indices: A comparative assessment using uncertainty and sensitivity analysis. Nat. Hazards 2012, 63, 325–347. [Google Scholar] [CrossRef]
- Solangaarachchi, D.; Griffin, A.L.; Doherty, M.D. Social vulnerability in the context of bushfire risk at the urban-bush interface in Sydney: A case study of the Blue Mountains and Ku-ring-gai local council areas. Nat. Hazards 2012, 64, 1873–1898. [Google Scholar] [CrossRef]
- Few, R.; Mathies, F. Flood Hazards and Health: Responding to Present and Future Risks; Earthscan: London, UK, 2006; Available online: https://books.google.com.hk/books?hl=ar&lr=&id=F0PWiaeJDv4C&oi=fnd&pg=PR3&dq=1.+Flood+hazards+and+health:+responding+to+present+and+future+risks.+Choice+Rev.+Online+2006,+44,+44,+doi:10.5860/choice.44-1555.&ots=f1UDqWZFrC&sig=RDCjJtqTAfppXKzS3yeSsaptrZ4&redir_esc=y&hl=zh-CN&sourceid=cndr#v=onepage&q&f=false (accessed on 7 August 2020). [CrossRef]
- Begum, S.; Stive, M.J.F.; Hall, J.W. Flood Risk Management in Europe: Innovation in Policy and Practice; Springer: Dordrecht, The Netherlands, 2007; Available online: https://www.springer.com/gp/book/9781402041990 (accessed on 7 August 2020).
- Fekete, A. Validation of a social vulnerability index in context to river floods in Germany. Nat. Hazards Earth Syst. Sci. 2009, 9, 393–403. [Google Scholar] [CrossRef]
- De Loyola Hummell, B.M.; Cutter, S.L.; Emrich, C.T. Social Vulnerability to Natural Hazards in Brazil. Int. J. Disaster Risk Sci. 2016, 7, 111–122. [Google Scholar] [CrossRef]
- Smit, B.; Wandel, J. Adaptation, adaptive capacity and vulnerability. Glob. Environ. Chang. 2006, 16, 282–292. [Google Scholar] [CrossRef]
- Kappes, M.S.; Papathoma-Köhle, M.; Keiler, M. Assessing physical vulnerability for multi-hazards using an indicator-based methodology. Appl. Geogr. 2012, 32, 577–590. [Google Scholar] [CrossRef]
- Tapsell, S.; McCarthy, S.; Faulkner, H.; Alexander, M. Social Vulnerability and Natural Hazards. CapHaz-Net WP4 Report, Flood Hazard Research Centre-FHRC, Middlesex University, London. 2010. Available online: http://www.CapHaz-net.org/outcomes-results/CapHaz-Net_WP4_Social_Vulnerability.pdf (accessed on 7 August 2020).
- Guillard-Gonçalves, C.; Cutter, S.L.; Emrich, C.T.; Zêzere, J.L. Application of Social Vulnerability Index (SoVI) and delineation of natural risk zones in Greater Lisbon, Portugal. J. Risk Res. 2014, 9877, 1–24. [Google Scholar] [CrossRef]
- Frigerio, I.; Ventura, S.; Strigaro, D.; Mattavelli, M.; De Amicis, M.; Mugnano, S.; Boffi, M. A GIS-based approach to identify the spatial variability of social vulnerability to seismic hazard in Italy. Appl. Geogr. 2016, 74, 12–22. [Google Scholar] [CrossRef]
- Chen, W.; Cutter, S.L.; Emrich, C.T.; Shi, P. Measuring social vulnerability to natural hazards in the Yangtze River Delta region, China. Int. J. Disaster Risk Sci. 2013, 4, 169–181. [Google Scholar] [CrossRef]
- Lara, L.E.; Flores, F.; Calderón, R.; Cardona, C. Volcano hazards and risks in Chile. In Forecasting and Planning for Volcanic Hazards, Risks, and Disasters; Papale, P., Ed.; Elsevier: Amsterdam, The Netherlands, 2020; Available online: https://www.elsevier.com/books/forecasting-and-planning-for-volcanic-hazards-risks-and-disasters/papale/978-0-12-818082-2 (accessed on 7 August 2020).
- Van Daele, M.; Moernaut, J.; Silversmit, G.; Schmidt, S.; Fontijn, K.; Heirman, K.; Urrutia, R.; Roberts, S.; Urrutia, R.; Pino, M.; et al. The 600 yr eruptive history of Villarrica Volcano (Chile) revealed by annually laminated lake sediments. GSA Bull. 2014, 126, 481–498. [Google Scholar] [CrossRef]
- Petit-Breuilh, M.E. La Historia Eruptiva de los Volcanes Hispanoamericanos (Siglos XVI al XX): El Modelo Chileno; Servicio de Publicaciones: Cabildo Insular de Lanzarote, España, 2004; Available online: https://scholar.google.com/scholar?hl=ar&as_sdt=0%2C5&q=La+historia+eruptiva+de+los+volcanes+hispanoamericanos+%28siglos+XVI+al+XX%29+%3A+el+modelo+chileno&btnG= (accessed on 29 June 2020).
- Romero, J.E.; Vera, F.; Polacci, M.; Morgavi, D.; Arzilli, F.; Alam, M.A.; Bustillos, J.E.; Guevara, A.; Johnson, J.B.; Palma, J.L.; et al. Tephra from the 3 March 2015 sustained column related to explosive lava fountain activity at Volcán Villarrica (Chile). Front. Earth Sci. 2018, 6, 98. [Google Scholar] [CrossRef]
- Silva-Parejas, C.; Druitt, T.H.; Robin, C.; Moreno, H.; Naranjo, J.A. The Holocene Pucón eruption of Volcán Villarrica, Chile: Deposit architecture and eruption chronology. Bull. Volcanol. 2010, 72, 677–692. [Google Scholar] [CrossRef]
- Costantini, L.; Pioli, L.; Bonadonna, C.; Clavero, J.; Longchamp, C. A Late Holocene explosive mafic eruption of Villarrica volcano, Southern Andes: The Chaimilla deposit. J. Volcanol. Geotherm. Res. 2011, 200, 143–158. [Google Scholar] [CrossRef]
- Lara, L.E.; Clavero, J. Villarrica Volcano (39.5 S), Southern Andes, Chile; Servicio Nacional de Geología y Minería: 2004. Available online: https://www.researchgate.net/profile/Hugo_Roa2/publication/313695651_Laharic_debris-flows_from_Villarrica_Volcano_IAVCEI_2004Servicio_Nacional_de_Geologia_y_Mineria_Boletin_No_61_Luis_Lara_Jorge_Clavero_Editors/links/5db22f0492851c577ebb1a38/Laharic-debris-flows-from-Villarrica-Volcano-IAVCEI-2004Servicio-Nacional-de-Geologia-y-Mineria-Boletin-No-61-Luis-Lara-Jorge-Clavero-Editors.pdf. (accessed on 29 June 2020).
- Moreno, H. Mapa de peligros del volcán Villarrica, regiones de La Araucanía y de Los Lagos. Servicio Nacional de Geología y Minería 2000, 17. [Google Scholar] [CrossRef]
- Vallance, J.; Lahars. Encycopedia of Volcanoes; Sigurdsson, H., Ed.; Academic Press: San Diego, CA, USA, 2000; pp. 601–616. [Google Scholar]
- Vallance, J.; Iverson, R. Lahars and their deposits. In The Encyclopedia of Volcanoes, 2nd ed.; Elsevier: San Diego, CA, USA, 2015; pp. 649–664. [Google Scholar] [CrossRef]
- Pierson, T.C.; Wood, N.J.; Driedger, C.L. Reducing risk from lahar hazards: Concepts, case studies, and roles for scientists. J. Appl. Volcanol. 2014, 3, 16. [Google Scholar] [CrossRef]
- Smith, G.A.; Fritz, W.J. Volcanic influences on terrestrial sedimentation. Geology 1989, 17, 375–376. [Google Scholar] [CrossRef]
- Wilson, G.; Wilson, T.; Deligne, N.; Cole, J. Volcanic hazard impacts to critical infrastructure: A review. J. Volcanol. Geoth. Res. 2014, 286, 148–182. [Google Scholar] [CrossRef]
- Iverson, R.; Schilling, S.; Vallance, J. Objective delineation of lahar-hazard zones downstream from volcanoes. Geol. Soc. Am. Bull. 1998, 110, 972–984. [Google Scholar] [CrossRef]
- Newhall, C.G.; Self, S. The volcanic explosivity index (VEI) an estimate of explosive magnitude for historical volcanism. J. Geophys. Res. Ocean. 1982, 87, 1231–1238. [Google Scholar] [CrossRef]
- Simkin, T.; Siebert, L.; McClelland, L.; Bridge, D.; Newhall, C.; Latter, J.H. Volcanoes of the world. Smithsonian Institution; Geoscience Press Inc., 1994; Available online: https://volcano.si.edu/gvp_votw.cfm (accessed on 7 August 2020).
- Geoestudios. Estudio Geológico Y Vulcanológico Para Caracterizar Los Lahares Del Volcán Villarrica; Informe, V; Sernageomin: Santiago, Chile, 2013; p. 205. [Google Scholar]
- INH. Construcción Mitigación Riesgos Volcánicos y Geológicos Asociados, Comunas de Villarrica, Pucón y Curarrehue, Región de la Araucanía; Instituto Nacional de Hidráulica: Santiago, Chile, 2013; Available online: http://www.inh.cl/home/documents/proyects/001-09-2014%20Ficha%20Estudio%20Riesgos%20volcanicos,%20regi%C3%B3n%20Araucan%C3%ADa_Estudio.pdf. (accessed on 7 August 2020).
- Flores, L.; Felipe, A. Análisis Cuantitativo Del Riesgo De Inundación Por Lahares En El Volcán Villarrica: Métodos Integrados De Peligro Y Vulnerabilidad Para La Ciuda De Pucón. Centro Sur De Chile. Bachelor’s Thesis, Universidad de Chile, Santiago, Chile, 2014. Available online: http://repositorio.uchile.cl/handle/2250/131680 (accessed on 29 June 2020).
- Rossetto, T.; Ioannou, I.; Grant, D.N. Existing Empirical Fragility and Vulnerability Functions: Compendium and Guide for Selection; GEM Technical Report 2015–1; GEM Foundation Pavia: Pavia, Italy, 2015. [Google Scholar] [CrossRef]
- Dagá, J.; Chamorro, A.; De Solminihac, H.; Echaveguren, T. Development of fragility curves for road bridges exposed to volcanic lahars. Nat. Hazards Earth Syst. Sci. 2018, 18, 1–15. [Google Scholar] [CrossRef]
- Beckmann, M.; McGuire, C.; Winsten, C.; Studies in the Economics of Transportation. Cowles Commission for Research in Economics. 1956. Available online: https://books.google.cl/books?id=gbUeAQAAMAAJ (accessed on 4 August 2020).
- Manual, H.C. Transportation Research Board. Highway Capacity Manual. TRB 2010, 4. Available online: https://hcm2010.org/system/datas/85/original/Chapter%2031%20%20Signalized%20Intersections%20Supplemental.pdf (accessed on 29 June 2020).
- Rygel, L.; O’sullivan, D.; Yarnal, B. A method for constructing a social vulnerability index: An application to hurricane storm surges in a developed country. Mitig. Adapt. Strateg. Glob. Chang. 2006, 11, 741–764. [Google Scholar] [CrossRef]
- Khan, S. Vulnerability assessments and their planning implications: A case study of the Hutt Valley, New Zealand. Nat. Hazards 2012, 64, 1587–1607. [Google Scholar] [CrossRef]
- Zebardast, E. Constructing a social vulnerability index to earthquake hazards using a hybrid factor analysis and analytic network process (F’ANP) model. Nat. Hazards 2013, 65, 1331–1359. [Google Scholar] [CrossRef]
© 2020 by the authors. Licensee MDPI, Basel, Switzerland. This article is an open access article distributed under the terms and conditions of the Creative Commons Attribution (CC BY) license (http://creativecommons.org/licenses/by/4.0/).

 ,
, 


