Article

Sustainable Pest Management through Improved Advice in Agricultural Extension

1
Chinese Ministry of Agriculture and Rural Affairs, CABI Joint Laboratory for Biosafety, Institute of Plant Protection, Chinese Academy of Agricultural Sciences, Beijing 100193, China
2
Beijing Plant Protection Station, Beijing 100026, China
3
Xing’an Plant Protection Station, Xing’an County, Guilin 541300, Guangxi Zhuang Autonomous Region, China
4
Sichuan Provincial Plant Protection Station, Chengdu 610041, Sichuan Province, China
5
Agricultural Information Institute, Chinese Academy of Agricultural Sciences, Beijing 100081, China
*
Author to whom correspondence should be addressed.
Sustainability 2020, 12(17), 6767; https://doi.org/10.3390/su12176767
Submission received: 9 July 2020 / Revised: 10 August 2020 / Accepted: 18 August 2020 / Published: 20 August 2020
(This article belongs to the Section Sustainable Agriculture)

Abstract

:
This 5-year study addresses how improved quality of agricultural extension may lead to more sustainable pest management. We studied 112 agricultural extension workers trained as plant doctors under the Plantwise program in China. They run 70 plant clinics in Beijing, Guangxi, and Sichuan provinces. We analysed 47,156 recommendations issued by these plant doctors to 13,051 different growers between 2012 and 2017, and this for 250 different plant health problems on 91 crops. We also interviewed growers who had taken queries to plant clinics. On average, 86% of plant doctors provided comprehensive integrated pest management recommendations to the growers, with a 16% improvement in comprehensiveness over years. This most often included advice of synthetic pesticides (66%) with its frequency not much changing with time. In contrast, as a likely result of Plantwise interventions and China’s pesticide reduction policies, recommendations for biological control increased from 2% to 42%, pest monitoring by 8%, and cultural control by 11%. Recommendations of problematic plant protection agents as listed in the Montreal Protocol, Stockholm or Rotterdam convention, or as highly toxic under WHO’s toxicity classification were already rare in 2013 (1.9%) and nearly phased out by 2017 (0.2%). About 92% of growers implemented the advice, suggesting that agricultural extension services may contribute to changes in agricultural practices at scale. Further investment in such agricultural extension services may be warranted instead of phasing them out.

1. Introduction

The overuse of pesticides for crop protection is a common problem across many farming systems and regions [1,2,3]. Particularly in regions where pesticides are comparatively affordable, growers may apply pesticides preventively and/or according to schedule regardless of the pest situation. In many cases, growers may not apply regular pest monitoring to aid decision making for or against the use of pesticides. This might be due to (i) the wish to save labor costs for monitoring or (ii) a lack of knowledge in pest diagnosis and monitoring (e.g., [4]). The latter may be largely due to growers’ lack of information and/or lack of agricultural training [2,5].
Agricultural extension services are aimed at improving agricultural production, but also at mitigating risks of pesticide overuse or misuse [6,7]. In some regions, such as in East Africa and some South and East Asian countries, networks of well-structured governmental extension services exist with offices and staff at district or even village level [8]. In some countries, the Plantwise program uses plant clinics run by those frontline agricultural extension workers (trained as plant doctors) with the aim to reach more growers than the office- or field visit-based extension methods [9] or Farmer Field Schools [10]. Large networks of governmental extension services or plant doctors are also well-placed to raise awareness and aid implementation of new agricultural policies and legislation, such as updated lists of registered pesticides, banned pesticide lists, or agricultural subsidy programs.
In plant clinics, the diagnosis and advice are provided to the grower in the form of a written prescription [3], as known from the human health system. The prescription helps the grower to manage his/her crop and, where agri-inputs are required, to increase the likelihood of obtaining the correct products. The data collected through the prescription form are held in a database [11]. This provides a unique chance to analyse agricultural extension services and to inform decision making by plant health stakeholders, such as for pest surveillance, for addressing plant health problem changes over time such as under climate change, for identifying training needs, or (as presented here) for analysing the quality of recommendations, for example in view of better implementing agricultural policies on pesticide reduction [12].
China has recently released a number of agricultural policies aimed at reducing pesticide and fertilizer usage and aimed at reducing incidences of food scandals due to pesticide contamination. One such policy is China’s “Green Pest Control” Policy [13,14]. It promotes nonchemical pest control as well as a preference for least toxic/least residual pesticides [14]. All those are called “Green Pest Control” products in Chinese and equal products compatible with Integrated Pest Management (IPM) as per definitions of IOBC [15] and Plantwise [16]. These policies have led to a number of subsidy programs in support of biological control and least toxic/least residual plant protection products. China is also running plant clinic networks of Plantwise since 2012, largely linked to the governmental extension services and partly to private services. Zhang et al. compared both types of services and showed that they both provide high quality services to growers, with a slightly higher risk for more pesticide advice by private sector services.
Our question was whether agricultural extension services can pick up novel policies and proposed technologies and whether they can advise growers accordingly. We therefore analysed prescription data from plant clinics in Beijing, Sichuan, and Guangxi provinces between 2013 to 2017. The main hypothesis was that pest management advice to growers may change over time with changing agricultural policies and with skill improvements of the plant doctors. We particularly focused on potential improvements towards more sustainable pest management advice, and on phasing out of red list active ingredients as defined by the World Health Organization, Stockholm Convention, Montreal Protocol or Rotterdam Convention [16]. We also conducted a grower survey to assess whether such agricultural advice is indeed implemented by the growers and may therefore facilitate the implementation of agri-policies for reducing problematic pesticides or increasing the use of nonchemical plant protection. Findings may help to clarify weaknesses and strengths in agricultural extension and may suggest whether it is wise for countries to further invest in large networks of agricultural extension services.

2. Materials and Methods

2.1. Agricultural Extension Worker Survey

To assess changes in quality of advisory services over time, we analysed written agricultural advice provided in form of prescriptions to growers in the Beijing, Guangxi, and Sichuan provinces of China between 2013 and 2017. These results were then compared with growers’ views and their agricultural farming practices (see next section).
The analysis of written recommendations covered 112 agricultural extension workers (= study population) who had been trained as plant doctors on diagnosis and management of plant health problems as part of the Plantwise program [3,10]. These plant doctors provided free diagnosis and advice to growers. In China, plant doctors consist of government employed agricultural extension workers under county/district level Plant Protection Stations or under township level agri-service centers, of cooperatives‘ extension workers, and of private service providers [3].
Plant clinics have been established through a gradual roll-out in 9 catchment areas around Beijing municipality (9 districts: Daxing, Miyun, Pinggu, Tongzhou, Changping, Huairou, Shunyi, Yanqing, and Fangshan) since 2012, in one catchment area in Guangxi province (Xing’an county of Guilin district) since 2012, and in three areas in Sichuan province (Pengshan, Qingsheng, and Pujiang counties) since 2013 (Table 1). Therefore, the survey followed an unaligned, clustered sample design [17] with the clinic districts as clusters.
The survey was implemented through analysing data from the prescription forms that plant doctors had issued on single plant health problems brought by growers to the plant clinics (see form example in [3]). Prescription forms contain information about the plant clinic location as well as the advising plant doctor, the advised grower, symptoms and diagnosis of the plant health problem, and advice details [10]. Altogether there are 88 tick boxes and 17 descriptive areas on the forms. A copy of the form is provided to the grower so that he/she can double check the diagnosis in his/her field, further monitor the problem, and then decide whether and how to implement the recommended measures including potentially visiting an agri-input shop with the prescription form. A copy of the form is kept electronically at the plant clinic. Between 2013 and 2017, 47,904 prescription forms had been issued to growers and 47,156 were suitable for analyses (sample sizes in Table 1). For validation of diagnosis and advice see below.

2.2. Grower Survey

To better understand uptake and impact of advice that agricultural extension workers have provided to the growers, a grower survey was conducted in 2016. Grower information also helped to weight findings from the analyses of the written advice on prescription forms as described above.
The survey was based on structured interviews of growers following a stratified sampling plan across five of the 9 plant clinic catchment areas around Beijing (Yanqing 66 growers, Changping 6, Shunyi 80, Pinggu 64, Fangshan 47) (see further details in [14]). A study population of 263 growers, each representing different farm households, was successfully interviewed. The sampling distribution reflects the distribution of the approximately 9000 growers (= target or statistical population) attending clinics in the Beijing area each year (see prescription form data in Table 1). The interviewed growers had been served by a total of 16 plant doctors, which represent the 54 plant doctors that had been active in 2016. The survey was implemented in November 2016 by two lead investigators and 10 enumerators, supported by two staff from the Beijing Plant Protection Station. All enumerators had been trained on conducting interviews including role plays as well as on proper data entry. A pilot survey on a small grower group was conducted to test the interviewing process. The interview structure and questions were subsequently adapted where needed.
The final questionnaire contained 51 questions. There were 28 questions with regard to experiences of the grower since the last plant clinic visit. These included information on plant health problem diagnosis and pest management advice obtained from the plant doctor, as well as on the uptake by the grower. An additional 8 questions addressed agricultural production on the farm, including implementation and impact of pest management practices due to advice from plant doctors. Finally, 15 questions were used to gather data on grower characteristics. Each grower interview lasted about 45 min and data were entered the same day. Data quality was assured as per [14].

2.3. Assessment of Outreach of Plant Clinics

We counted the number of prescription forms on diagnosis and management of a plant health problem issued to growers per clinic session (Table 1); the number of sessions per year reflecting regularity; and the number of queries and different growers per plant doctor, as well as the type of consulted crops and plant health problems.

2.4. Assessment of Quality of Diagnosis

The diagnoses written on the prescription forms were first validated for correctness by a quality monitoring team of national and local plant protection experts and senior agricultural extension officers [3,8]. These experts compared the written diagnosis with (a) the described symptoms (descriptive part of the prescription form), (b) the chosen symptom tick boxes (24 symptoms possible), and (c) the causation group tick boxes. A diagnosis was accepted as correct if (a), (b), and (c) were fitting together and were plausible (i.e., problem known from the region and focal crop), as well as when all key symptoms had been mentioned. Otherwise the diagnosis was rejected.
Views of growers were assessed in interviews through questions on the accuracy of diagnostics provided by the plant doctors.

2.5. Assessment of Quality of Pest Management Advice

The written advice provided on the prescription forms was validated and agreed on by the same quality monitoring team mentioned above. Advice categories were monitoring and decision making, cultural control, biological control, crop resistance/tolerance, synthetic fungicides, insecticides, acaricides, nematicides, or herbicide. First, the validity of the advice was assessed based on efficacy, safety, and practicability in relation to the plant health problem diagnosed. The quality of advice was then further characterized based on its comprehensiveness or, in other words, the extent to which all relevant IPM approaches have been included in the advice [15]. This means preventive management measures, pest monitoring and decision information, and both nonchemical and least toxic chemical options for direct control. For pesticide recommendations, plant doctors may have also provided additional details on restrictions for use. Finally, the number of words in the written advice were counted as a parameter for detail.
Views of growers were assessed on recommendation validity and comprehensiveness with regard to IPM measures as well as to aspects of economics, practicability, and effectiveness. The growers also provided feedback on the extent of supporting information obtained, such as how to apply pesticides, dosages, preharvest intervals, and personal protection equipment.

2.6. Assessment of Reduction of Pesticide Risks

The written advice on the prescription forms was analysed for the frequency of pesticides advised by plant doctors over time. Luckily, China pesticide regulation demands the active ingredient name being part of a product trade name. This largely facilitates such data analyses. The analyses also included an assessment of the proportion of pesticides that contain active ingredients considered to be non-IPM compatible. In our study, these consist of red list active ingredients as well as antibiotics. Briefly, red list pesticides [16] include (a) highly acute hazardous ingredients classified as 1a, 1b according to the World Health Organization [18] (38 class 1a, 74 class 1b pesticides); (b) pesticides banned internationally as organic persistent pollutants according to the Stockholm Convention [19] (16 pesticides); (c) pesticides banned internationally as ozone layer destructive chemicals according to the Montreal Protocol [20] (1 pesticide), and (d) pesticides banned according to the prior informed consent in the Rotterdam convention [21] (39 pesticides). Finally, the considered agents must be nationally registered for the considered crop [22]. In other words, valid advice must comply with the Plantwise Pesticide Policy and its ‘red list’ of plant protection agents [16]. Special cases are antibiotics that are commonly not advised in plant protection, and surely not in IPM due to possible developments of microbial resistance and therefore human health risks. In China, however, some antibiotics are regarded as biopesticides and even encouraged for use [13].

2.7. Assessment of Uptake and Impact of Advice

Growers were asked to describe their level of trust in the advice from plant doctors. They were further asked which proportion of the provided advice they had implemented (fully, partly, or not at all). This information was assessed for each of the following components of advice: (1) preventive measures, (2) pest monitoring and decision making, (3) cultural control, (4) physical/mechanical control, (5) biological control (macrobials, microbials, safe botanicals, and some organic biofertilizers with pesticidal effects), and (6) synthetic pesticides. This allowed comparisons between the written prescriptions (A) and the implemented advice (B and C). Growers were asked how much the implemented advice helped in managing the plant health problem, as well as how much of the potential yield loss was prevented. Risks of potential confirmation bias were reduced as no plant doctors were present during the interviews, growers were not paid for the interview, growers were not asked for and not linked to a certain plant clinic, and personal data were kept blind.

2.8. Data Analyses

The owners of the local data sets are the local agricultural extension service organizations (the Beijing, Guangxi, and Sichuan Plant Protection Stations). Personal information of plant doctors and growers was anonymized [23].
Prescription form data were only used from plant doctors and plant clinics that had been active, this is, having issued at least 10 prescription forms to growers or having held at least 5 plant clinic sessions each year. In total, 47,156 prescription forms were harmonized with regard to spelling of names of crops, pest, plant protection products, and so forth [11] and then validated (sample sizes in Table 1). Most data of form variables [see form example in 3] were averaged per plant doctor and their clinic as well as per session date to obtain person- and day-independent data (= plant doctor and session nested data).
From the 268 attempted interviews with growers who had visited plant clinics, 263 were considered valid and used to analyse their answers given to the qualitative and quantitative questions. Invalid responses included growers that had provided inconsistent or nonsense answers.
Data, regardless of whether from prescription forms or grower interviews, were analysed for normal distribution using histograms, Q–Q plots, and the one-sample Kolmogorov Smirnoff test [24]. The influence of the independent explanatory factors, such as “year” or “province”, were tested on each of the dependent variables described above: outreach, diagnosis quality, advice quality, and uptake of advice. In cases of normally distributed data, lack of many extreme values, and independence of variables, general linear models (GLM) were applied. Multiple comparison tests, such as for comparing different IPM measures, were implemented using the Tukey test in cases of equal variances, or the Games Howell test in cases of unequal variances [24]. In cases of nominal or ordinal data, chi-square tests and likelihood ratios were used. Multiple comparison tests are not available for such data; therefore, p-values obtained from single comparisons with the chi-square likelihood ratios were corrected for false discovery rates using the Benjamini and Hochberg method [25].

3. Results

3.1. Outreach of Plant Clinics

Between 2012 and 2017, 70 plant clinics were established by 112 trained plant doctors in 13 catchment areas of local districts in three provinces of China (Table 1). An average plant clinic held around 36 ± 8 SD sessions for growers per year.
Prescription form data revealed that plant doctors issued prescriptions on plant health problem diagnosis and management for 47,156 queries brought by growers between 2013 and 2017 (9436 ± 4429/year). Each plant doctor issued, on average, 140 ± 35 prescriptions to growers each year (191 ± 38/clinic/year).
Outreach to growers improved over time mainly through an increase in plant clinic numbers and less through improving outreach per clinic (Table 1). Briefly, plant doctors reached 13,051 different growers between 2013 and 2017 (3909 ± 1505/year, 31% female growers). About 23 ± 7% of growers regularly visited a plant clinic, 17 ± 1% of growers twice and 59 ± 8% of growers only once per year. Each plant doctor reached around 77 ± 23 different growers every year, which relates to 107 ± 11 growers per plant clinic per year. Both values remained comparable over years with a slight peak in 2014.
Thus, the average field size per grower query of the considered problem crop was around 0.053 ± 0.45 ha. This equals 8.8 ± 77 mu, which is a common East Asian area unit. Each plant clinic advised on 15 ± 9 ha of problem crops per year (225 ± 135 mu).

3.2. Quality of Diagnosis

Prescription form data revealed that 91 different crops were brought by growers to the plant clinics at least 10 times between 2013 and 2017, plus an additional 62 crops that were brought in fewer cases (Table 2).
Plant doctors diagnosed around 250 different plant health problems at least 10 times between 2013 and 2017, but there were 516 unique plant health problems in total (Table 2).
In most cases, plant doctors provided a plausible diagnosis of a plant health problem consistent with the symptoms. About 97.9 ± 8 SD% of written diagnosis made by plant doctors between 2013 and 2017 were accepted as “correct” by quality monitoring teams (Table 3). Diagnosis quality did not change over years, but minor differences were found between provinces (99.7 ± 8% in Beijing and 99.4 ± 11% in Guangxi, versus 91.8 ± 7% in Sichuan).
Grower interview data confirmed results from the prescription form analyses, judging the diagnosis of plant doctors (written and oral) as mostly valid (97 ± 16% accepted overall, 2016). More specifically, growers judged the plant doctor diagnosis to be 64.1% very accurate, 33.2% fairly accurate, 2.3% acceptable, and 0.4% inaccurate.

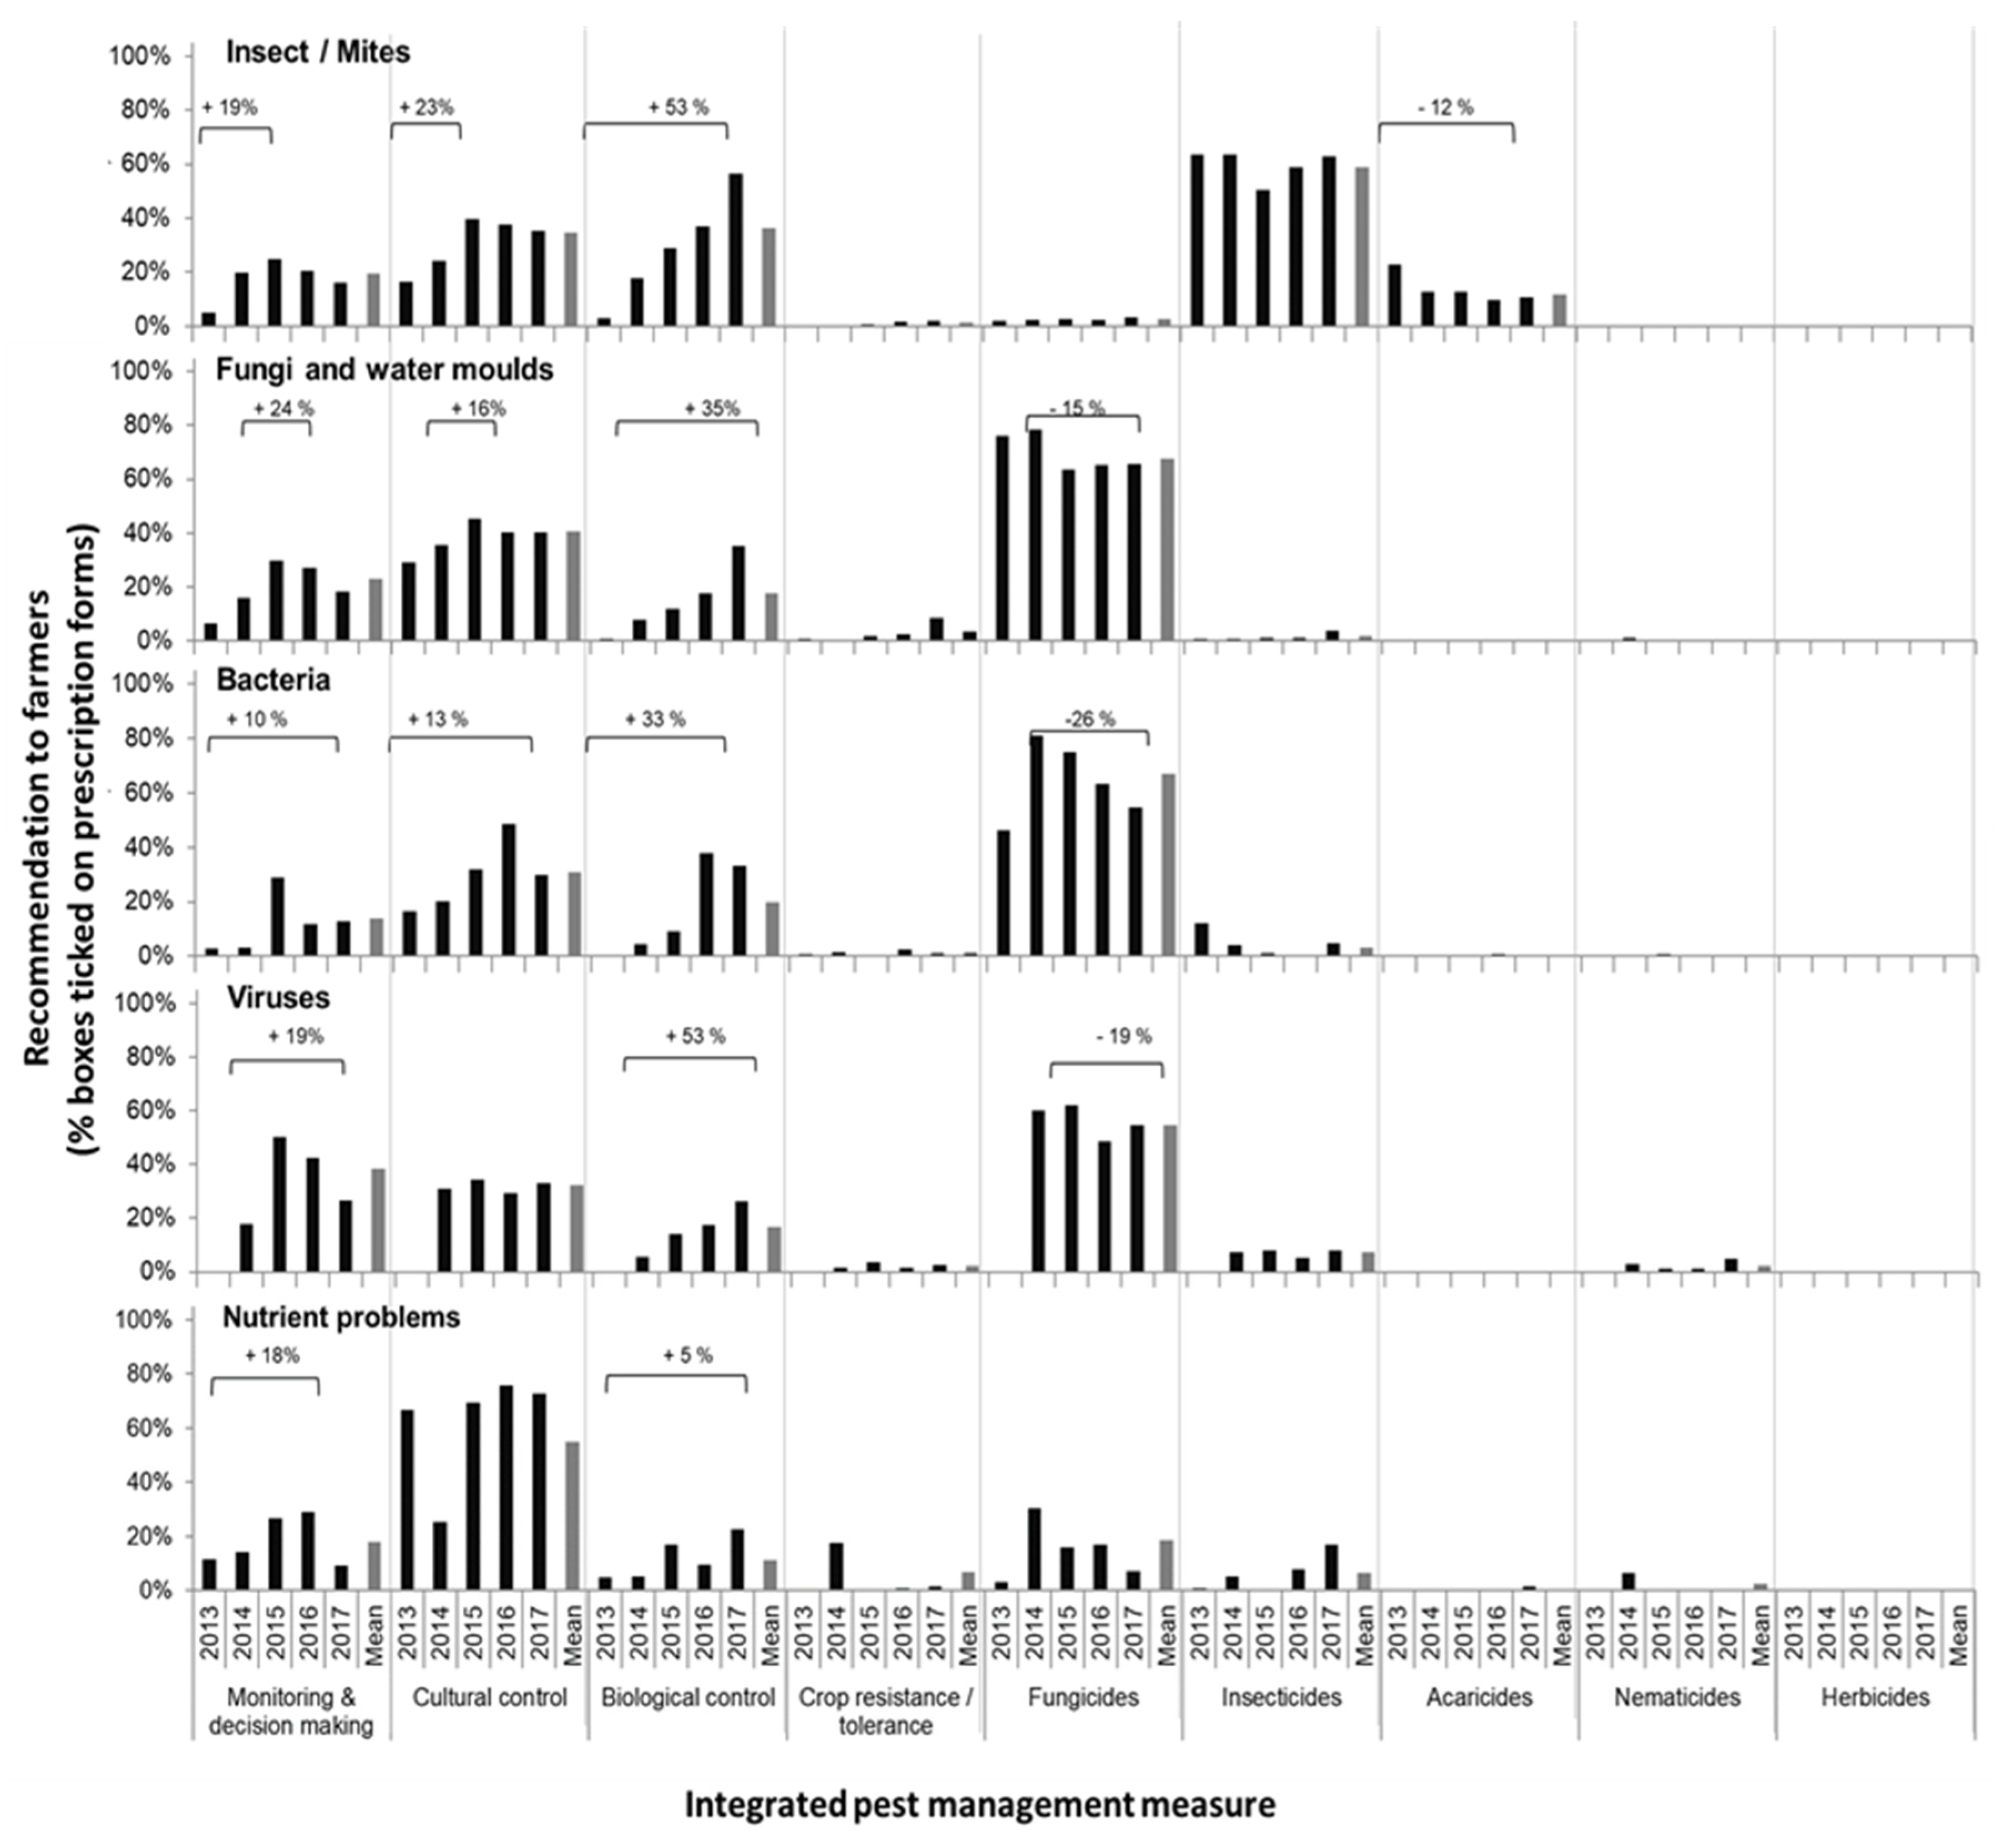
3.3. Quality of Pest Management Advice

Written advice on the prescription forms for growers appeared of high quality. That is, 96.8 ± 7% SD of recommendations between 2013 and 2017 were accepted as “valid” by quality monitoring teams (Table 3). Advice quality slightly improved by 0.4% over the years but did not differ between provinces.
Overall, 85.5 ± 20% of plant doctors provided comprehensive pest management recommendations to growers with regard to including all major IPM practices, from preventive measures via pest monitoring and decision making to non-chemical or chemical direct control (Table 3). Comprehensiveness of recommendations improved by 16% over years comparably across provinces.
Synthetic pesticides were the most frequently recommended options (66 ± 33%), followed by cultural controls (38 ± 36%), pest monitoring and decision making (23 ± 31%), and biological control (23 ± 25%) (Figure 1). The level of recommending pesticides remained high between 2013 and 2017 (more details on pesticide risks below). In contrast, the recommendation of biological control solutions increased in this period from 1.6 ± 1.9% of all recommendations in 2013 to 42 ± 32% in 2017 (40% percent point difference). Recommendations for pest monitoring and decisions also increased over the years (+8%) as did the recommendations on cultural control (+11%).
Plant doctors provided on average 69 ± 47 words long written recommendations onto a prescription form to a grower, which can be a measure of the level of details provided (Table 3). Recommendation details increased by 69% from 2013 to 2017, whilst no differences were found between provinces.
In detail, insects and mites were advised to be managed primarily through synthetic insecticides or acaricides, secondly through cultural control (largely for crop rotation, field sanitation, tillage practices), and less through biological control (Figure 2). Advice with regard to integrated pest management approaches improved over years, i.e., advice for pest monitoring increased by 19%, for cultural control by 23%, and biological control by 53%. As this included an increasing use of predatory mite products, the advice and need for synthetic acaricides decreased by 12%. The advice of synthetic insecticides remained high over the years averaging 58 ± 49%.
Fungi and water molds were advised to be managed primarily through synthetic fungicides (68 ± 47%), followed by cultural control and biological control (Figure 2). Advice improved over years, i.e., advice for disease monitoring increased by 24%, for cultural control by 16% with a slight drop towards 2017, and biological control by 36%. The latter was largely due to an increasing use of fungicidal beneficial fungi and biofertilizers with fungicidal properties. Consequently, the advice of synthetic fungicides decreased by 15%, although generally remaining at a relatively high level.
Bacteria were advised to be managed primarily through synthetic fungicides (67 ± 47%, mainly copper products) followed by cultural control and by biological control including few antibiotic- or botanical-based biopesticides regulated as biological control measure in China (Figure 2). Advice improved over years, i.e., advice for disease monitoring increased by 10%, for cultural control by 13%, and for biological control by 33%. Consequently, the advice of synthetic fungicides against bacteria decreased by 26%.
Viruses were advised to be managed through cultural control and biological control, this is plant-inducer biopesticides such as oligosaccharide chain proteins and amino-oligosaccharides (Figure 2). Despite some misuse of fungicides and antibiotics, advice with regard to integrated management of viruses improved over years. Disease monitoring increased by 19%, and biological control by 53%. Insecticides were relatively little advised for vector control.
Nutrient problems were advised to be managed through cultural control (crop rotation, intercropping, residue and mulch management) as well as through biological measures (yield enhancers) or fungicides and insecticides with biofertilizer properties (Figure 2). Advice to conduct monitoring for nutritional problems increased by 18% between 2013 and 2016 but dropped in 2017.
Interview data revealed that growers judged the pest management recommendations of plant doctors (written + oral) to be of high quality, confirming the validation results of written recommendations (see above). Briefly, growers judged 88 ± 3% of recommendations as “valid” in 2016. They judged 95% of plant doctors’ advice as economical, 96% as practical, 98% as effective, and 96% as clear (74%, very clear, 22% clear, 2.3% acceptable, 1.2% unclear).
Growers claimed to have received plant protection advice (written and oral) primarily on preventive measures as well as on synthetic pesticides (86 ± 3%, and 87 ± 13%), secondarily on pest and disease monitoring and decision making, or cultural control (60 ± 10%; 52 ± 6%), and least on physical/mechanical or biological control (17 ± 2%; 10 ± 7%) (Figure 3B). This is largely comparable to the patterns found when analysing prescription form data, except that proportions are generally higher, likely because oral advice added to written prescriptions (Figure 3A versus Figure 3B).
Plant doctors usually provided further details on the advised plant protection measures (written + oral), such as on how to implement a measure (in 92 ± 27% of cases), and/or on dosages (95 ± 22%), personal protective equipment (80 ± 40%), or preharvest intervals (87 ± 34%).
Overall, growers trusted the advice of plant doctors, that is, 83% as very reliable, 14% as reliable, 2% as acceptable, and 1% as not reliable.

3.4. Reduction of Pesticide Risks

Prescription form data revealed that plant doctors often recommended growers to use synthetic pesticides to manage a plant health problem (66 ± 33% SD of advice, Figure 3A). Most advised pesticides were fungicides and insecticides (42 ± 24 and 20 ± 16%, Figure 1). Nematicides, that are often highly toxic, were rarely advised (0.3 ± 1.4%). Plant doctors in Guangxi advised slightly more pesticides than those in Beijing or Sichuan, (90 ± 8% vs. 63 ± 34% vs. 73 ± 41%, 2013 to 2017), but this depends on the dominant crop–pest combinations in each region. The high frequency of recommending synthetic pesticides did not change over years.
Plant doctors hardly ever advised red list plant protection products to growers, i.e., only in 0.9 ± 2.2% of queries on average between 2013 and 2017 (by 37 of 81 plant doctors) (Table 3). Results showed 0.2 ± 0.5% of such advice in Beijing area, 2.1 ± 2.7% in Guangxi, and 2.4 ± 3.7% in Sichuan province. This included 20 red list pesticides (Table 4), from which three active ingredients belonged to the WHO acute toxicity class 1a, 14 were class 1b pesticides, five were restricted according to the Rotterdam Convention, two were persistent organic pollutants according to the Stockholm convention, and the ozone-depleting methyl-bromide. Advice of such red list products nearly phased out over the years, this is, decreased from 1.9 ± 2.5% in 2013 to 0.2 ± 0.7% in 2017 (Table 3 and Table 4). The following red list pesticides had not been any more advised by 2017: beta-cyfluthrin, bromadiolone, cadusafos, captafol, chlordecone, chlordimeform, cyfluthrin, DDVP (dichlorvos), methamidophos, methidathion, methomyl, monocrotophos, omethoate, oxydemeton-methyl, parathion, and triazotion (azinphos-ethyl) (Table 4).
Plant doctors occasionally advised antibiotics for disease management to growers, i.e., in 3.1 ± 4.7% of queries per plant doctor per year (by 61 of 81 plant doctors, at least 8 different antibiotics) (Table 3 and Table 4). The rate of advice of antibiotics remained comparable across provinces and years with a slight increase in 2017.

3.5. Uptake and Impact of Advice

Prescription form data revealed that the overall expected yield loss of the affected crops was estimated at 4.3 ± 3.4% on average (6.6 ± 4.8% in 2013, 4.2 ± 3.6% in 2014, 3.4 ± 11% in 2015, 3.6 ± 4.3% in 2016, and 4.3 ± 5.3% in 2017).
Grower interview data revealed that 92 ± 3 SD% of growers claimed to have implemented the advice received from plant doctors. About 7 ± 2% of growers partly implemented the advice, and 1 ± 1% did not follow the advice.
This is also reflected when analysing which of the different advised IPM options were most frequently implemented (Figure 3C). On average, 67% ± 2.4% of the implementing growers claimed to have fully implemented all the different recommended IPM measures. Growers claimed to have followed some of the advised preventive measure, pest monitoring, cultural control, or chemical control in more than 90% of cases, with the exception that biological control advice was only followed in 79 ± 27% of cases. The ultimately implemented pest management practices are extrapolated in Figure 3C.
About 80% of growers fully agreed that the implemented plant doctor advice helped manage the plant health problem; 17% partially agreed, 1% were uncertain, and less than 2% thought the advice did not help. Overall, 85% of growers also agreed that the advice helped to avoid yield loss, and 12% partly agreed. As a result of the Plantwise interventions presented in this study, growers claim to have prevented 51 ± 32% of the anticipated yield loss through implementing advice (min 0, max 100%).

4. Discussion

Using the example of plant clinics in China, our study provides insights on how advice by agricultural extension services can improve over time. For example, advice by plant doctors for biological control increased by 40 percentage points in three studied provinces of China from less than 2% in 2013 to 42% in 2017. Additionally, recommendations for pest monitoring (+8%) and cultural control (+11%) increased within these five years, indicating that a wider and more integrated pest management approach [15] is targeted and advised on by plant doctors. However, it needs to be noted that the observed recommendations may reflect only a segment of all pest management practices as growers may be visiting the plant clinics when an unfamiliar problem emerges rather than for the most common, regularly encountered pest problems. Moreover, prescription form data only allow an analysis on what is recommended as a set of IPM measures, and grower interviews on how much may have been implemented. However, it was not possible to extract how certain combinations of plant protection measures may have been applied in an integrated way. Nevertheless, the data collection of plant clinics within Plantwise has, as in many other cases and studies, proven a powerful research tool.
Through examining the here-presented plant clinic data, we were able to reveal, as it had been hypothesized, changes in advice quality of agricultural extensionists over time. Although we were not able to analyse the key reasons behind those changes, they may, on one hand, be a result of the Plantwise interventions such as training [10] improved information tools [12,26] and guidelines [16], or on the other hand, a result of new agri-policies on pesticide reduction released during the course of this study. These included China’s “Green Pest Control” agri-policy from 2006 with an update in 2011 [22,27], the Professional Unified Control Program from 2010 [28], and the Pesticide and Fertilizer Zero Growth Action Plan from 2015 to 2020 [29]. Subsequently, local governments initiated subsidy programs for nonchemical or least toxic and least residual chemical pest control, often favoring biological control [30]. It was beyond the scope of our study to mine recommendation texts in the large amount of data for the specific types of advised biocontrol agents. However, [14] suggested that in 2018 about half of the advised nonchemical agents were biopesticides, one-third macrobial biocontrol agents, about 10% pollinators, and the rest were plant protection tools such as traps. Within the Plantwise networks of plant clinics, these programs have existed since 2014, but were only connected to plant doctors’ prescription forms in the Beijing area by mid-2017. This may explain the further large increase of biocontrol advice in 2017 (Figure 1). Additionally, in some other Plantwise countries (Kenya, India), particularly biological control is advised through the plant clinic networks [31], although its level of uptake by growers is uncertain.
Adoption of agricultural technology and policies is influenced by many factors, among these the type and quality of communication between the extension worker and the growers and how the messages are understood and perceived [32]. In China, our data surprisingly show that growers seem to largely follow plant doctors’ advice and to implement most of the recommended measures (>90% as confirmed by grower interviews). Despite the fact that biological control advice was slightly less followed (79%) than other control measures (likely due to occasional availability problems), biocontrol advice was implemented at relatively high rates, indicating that agricultural advisory services connected agri-policies can make a difference. In addition, growers claim to have prevented 51 ± 32% of the anticipated yield loss through implementing advice. This is a relatively high percentage but possible due to the large proportion of disease-stroke vegetables and berries in the here-considered study areas. The findings above indicate that changes in plant doctors’ advice may also result in a change in pest management practices and subsequently in yield gains. Considering the secondary reach of such advice to growers, impacts may be even higher. [33] for example showed that plant clinic attendees share plant health information with an average of 10 other growers in China, compared to only 3.8 growers in Zambia.
Moreover, quality monitoring teams of plant protection experts confirmed that plant health problem diagnosis by plant doctors is largely plausible and pest management advice valid. This confirms a generally high quality of advice by agricultural extension services as already suggested by previous analyses of [3] and [14]. Only the management of viral plant health problems was occasionally wrongly advised on, that is, through fungicides. Otherwise, advice quality appears high, which is encouraging and calls for larger plant clinic networks. Such a proposed enlargement in services is, however, in contrast to a trend seen in many world regions, where governmental frontline agricultural extension services are scaled down or even ceased, as for example in many European countries [34]. Sometimes, these services are replaced by private sector advisory services, but in many cases growers themselves must become the ultimate experts in pest diagnosis, monitoring, and management. In these cases, it might be difficult to influence agricultural practices of the growers.
Despite the observed encouraging changes, the reliance on advice of synthetic pesticides (66%) by plant doctors remains significant. Although we were not able to analyse the frequency of pesticide use per pest problem, our data suggest that their use by growers remains high and did not change much with time (Figure 1). This tendency is also known from other agricultural regions in the world [1,35]. As for China, the most advised pesticides were fungicides and insecticides. Positively, nematicides, that are often highly toxic fumigants, were rarely advised (0.3%). Moreover, already rare advice of problematic plant protection agents listed in the Montreal Protocol, Stockholm or Rotterdam convention, or as highly toxic under WHO’s toxicity classification were nearly phased out, going from 1.9% in 2013 to 0.2% in 2017. Additionally, advice of antibiotics remained rare (3%), although they are one of the permitted and even promoted types of biopesticides according to Chinese agri-policies. Nevertheless, we considered them as problematic in our study because increased exposure to antibiotics raises the risk of potential resistance development of human pathogens [36]. This is particularly crucial in plant protection as antibiotic residues on fruits and vegetables lead to a low dose scenario, which is particularly prone to resistance development [37].
Despite the here-documented low proportion of advice of problematic plant protection agents, the general reliance on synthetic pesticides may pose risks to consumers. This is why a number of food scandals attributed to pesticide misuse have shaken China in recent years [3] but are also known from other world regions [1]. As a result, consumers and governments became highly sensitive in the area of food safety, particularly in China [38]. It remains unclear to what extent agricultural extension services, legislation [39], or grower decisions may have contributed to such risks. However, changes in agri-policies as well as improvements in extension worker skills may, as shown in our study through improvements in IPM-conforming advice, at least partly contribute to safer food and a more sustainable agriculture [32,40].

5. Conclusions

Our data showed that agricultural extension services are indeed capable of picking up novel policies and technologies and advising growers accordingly. This also means that pest management advice can improve over time with changing agricultural policies and with skill improvements of the extensionists. Interestingly, growers seem to take up such advice. In conclusion, we believe that governmental agricultural extension services can help changing agricultural practices towards more sustainable farming and may subsequently improve food safety. This suggests that, at least for countries where agriculture contributes significantly to the gross domestic product, investment in large networks of frontline governmental agricultural extension services may be more warranted than reducing or phasing out such services.

Author Contributions

S.T., T.Z., B.W., Y.Q., R.G. and M.W. jointly designed the study. T.Z., B.W., Y.Q., H.P., H.L. and X.W. implemented the study locally in Beijing, Guangxi, and Sichuan provinces of China. R.G., Y.Z. and H.J. prepared the statistical analysis and result visualization. S.T. and M.W. wrote most of the manuscript with support from and agreement of all co-authors. All authors have read and agreed to the published version of the manuscript.

Funding

This study was supported by the Beijing Agricultural Bureau of the Municipality Government through the Beijing Plant Protection Station Project “Science-based plant protection service innovations and capacity building”. Plantwise China is supported by contributions from the provincial and local governments of China, the Ministry of Agriculture and Rural Affairs, China, and Plantwise global. CABI and its partners are grateful for the major funding support for Plantwise from core and lead donors (respective tax payers) including the European Commission, Department for International Development (DFID), UK, the Swiss Agency for Development and Cooperation (SDC), the Directorate-General for International Cooperation (DGIS), Netherlands, Irish Aid International Fund for Agricultural Development, and the Australian Centre for International Agricultural Research.

Acknowledgments

For their hard work in providing diagnostic and advice services to growers and for electronically capturing the huge amount of prescription form data linked to these services, we would like to thank all plant doctors and plant clinic supervisors in China. We would like to thank enumerators from the Agricultural Information Institute of the Chinese Academy of Agricultural Sciences (CAAS) for help with the grower interviews. We are also grateful to the global monitoring and evaluation team of Plantwise for comments on this study and the manuscript.

Conflicts of Interest

No conflict of interest was reported by the authors.

Data Availability Statement

The owners of the information from a single prescription form are the extension worker, his/her supervisors, and the grower. The owners of the local data sets are the local agricultural extension service organizations, in this case the Beijing, Guangxi, and Sichuan Plant Protection Stations. Upon implementing organizations (data set owners) providing consent for data analysis, personal information of plant doctors and growers as well as spatial data of agricultural pests were blinded. The data that support the findings of this study are not publicly available due to privacy restrictions as well as due to phytosanitary implications [23].

Ethical Approval and Informed Consent

Personal information of the studied plant doctors and growers as well as plant clinics’ precise geographic location have been deleted prior to analysis, and no such information is presented in the manuscript

References

  1. Krautter, M.; Niemann, E.; Greenpeace. Pesticides in Fruits and Vegetables (Pestizide in Obst und Gemüse); Greenpeace: Hamburg, Germany, 2003. [Google Scholar]
  2. Ngowi, A.V.F.; Mbise, T.J.; Ijani, A.S.M.; London, L.; Ajayi, O.C. Smallholder vegetable growers in Northern Tanzania: Pesticides use practices, perceptions, cost and health effects. Crop Prot. 2007, 26, 1617–1624. [Google Scholar] [CrossRef] [PubMed] [Green Version]
  3. Zhang, T.; Toepfer, S.; Wang, B.; Peng, H.; Luo, H.; Wan, X.; Wan, M. Is business linkage affecting agricultural advisory services? Int. J. Agric. Ext. 2017, 5, 59–77. [Google Scholar]
  4. Vincenzo, V.; Bonsignore, C.P. Implementation of IPM in Citriculture. In Integrated Control of Citrus Pest in the Mediterranean Region; Vacante, V., Gerson, U., Eds.; Bentham Science Publishers: Dubai, UAE, 2019; pp. 28–55. [Google Scholar]
  5. Musebe, R.; Massawe, A.; Mansuet, T.; Kimani, M.; Kuhlmann, U.; Toepfer, S. Achieving rational pesticide use in outdoor tomato production through grower training and implementation of a technical guideline. J. Agric. Ext. Rural Dev. 2014, 6, 367–381. [Google Scholar]
  6. GFRAS. World Wide Extension Study. Global Forum for Rural Advisory Services. 2020. Available online: https://www.g-fras.org/en/world-wide-extension-study.html (accessed on 7 May 2020).
  7. Rivera, W.M.; Blum, M.; Sulaiman, R.V. Agricultural Extension in Transition Worldwide: Policies and Strategies for Reform; FAO: Rome, Italy, 2009. [Google Scholar]
  8. Mur, R.; Williams, F.; Danielsen, S.; Audet-Bélanger, G.; Mulema, J. Listening to the Silent Patient: Uganda’s Journey towards Institutionalizing Inclusive Plant Health Services; CABI: Wallingford, UK, 2015; p. 223. [Google Scholar]
  9. Boa, E. Going public: Extension in markets. Rural Dev. News 2005, 2, 1. [Google Scholar]
  10. Romney, D.; Day, R.; Faheem, M.; Finegold, C.; LaMontagne-Godwin, J. Plantwise: Putting innovation systems principles into practice. Agric. Dev. 2013, 18, 27–31. [Google Scholar]
  11. Finegold, C.; Oronje, M.; Leach, M.C.; Karanja, T.; Chege, F.; Hobbs, S.L.A. Plantwise Knowledge Bank: Building sustainable data and information processes to support plant clinics in Kenya. Agric. Inf. Worldw. 2013, 6, 96–101. [Google Scholar]
  12. Leach, M.; Hobbs, J.L.A. Plantwise knowledge bank: Delivering plant health information to developing country users. Learn. Publ. 2013, 26, 180–185. [Google Scholar]
  13. MoA. Announcement of MoA: No. 199, No. 322, No.1586, No. 2031, and No. 2445. Institute for the Control of Agrochemicals, Ministry of Agriculture (ICAMA). 2016. Available online: http://www.chinapesticide.gov.cn/fgzcwj/index.jhtml (accessed on 16 October 2016). (In Chinese)
  14. Wan, M.; Gu, R.; Zhang, T.; Zhang, Y.; Ji, H.; Wang, B.; Qiao, Y.; Toepfer, S. Conflicts of interests when connecting agricultural advisory services with agri-input businesses. Agriculture 2019, 9, 218. [Google Scholar] [CrossRef] [Green Version]
  15. Boller, E.F.; Avilla, J.; Jorg, E.; Malavolta, C.; Wijnands, F.; Esbjerg, P. Integrated Production: Principles and Technical Guidelines; IOBC-WPRS Bulletin: Zurich, Switzerland, 2004; Volume 27. [Google Scholar]
  16. Plantwise. Plantwise Pesticide Red List. International Pesticide Restrictions Compiled by Plantwise. 2019. Available online: https://www.plantwise.org/pesticide-restrictions/ (accessed on 5 November 2019).
  17. Bharati, K.P.; Muir-Leresche, K.; Hainsworth, S.D. The Green Book: A Guide to Effective Graduate Research in African Agriculture, Environment, and Rural Development; The African Crop Science Society: Kampala, Uganda, 2004. [Google Scholar]
  18. WHO. WHO Recommended Classification of Pesticides by Hazard; International Program on Chemical Safety; World Health Organization: Geneva, Switzerland, 2009; Volume II. [Google Scholar]
  19. House, S. Stockholm Convention Homepage. 2017. Available online: http://chm.pops.int/ (accessed on 17 October 2019).
  20. Montreal Protocol. Montreal Protocol on Substances that Deplete the Ozone Layer. 2008. Available online: https://unep.ch/ozone/pdf/Montreal-Protocol2000.pdf (accessed on 17 October 2019).
  21. UNEP; FAO. Rotterdam Convention: Country Profiles. 2017. Available online: http://www.pic.int/Countries/CountryProfiles/tabid/1087/language/en-US/Default.aspx (accessed on 17 October 2019).
  22. MoA. Pesticide Registration Database at China Pesticide Information Network Ministry of Agriculture of China. 2015. Available online: http://www.chinapesticide.gov.cn/hysj/index.jhtml (accessed on 8 July 2016). (In Chinese)
  23. The State Council of PR China. The Regulations on the Prevention and Control of Crop Diseases and Insect Pests 2020. Available online: http://www.gov.cn/zhengce/content/2020-04/02/content_5498241.htm (accessed on 15 May 2020). (In Chinese)
  24. Kinnear, P.R.; Gray, C.D. SPSS for Windows Made Simple; Psychology Press Ltd.: East Sussex, UK, 2000. [Google Scholar]
  25. Benjamini, Y.; Hochberg, Y. Controlling the false discovery rate: A practical and powerful approach to multiple testing. J. R. Stat. Soc. 1995, 57, 289–300. [Google Scholar] [CrossRef]
  26. Taylor, P. Plantwise Diagnostic Field Guide: A Tool to Diagnose Crop Problems and Make Recommendations for Their Management; CABI: Wallingford, UK, 2015. [Google Scholar]
  27. MoA. Instruction of General Office of MoA on Facilitating Green Control of Crop Pests. Ministry of Agriculture of China (MoA). 2011. Available online: http://www.moa.gov.cn/zwllm/tzgg/tz/201105/t20110523_1996135.htm (accessed on 8 July 2016). (In Chinese)
  28. MoA. MoA Facilitates Professional Unified Control of Crop Pests in All Over the Country via “Hundred-Thousand-Ten Thousand Action Plan” Ministry of Agriculture of China. 2010. Available online: http://www.moa.gov.cn/zwllm/zwdt/201004/t20100408_1463428.htm (accessed on 16 October 2016). (In Chinese)
  29. MoA. Pesticide and Fertilizer Zero Growth Action Plan 2015–2020. Ministry of Agricultural of China (MoA). 2015. Available online: http://www.moa.gov.cn/zwllm/tzgg/tz/201503/t20150318_4444765.htm (accessed on 8 July 2016). (In Chinese)
  30. Wei, X.; Zhao, L.; Qiao, Y.; Wang, B.; Wan, M.; Toepfer, S. Implementing Agripolicies on Pesticide Reduction through Subsidies and Plant Clinics in China; CABI: Wallingford, UK, 2019; Volume 13, p. 25. [Google Scholar] [CrossRef]
  31. Dougoud, J.; Cock, M.J.W.; Edgington, S.; Kuhlmann, U. A baseline study using Plantwise information to assess the contribution of extension services to the uptake of augmentative biological control in selected low- to lower-middle-income countries. BioControl 2018, 63, 117–132. [Google Scholar] [CrossRef]
  32. Ochilo, W.N.; Otipa, M.; Oronje, M.; Chege, F.; Lingeera, E.K.; Lusenaka, E.; Okonjo, E.O. Pest management practices prescribed by frontline extension workers in the smallholder agricultural subsector of Kenya. J. Integr. Pest Manag. 2018, 9. [Google Scholar] [CrossRef] [Green Version]
  33. Danielson, S.; Mur, R.; Kleijn, W.; Wan, M.; Zhang, Y.; Phiri, N.; Chulu, B.; Zhang, T.; Posthumus, H. Assessing information sharing from plant clinics through social network analysis in Zambia and China. J. Agric. Educ. Ext. 2020, 26, 269–289. [Google Scholar] [CrossRef]
  34. Szekely, E. Characteristics of the Hungarian agricultural extension insititutions: A magyarországi mezőgazdaságiszaktanácsadás intézményi jellemzői. Gazdálkodás 2011, 55, 502–511. (In Hungarian) [Google Scholar]
  35. FAO; WHO. The International Code of Conduct on Pesticide Management: Guidance on Pest and Pesticide Management Policy Development; Food and Agriculture Organization of the United Nations: Rome, Italy, 2010. [Google Scholar]
  36. Taylor, P.; Reeder, R. Antibiotic Use on Crops in Low and Middle-Income Countries Based on Recommendations Made by Agricultural Advisors; CABI Agriculture and Bioscience: Wallingford, UK, 2020; Volume 1. [Google Scholar]
  37. Kada, A.; Subbiah, J.; Ahsan, C.R.; Bari, L.; Mai, D.S.; Suong, N.K. Proceedings of the 2nd AFSSA Conference on Food Safety and Food Security, Dong Nai, Vietnam, 15–18 August 2014. In Proceedings of the 2nd AFSSA Conference on Food Safety and Food Security, Dong Nai, Vietnam, 15–18 August 2014; Asian Food Safety and Security Association: Dhaka, Bangladesh, 2014; p. 176. [Google Scholar]
  38. Luo, C. Analysis of influencing factors on customers’ willingness to pay for food safety. China Rural Surv. 2016, 6, 22–34. (In Chinese) [Google Scholar]
  39. Vapnek, J.; Pagotto, I.; Kwoka, M. Designing National Pesticide Legislation; FAO Legislative Study, 1014-6679; Food and Agriculture Organization of the United Nations: Rome, Italy, 2007. [Google Scholar]
  40. Johnson, E.; Abraham, P.; Boa, E. Plantwise: A global plant health alliance. In Proceedings of the Caribbean Food Crops Society, 46th Annual Meeting T-Star Invasive Symposium, Boca Chica, Dominican Republic, 11–17 July 2010; pp. 210–215. [Google Scholar]
Figure 1. Temporal changes of recommendations by agricultural extension workers (plant doctors) to growers on managing plant health problems in Beijing, Sichuan, and Guangxi provinces of China. Tick box data on prescription forms analysed. Data nested per plant doctor and clinic session. Only plant doctors considered that issued more than 10 forms per year; averages and standard errors of mean shown. * indicates a significant effect of years using unifactorial GLM at p < 0.05.
Sustainability 12 06767 g001
Figure 2. Trends in recommendations provided by agricultural extension workers (plant doctors) to growers in Beijing, Sichuan, and Guangxi provinces of China. Tick box data on prescription forms analysed. Only plant health problems with more than 100 queries per year analysed; therefore phytoplasma, nematodes, and weeds were excluded. Virus management may include vector management. Biofertilizers with fungicidal or insecticidal effects were included. Temporal changes presented according to unifactorial GLM at p < 0.05.
Sustainability 12 06767 g002
Figure 3. Comparing pest management recommendations provided by agricultural extension workers to growers (A) via written prescriptions forms or (B) written and orally and (C) being implemented by growers (C) in plant clinics in Beijing area in China in 2016. (A) = prescription form tick-box data, (B,C) = grower interview data. (C) shows the rate of implementation of advice of (B) according to grower statements. Different letters on bars indicate differences according fdr-corrected comparisons using chi square likelihood ratios at p < 0.05; data nested per plant doctor and clinic session; error bars = SEM.
Sustainability 12 06767 g003
Table 1. Outreach of advisory services of plant clinics as part of the Plantwise program in China. Different growers reached, i.e., multiple visits by a grower to a clinic excluded. Queries = prescription forms issued by plant doctors on diagnosis and management of a plant health problem. Crop area reached = area of the problem crop consulted in the plant clinic and not the total farm area. Data nested per plant clinic and year.
Plant Clinics *Different GrowersGrower QueriesCrop Area Reached (ha) **
BeijingGuangxiSichuanTotal/ClinicTotalCumulative over Years/ClinicTotalCumulative over Years/ClinicTotalCumulative overs Years
201223-51286586581467487482.81414
2013745169413712029142232930774.06478
201423463311932725301204815211,22914.2469547
20152446341073834913521712,27623,50527.39291476
2016284537117330712,44223213,40036,90521.27862262
201746435398126713,70916110,99947,9048.34142676
Cumulative464653 13,709 47,904 *** 2676
Mean ± SD 107 ± 112285 ± 1337 191 ± 387984 ± 5314 15 ± 9.5446 ± 370
* active clinics only, i.e., at least 10 prescription forms per year ** 1 ha = 15 mu, which is a common east Asian area unit *** 47,156 analysed.
Table 2. Top ten crops and plant health problems brought by growers to agricultural extension workers (plant doctors) in plant clinics in Beijing, Guangxi, and Sichuan provinces in China between 2013 and 2017. Data extracted from prescription forms (#) issued by plant doctors to the growers. Data nested per plant clinic and year.
BeijingGuangxiSichuan
Crops#%Pests#%Crops#%Pests#%Crops#%Pests#%
Strawberry606714Downy mildews538313Grape151946Downy mildews3089Citrus63930Mites33816
Tomato588614Powdery mildews512812Rice36911Anthracnose1926Rice40119Aphids1557
Cucumber509712Aphids26976Citrus34610Powdery mildews1715Rape1507Anthracnose1276
Chinese cabbage27036Botrytis grey mold25576Maize2317Botrytis grey mold1394Mandarine1467Sheath blights824
Romaine lettuce26256Pieris spp.25236Chili1906Brown spot disease 11063Soybean824Weeds824
Eggplant21935Mites21325Mandarine702Mites883Maize814Stem borers593
Chili16864Viruses19985Strawberry702Rusts792Grape754Rice blast543
Watermelon13623Thrips13853Baby pakchoi562Alternaria grape bunch rot 602Kiwifruit1005Downy mildew442
Celery11543Whitefly12933Cucumber502Grape black rot (die back)562Wheat422Thrips422
Pepper10713Anthracnose11153Pear451Rice blast522Chili392Viruses372
Others17,95842Others22,13452Others59318Others232170Others62529Others129060
1 Pseudocercospora and Cercospora brown spot diseases.
Table 3. Temporal changes in quality of diagnosis and in recommendations for pest management made by agricultural extension workers (plant doctors) in plant clinics in Beijing, Guangxi, and Sichuan in China. Bold indicates differences between years or provinces according to GLM at p < 0.05; n = 34,320 to 47,268 queries; data nested per plant clinic and year; averages ± SD shown.
Extension Service QualityMean201320142015201620172013–2017Years (df 4; 106)Provinces (df 2; 106)
FPFP
Diagnosis correctness * (%)98 ± 8-99 ± 198 ± 599 ± 397 ±11-0.40.8300.0008
Recommendation validity (%)97 ± 7-99 ± 199.7 ± 191 ± 1099.7 ±1+0.4%22<0.0010.70.49
Recommendation comprehensiveness with regard to IPM (%)86 ± 20-70 ± 2378 ± 3090 ± 1088 ±16+16%3.80.0131.40.25
Recommendation details (Word counts)69 ± 4737 ± 2559 ± 761 ± 3282 ± 3893 ±43+69%4.90.0010.40.67
Recommendation of red list products ** (%)0.9 ± 2.21.9 ± 2.50.9 ± 1.50.9 ± 3.40.9 ± 20.2 ± 0.7-1.30.264.80.011
Recommendation of antibiotics (%)3.1 ± 4.72.9 ± 3.33.4 ± 4.72.1 ± 2.93.5 ± 5.33.6 ± 6.1-0.40.80.170.84
* correctness = plausible diagnosis of the plant health problems consistent with symptoms ** Red list products as per Stockholm Convention, Rotterdam Convention, Montreal Protocol, WHO toxicity class 1a and 1b, [16].
Table 4. Few non-IPM compatible plant protection agents recommended to growers by agricultural extension workers (plant doctors) in Beijing, Sichuan, and Guangxi provinces of China. Red list products as per Stockholm Convention, Rotterdam Convention, Montreal Protocol, WHO toxicity class 1a and 1b, [16]. Percent red list products or antibiotics on prescriptions forms averaged per plant doctor.
20132014201520162017All Years
Non-IPM-Compatible 2329815212,27613,40011,11147,268 Prescriptions
ProductsRed List Regulation **#%#%#%#%#%#%
Red list products
Beta-cyfluthrin *WHO 1b 60.04 60.01
Bromadiolone *WHO 1a 10.01 10.00
CadusafosWHO 1b10.0440.05 50.01
Captafol *WHO 1a, PIC 20.01 20.00
Carbofuran +WHO 1b, PIC70.30430.5340.03180.1330.03750.16
Chlordecone *POP 30.02 30.01
ChlordimeformPOP 20.02 20.00
Cyfluthrin *WHO 1b10.0420.0210.01 40.01
Dichlorvos (DDVP) *WHO 1b180.77200.23220.18360.27310.281270.27
Edifenphos *WHO 1b10.04 30.0340.01
MethamidophosWHO 1b, PIC 10.01 10.01 30.01
Methidathion +WHO 1b40.1720.0210.0130.02 100.02
Methomyl +WHO 1b10.04 90.07 100.02
Methyl bromide +Montreal Protocol 20.0220.00
MonocrotophosWHO 1b, PIC 20.0220.02 40.01
Nicotine *WHO 1b 70.0520.0290.02
Omethoate +WHO 1b 40.0520.0230.02 90.02
Oxydemeton-methyl *WHO 1b 20.01 20.00
ParathionWHO 1a, PIC 10.01 10.00
Triazotion (Azinphos-ethyl) *WHO 1b10.0450.0620.02 80.02
Sum and average percent ± SD 341.9 ± 2.5860.9 ± 1.5370.9 ± 3.4880.9 ± 2410.2 ± 0.72870.9 ± 2.2
Antibiotics
Kasugamycin 150.64560.69550.45340.25380.342000.42
Ningnanmycin 10.04200.2540.03270.20330.30850.18
polyoxin b 401.72821.01890.722591.932101.896831.44
Pyrimidine nucleoside antibiotics 10.01350.29490.37390.351240.26
Streptomycin 241.031461.791951.591681.251941.757271.54
Tetramycin 10.0160.0420.0290.02
Zhongshengmycin 780.96990.81850.63920.833540.75
Other antibiotics 320.39130.11 450.10
Sum and average percent ± SD 802.9 ± 3.34153.4 ± 4.74912.1 ± 2.96283.5 ± 5.36083.6 ± 6.122273.1 ± 4.7
* Not yet totally banned in China by the end of 2018 [13,22]. + Not yet totally banned in China but heavily restricted use in special cases in some crops by the end of 2018 [13]. ** Red list products are internationally restricted products as per Stockholm Convention (POP), Rotterdam Convention (PIC), Montreal Protocol, WHO toxicity class 1a, 1b [16].

