Article

Spatiotemporal Variations of Water Stable Isotope Compositions in Nujiang Headwaters, Qinghai-Tibetan Plateau

1
Institute of Environment and Sustainable Development in Agriculture, Chinese Academy of Agricultural Sciences, Beijing 100081, China
2
College of Territorial Resources and Tourism, Anhui Normal University, Wuhu 241000, China
3
College of Life Sciences, Capital Normal University, Beijing 100048, China
*
Author to whom correspondence should be addressed.
Sustainability 2020, 12(16), 6654; https://doi.org/10.3390/su12166654
Submission received: 30 June 2020 / Revised: 6 August 2020 / Accepted: 11 August 2020 / Published: 18 August 2020

Abstract

:
The variations of the stable isotope compositions in water provide critical information on hydroclimatic mechanisms. The climatological and hydrological processes in the Nujiang headwaters in the central Qinghai–Tibetan Plateau are extremely complex and are controlled by alternating continental/local recycled and maritime moisture. However, previous studies have only derived limited data from different types of water in the Nujiang headwaters. Therefore, aiming to understand the sources of stable oxygen (δ18O) and hydrogen (δ2H) isotopes’ compositional variability and how these are related to hydroclimatic processes, we measured δ18O and δ2H values from surface waters, snow and precipitation across the Nujiang headwaters from April to September 2018. We found higher δ18O (−13.7‰), δ2H (−101.8‰) and deuterium excess (d-excess; 7.6‰) values in the non-monsoon season and lower values in the summer monsoon season. Our findings indicated that the δ18O and δ2H compositions were significantly affected by different moisture sources in this region. The slope (6.66) and intercept (−14.90) of the surface water line (SWL: δ2H = 6.66 δ18O − 14.90, R2 = 0.98) were lower than those of the local meteoric water line (LMWL: δ2H = 9.50 δ18O + 41.80, R2 = 0.99) and global meteoric water line (GMWL), indicating that precipitation was the primary water vapor source for surface water, and evaporation was the dominant hydrological process for the Nujiang headwaters. In general, δ18O and δ2H tended to be negatively correlated with precipitation and air temperature. In addition, δ18O and δ2H values in the Nagqu River were inversely correlated with the intensity of discharge, highlighting a precipitation-driven isotope-discharge pattern. Our findings provide a theoretical basis for the hydroclimatic mechanisms occurring in the Nujiang headwaters and further augment our understanding of the southern–middle–northern hydroclimate in the Qinghai–Tibetan Plateau.

1. Introduction

The Qinghai–Tibetan Plateau, known as the “Asian water tower“ in the Himalayas region, is the headwater source for the major Asian rivers (e.g., the Yangtze, Yellow, Yarlung Zangbo and Nujiang) [1,2,3]. The hydrology of the plateau has been adversely affected by rapid warming periods and other anthropogenic activities [1,4]. These alterations have induced local climatological, hydrological and ecosystem changes in the headwater region [1,5,6,7,8]. For instance, the glacier coverage in this region has undergone a massive reduction, which caused increased precipitation and lake areas and higher river runoff [2,6,9]. Therefore, this region has been a research hot spot due to its unique geographic location and huge water circulation [1,10,11]. However, due to lack of interest and knowledge, the mechanisms of these climatological and hydrological changes remain unclear, particularly for the Nujiang catchment located in the core area of the plateau.
Hydrograph separation employing stable isotopes has been one of the effective methods used in hydrographic cycle studies. Precipitation, ground snow, glacial meltwater and groundwater can be differentiated because of their unique profiles of stable isotopes [12]. The relative contributions of different components of runoff during rainfall or snowmelt events can be identified to evaluate streamflow generation mechanisms [8,12]. Recently, stable oxygen (δ18O) and hydrogen (δ2H) isotope compositions have been widely used in watershed biogeochemical processes [12,13,14,15], particularly in terms of revealing moisture sources and tracing climatological and hydrological processes [8,16,17,18]. In particular, deuterium excess (d-excess), as the second-order index of δ18O and δ2H, is a diagnostic tool that can trace water vapor sources in the atmosphere to a specific location [19,20]. Numerous isotopic investigations in the Qinghai–Tibetan Plateau have mainly focused on precipitation mechanisms; for example, isotopes have a significant “amount effect” and “altitude effect” [5,21,22,23,24,25,26]. However, these stable isotope compositional differences are also related to temperature dependence and changes when the westerlies or Indian monsoon is the sole dominant atmospheric process or when the air temperature is low enough [21,22]. In addition, recent studies have indicated that the stable isotope compositions of streams, rivers and lakes in the Yarlung Zangbo headwaters and Yamdrok Tso Basin could be used to trace and display seasonal variations [8,12,27].
The above previous studies have documented systematic variation of stable isotope compositions in precipitation in the southern Qinghai–Tibetan Plateau; however, scant information was reported specifically on the components and the generation mechanism of precipitation in the central Qinghai–Tibetan Plateau, particularly in rivers and lakes [28]. The Nujiang River is one of the largest rivers in the Qinghai–Tibetan Plateau, and its headwaters are supplied by rain, snow and glacial meltwater [29]. The moisture transport over this region is primarily controlled by the westerlies and Indian monsoons and is strikingly different from that in the northern and southern regions [22]. Owing to the notable influence of both continental air masses and monsoon precipitation on isotopic composition, the behavior of the stable isotopes in precipitation is complex. This complexity is most likely due to the lack of stable isotope composition change tracing information in the Nujiang headwaters, even though this information is immensely important in regional geology, hydrology and climatology [12].
In this study, we analyzed the δ18O and δ2H values of precipitation, snow, glacier ice, lakes and rivers, which were sampled from April to September 2018. We compared these data with meteorological and hydrological measurements, including air temperature, precipitation and river discharge. Our goal was to generate a preliminary grasp of stable isotope compositions of different waters in the region to broaden the understanding of the stable isotope composition evolution in the water cycle of the Qinghai–Tibetan Plateau.

2. Methods

2.1. Study Area

The study was conducted in the Nujiang headwaters of the Qinghai–Tibetan Plateau (Figure 1), which is one of the largest rivers (1.65 × 10³ km) on the plateau, with an average runoff of 4.96 × 10¹⁰ m3, a drainage area of 1.36 × 10⁵ km2 and an average elevation of more than 4000 m [30]. Upstream, the Nujiang River originates from the Tanggula Mountain Glacier (6000 m) and flows through the alpine meadows of the central plateau. Further downstream, the river passes through major cities such as Nagqu, Baoshan and Tengchong and finally flows into South Asia. The Ciqu and Seni Rivers comprise the primary and secondary tributaries of the main flow (Nagqu River) of the Nujiang, with lengths of 104 and 30 km, respectively. These two rivers run through Nagqu city, and water quality is strongly affected by anthropogenic activities. Cuona Lake absorbs the main river flows and is the highest (4650 m) freshwater lake in the world, covering an area of 300 km2.
Overall, most of the flow of these selected rivers and this lake originated from precipitation, glaciers, snowmelt and underground water, which were influenced by climate change [1,29]. As mentioned earlier, global warming and anthropogenic activities led to a reduction in the size of the plateau’s glaciers, which significantly increased local precipitation and river runoff [2,9,31].

2.2. Sampling and Isotopic Analysis

Water samples were collected from the Nagqu (sites 1/4/5/11), Ciqu (6/7) and Seni (8/9/10) Rivers and Cuona Lake (2/3) into 60 mL polyethylene bottles with a 60 mL syringe at a water depth of 0–30 cm. Sampling at each site was repeated thrice, and then 20 mL water samples were collected and mixed together to make a composite sample. To avoid sample leakage and evaporation, the bottles were filled completely and immediately sealed. Ice samples were collected from vertical sections of an ice body at a depth of up to 50 cm, with each sample separated by 10 cm in depth, and collected in three replicates and mixed together to make a representative sample for analysis. Collected samples were first sealed in double-layer preservation plastic bags and melted at room temperature. Then, the melted water samples were transferred to polyethylene bottles as per above. The precipitation sample collection process was similar to that of rivers and lakes, while the process of snowfall sample collection was similar to that of ice. There were 53 samples in total, including 26 samples of rivers, 8 samples of the lake, 8 samples of snow, 6 samples of precipitation and 5 samples of ice. All water samples were stored at 4 °C until analysis.
Two-milliliter water samples from the polyethylene bottles were extracted with a 2.5 mL syringe and filtered with a membrane filter with a 0.22 μm pore diameter. The filtrates were injected into a 2 mL sample bottle, and the cap was quickly screwed on. The δ18O and δ2H values of all water samples were analyzed by cavity ring-down laser spectroscopy using the Vario MICRO Cube elemental analyzer (Elementar Analysensysteme GmbH, Langenselbold). The analytical uncertainties were ±0.1‰ for δ18O and ±0.5‰ for δ2H. The reported results were relative to the standard Vienna Standard Mean Ocean Water (VSMOW), defined as
δ = (Rsample/RVSMOW −1) × 1000‰
where δ represents δ18O and δ2H and Rsample and RVSMOW represent the isotopic ratios of 18O/16O for δ18O or 2H/H for 2H of the samples and the VSMOW, respectively.
The second-order indices of δ18O and δ2H (d-excess) directly reflected the degree of imbalance between evaporation and condensation of regional precipitation, and the water vapor source was defined as
d-excess = δ2H−8 × δ18O

2.3. Environmental Variables

The meteorological and hydrological data (e.g., air temperature, precipitation and discharge) were obtained from weather and hydrometric stations in Nagqu city. At the same time and location, the water temperature and pH of the water samples were assistive measured with a calibrated portable handheld meter (Thermo Fisher Scientific, Singapore).

2.4. Statistical Analysis

All statistical analyses were performed on IBM SPSS Statistics version 19.0 (IBM, Armonk, NY, USA). Linear regression was used to determine whether there was a linear correlation between isotope composition and measured environmental variables.

3. Results

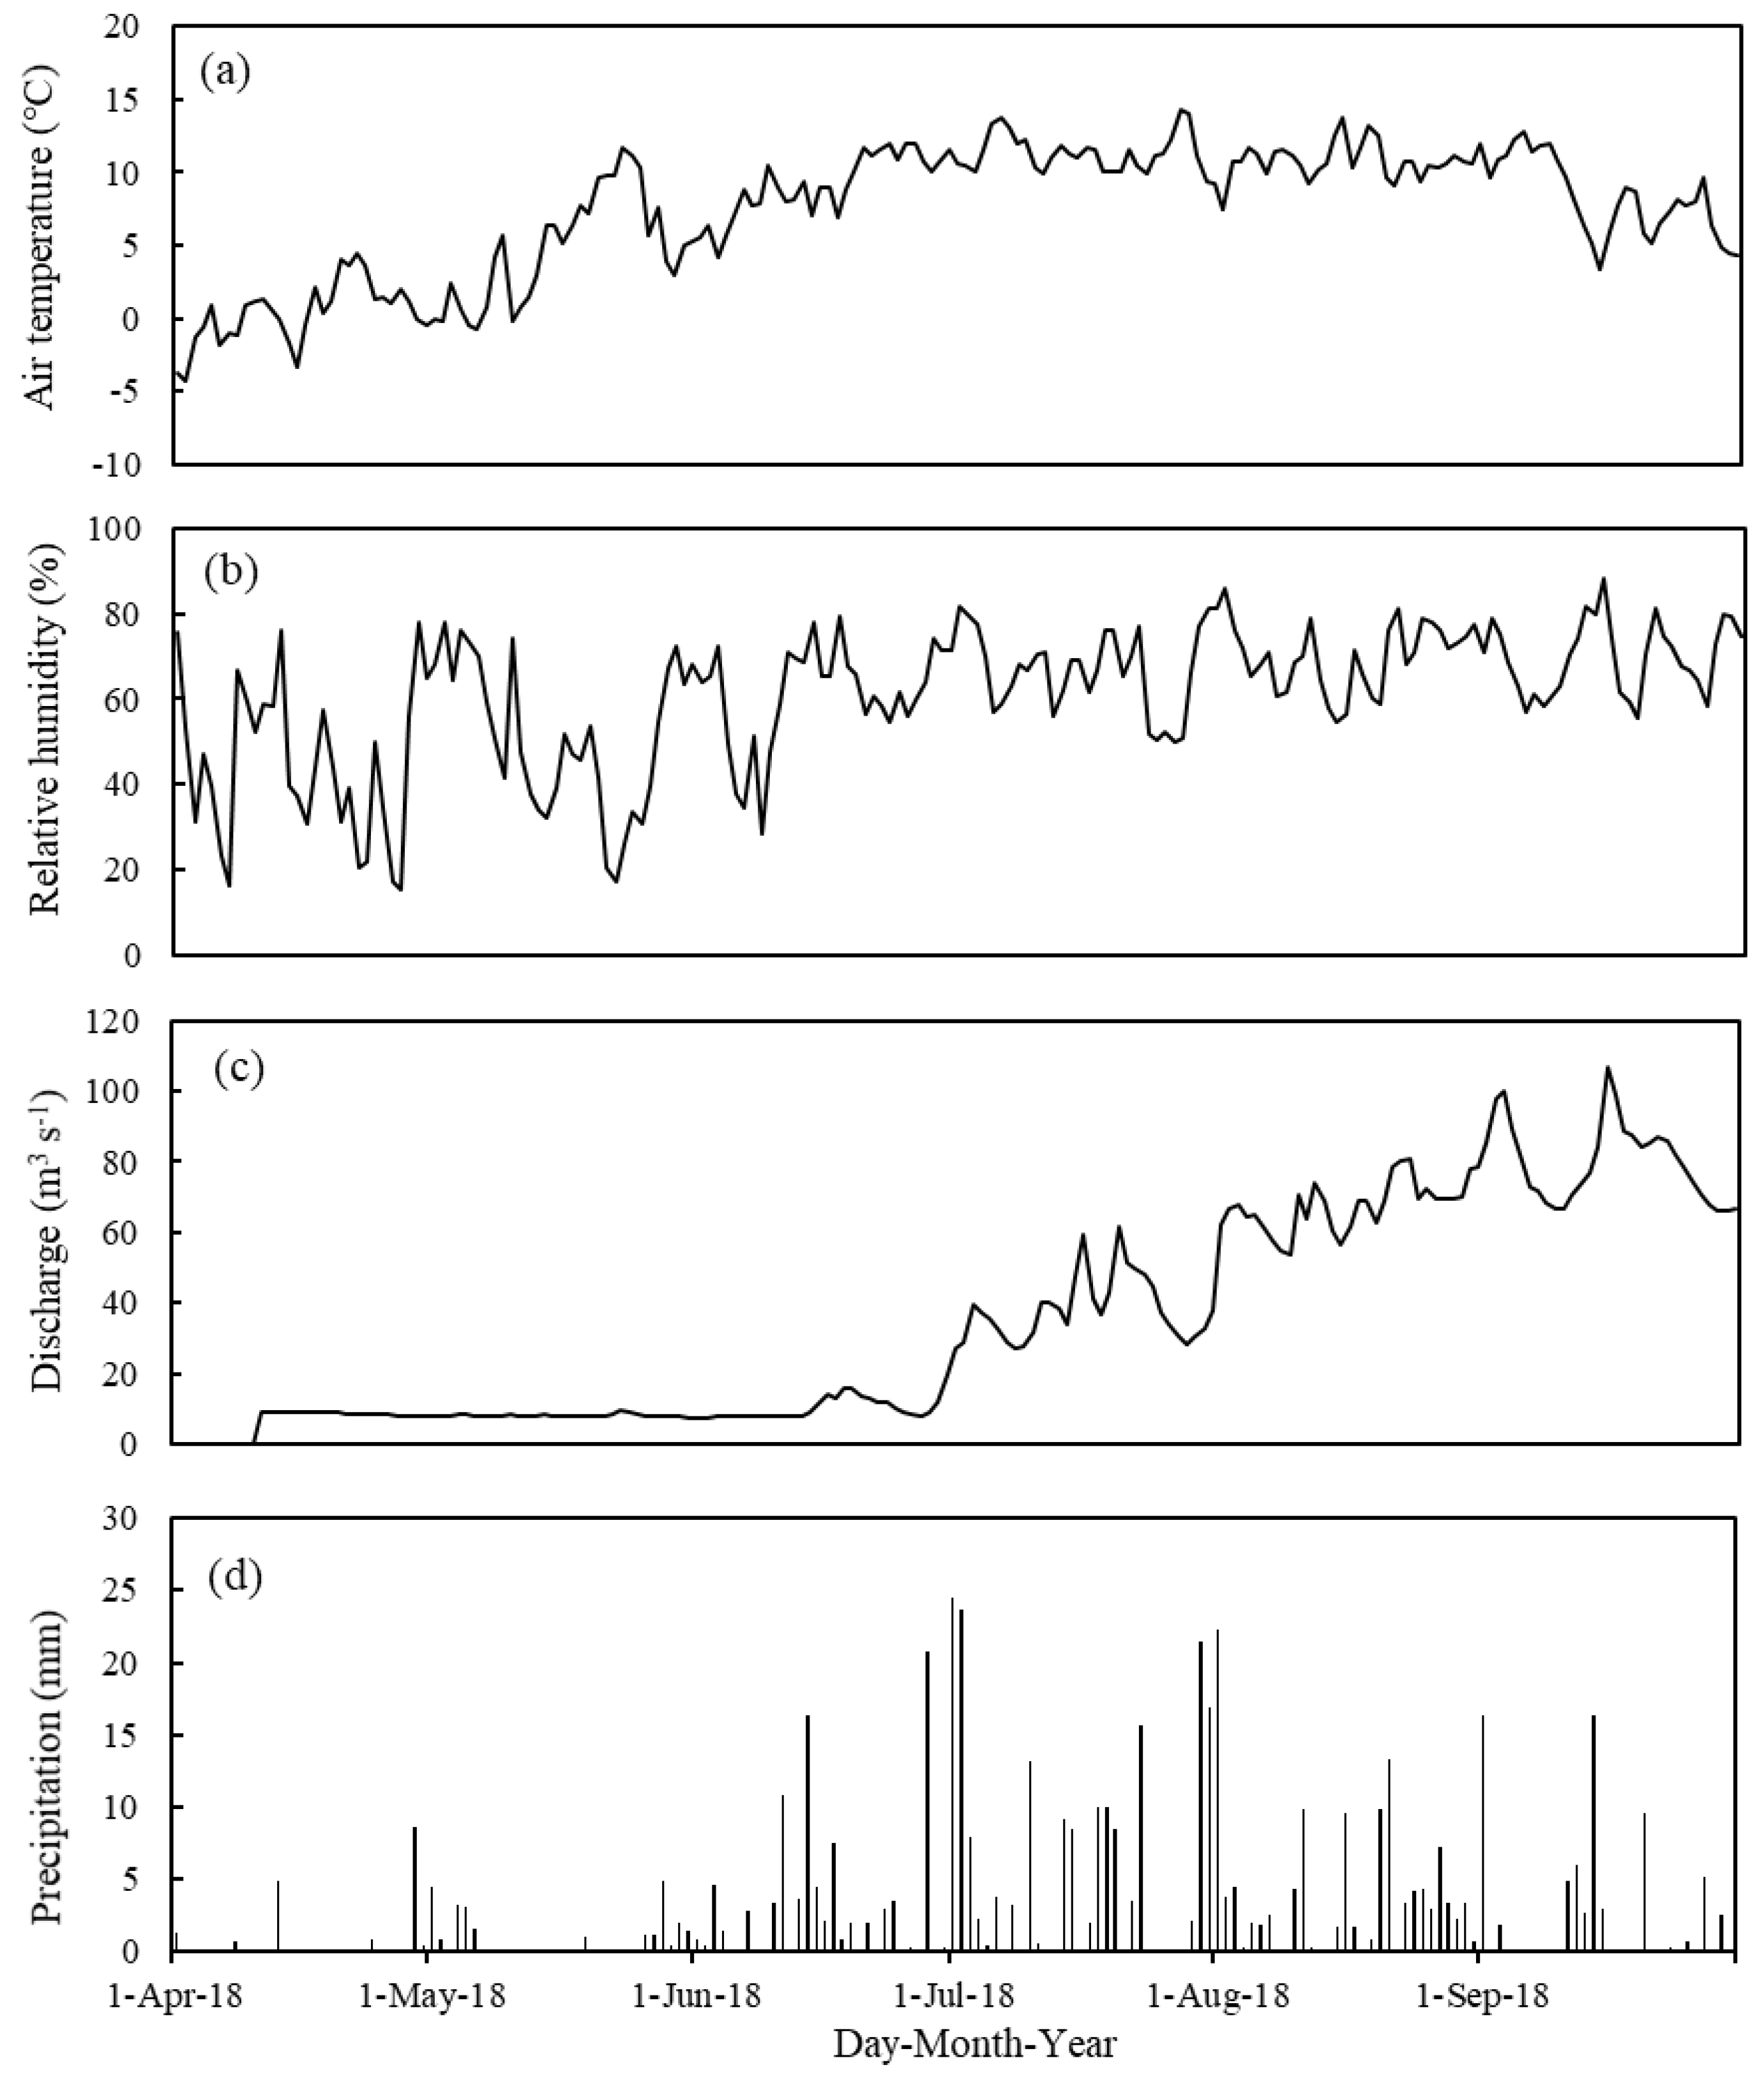
3.1. Meteorological and Hydrological Variations during the Study Period

Figure 2 illustrates the daily variations in air temperature, relative humidity, discharge and precipitation in the Nujiang headwaters from April to September 2018. The average air temperature was the highest in July (11.3 °C) and the lowest in April (0.4 °C) (Figure 2a). The relative humidity ranged from 44.69% to 69.80%, with the highest occurring in September and lowest occurring in April (Figure 2b). The discharge of the Nagqu River from July to September (average 61.94 m3 s−1) was significantly greater than that from April to June (average 8.11 m3 s−1) (Figure 2c). During the six-month study period, July (187.2 mm) and August (120.0 mm) had the most monthly precipitation, accounting for 36.7% and 23.5% of the total, respectively (Figure 2d).
The water temperatures of the Nagqu River, the Ciqu River and Cuona Lake were 5.44–15.86 °C, 8.75–12.33 °C and 10.18–20.62 °C, with averages of 11.63, 11.33 and 14.73 °C, respectively (Table 1). The pH of Cuona Lake water ranged from 8.35 to 9.17 (average 8.84) and was the highest from June to August and the lowest from April to May and in September. The pH variation of the Nagqu River was similar to that of Cuona Lake, but the pH of the Ciqu River did not vary appreciably from month to month.

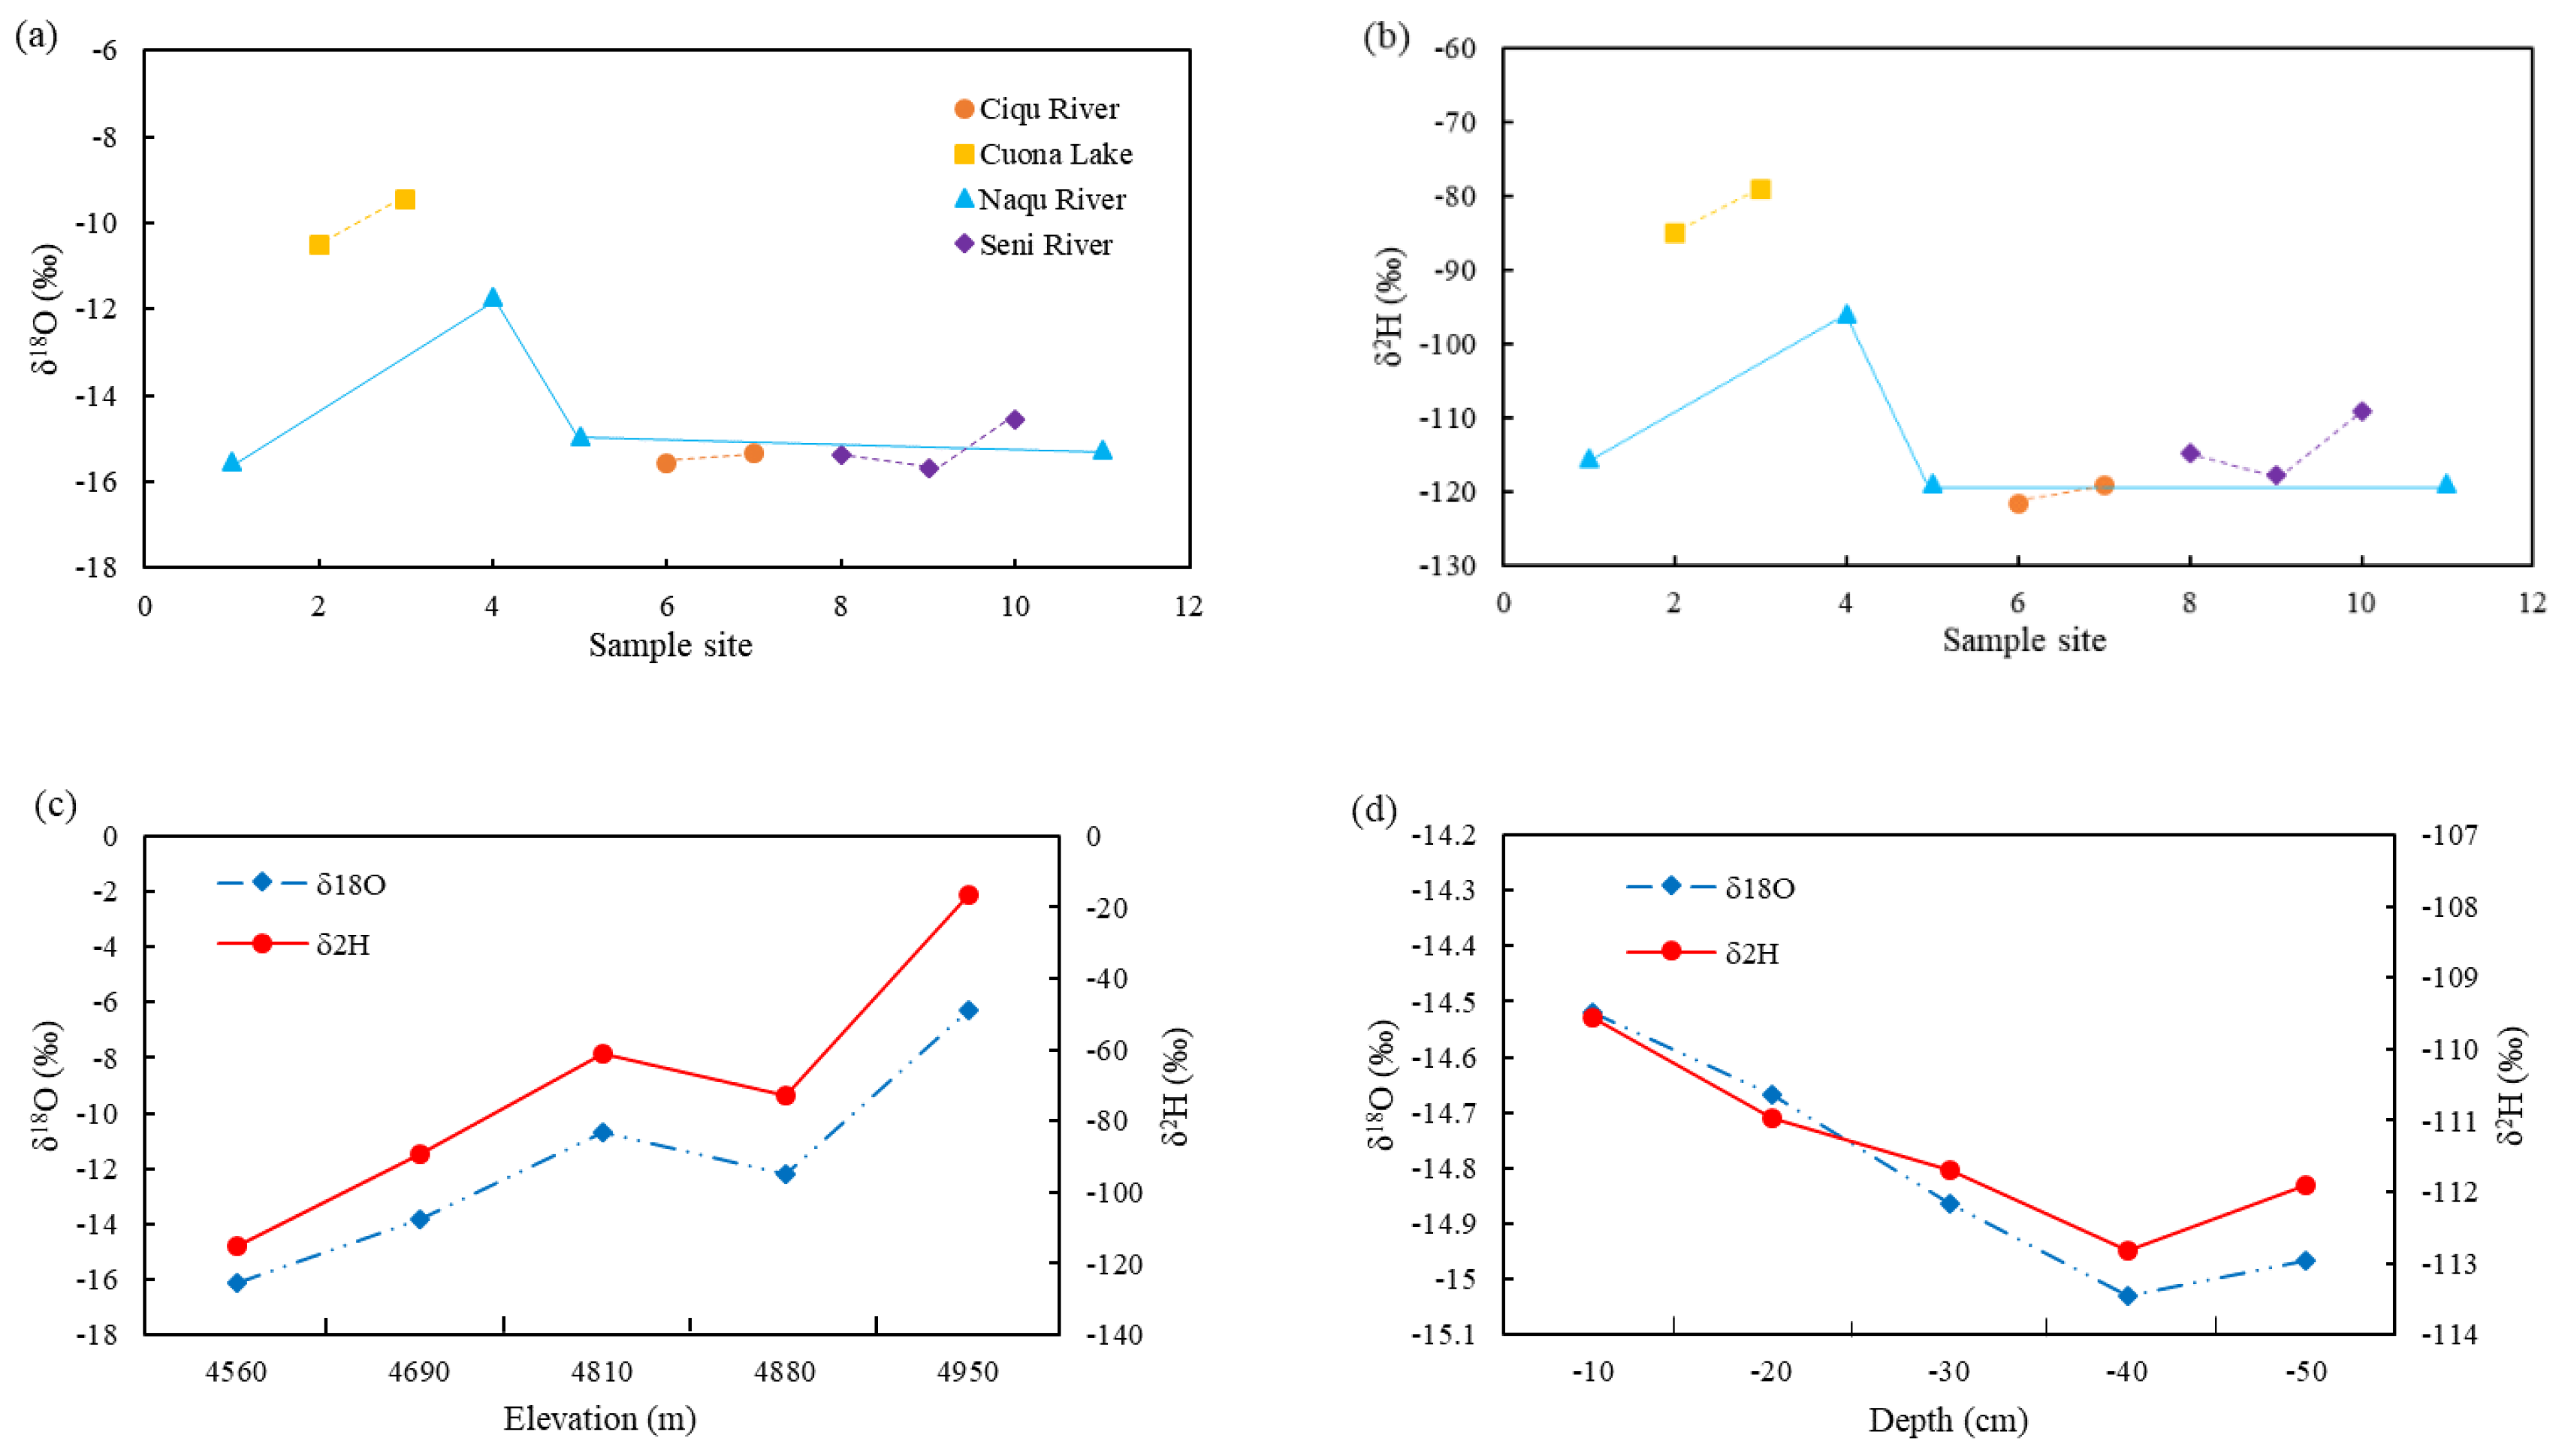
3.2. Variations of δ18O and δ2H Values

All measured δ18O and δ2H values in different waters are listed in Table 2. We examined the δ18O and δ2H values in precipitation during our study period and found clear seasonal fluctuations. These values ranged from −25.9‰ to −14.2‰ for δ18O and −201.3‰ to −99.7‰ for δ2H, respectively, with maximal values in April and minimal values in July. The Nagqu River exhibited a significant variation in isotopic values: from −14.0 ‰ to −9.1‰ for δ18O, with an average value of −11.5‰ (from −110.9‰ to −70.4‰ for δ2H, with an average value of −91.8‰, and from −4.9‰ to 2.5‰ for d-excess, with an average of −0.2‰) (Figure 3). The isotopic value variations of the Ciqu River were consistent with those of the Nagqu River. From Figure 4, during the monitoring period, there was no significant seasonal variation in the isotopic values of Cuona Lake. The δ18O and δ2H values of snow in May were significantly lower than those in April and September (Figure 3).
The isotopic values from upstream to downstream ending at Cuona Lake in the Nujiang headwaters could be clearly distinguished. The δ18O and δ2H values of Cuona Lake were significantly higher than those of the Nagqu and Ciqu Rivers. The relative values of δ18O (−11.7‰) and δ2H (−95.9‰) at Nagqu River sampling site 4 were also higher than those of all other sites. For comparison, sampling sites downstream of monitoring site 4 displayed no significant variations in isotopic values of the Nagqu and Ciqu Rivers (Figure 4a,b).
Isotopic tracers of δ18O and δ2H indicated that these values of snow were directly related to elevation (Figure 4c). By contrast, δ18O and δ2H values varied between −109.6‰ and −112.8‰ at −10 to −40 cm under the surface ice and increased slightly at −50 cm (Figure 4d).

3.3. The Relationship between δ18O and δ2H Values

Based on the stable isotope composition of precipitation, snow and surface water (ice, the lake and the rivers) in the Nujiang headwaters, we established the local meteoric water line (LMWL) and the surface water line (SWL) as δ2H = 9.50 δ18O + 41.80 (R2 = 0.99; Figure 5a) and δ2H = 6.66 δ18O−14.90 (R2 = 0.98; Figure 5b), respectively. The slope and intercept of the LMWL were higher than those of the global meteoric water line (GMWL, δ2H = 8 δ18O + 10) [32], while those of the SWLs were lower than those of the GMWL, particularly in ice.

3.4. Correlations of Isotopic Composition and Environmental Factors

Previous studies have demonstrated that δ18O and δ2H values in water were linked to air temperature, relative humidity, precipitation and river discharge, which represented the “temperature effect”, “amount effect” and “altitude effect” [8,33,34]. In general, we found that δ18O and δ2H in all waters were negatively correlated with precipitation and air temperature (Figure 6a,b,d). Meanwhile, we also found δ18O and δ2H values in the Nagqu River were inversely proportional to the intensity of discharge (Figure 6e,f).

4. Discussion

4.1. Stable Isotopic Precipitation Patterns

Seasonal variations of isotopic composition for precipitation provide records of moisture sources and transport paths of air masses [5,8,19]. During the monitoring period, we found that precipitation showed distinct changes in isotopic composition. δ18O and δ2H values were elevated in the pre- and post-monsoon seasons (April−May, September) and depressed in the monsoon season (June−August), which was directly related to precipitation (Figure 3). The high isotopic values were coincident with low precipitation, and the low values were coincident with high precipitation, suggesting that δ18O and δ2H were closely related to precipitation [24,25,35,36]. Similar results have been found for atmospheric relative humidity in the Qinghai−Tibetan Plateau [36]. These patterns revealed higher isotopic values of continental moisture in the non-monsoon season and lower values of maritime moisture in the monsoon season [22,35,37,38]. As the summer monsoon strengthened, precipitation and relative humidity increased correspondingly (111.5 and 398.1 mm and 55.12% and 65.94%, respectively) (Figure 2b,d). Long-distance precipitation transport results in relatively lower isotopic values in the Nujiang headwaters during the monsoon season, which progressively produces rainfall from the air mass during orographic lifting and adiabatic cooling [8,39,40]. From 2000 to 2003, the weighted average annual precipitation for δ18O was −16.2‰ in Nagqu [21]. In comparison, δ18O in the average precipitation in the study area was −19.3‰ (Figure 3a) and significantly reduced by 19.1%. As previously reported, the warming rate in this region was as high as 0.2 °C per decade from 1960 to 2010 [41], indicating that δ18O in precipitation was inversely correlated with air temperature. We also found a significant correlation between δ18O in precipitation and air temperature (R2 = 0.80, P < 0.05) (Figure 6c).
Precipitation generally displayed high d-excess values (17.6‰) in the non-monsoon season and low (6.3‰) values in the monsoon season (Figure 3c). These results were similar to those of the southern plateau regions of Nyalam and Lhasa [25,26,42] and the central region of Nagqu [19]. The global average of d-excess in precipitation was 10‰, and seasonal variations could provide information about moisture sources, the hydrological cycle and local climatic conditions. Lower d-excess values are indicative of marine moisture and higher values of continental and local recycled moisture [19,25,32,38,42,43,44,45]. Our results indicated that summer moisture was derived from marine moisture in the Indian Ocean, while spring and autumn moisture was dominated by continental and local recycled moisture as well as westerly transport. There were two different paths for marine moisture to reach the Nujiang headwaters. One was to move along the Brahmaputra–Yarlung Zangbo River, and the other was over the Indian Peninsula crossing the Himalaya Mountains [19,46]. In the Nujiang headwaters, precipitation d-excess ranged from 5.5‰ to 20.2‰ (average 12.0‰), which was significantly higher than that of the Himalayas and the southern plateau (0.8‰–6‰) and globally (10‰) [25,37,38,42]. Compared with other global precipitation investigations, precipitation in the Nujiang source region had a relatively higher d-excess, presumably associated with the lower local condensation temperature [47], dry atmospheric vapor and higher elevation [8]. Our investigation area was located in the core of the Qinghai−Tibetan Plateau, with an average elevation of more than 4500 m [48]. This unique geographical location let the region maintain low temperatures throughout the year and had a shorter distance between precipitation and clouds, which resulted in higher δ18O values in precipitation due to weaker evaporation [25,26].

4.2. Stable Isotopic Pattern in Snow and Ice

Although we used only one sampling site for five different depths of ice, a systematic isotopic pattern could still be observed. The stable isotope compositions of the ice varied between −112.8‰ and −109.6‰ for δ2H and −15.0‰ and −14.5‰ for δ18O from 10 to 40 cm under the surface ice and then up to 50 cm (Figure 4d). In general, the values of stable isotope compositions measured from ice were inversely correlated with the ice depth. By contrast, this pattern was not found in the northeast region (Qiyi Glacier) of the plateau, where δ18O values of ice increased with the increased depth [49]. This discrepancy was most likely associated with the new snow covering the ice surface and snowmelt flows due to rising temperatures migrating to the bottom of the snow pit along with the profile [49]. In our study, we found that the isotopic enrichment values (δ18O: −11.8‰, δ2H: −70.9‰) of snow water were significantly higher than those of ice water (δ18O: −14.8‰, δ2H: −111.4‰) (Figure 4a). Remarkably, the δ18O values of snow increased with the increasing altitude in the Nujiang headwaters (4560–4950 m; Figure 6a), which was contrary to other results (0.12‰–0.21‰/100 m) [24]. This significant difference was closely related to evaporation, melting, sublimation and recrystallization, leading to dynamic alterations in snow water isotopic compositions [12].
The average d-excess (δ2H − 8 × δ18O) in precipitation (12.0‰) and snowmelt (19.9‰) was significantly enriched over that of ice water (7.1‰) (Figure 3c), and the slope values of precipitation (9.43) and snowmelt (9.24) were significantly greater than that of ice water (5.58) (Figure 5). This suggested that the intermediate values of d-excess in ice water were indicative of mixing between precipitation and snowmelt (Ren et al., 2016, 2017). Moreover, the extremely high d-excess (22.24‰) in the snowmelt near Nujiang pointed to the predominance of continental recycled moisture as the source during the sampling period. Likewise, the high d-excess could evaluate the contribution of snowmelt to river discharge, which reflected the delayed recharge caused by spring precipitation in snow.

4.3. Stable Isotopic Patterns in Surface Water

Our sampling points only included two major tributaries (the Ciqu and Seni Rivers) and one lake (Cuona Lake), but the δ18O and δ2H values were still consistent with the stable isotopic trend of the main flow of the Nagqu River. From sampling sites 1 to 4, the δ18O and δ2H values of the main flow increased from −15.5‰ to −11.7‰ and −115.5‰ to −95.9‰ (Figure 4a,b), respectively, indicating a strong isotope enrichment, which was similar to other lakes and rivers of the Qinghai−Tibetan Plateau [12,27]. The phenomenon can be attributed to the strong evaporation processes over the open water, and the flow-through lake will preferentially leave heavy isotopes in the lake [12,27]. The isotope compositions of Cuona Lake were similar to the GMWL, and the lower slope indicated strong surface water evaporation (Figure 5b) [12]. In addition, δ18O in lake water was generally more than 10‰ higher than in other waters [27]. Accordingly, we also found that the main flow values for δ18O and δ2H downstream of site 4 declined sharply and then were similar to those of the tributaries. The Ciqu River and Seni River were the two major tributaries of the main flow, where the stable isotope composition was low and strongly affected by anthropogenic activities. Thus, the dilution caused by the input of these tributaries was clearly the leading cause for the progressive depletion of δ18O and δ2H in the main flow [12]. However, the δ18O and δ2H values of the upper Nujiang headwaters decreased and were characteristic of the downstream values, indicating the effect of elevation on precipitation isotopes and the cumulative effect of evaporation as water flows downstream [12].
We also collected discharge data from the Nagqu River throughout the monitoring period to examine the isotopic seasonal patterns in the main flow and their response to discharge variability. The discharge of the Nagqu River in the monsoon season was significantly higher than that of the non-monsoon season (Figure 2). The δ18O and δ2H values of the main flow were enriched from May to June (Figure 3), which was generally consistent with the seasonal variations of precipitation isotopes in this region, indicating the δ18O and δ2H values were inversely correlated with the intensity of the discharge (Figure 6e,f). The monsoon precipitation-driven isotope-discharge pattern was similar to those previously reported [8,14,40]. The variations in isotopic values of the tributaries were almost identical to those in the main flow. In comparison, Cuona Lake showed no discernible variation (Figure 3). From a climatological perspective, the discharge of the main stream was primarily derived from continental or local recycled moisture and westerly transport in the non-monsoon season. During the monsoon season, the discharge was derived from the Indian Ocean’s marine moisture. However, moisture originating from these two climatic systems exhibited distinct isotopic signatures, which were higher during the westerlies and lower during the summer monsoon [8,37]. This significant seasonal difference was due to the seasonality of the mainstream in the transition zone between the westerlies and the summer monsoon [21,22]. There was less flow in the channel course during the spring and early summer, while melting ice and snowmelt as well as monsoon moisture significantly increased the flow from July to September (Figure 2). In this study, δ18O and δ2H values of precipitation and snow were relatively lower in the monsoon season, leading to lower values in the main flow. Remarkably, the lowest discharge in June was not accompanied by the highest isotopic values in our study. Additionally, the highest discharge values in the Yarlung Zangbo River Basin did not result in its lowest isotopic values, which may be partly due to isotope depletion or enrichment of water sources, such as groundwater and delayed runoff from pre-monsoon precipitation that accumulated at higher elevations [8].

4.4. Surface Water Lines

Linear regression analysis was performed on the measured surface samples in the Nujiang headwaters to establish the SWLs as δ2H = 6.66 δ18O − 14.90 (R2 = 0.91; Figure 5b). In general, δ18O and δ2H from ice, lake and river water varied in a systematic manner and fell close to the GMWL of δ2H = 8 δ18O + 10 [32]. The GMWL has proven to be a useful reference line to understand the spatial variability of water isotope content, especially the evaporation effect based on the deviation from water [25,32,50]. In our study, the slope (6.66) and intercept (−14.90) of the Nujiang SWL were lower than those of the GMWL. Evaporation could cause deviations in this arid climate, resulting in a reduced slope and increased isotopic enrichment [8,25,26]. Water lines varied from region to region and were closely related to geographical settings and individual climatic conditions (e.g., moisture source, condensation temperature and subcloud evaporation) [8]. For instance, the SWLs in the Yarlung Zangbo River Basin were defined as δ2H = 9.25 δ18O + 24.07 and δ2H = 8.16 δ18O + 12.77 [8,12]. Interestingly, as the lines moved northward, the SWL varied systematically and showed a progressively lower slope and intercept [12,25,26,51]. Our results also confirmed this, and the slope and intercept continued to decrease to 6.66 and −14.90, respectively. The Nujiang headwater region, located in the north of the Yarlung Zangbo River Basin, had higher evaporation than the Yarlung Zangbo River Basin. After the Indian summer monsoon crossed the Himalayas, oceanic moisture would have a longer transport distance from the south to the observation area and consequently experience stronger evaporation, especially under arid climate conditions [25,26]. Therefore, compared with the Yarlung Zangbo River Basin, summer moisture transported by the southwest monsoon would result in lower slope and intercept values in the Nujiang Basin. The δ18O−δ2H relationship of the Yarlung Zangbo River Basin deviated from the GMWL because of the rapid flow rates due to steep elevation gradients and cold temperatures [12]. However, the same elevation gradients and cold temperatures existed in the Nujiang Basin, indicating that the δ18O−δ2H slopes of the regression lines were less than eight due to evaporation. The atmospheric relative humidity in the Nujiang Basin was 60.56%, which was significantly lower than that in the Yarlung Zangbo River Basin and strongly supported our conclusion (Figure 2).
A previous study had stated that the correlations between water δ18O and δ2H values could be effectively used to identify hydrological processes along river channels [8]. We found that precipitation and snow demonstrated strong linear correlations for δ2H = 9.50 δ18O + 41.80 (R2 = 0.99), while surface water demonstrated weak linear correlations for δ2H = 6.66 δ18O − 14.90 (R2 = 0.98). As a comparison, the slope and intercept of the SWL were much lower than those of the LMWL, indicating precipitation and snow were the primary water vapor source for surface water. Additionally, the SWLs of the Nagqu River, the Ciqu River, the Seni River, Cuona Lake and ice were δ2H = 7.01 δ18O − 11.19 (R2 = 0.97), δ2H = 7.68 δ18O − 0.67 (R2 = 0.98), δ2H = 6.99 δ18O − 7.68 (R2 = 0.89), δ2H = 6.65 δ18O − 15.40 (R2 = 0.98) and δ2H = 5.58 δ18O − 28.75 (R2 = 0.94). The graphical combination results of individual SWLs indicated unique mixed lines and complex hydrological processes [8,12]. In addition, the slopes of the SWLs were lower than that of the GMWL (Figure 5), which also indicated that evaporation was the main hydrological process in the surface waters. Moreover, the spatiotemporal trends of the water parameters supported the above conclusion [8,52,53]. In our study, compared with Cuona Lake, the water temperature and pH in the main flow showed an increasing trend during the monitoring period. From April to May, the water temperature and pH in the main flow also exhibited an increasing trend, while in September, there was a decreasing trend compared to the tributaries (Table 1).

5. Conclusions

Our present work is the first systematic study of δ18O and δ2H values in various types of waters that supply the Nujiang headwaters in the central Qinghai−Tibetan Plateau. We found that the moisture in the Nujiang headwaters was controlled alternately by the westerlies and the summer monsoon, with higher isotopic values in the non-monsoon season. Across the Nujiang headwaters, δ18O and δ2H values in lake water were more enriched than local precipitation and other surface waters due to stronger evaporation. In addition, the isotopic values of the main flow were significantly affected by Cuona Lake and were higher upstream of the lake. We established an SWL of δ2H = 6.66 δ18O − 14.90 for the Nujiang headwaters, which was lower than the GMWL. Based on the above results, we concluded that water mixing and evaporation appeared to be the dominant hydrological processes in this region. In general, δ18O and δ2H values in the water tended to be negatively correlated with precipitation and air temperature. Moreover, the isotopic values of the Nagqu River were inversely proportional to the intensity of discharge, highlighting the precipitation-driven isotope-discharge pattern.

Author Contributions

Conceptualization, X.W., H.G., G.H., X.Q. and Q.G.; Data curation, H.W.; Formal analysis, H.W., H.S., H.G. and Q.G.; Funding acquisition, Q.G.; Investigation, H.W. and H.S.; Methodology, H.W., X.W., H.G., G.H., Q.L. and X.Q.; Software, X.W. and G.H.; Writing—original draft, H.W.; Writing—review & editing, H.W. and Q.G. All authors have read and agreed to the published version of the manuscript.

Funding

This research was funded by The National Key R&D Program of China: 2016YFC0502003, and the National Natural Science Foundation of China: 31600366, 31570484.

Acknowledgments

We thank Jun Yan and Haipeng Zhang for their help in field work. This work was supported by the Program of the National Natural Science Foundation of China (2016YFC0502003, 31600366 and 31570484).

Conflicts of Interest

The authors declare no conflict of interest.

References

  1. Immerzeel, W.W.; Van Beek, L.P.H.; Bierkens, M. Climate Change Will Affect the Asian Water Towers. Science 2010, 328, 1382–1385. [Google Scholar] [CrossRef]
  2. Zhang, M.; Zhao, Y.; Liu, F.; Pan, X. Glacier dynamics and water balance in the Qinghai−Tibet plateau. Environ. Sci. Technol. 2012, 46, 6449–6450. [Google Scholar] [CrossRef]
  3. Qu, B.; Zhang, Y.; Kang, S.; Sillanpää, M. Water chemistry of the southern Tibetan Plateau: An assessment of the Yarlung Tsangpo river basin. Environ. Earth Sci. 2017, 76, 74. [Google Scholar] [CrossRef]
  4. Song, C.Q.; Ke, L.H.; Huang, B.; Richards, K.S. Can mountain glacier melting explains the GRACE−observed mass loss in the southeast Tibetan Plateau: From a climate perspective? Glob. Planet. Chang. 2015, 124, 1–9. [Google Scholar] [CrossRef]
  5. Hren, M.T.; Bookhagen, B.; Blisniuk, P.M.; Booth, A.L.; Chamberlain, C.P. δ18O and δD of streamwaters across the Himalaya and Tibetan Plateau: Implications for moisture sources and paleoelevation reconstructions. Earth Planet. Sci. Lett. 2009, 288, 20–32. [Google Scholar] [CrossRef]
  6. Li, L.; Yang, S.; Wang, Z.; Zhu, X.; Tang, H. Evidence of Warming and Wetting Climate over the Qinghai-Tibet Plateau. Arct. Antarct. Alp. Res. 2010, 42, 449–457. [Google Scholar] [CrossRef]
  7. Ganjurjav, H.; Gao, Q.Z.; Gornish, E.S.; Schwartz, M.W.; Liang, Y.; Cao, X.J.; Zhang, W.N.; Zhang, Y.; Li, W.H.; Wan, Y.F.; et al. Differential response of alpine steppe and alpine meadow to climate warming in the central Qinghai−Tibetan Plateau. Agric. For. Meteorol. 2016, 223, 233–240. [Google Scholar] [CrossRef] [Green Version]
  8. Ren, W.; Yao, T.D.; Xie, S.Y. Stable isotopic composition reveals the spatial and temporal dynamics of discharge in the large river of Yarlungzangbo in the Tibetan Plateau. Sci. Total. Environ. 2018, 625, 373–381. [Google Scholar] [CrossRef]
  9. Zhang, M.; Wang, S.; Li, Z.; Wang, F. Glacier area shrinkage in China and its climatic background during the past half century. J. Geogr. Sci. 2012, 22, 15–28. [Google Scholar] [CrossRef]
  10. Huang, X.; Sillanpää, M.; Duo, B.; Gjessing, E.T. Water quality in the Tibetan Plateau: Metal contents of four selected rivers. Environ. Pollut. 2008, 156, 270–277. [Google Scholar] [CrossRef]
  11. Li, B.; Yu, Z.; Liang, Z.; Acharya, K. Hydrologic response of a high altitude glacierized basin in the central Tibetan Plateau. Glob. Planet. Chang. 2014, 118, 69–84. [Google Scholar] [CrossRef]
  12. Ren, W.; Yao, T.; Xie, S. Water stable isotopes in the Yarlungzangbo headwater region and its vicinity of the southwestern Tibetan Plateau. Tellus B Chem. Phys. Meteorol. 2016, 68, 30397. [Google Scholar] [CrossRef] [Green Version]
  13. Lachniet, M.S.; Patterson, W.P. Stable isotope values of Costa Rican surface waters. J. Hydrol. 2002, 260, 135–150. [Google Scholar] [CrossRef]
  14. Gao, J.; Masson-Delmotte, V.; Yao, T.; Tian, L.; Risi, C.; Hoffmann, G. Precipitation Water Stable Isotopes in the South Tibetan Plateau: Observations and Modeling. J. Clim. 2011, 24, 3161–3178. [Google Scholar] [CrossRef] [Green Version]
  15. Yao, T.C.; Zhang, X.P.; Li, G.; Huang, H.; Wu, H.W.; Huang, Y.M.; Zhang, W.J. Characteristics of the stable isotopes in different water bodies and their relationships in surrounding areas of Yuelu Mountain in the Xiangjiang River basin. Nat. Resour. J. 2016, 31, 1198–1210. [Google Scholar]
  16. Jouzel, J.; Delaygue, G.; Landais, A.; Masson-Delmotte, V.; Risi, C.; Vimeux, F. Water isotopes as tools to document oceanic sources of precipitation. Water Resour. Res. 2013, 49, 7469–7486. [Google Scholar] [CrossRef]
  17. Salamalikis, V.; Argiriou, A.A.; Dotsika, E. Stable isotopic composition of atmospheric water vapor in Patras, Greece: A concentration weighted trajectory approach. Atmos. Res. 2015, 152, 93–104. [Google Scholar] [CrossRef]
  18. Yu, W.S.; Wei, F.L.; Ma, Y.M.; Liu, W.J.; Zhang, Y.Y.; Luo, L.; Tian, L.D.; Xu, B.Q.; Qu, D.M. Stable isotope variations in precipitation over Deqin on the southeastern margin of the Tibetan Plateau during different seasons related to various meteorological factors and moisture sources. Atmos. Res. 2016, 170, 123–130. [Google Scholar] [CrossRef]
  19. Liu, Z.F.; Tian, L.D.; Yao, T.D.; Yu, W.S. Seasonal deuterium excess in Nagqu precipitation: Influence of moisture transport and recycling in the middle of Tibetan Plateau. Environ. Geol. 2008, 55, 1501–1506. [Google Scholar] [CrossRef]
  20. Juhlke, T.R.; Meier, C.; Van Geldern, R.; Vanselow, K.A.; Wernicke, J.; Baidulloeva, J.; Barth, J.A.; Weise, S.M. Assessing moisture sources of precipitation in the Western Pamir Mountains (Tajikistan, Central Asia) using deuterium excess. Tellus B Chem. Phys. Meteorol. 2019, 71, 1–16. [Google Scholar] [CrossRef] [Green Version]
  21. Yu, W.S.; Yao, T.D.; Tian, L.D.; Ma, Y.M.; Ichiyanagi, K.; Wang, Y.; Sun, W.Z. Relationships between δ18O in precipitation and air temperature and moisture origin on a south–north transect of the Tibetan Plateau. Atmos. Res. 2008, 87, 158–169. [Google Scholar] [CrossRef]
  22. A Review of Climatic Controls on δ18O in Precipitation over the Tibetan Plateau: Observations and Simulations. Available online: https://agupubs.onlinelibrary.wiley.com/doi/full/10.1002/rog.20023 (accessed on 12 August 2020).
  23. Tian, L.; Yao, T.; Schuster, P.F.; White, W.C.; Ichiyanagi, K.; Pendall, E.; Pu, J.; Yu, W. Oxygen−18 concentrations in recent precipitation and ice cores on the Tibetan Plateau. J. Geophys. Res. 2003, 108. [Google Scholar] [CrossRef]
  24. Yang, X.X.; Xu, B.Q.; Yang, W.; Qu, D.W. The Indian monsoonal influence on altitude effect of δ18O in surface water on southeast Tibetan Plateau. Sci. China Earth Sci. 2012, 55, 438–445. [Google Scholar] [CrossRef]
  25. Ren, W.; Yao, T.; Xie, S. Key drivers controlling the stable isotopes in precipitation on the leeward side of the central Himalayas. Atmos. Res. 2017, 189, 134–140. [Google Scholar] [CrossRef]
  26. Controls on the Stable Isotopes in Precipitation and Surface Waters across the Southeastern Tibetan Plateau. Available online: http://dx.doi.org/10.1016/j.jhydrol.2016.12.034 (accessed on 12 August 2020).
  27. Tian, L.D.; Liu, Z.F.; Gong, T.L.; Yin, C.L.; Yu, W.S.; Yao, T.D. Isotopic variation in the lake water balance at the Yamdruk−tso basin, southern Tibetan Plateau. Hydrol. Process. 2008, 22, 3386–3392. [Google Scholar] [CrossRef]
  28. Yu, W.S.; Yao, T.D.; Tian, L.D.; Wang, Y.; Yin, C.L. Isotopic composition of atmospheric water vapor before and after the monsoon’s end in the Nagqu River Basin. Chin. Sci. Bull. 2005, 50, 2755–2760. [Google Scholar] [CrossRef]
  29. Lutz, A.F.; Immerzeel, W.W.; Shrestha, A.B.; Bierkens, M. Consistent increase in High Asia’s runoff due to increasing glacier melt and precipitation. Nat. Clim. Chang. 2014, 4, 587–592. [Google Scholar] [CrossRef] [Green Version]
  30. Tong, Y.D.; Chen, L.; Chi, J.; Zhen, G.C.; Zhang, Q.G.; Wang, R.N.; Yao, R.H.; Zhang, W.; Wang, X.J. Riverine nitrogen loss in the Tibetan Plateau and potential impacts of climate change. Sci. Total Environ. 2016, 553, 276–284. [Google Scholar] [CrossRef]
  31. Du, J.; Ma, Y. Climatic trend of rainfall over Tibetan plateau from 1971 to 2000. Acta Geogr. Sin. 2004, 59, 375–382. [Google Scholar]
  32. Craig, H. Isotopic variation in meteric waters. Science 1961, 133, 1702–1703. [Google Scholar] [CrossRef]
  33. Yu, W.S.; Tian, L.D.; Yao, T.D.; Xu, B.Q.; Wei, F.L.; Ma, Y.M.; Zhu, H.F.; Luo, L.; Qu, D.M. Precipitation stable isotope records from the northern Hengduan Mountains in China capture signals of the winter India–Burma Trough and the Indian Summer Monsoon. Earth Planet. Sci. Lett. 2017, 477, 123–133. [Google Scholar] [CrossRef]
  34. Wu, H.B.; Zhao, Q.; Qin, X.B.; Gao, Q.Z.; Lyu, C.W. Temporal and spatial variations of hydrogen and oxygen isotopes in Tuojia River and its influencing factors. J. Appl. Ecol. 2018, 29, 1461–1469. [Google Scholar]
  35. Liu, Z.F.; Tian, L.D.; Yao, T.D.; Yu, W.S. Characterization of precipitation δ18O variation in Nagqu, central Tibetan Plateau and its climate controls. Theor. Appl. Clim. 2010, 99, 95–104. [Google Scholar] [CrossRef]
  36. Yu, W.S.; Xu, B.Q.; Lai, C.T.; Ma, Y.M.; Tian, L.D.; Qu, D.M.; Zhu, Z.Y. Influences of relative humidity and Indian monsoon precipitation on leaf water stable isotopes from the southeastern Tibetan Plateau. Geophys. Res. Lett. 2014, 41, 7746–7753. [Google Scholar] [CrossRef] [Green Version]
  37. Xu, Y.; Kang, S.; Zhang, Y.; Zhang, Y. A method for estimating the contribution of evaporative vapor from Nam Co to local atmospheric vapor based on stable isotopes of water bodies. Chin. Sci. Bull 2011, 56, 1511–1517. [Google Scholar] [CrossRef] [Green Version]
  38. Stable Isotopes in Precipitation. Available online: https://www.ldeo.columbia.edu/~polissar/OrgGeochem/dansgaard-1964-stable-isoto.pdf (accessed on 12 August 2020).
  39. Yu, W.S.; Yao, T.D.; Tian, L.D.; Li, Z.; Sun, W.Z.; Wang, Y. Relationships between δ18O in summer precipitation and temperature and moisture trajectories at Muztagata, western China. Sci. China Ser. D Earth Sci. 2006, 49, 27–35. [Google Scholar] [CrossRef]
  40. Pu, T.; He, Y.; Zhu, G.; Zhang, N.; Du, J.; Wang, C. Characteristics of water stable isotopes and hydrograph separation in Baishui catchment during the wet season in Mt.Yulong region, south western China. Hydrol. Process. 2012, 27, 3641–3648. [Google Scholar] [CrossRef]
  41. Chen, H.; Zhu, Q.; Peng, C.; Wu, N.; Wang, Y.; Fang, X.; Gao, Y.; Zhu, D.; Yang, G.; Tian, J.; et al. The impacts of climate change and human activities on biogeochemical cycles on the Qinghai-Tibetan Plateau. Glob. Chang. Boil. 2013, 19, 2940–2955. [Google Scholar] [CrossRef]
  42. Tian, L.D.; Yao, T.D.; MacClune, L.; White, W.C.; Schilla, A.; Vaughn, B.; Vachon, R.; Ichiyanagi, K. Stable isotopic variations in west China: A concentration of moisture sources. J. Geophys. Res-Atmos. 2007, 112. [Google Scholar] [CrossRef]
  43. Merlivat, L.; Jouzel, J. Global climatic interpretation of the deuterium−oxygen18 relationship for precipitation. J. Geophys. Res. 1979, 84, 5029–5033. [Google Scholar] [CrossRef]
  44. Kurita, N.; Yamada, H. The Role of Local Moisture Recycling Evaluated Using Stable Isotope Data from over the Middle of the Tibetan Plateau during the Monsoon Season. J. Hydrometeorol. 2008, 9, 760–775. [Google Scholar] [CrossRef]
  45. Pang, Z.H.; Kong, Y.L.; Froehlich, K.; Huang, T.M.; Yuan, L.J.; Li, Z.Q.; Wang, F.T. Processes affecting isotopes in precipitation of an arid region. Tellus B 2011, 63, 352–359. [Google Scholar] [CrossRef] [Green Version]
  46. A Preliminary Analysis about the Tracks of Moisture Transportation on the Qinghai−Xizang Plateau. Available online: http://www.dlyj.ac.cn/EN/10.11821/yj1990030004 (accessed on 12 August 2020).
  47. Stable Isotopes of Modern Water across the Himalaya and Eastern Tibetan Plateau: Implications for Estimates of Paleoelevation and Paleoclimate. Available online: https://agupubs.onlinelibrary.wiley.com/doi/full/10.1029/2011JD016132 (accessed on 12 August 2020).
  48. Wu, H.B.; Wang, X.X.; Ganjurjav, H.; Hu, G.Z.; Qin, X.B.; Gao, Q.Z. Effects of increased precipitation combined with nitrogen addition and increased temperature on methane fluxes in alpine meadows of the Tibetan Plateau. Sci. Total Environ. 2020, 705, 135818. [Google Scholar] [CrossRef] [PubMed]
  49. Zhou, S.Q.; Masayoshi, N.; Sakai, A.; Matsuda, Y. Variations of hydrogen and oxygen stable isotope of Qiyi glacier and precipitation in the Qilian Mountains. Chin. Sci. Bull. 2007, 52, 2187–2193. [Google Scholar]
  50. Isotopic Pattern in Modern Global Precipitation. Available online: https://www.researchgate.net/publication/257359208_Isotopic_patterns_in_Global_Precipitation (accessed on 12 August 2020).
  51. Tian, L.D.; Yao, T.D.; Numaguti, A.; Duan, K.Q. Relation between stable isotope in monsoon precipitation in southern Tibetan Plateau and moisture transport history. Sci. China Ser. D Earth Sci. 2001, 44, 267–274. [Google Scholar] [CrossRef]
  52. Aji, K.; Tang, C.; Song, X.; Kondoh, A.; Sakura, Y.; Yu, J.; Kaneko, S. Characteristics of chemistry and stable isotopes in groundwater of Chaobai and Yongding River basin, North China Plain. Hydrol. Process. 2008, 22, 63–72. [Google Scholar] [CrossRef]
  53. Cui, B.L.; Li, X.Y. Characteristics of stable isotope and hydrochemistry of the groundwater around Qinghai Lake, NE Qinghai−Tibet Plateau, China. Environ. Earth Sci. 2013, 71, 1159–1167. [Google Scholar] [CrossRef]
Figure 1. Location of the sampling sites.
Sustainability 12 06654 g001
Figure 2. Variations in (a) air temperature, (b) relative humidity, (c) discharge and (d) precipitation at the Nagqu station in 2018.
Sustainability 12 06654 g002
Figure 3. Variations in the water values of stable oxygen (δ18O) and hydrogen (δ2H) isotopes and deuterium excess (d-excess). The data from Cuona Lake, the Nagqu River, the Ciqu River and the Seni River were obtained from sampling sites 2, 4, 7 and 10 from April to September 2018, respectively. (a) note the variation of δ18O; (b) note the variation of δ2H; and (c) note the variation of d-excess in water.
Sustainability 12 06654 g003
Figure 4. Variations in (a) δ18O and (b) δ2H in the rivers and lake and of δ18O and δ2H in (c) snow and (d) ice. The data were obtained from the average δ18O and δ2H values of the rivers and lake in May and August 2018.
Sustainability 12 06654 g004
Figure 5. Relationship between δ18O and δ2H values. The local meteoric water line (LMWL) is shown in (a), and the surface water line (SWL) is shown in (b).
Sustainability 12 06654 g005
Figure 6. Correlation between δ18O and δ2H values and corresponding values of (a,b) precipitation, (c,d) air temperature and (e,f) discharge.
Sustainability 12 06654 g006aSustainability 12 06654 g006b
Table 1. Variations in pH and water temperature (WT) in the Nagqu River, Cuona Lake and the Ciqu River.
AprilMayJuneJulyAugustSeptember
Nagqu River5.44 ± 2.3610.35 ± 1.7213.64 ± 1.1015.86 ± 0.9814.48 ± 0.3610.00 ± 0.78
WT (°C)Cuona Lake10.18 ± 1.3210.22 ± 0.0815.70 ± 3.1717.68 ± 0.5520.62 ± 0.1213.98 ± 1.08
Ciqu River11.38 ± 0.4311.64 ± 0.2212.17 ± 0.3012.33 ± 1.0011.72 ± 1.878.75 ± 1.42
Nagqu River8.27 ± 0.218.38 ± 0.258.50 ± 0.178.66 ± 0.178.84 ± 0.108.72 ± 0.09
pHCuona Lake8.35 ± 0.138.61 ± 0.168.98 ± 0.419.10 ± 0.189.17 ± 0.088.87 ± 0.10
Ciqu River8.58 ± 0.018.53 ± 0.068.37 ± 0.098.48 ± 0.068.68 ± 0.028.53 ± 0.01
Table 2. Sample localities and measured isotopic data.
SampleSampling DateElevation (m)Lat. (°N)Long. (°E)δ18O (‰)δ2H (‰)Type
1 a2018/5/19467831.466792.1022−14.7−109.2Nagqu River
1 b2018/8/28467831.466792.1022−16.3−121.7Nagqu River
2 a2018/4/27458431.925291.5119−10.2−83.4Cuona Lake
2 b2018/5/19458431.925291.5119−9.8−79.8Cuona Lake
2 c2018/6/25458431.925291.5119−9.9−80.2Cuona Lake
2 d2018/7/26458431.925291.5119−10.0−80.7Cuona Lake
2 e2018/8/28458431.925291.5119−11.2−90.5Cuona Lake
2 f2018/9/20458431.925291.5119−10.1−81.5Cuona Lake
3 a2018/5/19458631.923391.5147−8.6−73.0Cuona Lake
3 b2018/8/28458631.923391.5147−10.3−85.5Cuona Lake
4 a2018/4/27456931.763391.5581−11.1−92.6Nagqu River
4 b2018/5/19456931.763391.5581−9.5−81.0Nagqu River
4 c2018/6/25456931.763391.5581−9.1−70.4Nagqu River
4 d2018/7/26456931.763391.5581−12.0−94.2Nagqu River
4 e2018/8/28456931.763391.5581−14.0−110.9Nagqu River
4f2018/9/20456931.763391.5581−13.0−101.7Nagqu River
5 a2018/5/19454631.669791.7181−16.5−130.3Nagqu River
5 b2018/8/28454631.669791.7181−13.4−107.7Nagqu River
6 a2018/5/19450031.467892.0417−14.3−112.3Ciqu River
6 b2018/8/28450031.467892.0417−16.9−130.7Ciqu River
7 a2018/4/27446831.467592.0372−15.2−118.3Ciqu River
7 b2018/5/19446831.467592.0372−14.4−112.0Ciqu River
7c2018/6/25446831.467592.0372−13.4−102.8Ciqu River
7 d2018/7/26446831.467592.0372−15.9−121.8Ciqu River
7 e2018/8/28446831.467592.0372−16.3−126.3Ciqu River
7 f2018/9/20446831.467592.0372−14.8−112.2Ciqu River
8 a2018/5/19479031.554292.2114−15.1−112.4Seni River
8 b2018/8/28479031.554292.2114−15.6−117.3Seni River
9 a2018/5/19457031.467892.1225−15.8−116.6Seni River
9b2018/8/28457031.467892.1225−15.6−118.9Seni River
10 a2018/5/19451031.476992.0539−14.3−107.7Seni River
10 b2018/8/28451031.476992.0539−14.8−110.5Seni River
11 a2018/5/19443531.410292.0133−14.0−108.8Nagqu River
11 b2018/8/28443531.410292.0133−16.5−128.8Nagqu River
12 (−10)2018/5/19-32.302291.8686−14.5−109.6Ice
12 (−20)2018/5/19-32.302291.8686−14.7−111.0Ice
12 (−30)2018/5/19-32.302291.8686−14.9−111.7Ice
12 (−40)2018/5/19-32.302291.8686−15.0−112.8Ice
12 (−50)2018/5/19-32.302291.8686−15.0−111.9Ice
13 a2018/4/24455431.466792.1022−14.2−99.8Precipitation
13 b2018/5/31455431.466792.1022−16.9−116.4Precipitation
13 c2018/6/15455431.466792.1022−20.7−159.1Precipitation
13 d2018/7/30455431.466792.1022−25.9−201.3Precipitation
13 e2018/8/20455431.466792.1022−22.2−171.1Precipitation
13 f2018/9/13455431.466792.1022−15.7−105.1Precipitation
14 a2018/4/27455431.466792.1022−15.2−96.5Snow
14 b2018/5/4455431.466792.1022−21.6−161.3Snow
14 c2018/9/20455431.466792.1022−12.7−79.0Snow
152018/5/6456031.646191.7556−16.1−114.9Snow
162018/5/6469032.298391.8647−13.8−89.4Snow
172018/5/6481032.304791.8514−10.7−61.0Snow
182018/5/6488032.189691.7078−12.2−72.8Snow
192018/5/6495032.157891.6413−6.3−16.3Snow
Note: lowercase letters represent different sampling dates at the same sampling site.

