Article

Geometric Optimization of Atriums with Natural Lighting Potential for Detached High-Rise Buildings

by
Alejandra Susa-Páez
and
María Beatriz Piderit-Moreno
*
Department of Design and Theory of Architecture, University of Bio-Bio, Av. Collao 1202, Concepción 4030000, Chile
*
Author to whom correspondence should be addressed.
Sustainability 2020, 12(16), 6651; https://doi.org/10.3390/su12166651
Submission received: 6 July 2020 / Revised: 27 July 2020 / Accepted: 28 July 2020 / Published: 17 August 2020

Abstract

:
Detached high-rise office buildings with more than 15 floors in high density areas have floor plans with large surfaces that prevent natural lighting from entering their central areas. Therefore, artificial lighting is used to substitute the lighting comfort needs of their occupants for a large proportion of operational hours, resulting in high energy expenses for the building. The goal of this study is to evaluate the lighting potential of a central atrium with added clerestories and/or side lighting every four levels in a parametric 15-floor theoretical model and two floor surface areas of 900 m2 and 2500 m2, compared to a 40% glazed surface on façades without solar control devices. A total of 108 geometric variations of the atrium and adjoining spaces were analyzed using a climate-based daylight dynamic simulation method (CBDM), using DIVA-for-Rhino as the integrated evaluation tool in Rhino’s Grasshopper software, where the parametric model was built. The geometric optimization results show the design variables that allowed a significant illuminance of between 60 and 70%, using the Useful Daylighting Illuminance (UDI) indicator in a range of 100 to 2000 lux, demonstrating that the incorporation of atrium spaces as a controlled natural lighting strategy in these buildings is an environmental and sustainable perspective for architectonic design.

1. Introduction

The efficient use of energy resources in buildings, regarding architectonic design guidelines, is a priority to contribute towards the sustainability of the built habitats of contemporary cities [1]. In general, the energy demand of building lighting is around 30–40% [2]. In dense urban areas such as urban hubs and economic districts, high-rise buildings represent a natural lighting design challenge. These buildings often have floor plans with large surfaces and a high energy consumption percentage to cover indoor lighting demands, since the openings on the façade to capture natural lighting are unable to supply the central core of these buildings and, as a result, they have high energy costs to artificially and permanently light these areas [3]. The implementation of atriums to allow natural lighting as an architectonic design strategy can reduce energy expenses derived from artificial lighting, improving the visual comfort, welfare and comfort of the occupants while they work.
The atrium applied to office buildings has been studied as a bioclimatic strategy to provide natural lighting and indoor temperature control, contributing to the welfare and comfort of occupants, as well as to the energy efficiency of the building [4,5,6]. In addition, as an architectonic element, it has the potential to act as a transition space [7], favoring communal activities among the occupants while providing an architectonic spatial quality [8].
To correctly design the atrium so that it distributes natural light without having repercussions in terms of energy efficiency losses related to thermal discomfort [9], it is necessary to identify the design variables that have a direct impact on its result. The most relevant are the geometry of the atrium well, the solar orientation, the type of envelope, the reflectance of the surface materials of the atrium and the window-to-wall ratio percentage (WWR) [6,7,8,9,10]. Different studies have addressed light evaluation by applying design variables using scale models, analytical equations, onsite measurements and software simulation [11]. Sharples and Lash (2006) [10] reviewed the research made related to the use of natural lighting in building atriums over 15 years (from 1990), providing knowledge about the main research methodologies used to date. They emphasize that most research is based on scale models under artificial and/or real skies, followed by the study of real cases and finally, the trust built up about software simulation methodologies, particularly, the Radiance software open-source calculation engine, created by Greg Ward Larson. This is the most widely used validated calculation engine in lighting and is integrated into a number of lighting engineering and architectural design applications [12]. Littlefair [11] promotes Radiance as an example of “ray tracing” programs that can model and calculate complex spaces with significant speculative reflections.
Different research projects have applied static daylight evaluation methodologies to a great extent, where studies using the daylighting factor (DF) lighting indicator under overcast skies have dominated for many years. Through an evaluation method with analytical formulas, based on software simulation and the results of scale models, average DF prediction formulas were created for the base of the atrium and its surface [13], being more accurate for shallower atriums. Likewise, Littlefair and Aizlewood propose the average DF formula for spaces adjoining the atrium [11]. Despite the good scope of these investigations, the static evaluation method does not account for the reality of the solar and lighting behavior inside atriums and adjoining spaces under real sky conditions. For Mardaljevic [14], the DF value would be the same, regardless of the orientation of the glazing or the latitude the building is in. Currently, static and dynamic evaluation methods are implemented. As a result of technological progress, it is possible to simulate illuminance performance, incorporating all the sky characteristics throughout the year [10,11,12,13,14,15].
The dynamic metrics of the daylight include the direct and diffuse component of natural light considering the seasons, the time of day and weather conditions of a place. Metrics such as daylight autonomy (DA), useful daylight illumination (UDI) and annual sunlight exposure (ASE) consider variations in sky conditions throughout the year, which depends on local meteorological data [16].
Some of the main researchers in atrium lighting assessment, such as Calcagni and Paroncini (2004), Ghasemi et al. (2015), Du and Sharples (2011), and Acosta et al. (2014, 2018) [17,18,19,20,21] have used static simulation methodology. Others have implemented the natural light dynamic assessment methodology, such as Reinhart, Mardaljevic, and Rogers (2006), Berardi and Wang (2014), and Reinhart, Mardaljevic, and Rogers (2006) [22], among others.
In this regard, this research sets out the lighting assessment of a vertical central atrium [18], applied on a detached 15-floor office building. It proposes a theoretical model, parametrized and analyzed by dynamic lighting simulations, to prove whether the inclusion of atriums in high-rise buildings (15 floors or more) of surfaces in floor between 900 m2 and 2500 m2 allows significant natural lighting contributions within their interior central core, contributing to the visual comfort of the occupants and to a possible reduction in the building’s energy consumption due to artificial lighting.

2. Design Variables in Vertical Central Atriums and Adjoining Spaces

Different parameters allow the design of natural lighting in the atrium space. Key components for the suitable operation of the atrium were identified, such as the geometry of the well, the reflectance of materials and the window-to-wall ratio (WWR) of its surfaces and adjoining spaces [6,8,9,10,23,24], which were all addressed in this research. In addition, another particular design variable was taken into account, namely the solar orientation of clerestories in relation to the roof of a vertical central atrium [18]. The research carried out shows the influence that these design variables have on each other with respect to the lighting performance of the spaces evaluated.

2.1. Geometry of the Vertical Central Atrium

Bednar (1986) provides the plane aspect ratio (PAR), a geometric indicator for the atrium floor proportion with the ratio between the width (a) and length (l) and the section aspect ratio (SAR) for the atrium section or cross-section ratio, with the ratio between the height (h) and width (a). Using these indicators as a starting point, he concludes that a SAR ratio below 1 is related to shallow atriums; between 1 and 2, predominantly long atriums with effective proportions of natural lighting; and for values of 2 and above, high ceiling narrower atriums. Likewise, the SAR ratio with values under 1 is related to linear and rectangular atriums with values equal to and/or close to 1, square ones.
Liu et al. (1991) propose the well index (WI) indicator to study the variation and distribution of natural lighting in atriums, identifying the dimensions involved in the PAR and SAR coefficients, where a high value of this indicator represents deep atrium wells. The analyses made have recommendations close to those of Bednar about rectangular and linear atriums.
Research by Ahadi et al., Calcagni and Paroncini and Du and Sharples [17,19,25] concludes that configurations with WI values < or equal to 1.5 are optimal to provide a considerable DF to adjoining spaces, which would correspond to an atrium that is approximately four floors high. Du and Sharples [19] investigated the horizontal DFs in adjoining spaces in open atrium models under overcast skies, as well as vertical DFs on the walls of three and four-sided linear atrium wells. Starting from the high-quality geometry, its façades, and the surface reflectance, they analyzed the daylight variations on adjoining spaces; they conclude that for a given SAR, reducing the PAR value increases the DF of the adjoining spaces.
Calcagni and Paroncini [17], investigated 11 atrium cases and their impact on daylighting conditions in adjoining spaces and the atrium floor. These were characterized by a well index (WI) between 0.2 and 1.5; The horizontal DF results in adjoining spaces show that on keeping the height constant and varying the length of the atrium, the DF increases as the light entry area of the atrium increases, that is to say, there is a reduction in the WI (0.78 ≤ WI ≤ 0.89) and likewise, the levels of light fall as the height of the atrium increases (with high WI values).
Ahadi et al. [25] evaluated natural lighting and natural cooling performance in different types of lightwells for the city of Tehran. The results show that the square lightwell with minimum sizes of 4 × 4 m and a 3 × 4 m rectangular lightwell can provide suitable cooling and annual daylighting autonomy (DA) rates for the rooms connected to the lightwell up to four floors beneath the roof.
Ghasemi et al. (2015) [18] evaluate the impact of the width of the “vertical” atrium and the height of the south-facing clerestory in Malaysia regarding the average daylighting factor (ADF) at different levels of vertical atriums and determined the suitable geometric sizes for a four-floor and four-sided atrium in order to cover the natural lighting demand in adjoining spaces. The study concluded, regarding the relationship between the width of the atrium (W) and the availability of daylight in its adjoining spaces, that the ADF variation trends in the different floors of the atrium are variable, given that the ADF levels rise as the height of the clerestory increases and, in the same way, when the degree of sky view (θ) has a higher value, the ADF level is greater on the different floors of the atrium. With this, they determined that the minimum acceptable ratio of the clerestory height (envelope) (h) to the height of the atrium (H) to provide enough ADF in the adjoining spaces of the atrium is h/H = 3/8.

2.2. Reflectance of Materials of Surfaces of the Atrium and Adjoining Spaces

The materiality of the atrium surfaces plays a very important role in the way light can be reflected within these spaces at different floor heights and their corresponding light contribution on adjoining spaces. For this reason, the reflection coefficient of the materials that are chosen when designing must be looked into further. The reflectance of the surfaces has been studied by Acosta et al. [21], Du and Sharples [19], and Calcagni and Paroncini [17], among others; they suggest that increasing the reflectance of the square or rectangular atrium well walls improves the DF values on the medium and low levels of the spaces. In the same way, the reflectance has been analyzed and standardized internationally by EN 12464-1 and IESNA (Illuminating Engineering Society of North America) and ISO 8995-1:2016 (CIE S 008/E: 2001). This is an important aspect in natural lighting design given that this is the quotient between the amount of incident light on this and the amount of light it can reflect. In general, high reflectance values are recommended on ceilings to allow for a high and homogeneous reflection of the light inside, medium reflectance values for vertical surfaces and work planes and low for the floor surface to control possible undesired light reflections that could cause light discomfort due to glare. Likewise, the transmittance values of the glazed surfaces are determined by the light and thermal requirements, depending on the layout of the space. These values are defined in Section 3.2.4.

2.3. Window-to-Wall Ratio (WWR)

It has been shown how natural lighting levels fall on the adjoining spaces of lower floors that lead into the atrium. Studies like those of [17,19] show that illuminance levels can be increased both on the atrium floor and in adjoining spaces, gradually increasing the WWR of the atrium’s vertical surfaces from the highest to the lowest floors to allow higher light reflection on the surfaces and reach a balance between the opaque surfaces and openings in the atrium. Aschehoug (1992) presented an “optimal” glazing percentage for four-floor atriums with 50% on the fourth floor, 60% on the third, 70% on the second and 100% on the first floor to provide considerably similar daylighting conditions in adjoining spaces, with glazing facing the street [26]. Ahadi et al. [25] tested the horizontal rotation of the lightwell windows for the creation of direct skylights, and managed to increase lighting efficiency in adjoining spaces.

3. Evaluation Methodology of the Atrium Lighting Potential

The study proposes an experimental quantitative research methodology based on dynamic lighting simulation techniques of variables from bibliographical sources that determine optimal criteria of architectonic lighting design.
Three methodological stages are implemented in the overall development of the research (see Figure 1). The first is related to the definition of geometric and material design variables in atriums, as well as the lighting assessment metrics. The second stage considers the construction of a parametric theoretical model and the definition of the lighting scene parameters in the evaluation software. In the third stage, lighting assessment, analysis and validation of the results and the proposal of design guidelines are made.

3.1. Definition of the Context: City of Santiago de Chile

3.1.1. Urban Context

The city of Santiago de Chile was chosen to run the lighting assessment of the case study due to it being a modern Latin American city and the economic, political and administrative hub of the country. It is characterized by its constant population growth which has generated the highest population concentration of the country, with 35.6% and 6,257,516 inhabitants by 2017, according to the National Statistics Institute (INE, in Spanish). Said conditions, over time, are reflected in an expansive territorial urban spread towards the outskirts of the city that has led to a deterioration of the quality of life of its inhabitants and have moved it away from a sustainable city vision. In the specific case of the districts that constitute the extended center of Santiago, over time, a building densification phenomenon has been produced due to the demographic growth and, in some cases, from the interests of speculative property developers regarding profitability of land use in these areas of the city, with the implementation of high density buildings that do not consider the important physical and environmental contextual elements for the quality of life of their inhabitants [27]. Based on this, a review of the main high-rise buildings in Santiago was made, considering the information of the Emporis website [28], a global construction information provider that collates data about high-rise buildings and those of a high public and economic value (see Table 1). At the same time, the buildings that have atriums in the city were reviewed. These had been previously classified by Roldán Rojas [29], who made an inventory of 27 public use buildings in Santiago de Chile from 1982 to 2010, standardizing them using the rating of Saxon (1983). According to the rating made, the typologies of three- and four-sided atriums were those that were generally found in the urban historic hub or its immediate surroundings, with the four-sided atriums being the more common in the architecture of Santiago, with floor surfaces of between 36 and 404 m2. This revision of volumetric ratios and surface areas of the building floor plans and atriums analyzed in Santiago is taken as reference to build the parametric theoretical model, along with atrium design variables for natural lighting studied in other investigations.

3.1.2. Climate Variables

The city of Santiago is located at a latitude of −33.4372 and a longitude of −70.6506. A review of the climate behavior of the location was made following the Köppen–Geiger classification Mediterranean, mild with dry, warm summer (csb), described in Table 2. Temperatures above 24 °C were seen in several periods of the year, along with falls in relative humidity and temperatures below the comfort range displaying a higher thermal oscillation. The period between May and August has the lowest temperatures, with July being the coldest month and January the warmest.
Similarly, the highest solar radiation levels dominate in the hottest summer months, gradually descending through to the winter. The solar behavior in this geographic location is shown moving towards the north. This information is important for the architectonic design criteria regarding the thermal and lighting control of the building. The most common average sky types during the entire year, correspond to overcast and intermediate, present in autumn, winter and spring. In summer, the clear sky type predominates defined by CIE (Commission Internationale de l´Eclairage) standard skies (S 011/E,2003) and studied by Piderit et al. [30]

3.2. Geometric Definition of the Theoretical Model

The geometric definition of the theoretical model of a detached office building is established as one that considers the vertical central atrium space typology as a natural lighting strategy. This atrium is characterized by receiving natural light from vertical side surfaces called “clerestories”. As a result, it considers the sky view angle and altitude angle regarding each atrium’s height and width, which determine the penetration of light into the adjoining spaces [18]. The main geometric design variables of optimal atriums for natural lighting, researched and analyzed in other investigations [6,8,9,10,17,19,23,25,26] summarized in Table 3, were implemented to plan the parametric model.

3.2.1. Definition of Number of Floors and Orientation of the Clerestories

Aiming at optimizing the light of a central atrium with geometric WI indicators greater than 1.5, corresponding to buildings of over four floors in height, a parameterized geometric model of 15-floors in height was built, incorporating side areas for light entries or “clerestories” every five levels from the different possible orientations. These parameters are proposed to feed light into a central atrium, comprising three atriums with four floors (WI< o = 1.5) and evaluating their light performance starting with the clerestory orientation as a design variable. The location of the clerestories every five floors with different orientations is outlined in Figure 2. On the fifth floor, four clerestories are considered with north, south, east and west orientations. On the 10th floor, two north- and south-facing clerestories, and on floor 15, two east- and west-facing clerestories. The results obtained from the evaluation can be applied in the future for buildings that are more than 15 floors high.

3.2.2. Ratios and Growth Ranges of the Vertical Central Atrium by Floor Surface

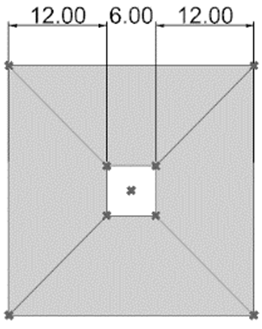
The atrium ratios 1:2, 1:1 and 2:1 were determined for the study on floor surfaces of 30 × 30 m2 and 50 × 50 m2. These areas correspond to area ranges analyzed in existing high-rise buildings in Santiago de Chile, as described in Section 3.1.1. The atrium ratios correspond to 4%, 11% and 25% of the area, as shown in Table 4.
Table 5 and Table 6 provide information about the range in geometric values, considering the floor surfaces proposed in the model and the adjoining spaces compared with the atrium ratios. These geometric ranges are expressed considering the geometric coefficients of the atrium, PAR, SAR and WI (see Table 5). Likewise, information is presented about the range of geometric ratios of the clerestories and the ratio of these with the height of the atrium (see Table 6).

3.2.3. Window-to-Wall Ratio (WWR)

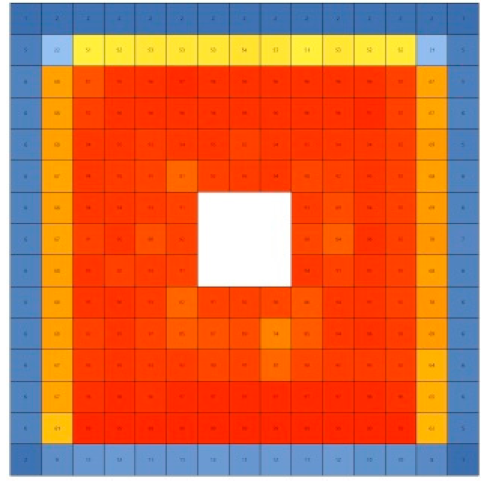
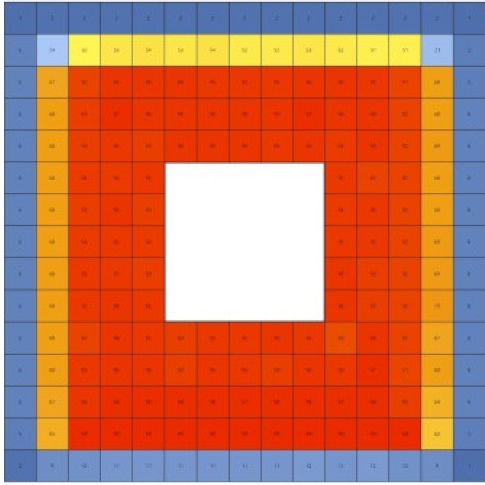
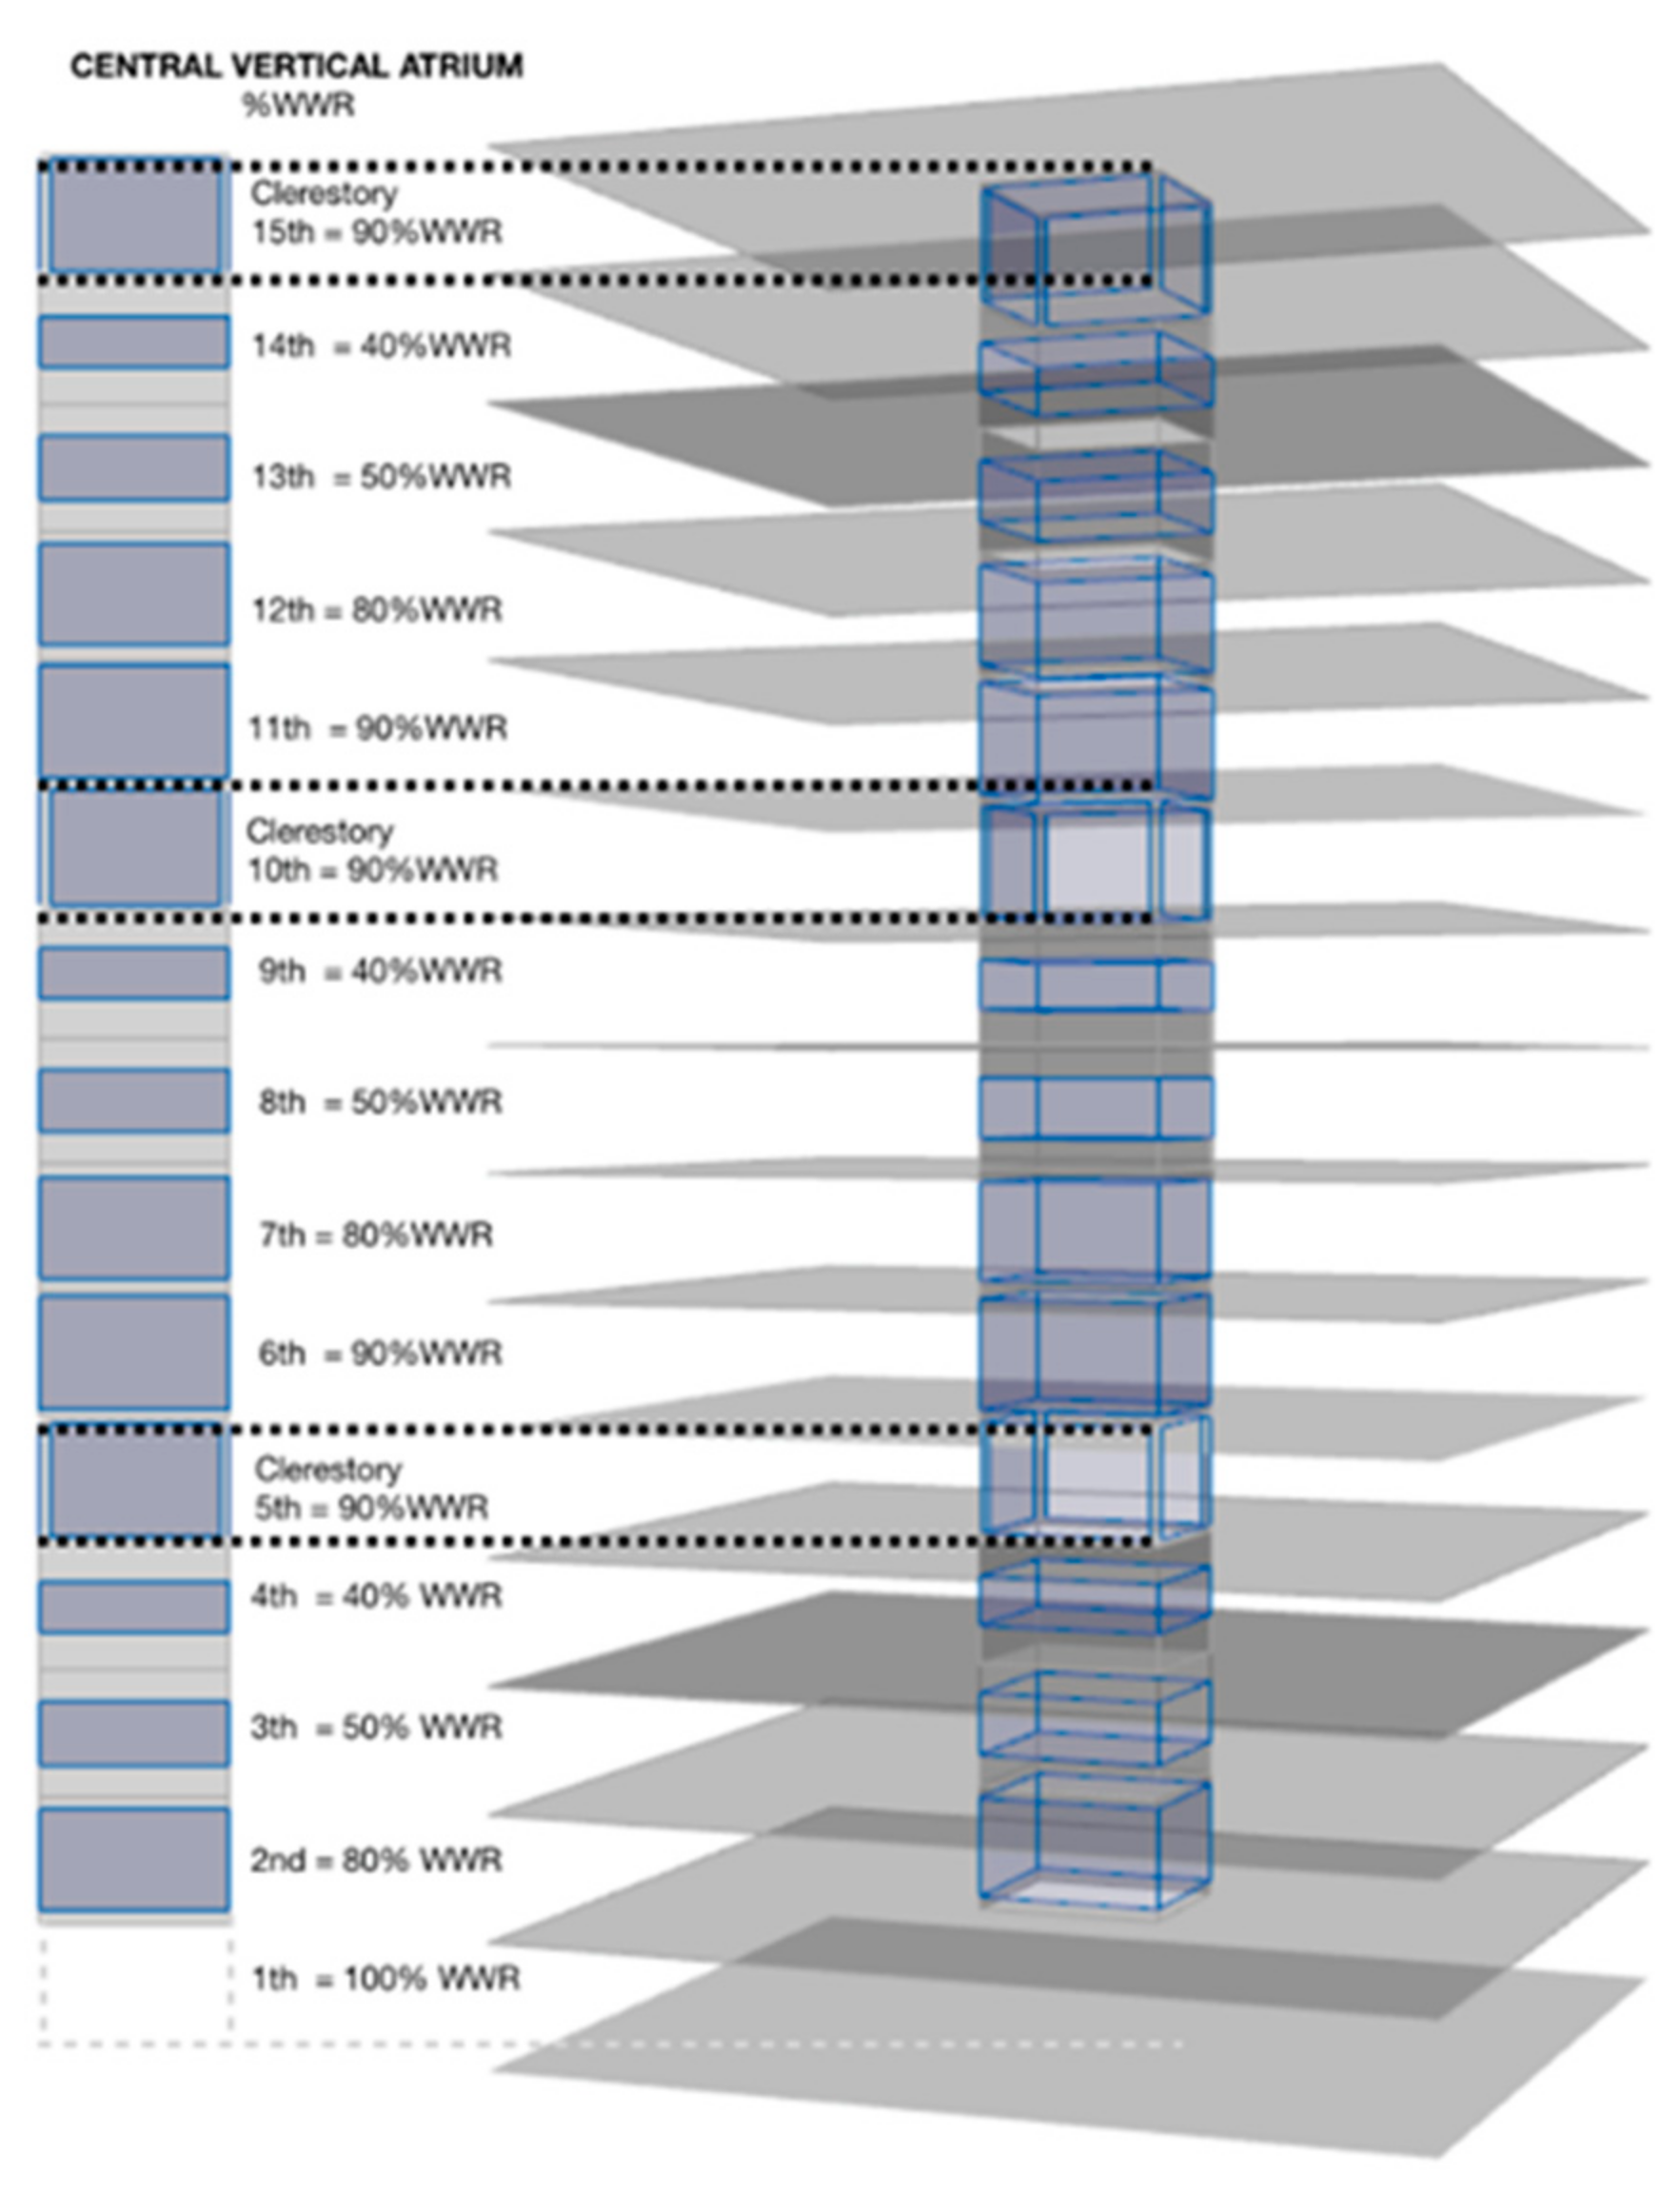
Four percentage ratios of glazed areas were evaluated to determine the optimal ratio that would provide the highest UDI value (100–2000 lux) over the work plane of the adjoining spaces on all floors. These simulations could show a proportion of windows of 90%, 80%, 50% and 40%, from the lowest floors (of each four-floor block). This was the ratio that allowed equaling and exceeding the UDI value of the second floors, without reducing those of the third ones. In the same way, a glazed area percentage of 90% was determined for the clerestories (See Figure 3). These are the areas that will provide entry of light for the central atrium.
For the WWR of the external façades of the building (see Figure 4), 40% was determined as the percentage documented by Vásquez 2015; Swet (2015) [31,32] to contribute to the energy efficiency in buildings.

3.2.4. Reflectance and Transmittance of the Theoretical Model’s Surfaces

The following reflectance coefficient values were established for the materials of opaque surfaces of the atrium and adjoining spaces, as well as the glass windows with ambient illuminance transmission coefficient, following the international illuminance design standards for work spaces, such as ISO 8995:2002 (E) (CIE S 008/E: 2002), EN 12464-1, IESNA (Illuminating Engineering Society of North America) and the Standard Terms of Reference (TDRe) for Public Buildings in Chile (See Table 7).

3.3. Proposed Lighting Simulation Method

The lighting assessments were run based on a theoretical model, built and geometrically parameterized using Rhino’s Grasshopper software. The DIVA-for-Rhino [36] was used for the light analysis, an optimization plug-in included in the Grasshopper visual programming language. The assessment was made using the following conditions:
-
Floors 1, 4, 6, 9, 11 and 14 were assessed simultaneously. These refer to floors one and four of each set of four atrium floors, depending on the orientation of the clerestories.
-
A light analysis grid at a height of 0.80 m was determined, which was given a materiality with a reflectance coefficient of 0.5, regarding a possible furniture materiality for the work surface. The location of the light sensors on the grid was subject to the number of floors analyzed simultaneously, the magnitude of the floor areas evaluated and the simulation time, so a distance of 2 m between the light sensors was determined.
-
An occupation schedule was defined in the simulations of 8 a.m. to 5 p.m.
Solar control devices on the façades were not considered for the study. On considering all the construction and evaluation parameters of the model, 108 geometric configurations were assessed in 36 lighting simulations.

3.4. Evaluation Metric

The evaluation was made starting from the “Useful Daylight Illuminance” (UDI) evaluation metric. This indicator was proposed by Mardaljevic and Nabil in 2005, based on the reported preferences of office occupants, so it can be considered as a glare indicator [37]. The UDI metric is part of the climate-based daylighting simulation method (CBDM) that allows an annual evaluation of the dynamic daylighting performance in a given space, considering variations in sky conditions during the entire year using local meteorological data. With UDI, the goal of determining when daylight levels are “useful” for the occupant in the range of 100 to 2000 lux, when they are very dark (less than 100 lux) are too bright (over 2000 lux), and where there is excessive illuminance that could lead to visual and/or thermal discomfort, is met. For this, the UDI range was subdivided based on the lower and upper thresholds of between 100 lx and 2000 lx, providing the following three metrics:
*
Useful Daylight Illuminance complementary (UDI-c): The percentage of annual time, where UDI (100–2000 lx) was reached.
*
Useful Daylight Illuminance underlit (UDI-u): The percentage of annual time where illuminance remained below 100 lx.
*
Useful Daylight Illuminance overlit (UDI-o): Percentages of time where 2000 lx was exceeded and the possibility of glare is assumed.

4. Results

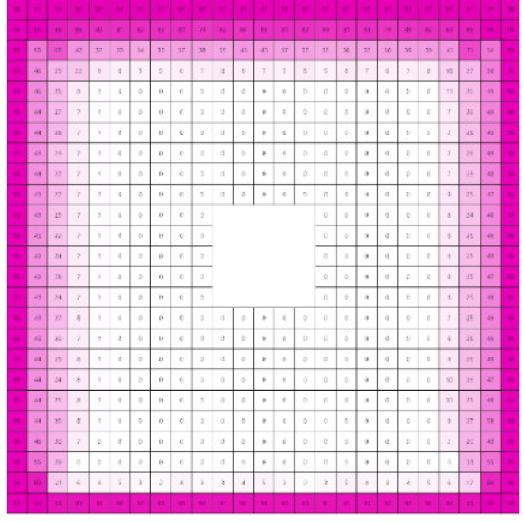
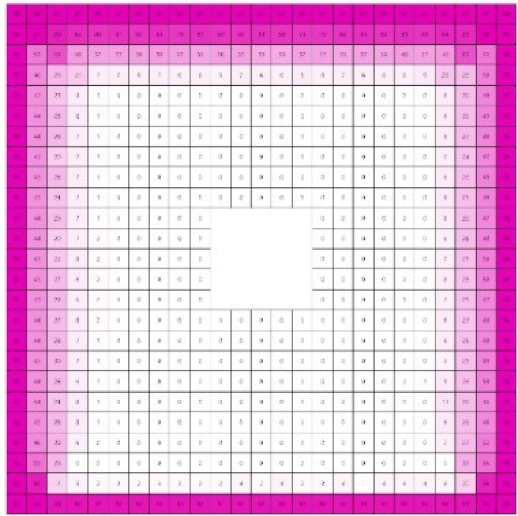
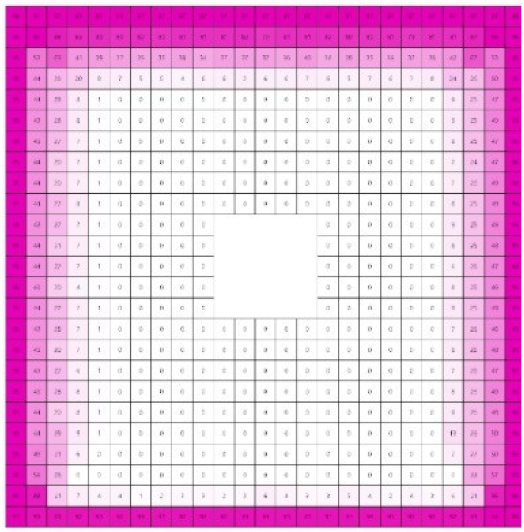
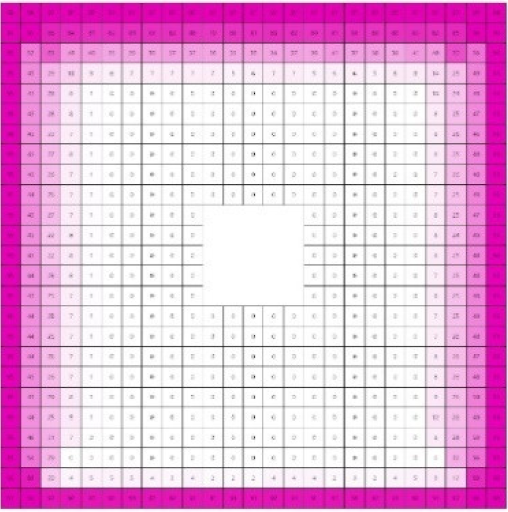
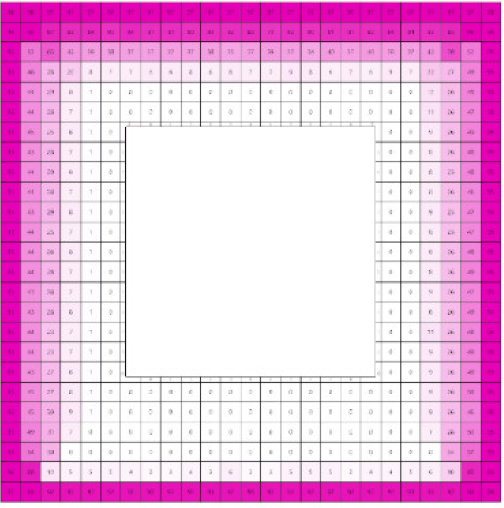
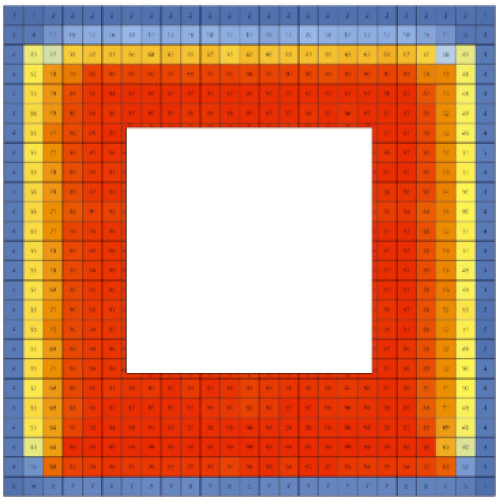
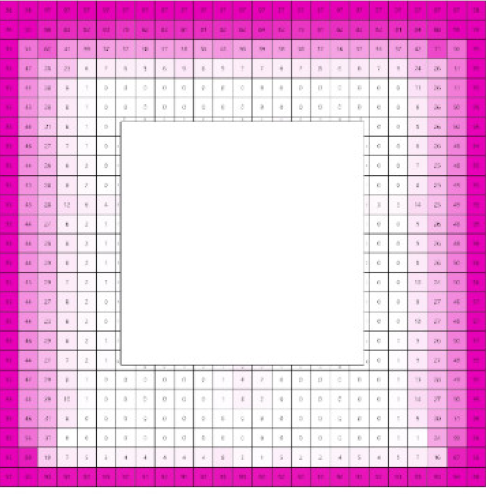
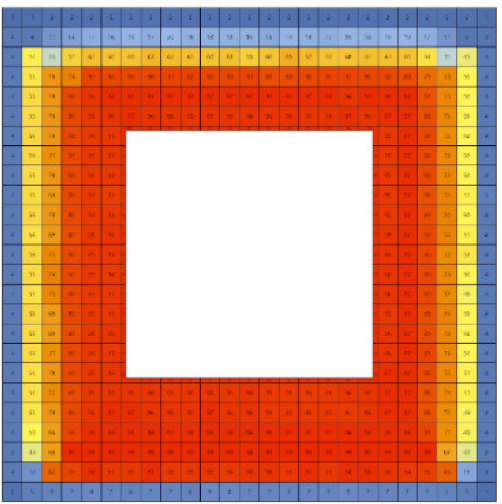
For the analysis, first the geometric configurations of floor surface areas of 30 × 30 m2 and 50 × 50 m2 were chosen. These had optimized geometric variables regarding the maximum illuminance behavior in relation to the UDI ranges defined by [37]. After this, to propose design guidelines, the geometric configurations that represented the best illuminance behaviors by UDI regarding the maximum spatial saving are chosen. The complete results can be seen in Appendix A, Appendix B and Appendix C.
A “floor code” was implemented in the results and analysis charts to identify the different geometric typologies evaluated (See Figure 5). This consecutively shows the evaluated floor area, the atrium ratio, the floor-to-ceiling height of adjoining spaces and the floor-to-ceiling height of the clerestory of the atrium in the following way:

4.1. Geometric Evaluation of a 30 × 30 m2 Floor Surface

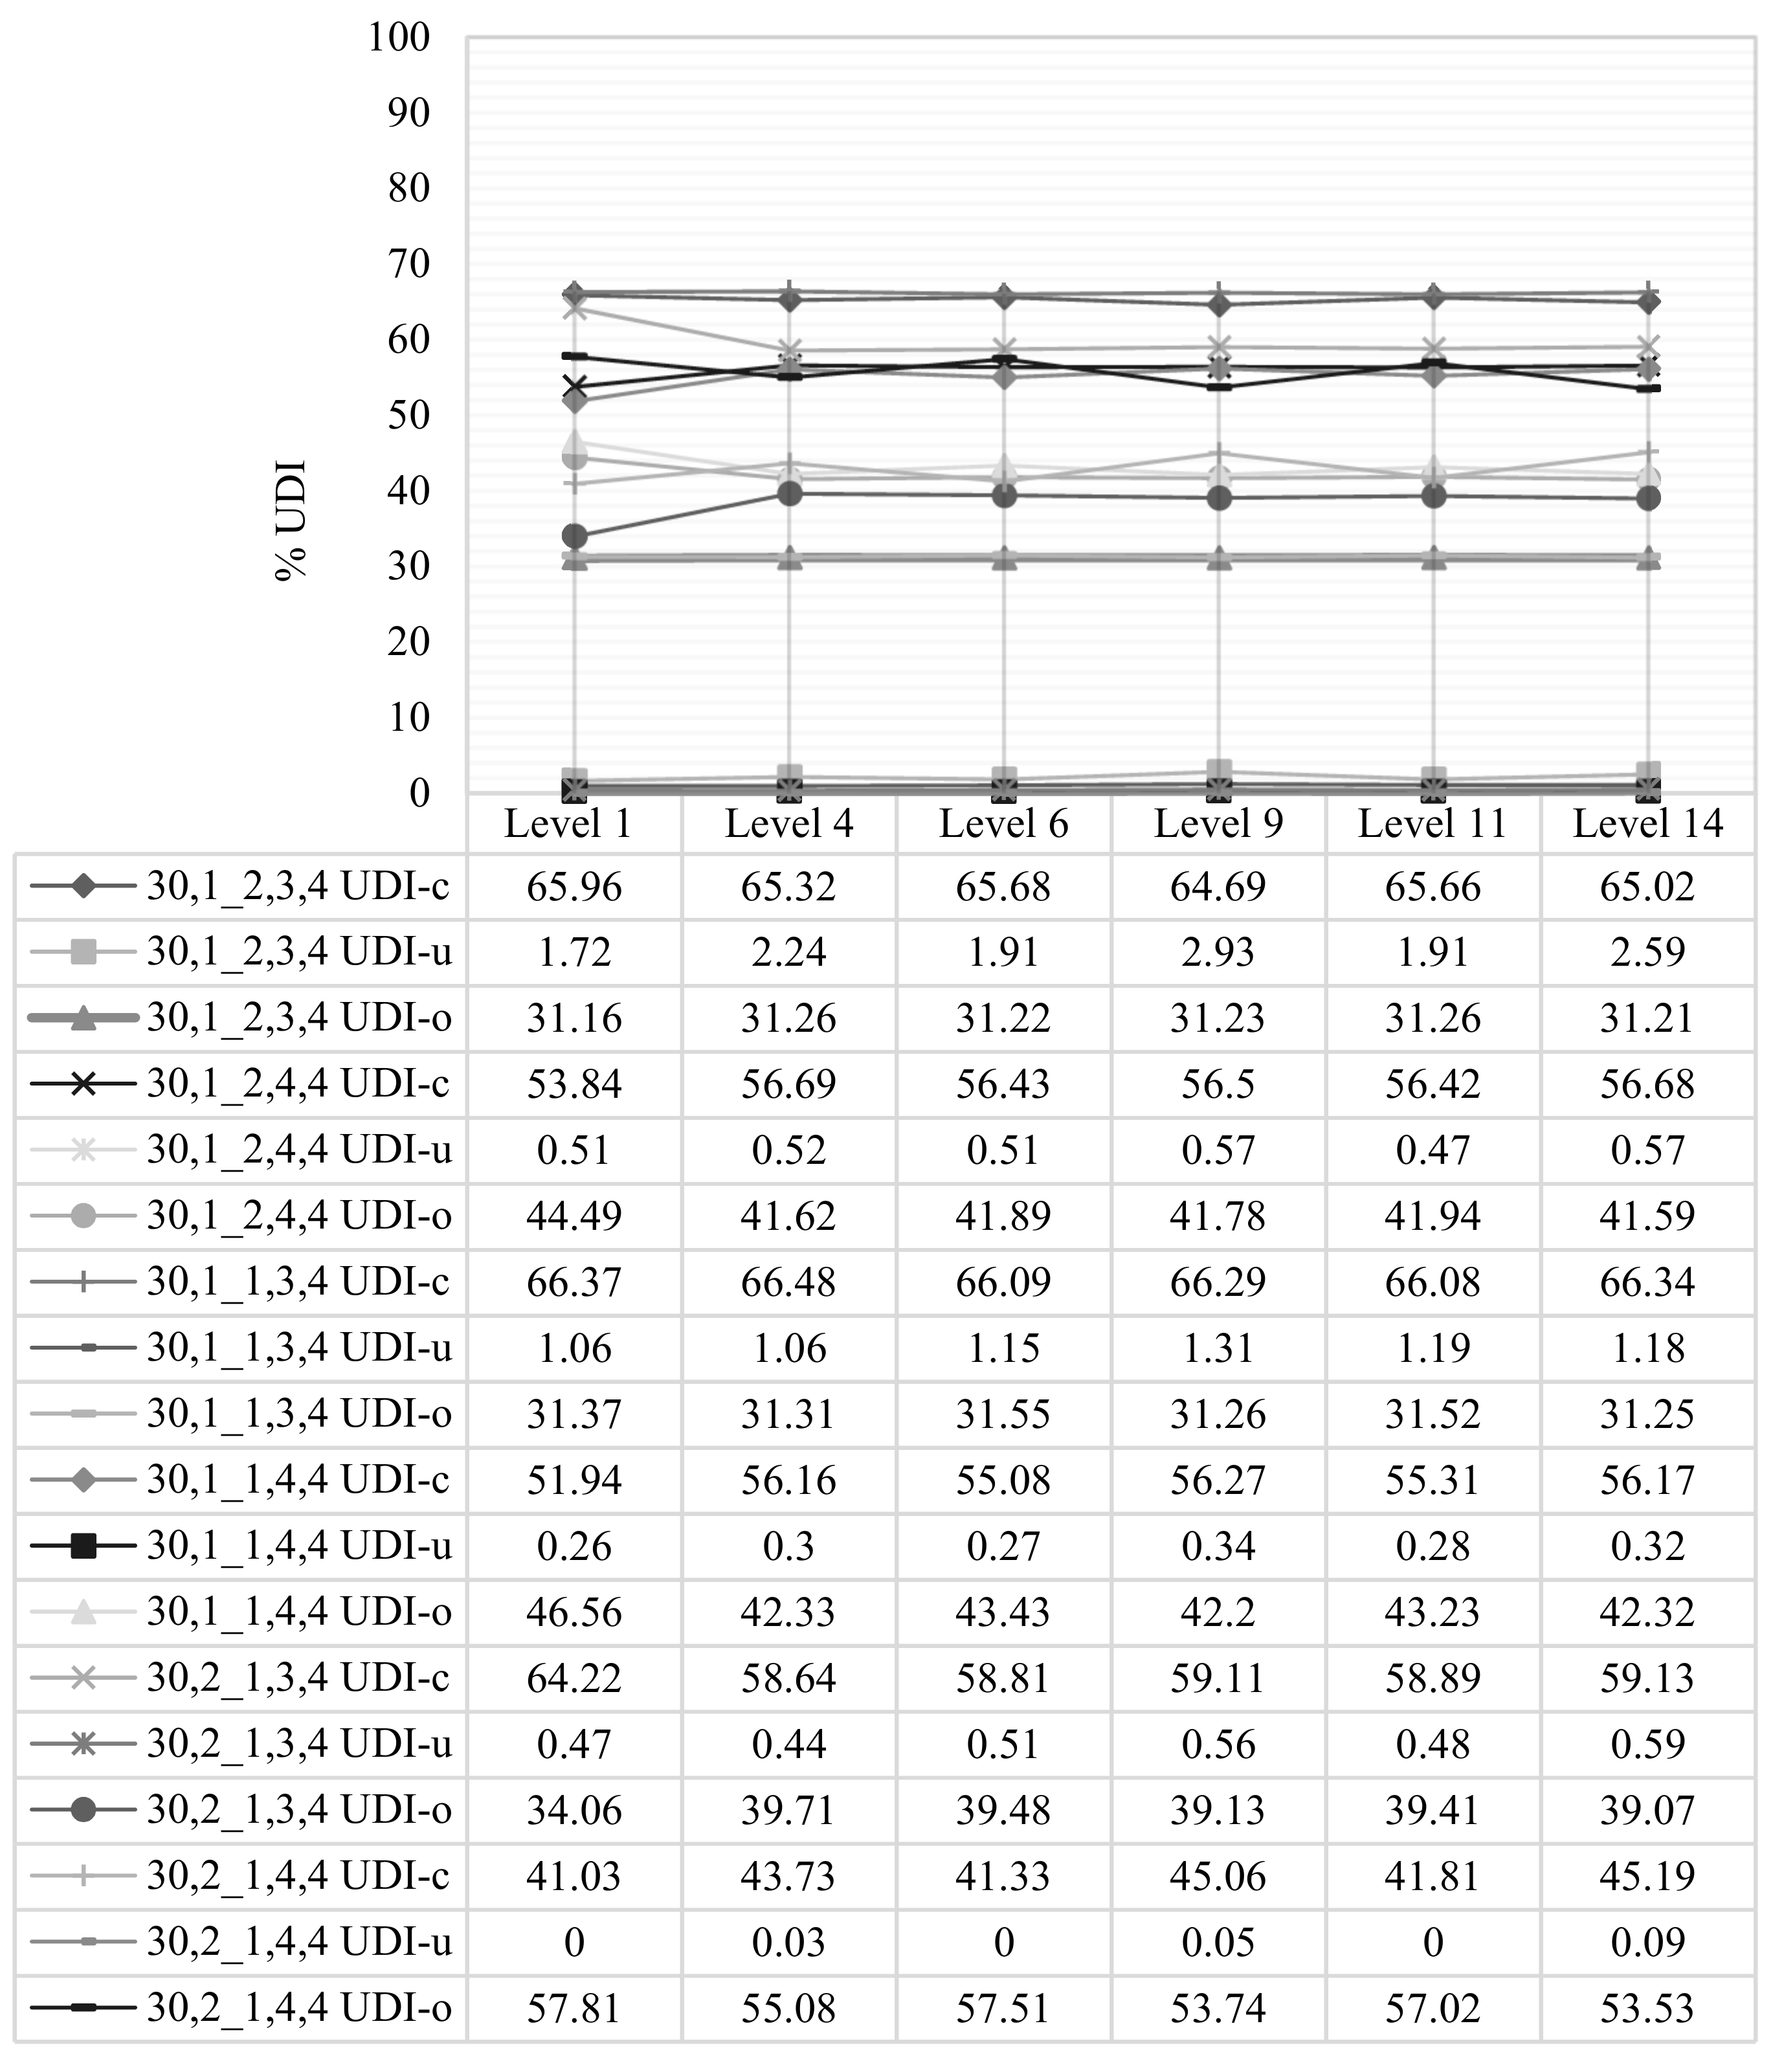
From the UDI results analyzed in Scheme 1, regarding the six geometric configurations chosen and described in Table 8, it is shown that the chosen geometric ratios correspond to heights of adjoining spaces of between 3 m and 4 m, and at the lowest proposed clerestory height they correspond to 4 m. On including the illuminance provided by the façades along with that of the atrium in the evaluation, the homogenization of the UDI inputs on the work plane of the lower and upper evaluated areas is shown, regardless of the orientation of the clerestories. Therefore, it is determined that the orientation of the clerestories as a design variable under the conditions set out in the study would be more related to the conditions and opportunities of the urban context of the project to receive daylight.
The illuminance behavior results from the proposed UDI ranges show a lower percentage of UDI-u (<100 lux) in most configurations, UDI-c or complementary percentages (100–200 lux) above 50% and a moderate percentage of UDI-o (>2000 lux), bearing in mind that the evaluation was made without any shading devices on the façades. The UDI exceeded percentage mainly corresponds to floor areas alongside external façades. From the UDI ranges in adjoining spaces, compared to the atrium ratios, in general, the results are quite balanced. It is seen that the 2:1 ratio considerably reduces UDI-c values and increases those of UDI-o when the height of adjoining spaces changes from 3 to 4 m. The increase in the atrium ratio from 1:2 or 1:1 to 2:1 ends up being an oversized design for the illuminance efficiency of adjoining spaces on the 30 × 30 m2 floor surface.

4.2. Geometric Evaluation of a 50 × 50 m2 Floor Surface

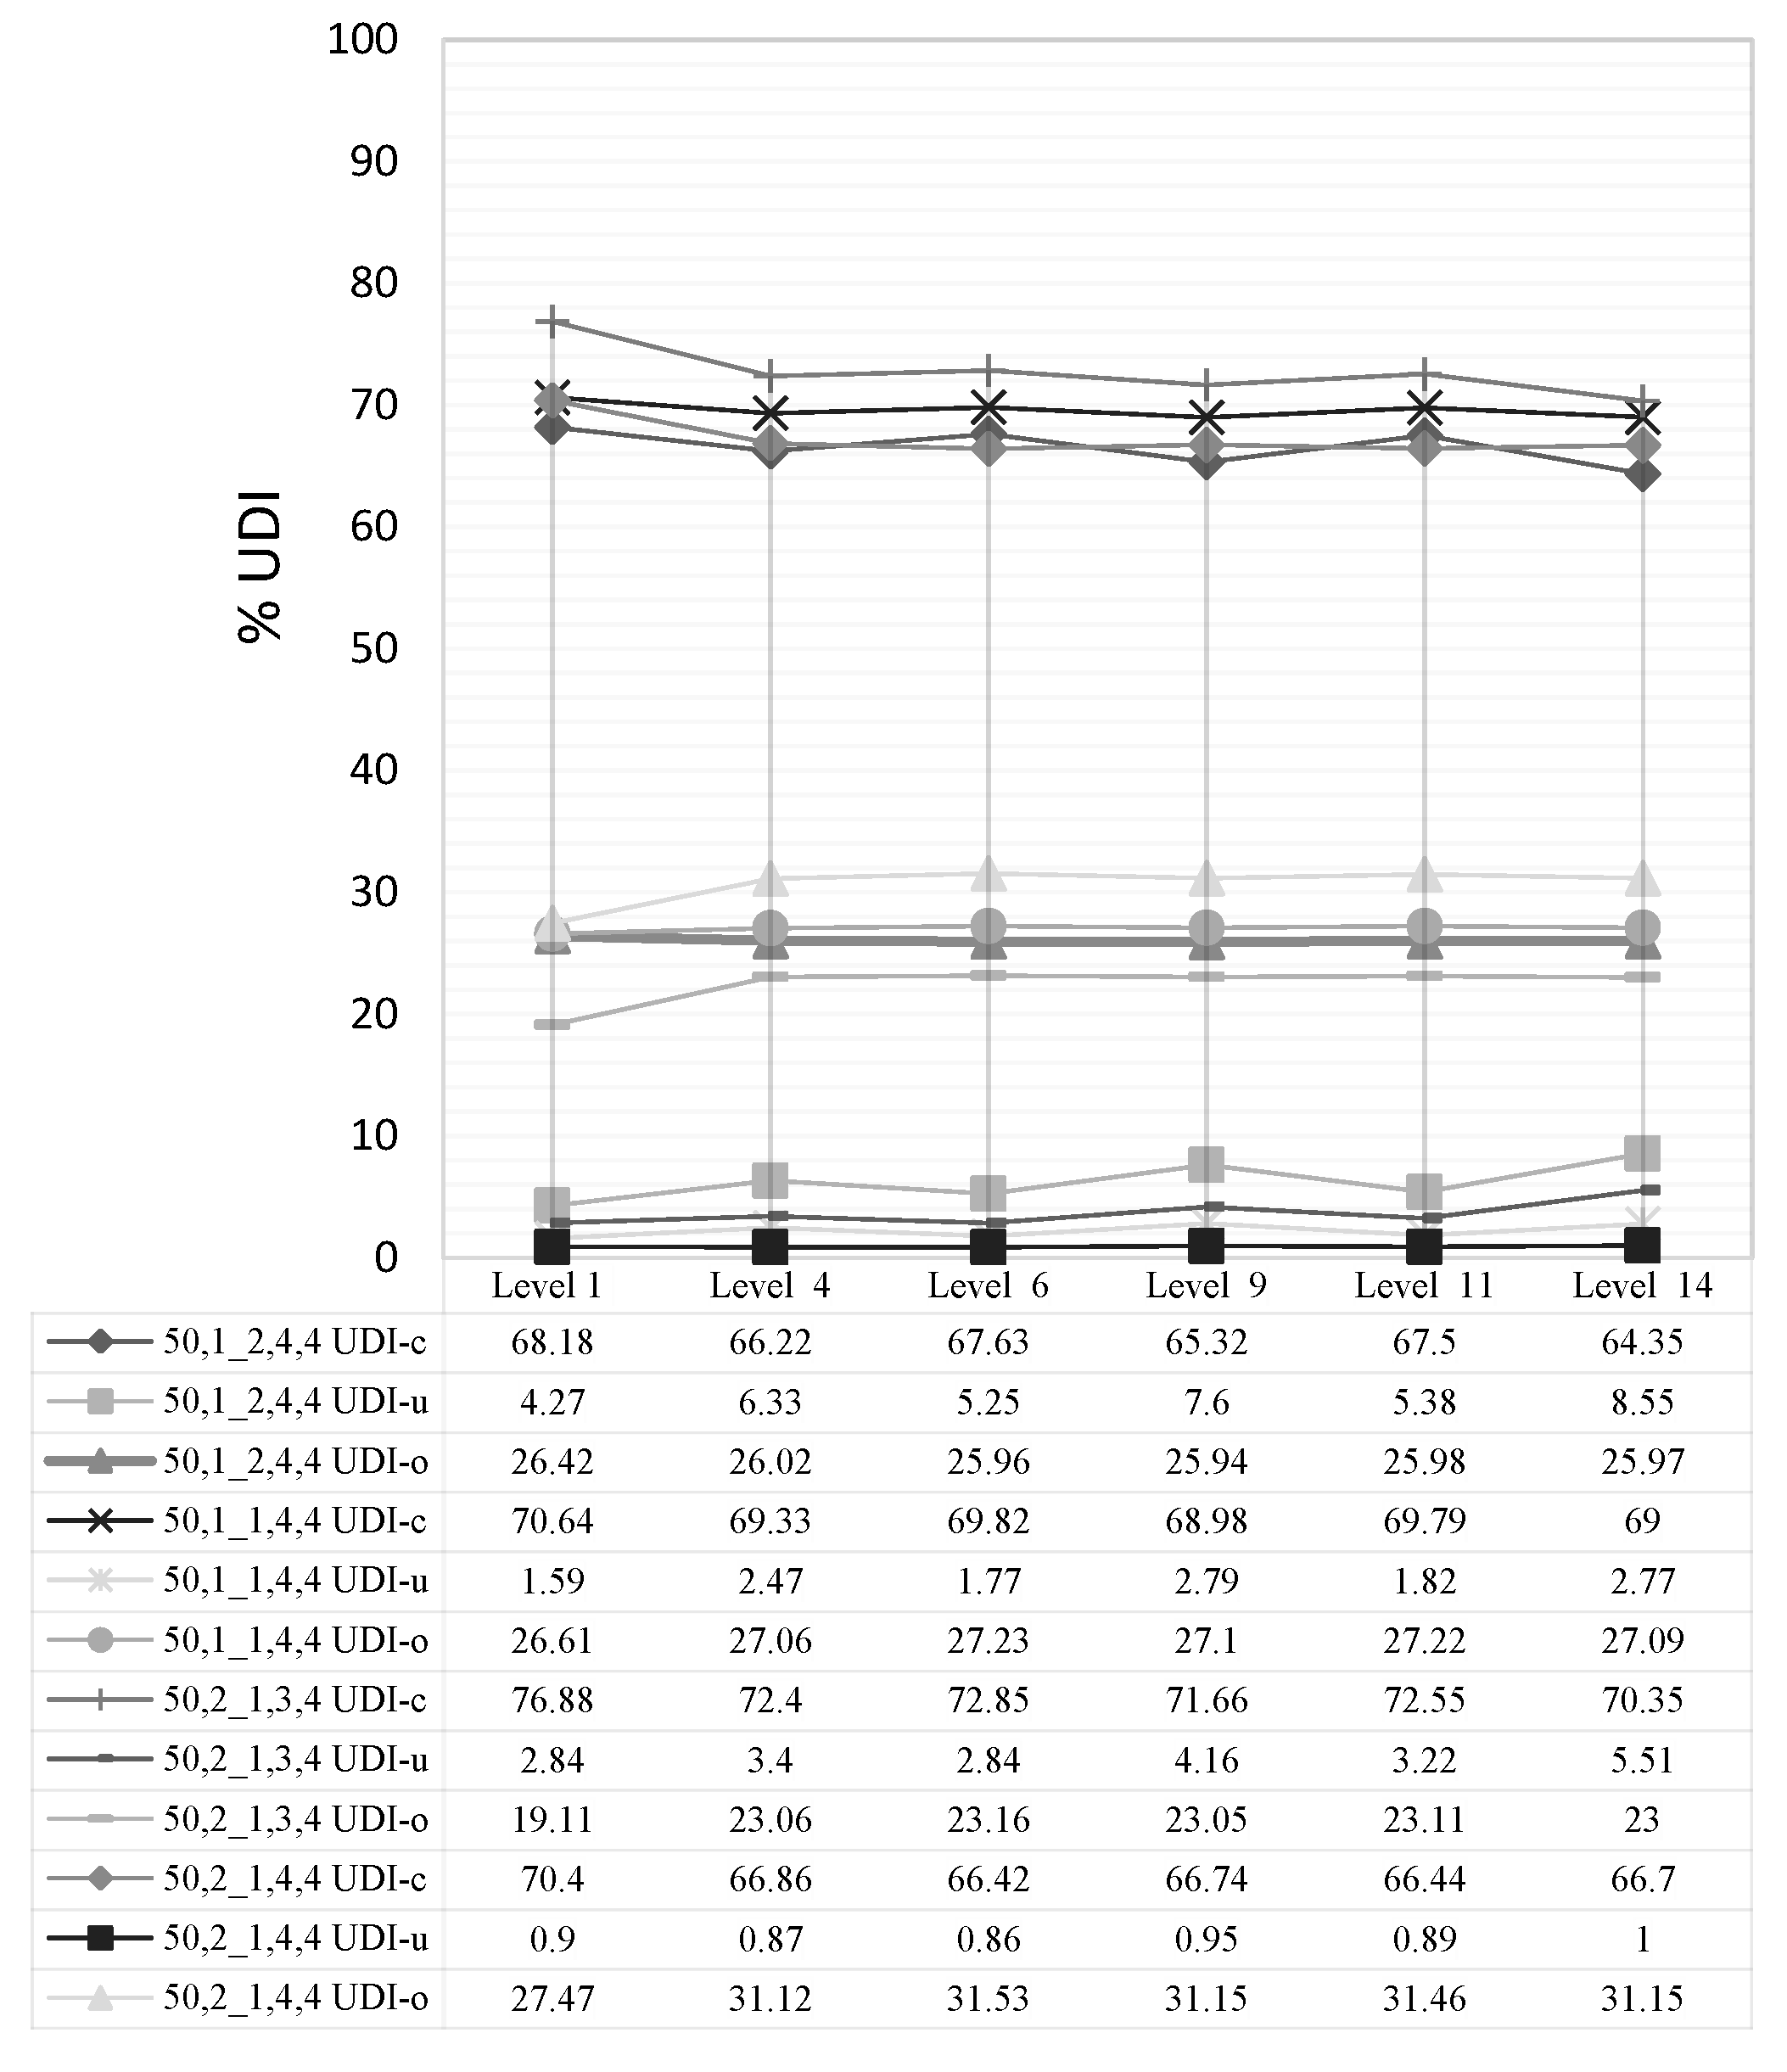
From the analysis of the results recorded in Scheme 2, with regard to the four geometric configurations chosen and described in Table 9, it is seen that the geometric ratios chosen are at heights of adjoining spaces between 3 and 4 m and at the lower proposed clerestory height corresponding to 4 m. Likewise, a homogenous illuminance behavior is seen in the different higher and lower floors evaluated, regardless of the clerestory orientations proposed, as in the case of the 30 × 30 m2 floor surface.
For this floor area, the UDI-o (>2000 lux) percentages are significantly lower than for the 30 × 30 m2 floor, while the UDI-c (100–2000 lux) percentage is higher, which shows a different illuminance behavior when compared to the floor area and the depth of the adjoining spaces. The UDI exceeded percentage corresponds in a large percentage to the areas adjoining the perimeter of the model’s façades.

4.3. Natural Lighting Contributions Reached by UDI Metric

The illuminance behavior by UDI ranges obtained from the optimized geometric configurations show, for the 30 × 30 m2 floor surface, the following percentages:
  • UDI-c (100–2000 lux) between 53% and 66%;
  • UDI-o (>2000 lux) between 30% and 42%, bearing in mind that the evaluation was made without any shading device on façades;
  • UDI-u (<100 lux), under 3%.
Likewise, for the 50 × 50 m2 floor surface, of the percentages are:
  • UDI-c (100–2000 lux) between 65% and 70%;
  • UDI-o (>2000 lux) between 25% and 27%, bearing in mind that the evaluation was made without any shading device on the façades;
  • UDI-u (<100 lux), under 9%.
The UDI-o results show the need of implementing an external façade design with shading elements to reduce exceedance illuminance and to considerably increase the UDI-c percentage.

5. Discussion

The previously discussed geometric configurations were chosen and represented the best UDI illuminance behavior regarding the maximum spatial saving. Using this, summary charts of these configurations and their respective PAR, SAR and WI index values were built. Likewise, design guidelines are defined in this section, obtained from the optimized results in the study in comparison with results of other research projects.
Upon evaluating the illuminance efficiency of the atrium in the adjoining spaces of the geometric configurations chosen and analyzed, three optimal geometric ratios were determined for the 30 × 30 m2 floor surface and two ratios for the 50 × 50 m2 floor surface, as shown in Table 10.

5.1. Atrium and Clerestories Ratio

The ratios on the 30 × 30m2 floor correspond to an atrium ratio of 1:2 and 1:1 (4% and 11% of the total floor area, respectively), with a clerestory height of 4 m and the floor-to-ceiling height option of between 3 and 4 m. The ratios in the 50 × 50 m2 floor, correspond to an atrium ratio of 1:2 and 1:1 (4% and 11% of the total floor area, respectively), with a clerestory height of 4 m and the floor-to-ceiling height of 4 m. Thus, the geometries corresponding to the 30 × 30 m2 floor show WI indices of between 1.2 and 2.7 for each four-floor group evaluated in the model. Likewise, for the two optimal configurations of the 50 × 50 m2 floor, they have WI values of between 1 and 1.6. Most of these WI values obtained also correspond to results found in the research of [6,17,19,25]. The configuration with a WI value of 2.7 on the 30 × 30 m2 floor surface that is not within these WI values found in the state-of-the-art does comply using the daylighting rule of thumb 2.5. This natural lighting percentage, along with the contribution of the central atrium, presented useful illuminance optimal values by simulation (see Figure 6). The daylighting rule 2.5 is a simple numerical expression that relates the design variables of the window-head-height and the depth of space, postulating that by side lighting, the light can penetrate at a distance equivalent to two or two and a half times the window height about the ground, satisfying the demand for daylighting for office tasks [38,39]. Furthermore, the Illuminating Engineering Society (IES) mentions that the rule can be more accurate when the light reflectance of the interior roof and walls is high, there are no major light obstructions on the outside, clear glazing and window widths equal half the length of the exterior perimeter are implemented and in overcast conditions or with solar control devices [40]. This rule was validated by Reinhart [41] under the most unfavorable daylighting conditions with an overcast sky.
On calculating the total WI value of the groups of 4 floors added to the clerestory levels that the evaluated 15-floor model is comprised of, it can be concluded that the evaluation allowed validating and optimizing, in terms of illumination, the index values of the WI well between 4.8 and 10 for the 30 × 30 m2 model and between 3.6 and 6.0 for the 50 × 50 m2 model (See Table 10).
The minimum acceptable ratio, h/H”, between the clerestory height (h) and atrium height (H) is evaluated to provide a suitable natural lighting level in the spaces adjoining the atrium, using the methodology of [18]. It is seen in Table 11 that the resulting ratio of the geometries chosen as optimal corresponds to h/H= 2/6 and 2/8 as minimum acceptable values. These values are directly associated with the floor-to-ceiling height that determines the total height of the four-floor atrium (see Table 12). These ratio values, in comparison to those of phase I of the evaluation and the minimum value determined by Ghasemi h/H = 3/8, show the spatial optimization of the atrium when the adjoining spaces receive light from two lighting sources simultaneously.

5.2. Orientation of Clerestories

The orientation of clerestories is a variable that works in the same way for all orientations evaluated in the study, in that in the assessment, it includes a WWR of 40% on the façades since the results obtained were considerably homogeneous regardless of this factor. To conclude, this design factor must be considered in this case, starting from the conditions of the urban setting of the project and the available direct sunlight.

5.3. Reflectance Coefficients for Materials and Finishing of Opaque Surfaces

The reflectance coefficient values implemented in the materials of the opaque geometric surfaces of the model, presented in Table 7, correspond to that referenced in the national TDRe standard [35] and international standards, such as ISO 8995:2002 (E) (CIE S 008/E: 2002), EN 12464-1 and IESNA (Illuminating Engineering Society of North America) [33,34]. Using the climate of Santiago de Chile and the influence that material characteristics have on the environmental design of spaces as a starting point, the implementation of a high luminous transmittance coefficient is favorable with a lower thermal transmittance coefficient for the glazed surfaces of the atrium clerestories and façades of the model. With these material features, optimal illuminance transmittance values and a suitable thermal control in indoor spaces are assured. In the same way, for the glazed surfaces on the atrium walls, a simple glazing material with a high illuminance transmittance coefficient can be implemented, as not receiving sunlight incidence permanently on these surfaces means that the implementation of a double hermetic glass (dvh) for thermal control in the building core is deemed as unnecessary. However, an in-depth study is needed about the behavior of this design guideline inside the atrium and the adjoining spaces if so required.

5.4. Window-to-Wall Ratio (WWR)

The variability of the window percentage by floors in the atrium is an important design variable associated with the reflectance and illuminance transmission coefficients of the surface materials, as well as the areas that each materiality represents. Researchers such as [17,19,26] have used them in their central atrium studies.
When the area of the opaque surfaces of the higher floors is greater and reduces in percentages to the lower floors of the atrium, it is possible to obtain important reflections of indoor light in order to:
-
Reach higher levels of illumination inside the atrium and adjoining spaces of the lower floors;
-
Allow the excessive control of illumination on the higher floors;
-
Build a balance between the areas of opaque surfaces and glazed areas.
Window percentages of 90%, 80%, 50% and 40% from the highest floors (of each four-floor block) were the ratio that allows the best illuminance behavior starting from the UDI metric for the floors of the atrium and the adjoining spaces. Table 12 summarizes the design guidelines obtained from the optimized geometric configurations for the implementation of a vertical central atrium in high-rise buildings:

6. Conclusions

The implementation of a vertical central light atrium with clerestories every four floors in buildings of 15 floors (or more) on floor surface areas between 900 m2 and 2500 m2 and without considering solar control devices on façades ended up being an effective natural lighting strategy regarding the UDI (100–2000 lux) indicator to resolve the lack of natural lighting that high-rise buildings with large floor surface areas commonly have. This allows for illuminance behavior with significant indoor natural lighting for 50% to 70% of the year, contributing to suitable natural light contributions that benefit the visual comfort of the occupants. Although the research was not able to establish the economic reduction accurately through the reduction in energy demand with the implementation of the atrium, the lighting results allow associating an operational energy demand reduction for the artificial lighting in these buildings.
The chosen geometric ratios show the optimization of the geometric criteria and the economy of space regarding the high inputs of natural lighting. This confirmed that for 30 × 30 m2 floor configurations, it can be stated that minimum values of the geometric variables of floor-to-ceiling height in adjoining spaces and clerestories, as well as a lower 1:2 atrium ratio, corresponding to 4% of the floor surface occupation, are specified to manifest optimal UDI-c values. Likewise, for the 50 × 50 m2 plan, the minimum values in the design variables for clerestory height and atrium ratio of 1:2 to obtain higher lighting contributions through the UDI metric are also specified. All geometric variables proposed for the assessment could contribute to the optimal lighting of floor surfaces over 2500 m2.
The lighting contribution from WWR on façades and atrium surfaces shows a homogeneous natural light distribution for all floors of the parametric model proposed. Important UDI-c values were seen, as well as high UDI-o percentages on the external perimeters of the evaluated floors, demonstrating the need for implementing solar protections on façades in the design of these buildings to control lighting exceedance inside spaces adjoining the atrium in order to reach UDI-c ranges above those obtained in the evaluations.
Given that the light distributions and UDI values on the work place of the adjoining spaces are seen to be balanced, regardless of the orientation of clerestories for the entry of light, it is considered that this design variable will mainly depend on the possibilities or limitations regarding the direct incidence of natural light that the urban context where the project is located allows.
Most research made considering the optimal geometric conditions for light performance in vertical central atriums presented similar design guidelines and homogeneous results. This helped us to validate the results obtained in the illuminance assessment.

Author Contributions

The following statements should be used “Conceptualization, A.S.-P. and M.B.P.-M.; methodology, A.S.-P. and M.B.P.-M.; software, A.S.-P.; formal analysis, A.S.-P.; investigation, A.S.-P.; writing-original draft preparation, A.S.-P.; writing-review and editing, A.S.-P. and M.B.P.-M.; supervision, M.B.P.-M. All authors have read and agreed to the published version of the manuscript.”

Funding

This research received no external funding.

Acknowledgments

This research was made within the framework of the Masters’ Program in “Hábitat Sustentable y Eficiencia Energética” at the University of Bio-Bio. In addition, we would like to acknowledge to the research group “Confort ambiental y pobreza energética (+CO-PE)” of the University of the Bío-Bío for supporting this research.

Conflicts of Interest

The authors declare no conflict of interest.

Appendix A

Table A1. General results on UDI ranges in 30 × 30 m2 floor.
FLOOR CODEUDI LEVEL 1 LEVEL 4LEVEL 6LEVEL 9LEVEL 11LEVEL 14
30,1_2,3,4UDIc65.96%65.32%65.68%64.69%65.66%65.02%
UDI Underlit1.72%2.24%1.91%2.93%1.91%2.59%
UDI Overlit31.16%31.26%31.22%31.23%31.26%31.21%
30,1_2,3,6
UDIc66.1%65.78%65.86%65.42%65.76%65.63%
UDI Underlit1.64%1.69%1.73%2.27%1.84%1.94%
UDI Overlit31.1%31.37%31.25%31.15%31.23%31.23%
30,1_2,3,8
UDIc66.17%66.04%65.99%65.75%65.73%65.75%
UDI Underlit1.52%1.33%1.7%1.88%1.9%1.75%
UDI Overlit31.19%31.43%31.16%31.25%31.21%31.35%
30,1_2,4,4
UDIc53.84%56.69%56.43%56.5%56.42%56.68%
UDI Underlit0.51%0.52%0.51%0.57%0.47%0.57%
UDI Overlit44.49%41.62%41.89%41.78%41.94%41.59%
30,1_2,4,6
UDIc53.86%56.55%56.5%56.68%56.43%56.63%
UDI Underlit0.52%0.5%0.5%0.55%0.47%0.54%
UDI Overlit44.48%41.75%41.87%41.65%41.94%41.68%
30,1_2,4,8
UDIc54%56.6%56.35%56.8%56.5%56.61%
UDI Underlit0.5%0.34%0.49%0.45%0.5%0.45%
UDI Overlit44.33%41.89%42.04%41.56%41.86%41.77%
30,1_1,3,4
UDIc66.37%66.48%66.09%66.29%66.08%66.34%
UDI Underlit1.06%1.06%1.15%1.31%1.19%1.18%
UDI Overlit31.37%31.31%31.55%31.26%31.52%31.25%
30,1_1,3,6
UDIc66.46%66.48%66.18%66.52%66.03%66.25%
UDI Underlit0.97%0.75%1.12%1.06%1.15%1.06%
UDI Overlit31.39%31.61%31.51%31.27%31.61%31.51%
30,1_1,3,8
UDIc66.47%66.18%66%66.59%66.15%66.23%
UDI Underlit0.94%0.5%1.15%0.79%1.09%0.82%
UDI Overlit31.4%32.1%31.64%31.42%31.57%31.7%
30,1_1,4,4
UDIc51.94%56.16%55.08%56.27%55.31%56.17%
UDI Underlit0.26%0.3%0.27%0.34%0.28%0.32%
UDI Overlit46.56%42.33%43.43%42.2%43.23%42.32%
30,1_1,4,6
UDIc51.97%55.63%54.89%56.08%55%55.97%
UDI Underlit0.2%0.18%0.29%0.25%0.25%0.26%
UDI Overlit46.61%42.99%43.61%42.46%43.5%42.56%
30,1_1,4,8
UDIc51.87%54.72%54.64%55.95%54.86%55.46%
UDI Underlit0.23%0.02%0.28%0.18%0.27%0.17%
UDI Overlit46.66%44.01%43.86%42.68%43.68%43.17%
30,2_1,3,4
UDIc64.22%58.64%58.81%59.11%58.89%59.13%
UDI Underlit0.47%0.44%0.51%0.56%0.48%0.59%
UDI Overlit34.06%39.71%39.48%39.13%39.41%39.07%
30,2_1,3,6
UDIc61.76%57.84%58.59%59.07%58.78%58.53%
UDI Underlit0.36%0.1%0.46%0.39%0.47%0.42%
UDI Overlit36.65%40.75%39.72%39.37%39.54%39.86%
30,2_1,3,8
UDIc58.04%54.66%58.34%58.65%57.76%57.58%
UDI Underlit0.17%0.01%0.32%0.18%0.39%0.24%
UDI Overlit40.46%44.1%40.12%39.96%40.63%40.93%
30,2_1,4,4
UDIc41.03%43.73%41.33%45.06%41.81%45.19%
UDI Underlit0%0.03%0%0.05%0%0.09%
UDI Overlit57.81%55.08%57.51%53.74%57.02%53.53%
30,2_1,4,6
UDIc38.22%40.84%39.22%44.32%40.05%43.49%
UDI Underlit0%0%00.03%0%0.07%
UDI Overlit60.68%57.99%59.63%54.44%58.76%55.26%
30,2_1,4,8
UDIc34.05%34.62%37.82%41.94%39.52%41.26%
UDI Underlit0%0%0%0.03%0%0.05%
UDI Overlit64.86%64.31%61.06%56.93%59.34%57.56%
Table A2. General results of UDI ranges on a 5 × 50 m2 floor.
FLOOR CODEUDI LEVEL 1 LEVEL 4LEVEL 6LEVEL 9LEVEL 11LEVEL 14
50,1_2,3,4UDIc47.60%45.27%46.81%46.08%46.40%45.76%
UDI Underlit32.36%34.44%32.84%33.63%33.24%33.95%
UDI Overlit18.93%19.29%19.30%19.30%19.33%19.28%
50,1_2,3,6
UDIc48.09%49.28%48.97%46.96%46.93%47.32%
UDI Underlit31.90%30.36%30.66%32.76%32.68%32.35%
UDI Overlit18.92%19.30%19.30%19.28%19.32%19.29%
50,1_2,3,8
UDIc49.39%54.39%51.59%50.27%48.92%50.64%
UDI Underlit30.56%25.27%28.05%29.42%30.71%28.99%
UDI Overlit18.95%19.27%19.29%19.29%19.32%19.31%
50,1_2,4,4
UDIc68.18%66.22%67.63%65.32%67.50%64.35%
UDI Underlit4.27%6.33%5.25%7.60%5.38%8.55%
UDI Overlit26.42%26.02%25.96%25.94%25.98%25.97%
50,1_2,4,6
UDIc68.10%68.16%68.22%66.45%68.02%66.82%
UDI Underlit4.46%4.77%4.55%6.45%4.79%6.07%
UDI Overlit26.30%25.91%26.08%25.95%26.03%25.98%
50,1_2,4,8
UDIc68.60%69.50%69.10%67.83%68.36%67.87%
UDI Underlit3.78%3.36%3.74%5.06%4.45%4.98%
UDI Overlit26.48%25.99%26.02%25.98%26.04%26.02%
50,1_1,3,4
UDIc60.52%57.53%58.41%53.52%56.81%51.74%
UDI Underlit19.42%21.28%20.37%25.27%21.92%27.05%
UDI Overlit18.94%20.08%20.11%20.11%20.17%20.13%
50,1_1,3,6
UDIc63.28%68.15%65.75%61.63%61.94%61.01%
UDI Underlit16.68%10.63%13%17.15%16.79%17.73%
UDI Overlit18.91%20.10%20.14%20.13%20.14%20.13%
50,1_1,3,8
UDIc64.59%71.16%69.04%66.92%64.89%65.39%
UDI Underlit15.34%7.57%9.71%11.88%13.85%13.31%
UDI Overlit18.96%20.19%20.13%20.09%20.13%20.15%
50,1_1,4,4
UDIc70.64%69.33%69.82%68.98%69.79%69%
UDI Underlit1.59%2.47%1.77%2.79%1.82%2.77%
UDI Overlit26.61%27.06%27.23%27.10%27.22%27.09%
50,1_1,4,6
UDIc70.56%69.96%69.95%69.60%69.88%69.54%
UDI Underlit1.59%1.77%1.58%2.19%1.74%2.17%
UDI Overlit26.68%27.10%27.32%27.06%27.22%27.10%
50,1_1,4,8
UDIc70.58%70.33%70.02%69.96%69.97%70%
UDI Underlit1.57%1.25%1.59%1.75%1.66%1.66%
UDI Overlit26.67%27.27%27.22%27.14%27.20%27.17%
50,2_1,3,4
UDIc76.88%72.40%72.85%71.66%72.55%70.35%
UDI Underlit2.84%3.40%2.84%4.16%3.22%5.51%
UDI Overlit19.11%23.06%23.16%23.05%23.11%23%
50,2_1,3,6
UDIc77.31%73.78%73.21%73.19%73.24%72.96%
UDI Underlit2.34%1.99%2.49%2.67%2.50%2.84%
UDI Overlit19.22%23.09%23.18%23.01%23.12%23.05%
50,2_1,3,8
UDIc77.72%74.12%73.60%73.64%73.38%73.56%
UDI Underlit1.77%1.38%2.07%2.12%2.15%2.11%
UDI Overlit19.34%23.32%23.17%23.10%23.29%23.14%
50,2_1,4,4
UDIc70.40%66.86%66.42%66.74%66.44%66.70%
UDI Underlit0.90%0.87%0.86%0.95%0.89%1%
UDI Overlit27.47%31.12%31.53%31.15%31.46%31.15%
50,2_1,4,6
UDIc70.40%66.53%66.33%66.60%66.39%66.74%
UDI Underlit0.84%0.79%0.86%0.91%0.87%0.92%
UDI Overlit27.54%31.52%31.62%31.35%31.55%31.16%
50,2_1,4,8
UDIc70.41%66.43%66.19%66.72%63.71%66.43%
UDI Underlit0.75%0.58%0.86%0.76%0.87%0.83%
UDI Overlit27.58%31.80%31.78%31.36%31.60%31.57%

Appendix B

Table A3. Graphical results of the lighting evaluation for the chosen optimized configurations.
Geometric Configuration Code: 30,1_2, 3, 4
30,1_2,3,4UDI-c (% Time 100-2000lux)
Sustainability 12 06651 i010
UDI-u (% Time <100lux)
Sustainability 12 06651 i011
UDI-o (% Time >2000 lux)
Sustainability 12 06651 i012
65.96%1.72%31.16%
FLOOR 1 Sustainability 12 06651 i013 Sustainability 12 06651 i014 Sustainability 12 06651 i015
65.32%2.24%31.26%
FLOOR 4 Sustainability 12 06651 i016 Sustainability 12 06651 i017 Sustainability 12 06651 i018
65.68%1.91%31.22%
FLOOR 6 Sustainability 12 06651 i019 Sustainability 12 06651 i020 Sustainability 12 06651 i021
64.69%2.93%31.23%
FLOOR 9 Sustainability 12 06651 i022 Sustainability 12 06651 i023 Sustainability 12 06651 i024
65.66%1.91%31.26%
FLOOR 11 Sustainability 12 06651 i025 Sustainability 12 06651 i026 Sustainability 12 06651 i027
65.02%2.59%31.21%
FLOOR 14 Sustainability 12 06651 i028 Sustainability 12 06651 i029 Sustainability 12 06651 i030
Geometric configuration code: 30,1_2, 4,4.
30,1_2,4,4UDI-c (% Time 100–2000 lux)
Sustainability 12 06651 i031
UDI-u (% Time <100 lux)
Sustainability 12 06651 i032
UDI-o (% Time >2000 lux)
Sustainability 12 06651 i033
53. 84%0.51%44.49%
FLOOR 1 Sustainability 12 06651 i034 Sustainability 12 06651 i035 Sustainability 12 06651 i036
56.69%0.52%41.61%
FLOOR 4 Sustainability 12 06651 i037 Sustainability 12 06651 i038 Sustainability 12 06651 i039
56.43%0.51%41.89%
FLOOR 6 Sustainability 12 06651 i040 Sustainability 12 06651 i041 Sustainability 12 06651 i042
56.5%0.57%41.78%
FLOOR 9 Sustainability 12 06651 i043 Sustainability 12 06651 i044 Sustainability 12 06651 i045
56.42%0.47%41.94%
FLOOR 11 Sustainability 12 06651 i046 Sustainability 12 06651 i047 Sustainability 12 06651 i048
56.68%0.57%41.59%
FLOOR 14 Sustainability 12 06651 i049 Sustainability 12 06651 i050 Sustainability 12 06651 i051
Geometric configuration code: 30,1_1, 3,4.
30,1_1,3,4.UDI-c (% Time 100–2000 lux)
Sustainability 12 06651 i052
UDI-u (% Time <100 lux)
Sustainability 12 06651 i053
UDI-o (% Time >2000 lux)
Sustainability 12 06651 i054
66.37%1.06%31.37%
FLOOR 1 Sustainability 12 06651 i055 Sustainability 12 06651 i056 Sustainability 12 06651 i057
66.48%1.06%31.31%
FLOOR 4 Sustainability 12 06651 i058 Sustainability 12 06651 i059 Sustainability 12 06651 i060
66.09%1.15%31.55%
FLOOR 6 Sustainability 12 06651 i061 Sustainability 12 06651 i062 Sustainability 12 06651 i063
66.29%1.31%31.26%
FLOOR 9 Sustainability 12 06651 i064 Sustainability 12 06651 i065 Sustainability 12 06651 i066
66.08%1.19%31.52%
FLOOR 11 Sustainability 12 06651 i067 Sustainability 12 06651 i068 Sustainability 12 06651 i069
66.34%1.18%31.25%
FLOOR 14 Sustainability 12 06651 i070 Sustainability 12 06651 i071 Sustainability 12 06651 i072
Geometric configuration code: 30,1_1, 4,4.
30,1_1,4,4UDI-c (% Time 100–2000 lux)
Sustainability 12 06651 i073
UDI-u (% Time <100 lux)
Sustainability 12 06651 i074
UDI-o (% Time >2000 lux)
Sustainability 12 06651 i075
51.94%0.26%46.56%
FLOOR 1 Sustainability 12 06651 i076 Sustainability 12 06651 i077 Sustainability 12 06651 i078
56.16%0.3%42.33%
FLOOR 4 Sustainability 12 06651 i079 Sustainability 12 06651 i080 Sustainability 12 06651 i081
55.08%0.27%43.43%
FLOOR 6 Sustainability 12 06651 i082 Sustainability 12 06651 i083 Sustainability 12 06651 i084
56.27%0.34%42.2%
FLOOR 9 Sustainability 12 06651 i085 Sustainability 12 06651 i086 Sustainability 12 06651 i087
55.31%0.28%43.23%
FLOOR 11 Sustainability 12 06651 i088 Sustainability 12 06651 i089 Sustainability 12 06651 i090
56.17%0.32%42.32%
FLOOR 14 Sustainability 12 06651 i091 Sustainability 12 06651 i092 Sustainability 12 06651 i093
Geometric configuration code: 30, 2:1, 3,4.
30,2_1,3,4UDI-c (% Time 100–2000 lux)
Sustainability 12 06651 i094
UDI-u (% Time <100 lux)
Sustainability 12 06651 i095
UDI-o (% Time >2000 lux)
Sustainability 12 06651 i096
64.22%0.47%34.06%
FLOOR 1 Sustainability 12 06651 i097 Sustainability 12 06651 i098 Sustainability 12 06651 i099
58.64%0.44%39.71%
FLOOR 4 Sustainability 12 06651 i100 Sustainability 12 06651 i101 Sustainability 12 06651 i102
58.81%0.51%39.48%
FLOOR 6 Sustainability 12 06651 i103 Sustainability 12 06651 i104 Sustainability 12 06651 i105
59.11%0.56%39.13%
FLOOR 9 Sustainability 12 06651 i106 Sustainability 12 06651 i107 Sustainability 12 06651 i108
58.89%0.48%39.41%
FLOOR 11 Sustainability 12 06651 i109 Sustainability 12 06651 i110 Sustainability 12 06651 i111
59.13%0.59%39.07%
FLOOR 14 Sustainability 12 06651 i112 Sustainability 12 06651 i113 Sustainability 12 06651 i114
Geometric configuration code: 30,2_1, 4,4
30,2_1,4,4UDI-c (% Time 100–2000 lux)
Sustainability 12 06651 i115
UDI-u (% Time <100 lux)
Sustainability 12 06651 i116
UDI-o (% Time >2000 lux)
Sustainability 12 06651 i117
41.03%0%57.81%
FLOOR 1 Sustainability 12 06651 i118 Sustainability 12 06651 i119 Sustainability 12 06651 i120
43.73%0.03%55.08%
FLOOR 4 Sustainability 12 06651 i121 Sustainability 12 06651 i122 Sustainability 12 06651 i123
41.33%0%57.51%
FLOOR 6 Sustainability 12 06651 i124 Sustainability 12 06651 i125 Sustainability 12 06651 i126
45.06%0.05%53.74%
FLOOR 9 Sustainability 12 06651 i127 Sustainability 12 06651 i128 Sustainability 12 06651 i129
41.81%0%57.02%
FLOOR 11 Sustainability 12 06651 i130 Sustainability 12 06651 i131 Sustainability 12 06651 i132
45.19%0.09%53.53%
FLOOR 14 Sustainability 12 06651 i133 Sustainability 12 06651 i134 Sustainability 12 06651 i135
Geometric configuration code: 50,1_2, 4,4
50,1_2,4,4UDI-c (% Time 100–2000 lux)
Sustainability 12 06651 i136
UDI-u (% Time <100 lux)
Sustainability 12 06651 i137
UDI-o (% Time >2000 lux)
Sustainability 12 06651 i138
68.18%4.27%26.42%
FLOOR 1 Sustainability 12 06651 i139 Sustainability 12 06651 i140 Sustainability 12 06651 i141
66.22%6.33%26.02%
FLOOR 4 Sustainability 12 06651 i142 Sustainability 12 06651 i143 Sustainability 12 06651 i144
67.63%5.25%25.96%
FLOOR 6 Sustainability 12 06651 i145 Sustainability 12 06651 i146 Sustainability 12 06651 i147
65.32%7.6%25.94%
FLOOR 9 Sustainability 12 06651 i148 Sustainability 12 06651 i149 Sustainability 12 06651 i150
67.5%5.38%25.98%
FLOOR 11 Sustainability 12 06651 i151 Sustainability 12 06651 i152 Sustainability 12 06651 i153
64.35%8.55%25.97%
FLOOR 14 Sustainability 12 06651 i154 Sustainability 12 06651 i155 Sustainability 12 06651 i156
Geometric configuration code: 50,1_1, 4,4
50,1_1,4,4UDI-c (% Time 100–2000 lux)
Sustainability 12 06651 i157
UDI-u (% Time <100 lux)
Sustainability 12 06651 i158
UDI-o (% Time >2000 lux)
Sustainability 12 06651 i159
70.64%1.59%26.61%
FLOOR 1 Sustainability 12 06651 i160 Sustainability 12 06651 i161 Sustainability 12 06651 i162
69.33%2.47%27.06%
FLOOR 4 Sustainability 12 06651 i163 Sustainability 12 06651 i164 Sustainability 12 06651 i165
69.82%1.77%27.23%
FLOOR 6 Sustainability 12 06651 i166 Sustainability 12 06651 i167 Sustainability 12 06651 i168
68.98%2.79%27.1%
FLOOR 9 Sustainability 12 06651 i169 Sustainability 12 06651 i170 Sustainability 12 06651 i171
69.79%1.82%27.22%
FLOOR 11 Sustainability 12 06651 i172 Sustainability 12 06651 i173 Sustainability 12 06651 i174
69%2.77%27.09%
FLOOR 14 Sustainability 12 06651 i175 Sustainability 12 06651 i176 Sustainability 12 06651 i177
Geometric configuration code: 50,2_1, 3,4
50,2_1,3,4UDI-c (% Time 100–2000 lux)
Sustainability 12 06651 i178
UDI-u (% Time <100 lux)
Sustainability 12 06651 i179
UDI-o (% Time >2000 lux)
Sustainability 12 06651 i180
76.88%2.84%19.11%
FLOOR 1 Sustainability 12 06651 i181 Sustainability 12 06651 i182 Sustainability 12 06651 i183
72.4%3.4%23.06%
FLOOR 4 Sustainability 12 06651 i184 Sustainability 12 06651 i185 Sustainability 12 06651 i186
72.85%2.84%23.16%
FLOOR 6 Sustainability 12 06651 i187 Sustainability 12 06651 i188 Sustainability 12 06651 i189
71.66%4.16%23.05%
FLOOR 9 Sustainability 12 06651 i190 Sustainability 12 06651 i191 Sustainability 12 06651 i192
72.55%3.22%23.11%
FLOOR 11 Sustainability 12 06651 i193 Sustainability 12 06651 i194 Sustainability 12 06651 i195
70.35%5.51%23%
FLOOR 14 Sustainability 12 06651 i196 Sustainability 12 06651 i197 Sustainability 12 06651 i198
Geometric configuration code: 50,2_1, 4,4
50,2_1,4,4UDI-c (% Time 100–2000 lux)
Sustainability 12 06651 i199
UDI-u (% Time <100 lux)
Sustainability 12 06651 i200
UDI-o (% Time >2000 lux)
Sustainability 12 06651 i201
70.4%0.9%27.47%
FLOOR 1 Sustainability 12 06651 i202 Sustainability 12 06651 i203 Sustainability 12 06651 i204
66.86%0.87%31.12%
FLOOR 4 Sustainability 12 06651 i205 Sustainability 12 06651 i206 Sustainability 12 06651 i207
66.42%0.86%31.53%
FLOOR 6 Sustainability 12 06651 i208 Sustainability 12 06651 i209 Sustainability 12 06651 i210
66.74%0.95%31.15%
FLOOR 9 Sustainability 12 06651 i211 Sustainability 12 06651 i212 Sustainability 12 06651 i213
66.44%0.89%31.46%
FLOOR 11 Sustainability 12 06651 i214 Sustainability 12 06651 i215 Sustainability 12 06651 i216
66.7%1%31.15%
FLOOR 14 Sustainability 12 06651 i217 Sustainability 12 06651 i218 Sustainability 12 06651 i219

Appendix C

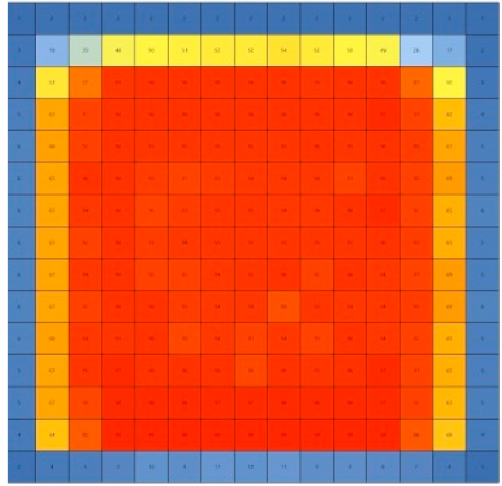
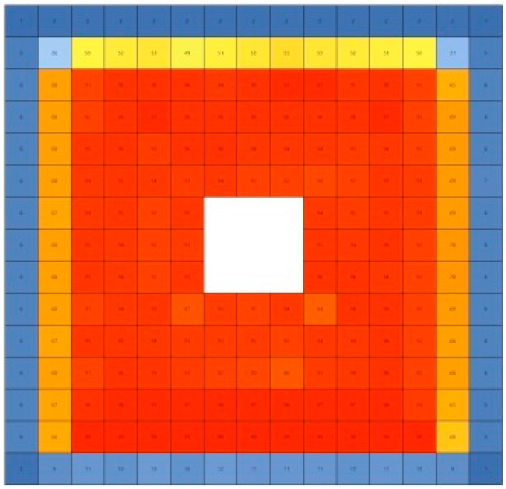
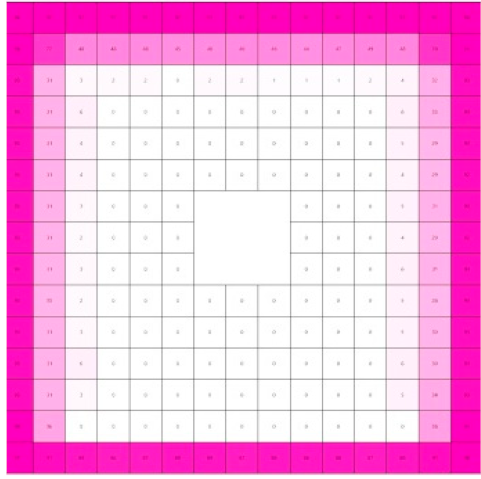
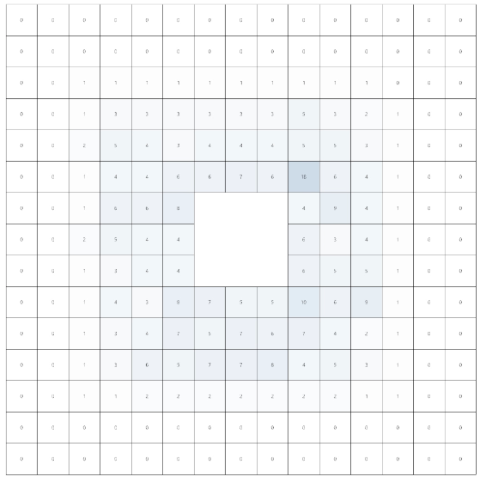
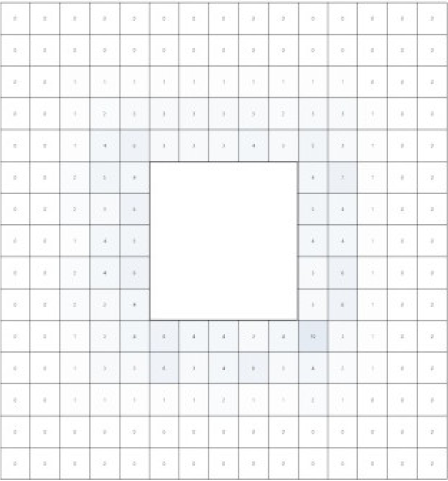
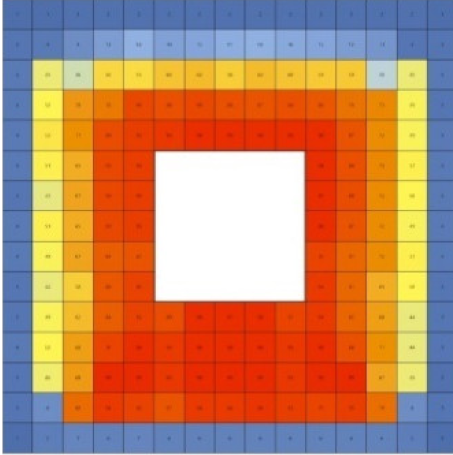
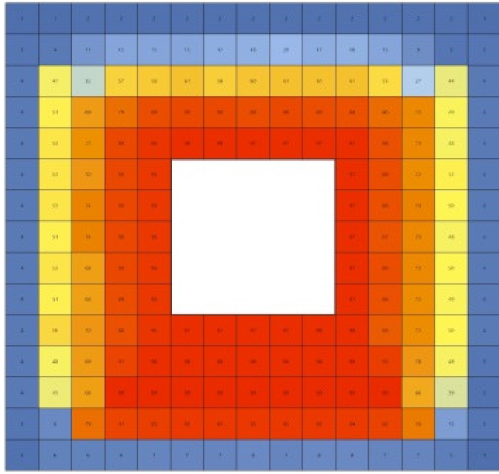
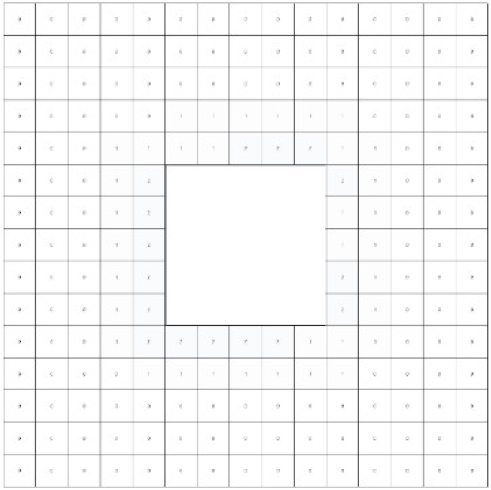
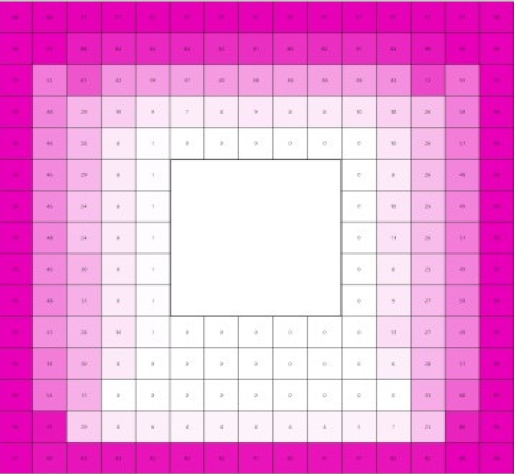
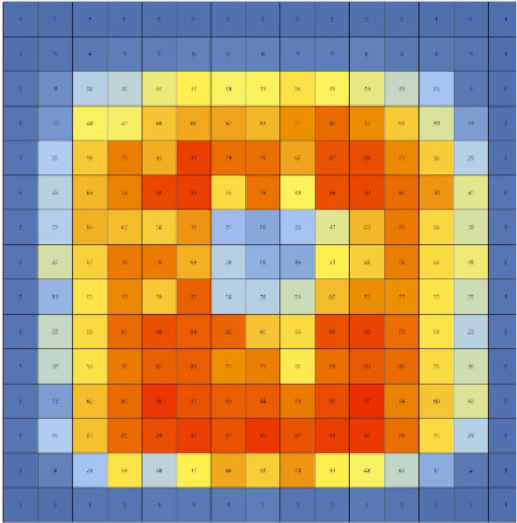
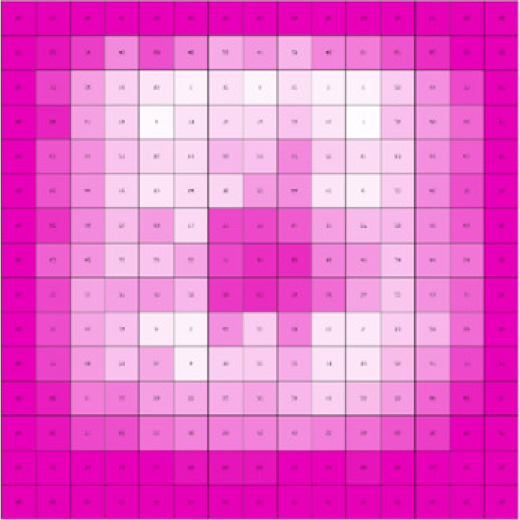
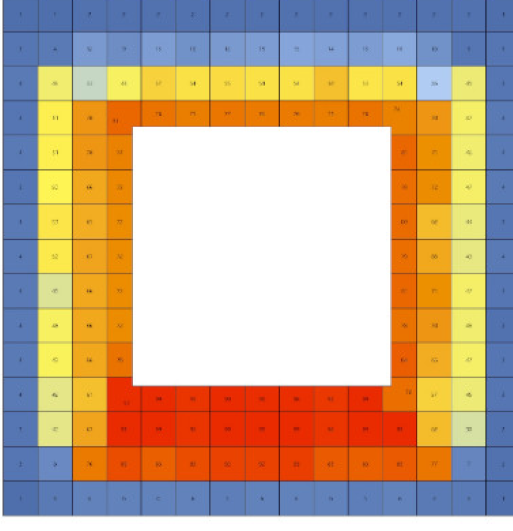
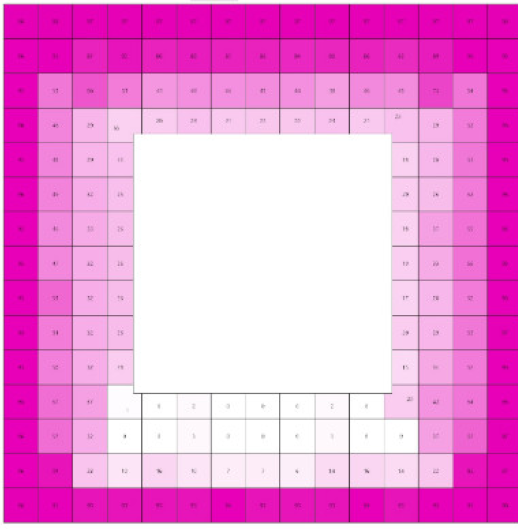
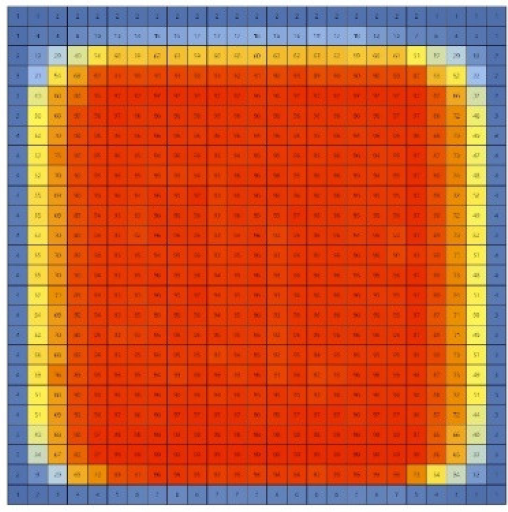
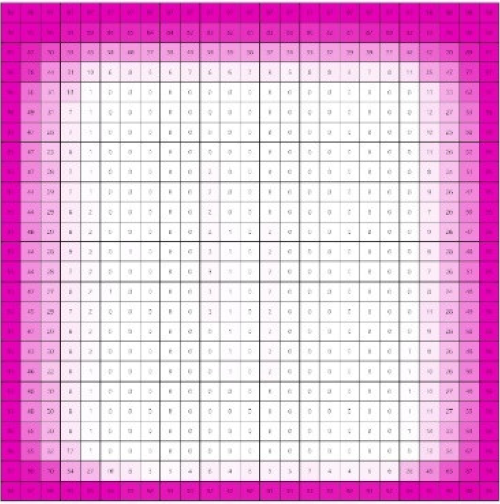
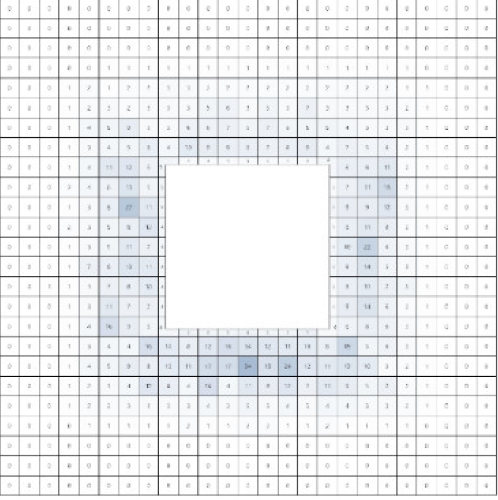
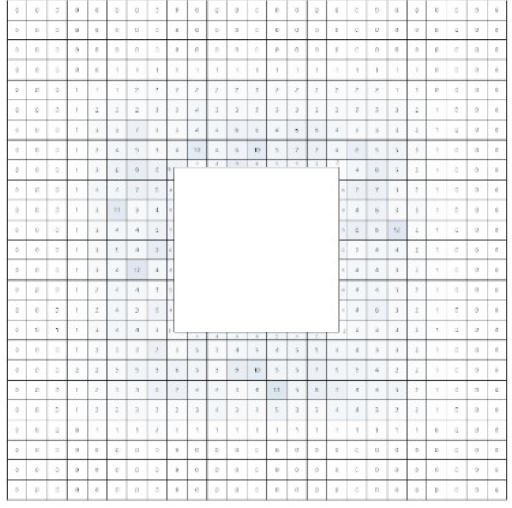
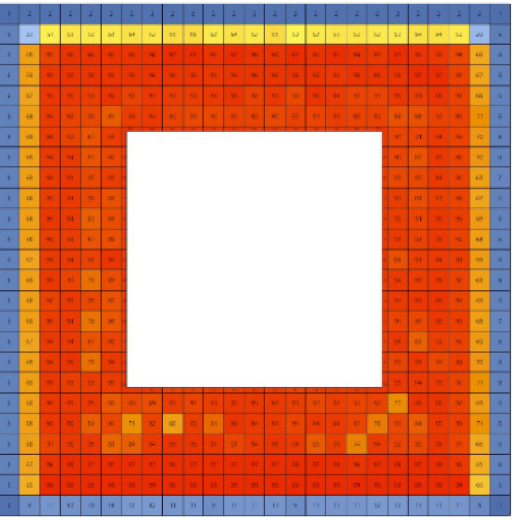
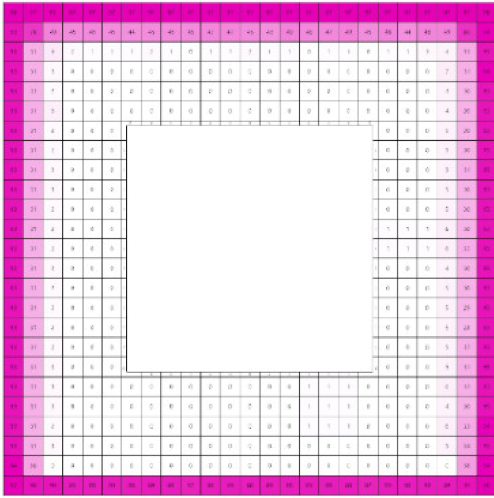
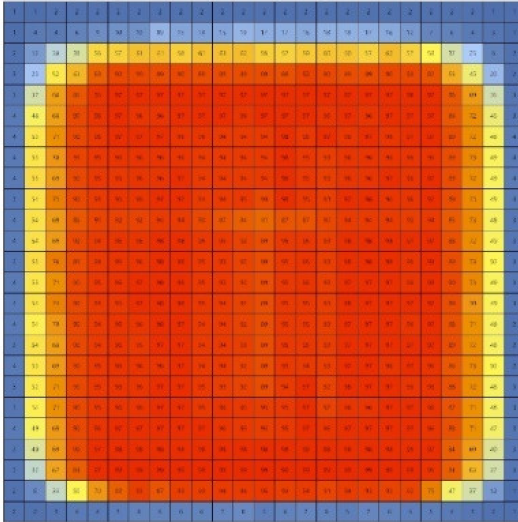
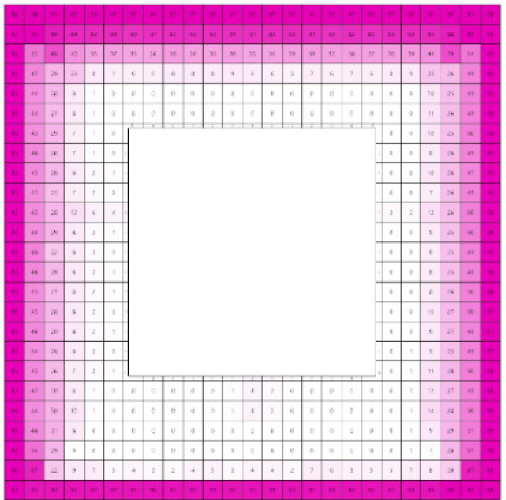
Graphical results of the lighting simulation by UDI (100–2000 lux) metric of the theoretical model without atrium.
  • 30 × 30 m2 FLOOR AREA
    Sustainability 12 06651 i220
  • 50 × 50 m2 FLOOR AREA
    Sustainability 12 06651 i221

References

  1. Verma, A. The Effect of An Atrium And Building Orientation On The Daylighting And Cooling Load Of An Office Building. Sch. Archit. Built Environ. 2017, 6, 1–69. [Google Scholar]
  2. Chow, S.K.H.; Li, D.H.W.; Lee, E.W.M.; Lam, J.C. Analysis and prediction of daylighting and energy performance in atrium spaces using daylight-linked lighting controls. Appl. Energy 2013, 112, 1016–1024. [Google Scholar] [CrossRef]
  3. Esquivias, P.; Navarro, J.; Muñoz, C. Hacia la Optimizacion del Aprovechamiento de la luz Natural; La Univ. Sevilla: Sevilla, España, 2011; pp. 229–274. [Google Scholar]
  4. Danielski, I.; Nair, G.; Joelsson, A.; Fröling, M. Heated atrium in multi-storey apartment buildings, a design with potential to enhance energy efficiency and to facilitate social interactions. Build. Environ. 2016, 106, 352–364. [Google Scholar] [CrossRef]
  5. El Rascacielos Ecológico. Available online: https://dialnet.unirioja.es/servlet/libro?codigo=85261 (accessed on 27 June 2020).
  6. Mahlabani, Y.G.; Araei, R.A.; Boushehri, A.M.; Alamuti, Z.M. A Study of Optimal Area of Atrium for Daylight Utilization (Case Study: Administrative Building in Qazvin, Iran). Int. J. 2019, 29, 39–46. [Google Scholar]
  7. Pitts, A.; Saleh, J. Bin Potential for energy saving in building transition spaces. Energy Build. 2007, 39, 815–822. [Google Scholar] [CrossRef]
  8. Ferreira, T.D.S. Daylight Optimization in an Office Building Through Atrium Improvements; Lund University: Lund, Sweden, 2018. [Google Scholar]
  9. Omrany, H.; Ghaffarianhoseini, A.; Berardi, U.; Ghaffarianhoseini, A.; Li, D.H.W. Is atrium an ideal form for daylight in buildings? Archit. Sci. Rev. 2020, 63, 47–62. [Google Scholar] [CrossRef]
  10. Sharples, S.; Lash, D. Daylight in Atrium Buildings: A Critical Review. Archit. Sci. Rev. 2006, 50, 37–41. [Google Scholar] [CrossRef]
  11. Littlefair, P. Daylight Prediction In Atrium Buildings. Sol. Energy 2002, 73, 105–109. [Google Scholar] [CrossRef]
  12. AMcneil y RChadwell. Available online: https://www.radiance-online.org/about/detailed-description.html (accessed on 27 June 2020).
  13. Lynes, J.A. A sequence for daylighting desing. Light. Res. Technol. 1979, 11, 102–106. [Google Scholar] [CrossRef]
  14. Mardaljevic, J.; Heschong, L.; Lee, E. Daylight metrics and energy savings. Light. Res. Technol. 2009, 41, 261–283. [Google Scholar] [CrossRef] [Green Version]
  15. Hung, W.Y.; Kong, H. Architectural aspects of atrium. Int. J. Eng. Perform.-Based Fire Codes 2003, 5, 131–137. [Google Scholar]
  16. Mangkuto, R.A.; Rohmah, M.; Asri, A.D. Design optimisation for window size, orientation, and wall reflectance with regard to various daylight metrics and lighting energy demand: A case study of buildings in the tropics. Appl. Energy 2016, 164, 211–219. [Google Scholar] [CrossRef]
  17. Calcagni, B.; Paroncini, M. Daylight factor prediction in atria building designs. Sol. Energy 2004, 76, 669–682. [Google Scholar] [CrossRef]
  18. Ghasemi, M.; Noroozi, M.; Kazemzadeh, M.; Roshan, M. The influence of well geometry on the daylight performance of atrium adjoining spaces: A parametric study. J. Build. Eng. 2015, 3, 39–47. [Google Scholar] [CrossRef]
  19. Du, J.; Sharples, S. Assessing and predicting average daylight factors of adjoining spaces in atrium buildings under overcast sky. Build. Environ. 2011, 46, 2142–2152. [Google Scholar] [CrossRef]
  20. Acosta, I.; Navarro, J.; Sendra, J.J. Lighting design in courtyards: Predictive method of daylight factors under overcast sky conditions. Renew. Energy 2014, 71, 243–254. [Google Scholar] [CrossRef]
  21. Acosta, I.; Varela, C.; Molina, J.F.; Navarro, J.; Sendra, J.J. Energy efficiency and lighting design in courtyards and atriums: A predictive method for daylight factors. Appl. Energy 2018, 211, 1216–1228. [Google Scholar] [CrossRef]
  22. Berardi, U.; Wang, T. Daylighting in an atrium-type high performance house. Build. Environ. 2014, 76, 92–104. [Google Scholar] [CrossRef]
  23. Aizlewood, M.E. Daylighting of atria: A critical review. In Proceedings of the 1995 ASHRAE Annual Meeting, San Diego, CA, USA, 24–28 June 1995; Volume 101, pp. 841–857. [Google Scholar]
  24. Li, J.; Ban, Q.; Chen, X.; Yao, J. Glazing sizing in large atrium buildings: A perspective of balancing daylight quantity and visual comfort. Energies 2019, 12, 701. [Google Scholar] [CrossRef] [Green Version]
  25. Ahadi, A.; Saghafi, M.R.; Tahbaz, M. The optimization of light-wells with integrating daylight and stack natural ventilation systems in deep-plan residential buildings: A case study of Tehran. J. Build. Eng. 2018, 18, 220–244. [Google Scholar] [CrossRef]
  26. Samant, S.R. A Parametric Investigation of the Influence of Atrium Facades on the Daylight Performance of Atrium Buildings. Ph.D. Thesis, University of Nottingham, Nottingham, UK, 2011. [Google Scholar]
  27. Vicencio, K.L.M. Impacto de la densificación—vertical e intensiva—sobre la dotación y uso del espacio público bajo el enfoque de la sustentabilidad urbana Comuna dAppe Estación Central, Santiago de Chile. Master´s Thesis, Universidad de Chile, Santiago, Chile, 2018. [Google Scholar]
  28. Edificios de Gran Altura en Santiago de Chile. 2000. Available online: https://www.emporis.com/city/101089/santiago-chile (accessed on 27 June 2020).
  29. Roldán Rojas, J.A. Caracterización Geométrica y Lumínica de los Atrios Incorporados en Los Edificios de Santiago de Chile. Ph.D. Thesis, Universidad Politécnica de Madrid, Madrid, Spain, 2016; pp. 89–197. [Google Scholar]
  30. Piderit, M.B.; Cauwerts, C.; Diaz, M. Definition of the CIE standard skies and application of high dynamic range imaging technique to characterize the spatial distribution of daylight in Chile. Rev. la Construcción 2014, 13, 22. [Google Scholar] [CrossRef] [Green Version]
  31. Vásquez, C.F.E.R.D. Edificios de oficinas en Santiago: ¿Qué estamos haciendo desde el punto de vista del consumo energético? Scielo 2015, 89, 50–61. [Google Scholar] [CrossRef] [Green Version]
  32. Desarrollo Urbano Suatentable. Edificios de Oficinas, Un Prototipo Mundial en Problemas. Available online: http://www.swettarq.com/wp-content/uploads/2018/08/36-41-version-2.pdf (accessed on 27 June 2020).
  33. Comité Técnico AEN/CTN 100 Climatización. In Parámetros del Ambiente Interior a Considerar Para el Diseño y la Evaluación de la Eficiencia Energética de Edificios Incluyendo la Calidad del Aire Interior, Condiciones Térmicas, Iluminación y Ruido. (une-en 15251); Asociación Española de Normalización: Madrid, Spain, 2008.
  34. The Commission Internationale de l’Éclairage (CIE) Lighting of Indoor Work Places. In ISO 8995 Cie S 008/E; Int. Organ. Stand. (ISO): Vienna, Austria, 2002; pp. 1–19.
  35. MOP. Términos de Referencia Estandarizados con Parámetros de Eficiencia Energética y Confort Ambiental, para Licitaciones de Diseño y Obra de la Dirección de Arquitectura, Según Zonas Geográficas del País y Según Tipología de Edificios (TDRe); Dirección de Arquitectura, Ministerio de Obras Públicas, Gobierno de Chile: Santiago, Chile, 2016. [Google Scholar]
  36. Reseachgate. Diva 2.0: Integrating Daylight And Thermal Simulations Using Rhinoceros 3d, Daysim And Energyplus. Available online: https://www.researchgate.net/publication/264353052_DIVA_20_integrating_daylight_and_thermal_simulations_using_Rhinoceros_3D_DAYSIM_and_EnergyPlus (accessed on 27 June 2020).
  37. Reinhart, C.F.; Mardaljevic, J.; Rogers, Z. Dynamic daylight performance metrics for sustainable building design. LEUKOS—J. Illum. Eng. Soc. N. Am. 2006, 3, 7–31. [Google Scholar] [CrossRef] [Green Version]
  38. Moore, F. Environmental Control Systems, Heating Cooling Lighting; McGraw Hill Inc.: New York, NY, USA, 1993. [Google Scholar]
  39. Allen, E.; Iano, J. The Architect’s Studio Companion, Rules of Thumb for Preliminary Design, 3rd ed.; John Wiley & Sons, Inc.: New York, NY, USA, 2002. [Google Scholar]
  40. Daylight Rules-of-Thumb Experimentally Examined. Available online: https://www.radiance-online.org/about/detailed-description.htm (accessed on 27 June 2020).
  41. Reinhart, C.F.; Lo Verso, V.R.M. A rules of thumb-based design sequence for diffuse daylight. Light. Res. Technol. 2009, 42, 7–31. [Google Scholar] [CrossRef]
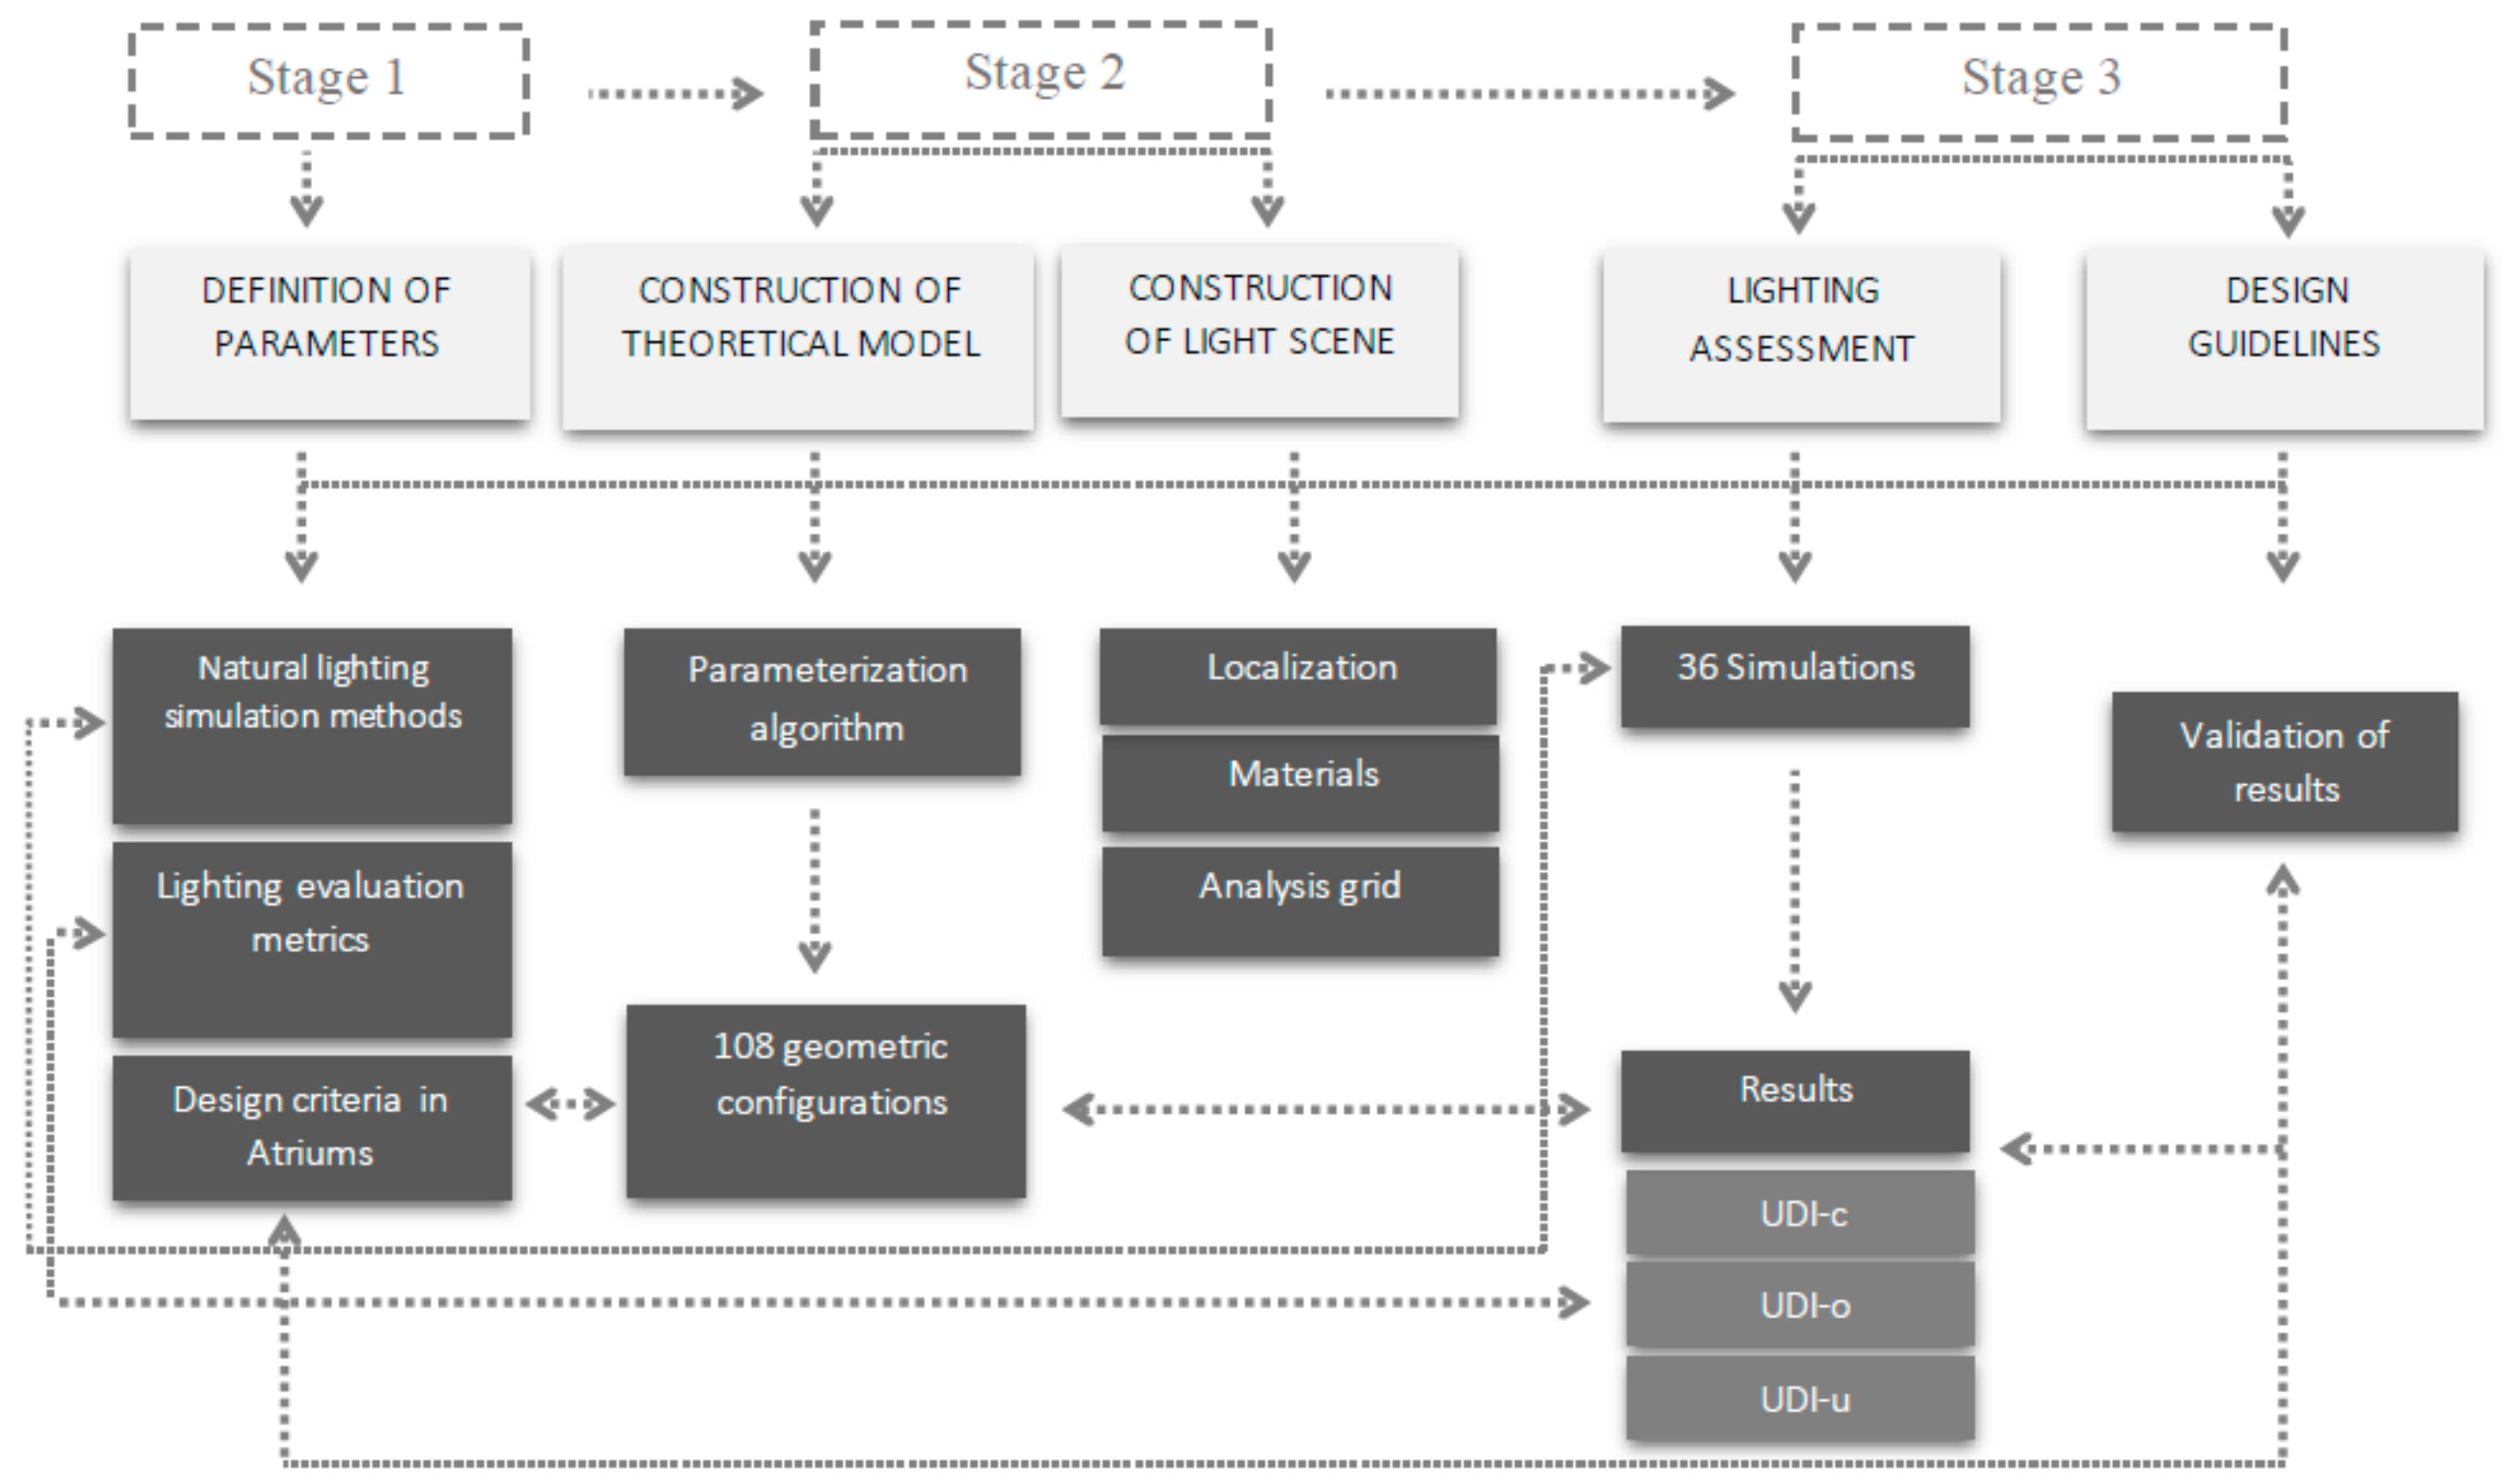
Figure 1. Research methodology flow chart (source: own elaboration).
Sustainability 12 06651 g001
Figure 2. General features of the geometric model and location of clerestories (source: own elaboration).
Sustainability 12 06651 g002
Figure 3. Window-to-wall ratio (WWR) (%) for atrium surfaces on clerestory levels and office spaces (source: own elaboration).
Sustainability 12 06651 g003
Figure 4. WWR (%) for façade of clerestories and office spaces floors (source: own elaboration).
Sustainability 12 06651 g004
Figure 5. Identification code of geometric ratios evaluated (source: own elaboration).
Sustainability 12 06651 g005
Scheme 1. Comparison of Useful Daylighting Illuminance (UDI) ranges in optimal geometries chosen for the 30 × 30 m2 floor area surface (source: own elaboration).
Sustainability 12 06651 sch001
Scheme 2. Comparison of UDI ranges in optimal geometries levels chosen for the 50 × 50 m2 floor area surface (source: own elaboration).
Sustainability 12 06651 sch002
Figure 6. Application of the rule of thumb of side lighting in geometric ratio, with a value of WI = 2.7. Analysis of maximum and minimum solar angles for winter and summer (source: own elaboration).
Sustainability 12 06651 g006
Table 1. Registry of high-rise buildings in Santiago de Chile. Source: www.emporis.com/city/santiago-chile.
POSITIONBUILDINGDISTRICTHEIGHT (M)FLOORSM2 BUILTYEAR
1Gran Torre SantiagoProvidencia30062128,0002014
2Titanium La PortadaLas Condes20056130,0002010
3Corporativo CTC Building (Torre Telefónica)Providencia1433463,0001996
4Hotel Marriott Santiago de ChileLas Condes14542115,5001999
5Bosque 500Las Condes1252465,0002001
6Territoria 3000Las Condes1203146,4272009
7Nueva Santa MariaProvidencia1203025,6202014
8Torre de la IndustriaLas Condes1203252,0001994
9Millenium BuildingLas Condes1153034,2002000
10Hotel CostaneraProvidencia11228-2012
11Torre CentenarioSantiago1123130,0002000
12Torre Santa MaríaProvidencia1103320,6251978
13Nueva Kennedy 1Las Condes11039-2020
14Las Américas BuildingSantiago11031-1990
15Torre corporativa CCULas Condes1052844,3002007
16PalladioProvidencia10426-2000
17Grand Hyatt SantiagoLas Condes10024-1992
18Simón Bolivar BuildingSantiago Centro9024-1992
19Fundación CorpgroupLas Condes9026-2006
20Mistral BuildingLas Condes8825-2006
Table 2. Climate data of Santiago de Chile (source: own elaboration).
CityKöppen– GeigerT° max Avg. (°C)T° min Avg. (°C)Solar Alt. Max.Solar Alt. Min.Frequency (%) of CIE Sky
ClearClear TurbidIntermediateOvercast
SantiagoCsb29.811.479°833°119%22%30%29%
Table 3. Optimal geometric variables for natural lighting in atriums (source: own elaboration).
Optimal Number of Atrium Levels for Lighting in Adjoining Spaces
WI Index
Four-floors in Height
WI < or Equal to 1.5.
Central atrium ratios:
Atrium width–adjoining space width ratio.
2:1–1:1–1:2.
For vertical atriums:
The minimum acceptable ratio of the height of clerestories (envelope) (h) to the height of the atrium (H) to provide the sufficient level of ADF on the adjoining spaces of the atrium is h/H
3/8–4/8.
Window-to-wall ratio for atrium’s vertical surfaceVariability in the glazing% by levels for excessive control of lighting on top floors and greater lighting contribution on lower floors due to higher opaque areas for light reflection.
Table 4. Geometric ratio ranges of the vertical central atrium for the construction of a 3D model (source: own elaboration).
1:2 Ratio (4% of Floor Surface)1:1 Ratio (11% of Floor Surface)2:1 Ratio (25% of Floor Surface)
Floor 30 × 30 m2Floor 50 × 50 m2Floor 30 × 30 m2Floor 50 × 50 m2Floor 30 × 30 m2Floor 50 × 50 m2
Sustainability 12 06651 i001 Sustainability 12 06651 i002 Sustainability 12 06651 i003 Sustainability 12 06651 i004 Sustainability 12 06651 i005 Sustainability 12 06651 i006
Table 5. Summary of the geometric construction growth ranges of the study model with WI values (source: own elaboration).
Building
Area (m2)
LevelsRatioWidth
Adjoining
Space
(m)
Area
Adjoining
Space
(m2)
% of
atrium
area on
floor
Central
Atrium
Área
(m2)
Atrium
Length
(l)
Atrium
Width
(a)
Adj.
Sp.
(h)
Cl.
(h)
Total
Atrium
Height
(h)
Central
Atrium
height
4 levels
(h)
PAR
a/l
SAR
(1)
h/a
WI
4 Levels
h*(a+ l)/2*(a*l)
SAR
(2)
h/a
WI total
h*(a+ l)/2*(a*l)
30 × 30
900 m2 on the floor
13,500 m2 total
152:17.51690.25225151534481210.80.83.23.2
48721611.11.14.84.8
1:1102000.11100101034481211.21.24.84.8
48721611.61.67.27.2
1:2122160.04366634481212.02.08.08.0
48721612.72.712.012.0
50 × 50
2500 m2 on the floor
37,500 m2 total
152:112.54690.25625252534481210.50.51.91.9
48721610.60.62.92.9
1:116.665570.11277.516.6616.6634481210.70.72.92.9
48721611.01.04.34.3
1:2206000.04100101034481211.21.24.84.8
48721611.61.67.27.2
Table 6. Range of geometric ratios of the atrium’s clerestories of model (source: own elaboration).
Building Area (m2)Area (m2)Width (m)Height (m)Clerestory Height/Atrium Height of 4 levels Ratio (h/H)
30 × 30 1697.542/6
84/8
50 × 50 6002042/6
84/8
Table 7. Reflectance and geometric surface transmission coefficient of the study model (source: own elaboration).
Surface/ElementReflectance/TransmittanceSource
Atrium walls0.80[21,33,34,35]
Indoor division walls of adjoining spaces0.60
Ceiling0.90
Floor0.40
Work plane furniture0.50
Type 1 glazed surface of clerestories and façades 0.80
Type 2 glazed surface of atrium surfaces0.88
Table 8. Description of optimal geometries chosen for the 30 × 30 m2 floor area (source: own elaboration).
Geometric Ratio Code123456
30,1_2,3,430,1_2,4,430,1_1,3,430,1_1,4,430,2_1,3,430,2_1,4,4
Floor Area30 × 30 m230 × 30 m230 × 30 m230 × 30 m230 × 30 m230 × 30 m2
Atrium ratio1_21_21_11_12_12_1
Adjoining spaces floor-to-ceiling height. (h)3 m4 m3 m4 m3 m4 m
Clerestories (h)4 m4 m4 m4 m4 m4 m
Table 9. Description of optimal geometries chosen for the 50 × 50 m2 floor area (source: own elaboration).
Geometric Ratio Code1234
50,1_2,4,450,1_1,4,450,2_1,3,450,2_1,4,4
Floor area50 × 50 m250 × 50 m250 × 50 m250 × 50 m2
Atrium Ratio1_21_12_12_1
Adjoining spaces floor-to-ceiling height (h)4 m4 m3 m4 m
Clerestories (h)4 m4 m4 m4 m
Table 10. Geometric indices of optimal geometric ratios chosen in the evaluation (source: own elaboration).
Building
Area
(m2)
LevelsRatioWidth
Adjoining
Space
(m)
Adjoining
Space
AREA
(m2)
% of
Atrium
Area on
Floor
Central
Atrium
Area
(m2)
Atrium
Lenght
(l)
Atrium
Width
(a)
Adj. Sp.
(h)
Cl.
(h)
Total
Atrium
Height
(h)
Central
Atrium
Height
4 Levels
(h)
PAR
a/l
SAR
h/a
WI
4 Levels
h*(a+ l)/2*(a*l)
WI Total
h*(a+ l)/2*(a*l)
30 × 30
900 m2 on the floor
13,500 m2 total
151:2122160.04366634481218.02.08.0
1:2122160.043666446016110.02.710.0
1:1102000.11100101034481214.81.24.8
50 × 50
2500 m2 on the floor
37,500 m2 total
151:2206000.04100101044601616.01.66.0
1:116.665570.11277.516.6616.6644601613.61.03.6
Table 11. Range of geometric ratios of the atrium’s clerestories of four levels (source: own elaboration).
Building Area (m2)Atrium Height (H)Clerestory Height (h)Ratio (h/H)
30 × 30 1642/8
1242/6
50 × 50 1642/8
1642/8
Table 12. Summary of design guidelines (source: own elaboration).
Sustainability 12 06651 i007
30 × 30 m2 FLOOR
Sustainability 12 06651 i008
50 × 50 m2 FLOOR
Sustainability 12 06651 i009
DESIGN GUIDELINES
Atrium Ratio1:2
(4% of the total floor area)
1:2
(4% of the total floor area)
1:1
(11% of the total floor area)
1:1
(11% of the total floor area)
WI Index (Four-Floors)1.2–2.71.0–1.6
WI Index (Total)4.8–10.03.6–6.0
Clerestory height4 m4 m
h/H ratio
Clerestories
2/6–2/82/8
Floor-to-ceiling height3–4 m4 m
WWR surfaces of the atrium90%, 80%, 50% and 40% from the highest floors (of each 4-floor block)90%, 80%, 50% and 40% from the highest floors (of each 4-floor block)
Material reflect. coeff.TDRe and ISO 8995-1:2016 (CIE S 008/E: 2001)TDRe and ISO 8995-1:2016 (CIE S 008/E: 2001)
OrientationDependent on the contextDependent on the context
LIGHT CONTRIBUTIONAverage UDI-c
(100–2000 lux)
53–66%65–70%
Average UDI-o
(>2000 lux)
30–42%25–27%
Average UDI-u
(<100 lux)
<3%<9%