Article

Gasification of RDF and Its Components with Tire Pyrolysis Char as Tar-Cracking Catalyst

Institute of Chemical and Environmental Engineering, Slovak University of Technology in Bratislava, Radlinského 9, 81237 Bratislava, Slovakia
*
Author to whom correspondence should be addressed.
Sustainability 2020, 12(16), 6647; https://doi.org/10.3390/su12166647
Submission received: 31 July 2020 / Revised: 11 August 2020 / Accepted: 14 August 2020 / Published: 17 August 2020
(This article belongs to the Special Issue Municipal Solid Waste Gasification)

Abstract

:
The composition of gas produced by the gasification of refuse-derived fuel (RDF) can be affected by the content of individual components of RDF and their mutual interactions. In this work, plastics, paper, wood, textile and RDF were gasified in a two-stage gasification system and the obtained tar yields and product gas quality were compared. The two-stage reactor consisted of an air-blown gasifier and a catalytic reactor filled with carbonized tire pyrolysis char as the tar-cracking catalyst. Tire pyrolysis char is a promising alternative to expensive catalysts. The impact of temperature and catalyst amount on the tar yield and gas composition was investigated. Theoretical oxygen demand for all material classes was calculated and its effect on gas composition and tar yield is discussed. The results indicate that the gasification of plastics produces the highest amount of tar and hydrocarbon gases, while the CO2 content of the product gas remains the lowest compared to all other materials. On the other hand, the paper fraction produced hydrogen-rich gas with low tar content. The gasification of RDF at 700 °C provided the lowest tar yield compared to all other materials, indicating positive synergic effects of lignocellulosic biomass and plastics in tar reduction. The significance of these interactions was suppressed at the highest temperature of 900 °C, as the thermal cracking of tar became dominant. For CO2 content, a negative synergic effect (higher CO2 concentration) was observed.

Graphical Abstract

1. Introduction

Around 130 Mt of municipal solid waste (MSW) are incinerated in waste-to-energy plants worldwide every year. However, this amount corresponds to only 10% of produced MSW [1]. In many countries, most produced MSW ends up in landfills or open dumping sites, which represent a serious environmental and health hazard [2]. By the removal of inorganic matter and biodegradables, MSW can be transformed into refuse-derived fuel (RDF), which increases its calorific value from 9.1 MJ/kg to 18 MJ/kg (or more, depending on the plastics fraction) [3]. Thus, MSW/RDF can be utilized as alternative solid fuel [4]. However, the calorific value, ash and moisture content of MSW vary across time and region, causing changes in the quality (especially heating value) of MSW/RDF incinerated in waste-to-energy plants [3]. Plastics, foil, paper, textile, wood and rubber are the main fractions of RDF [2]. The ratio of these fractions has a significant impact on the overall heating value of MSW and RDF [3].
Gasification receives a lot of attention these days, as compared to combustion, as the stoichiometric amount of oxidizer used is lower. Thus, not only are the final forms of oxidation like CO2 and H2O produced, but reduced forms like H2 and CO also emerge. Product gas, also known as synthesis gas, is the main product of gasification. It can be used as a gaseous fuel with a heating value of 6–8 MJ/m3 when air is used as a gasifying agent or up to 15 MJ/m3 when the feedstock is gasified by steam [5]. Additionally, product gas can be utilized as feedstock for the synthesis of organic compounds like methanol and dimethyl ether [6]. However, product gas usually contains a certain amount of condensable hydrocarbons, known as tar. Tar is an undesirable side product because its condensation and polymerization cause fouling in downstream processing equipment [7]. For endpoint units like combustion engines, tar concentration in the synthesis gas has to be decreased below 10 mg/m3 [7]. However, limits for gas tar content depend on the type of tar; for light tar, which condenses at a higher concentration and lower temperature, a higher tar content in gas is allowed. Physical means like condensation and absorption can be used to eliminate tar from product gas. However, these methods are expensive and their application leads to the formation of additional waste streams.
As a more suitable alternative, catalytic tar removal, can be employed [8]. Tire pyrolysis char is a suitable catalyst or catalyst support for tar removal from synthesis gas as it can be used at high temperatures (900 °C), it has a relatively high specific surface area, about 70–80 m2/g [9], and it can effectively remove tar, especially in the presence of steam [10]. Additionally, tire pyrolysis char contains many metals, especially zinc in the form of zinc oxide (around 2.4 wt.%) [9]. That is an important factor, as a high content of inorganics in the char structure increases the total tar-cracking potential of char [11]. The preparation of char-based catalysts usually includes their activation at temperatures above 700 °C in the presence of CO2 or steam [12]. In our previous works, the tar-cracking potential of tire pyrolysis char in cracking model tar components, such as toluene and para-xylene, was investigated [13,14]. The results showed high tar cracking activity of tire pyrolysis char, especially when char impregnated with Ni and char pellets carbonized at 900 °C were used. As the content of individual fractions of MSW and RDF varies, many studies are focused on the gasification of their individual fractions [3]. However, some papers focus on the co-gasification of plastics and biomass-based wastes to negate the negative traits of both fractions, as the addition of plastics increases the overall calorific value of the mixture and biomass addition decreases the possibility of molten plastics getting stuck on the reactor wall [15]. As higher fractions of plastics lead to higher concentrations of hydrocarbons and tar in the product gas [5], the application of a tar-cracking catalyst is necessary [16].
Interactions between fractions of RDF during co-gasification have been proved to have a significant impact on the product distribution [17]. Additionally, these interactions cause a decrease in the total tar and char yield as compared to the gasification of individual RDF fractions. Although plastics are richer in hydrogen, their co-gasification with biomass produces a larger amount of higher quality synthesis gas compared to the weighted sum of individual fractions [18]. Déparrios et al. [19] found that a mixture of paper and polystyrene with a polystyrene content of 10–20 wt.% yielded the highest synthesis gas yield and the lowest char yield, as char formed from paper slowed down polystyrene decomposition. In order to accurately predict the yield of tar and hydrogen from the gasification of MSW or RDF with a certain composition, yields from the gasification of pure components and their mixtures have to be evaluated, as a variation in the composition of a heterogeneous feedstock like RDF has a serious impact on the product yield [20]. Despite the mentioned papers, the effect of interactions between RDF components on gas composition and tar yield and the effect of a tire pyrolysis char catalyst in RDF gasification require more attention and additional experimental data.
In this paper, RDF and its components (paper, plastics, wood chips and textile) were gasified at the same experimental conditions in a two-stage gasifier with compacted tire pyrolysis char as a catalyst in the secondary stage. Compacted tire pyrolysis char prepared only by activation was applied. This kind of catalyst can be easily used as raw material in the gasifier after its deactivation (no additional waste streams are created). The gas composition and tar yield were observed at different catalyst bed temperatures and catalyst to feed ratios.

2. Materials and Methods

2.1. Raw Material Characterization

The gasification of RDF and its main components: plastics, paper, textiles and wood chips, was studied in this work. Other RDF components, such as cardboard and rubber, were not studied as the RDF samples studied did not contain measurable fractions of these components. RDF was supplied by Ecorec, Pezinok, Slovakia. Components of RDF were extracted by hand separation. In the first step, each material type was milled to a particle size below 2 mm. The properties of materials were characterized by proximate, ultimate and calorimetric analyses. Volatiles and fixed carbon contents were determined by thermogravimetric analysis according to the following procedure. The samples were heated to 800 °C with a heating rate of 10 °C/min in a nitrogen atmosphere. The temperature was held at 800 °C for 30 min, then oxygen was introduced. For these analyses, a thermogravimeter STA 409 PC Luxx (NETZSCH, Selb, Germany) was used. Moisture content was determined by drying the materials at 105 °C until sample mass stabilization. For this purpose, a moisture analyzer MB163L (VWR International, Aurora, CO, USA) was used. Ash content was determined according to the Slovak Technical Standard STN ISO 1171. Approximately 10 g of the sample were heated to 500 °C over a period of one hour. The sample was kept at this temperature for 1 h, then it was increased to 815 °C over a period of one hour and the sample was kept at this temperature for 6 h. Ash content analysis was carried out in a muffle furnace L9/11B410 (Nabertherm, Lilienthal, Germany). During this analysis, the free flow of air through the furnace was enabled. Elementary analysis of materials was provided by a Vario Macro Cube® (Elementar, Langenselbold, Germany) elemental analyzer. The lower heating value of materials was determined by a bomb calorimeter (Fire Testing Technology Ltd., East Grinstead, UK). Properties of raw materials are shown in Table 1 and Table 2. The values of theoretical oxygen demand (TOD) for dry feedstock were calculated from ultimate analysis according to Equation (1). Theoretical oxygen demand represents the amount of oxygen needed for the complete oxidation of feedstock to final products, CO2 and H2O; it does not consider moisture in feedstock. Therefore, H and O contents had to be adjusted according to Equation (2). The content of C was adjusted according to Equation (3). Material characterization showed that plastics had the most suitable properties for gasification with a significantly higher heating value, low ash content, low moisture content, higher content of volatiles and higher content of hydrogen.
TOD = w C M C M O 2 + w H M H 2 M O w O 100 ,
w i , dry = w i , raw w moisture M water M i 1 w moisture ,
  • For i = H, O,
  • TOD—theoretical oxygen demand,
  • wi,dry—mass fraction of element i in dry feedstock,
  • wi,raw—mass fraction of element i in raw feedstock,
  • Mimolecular weight of element i (g/mol).
Subscripts: H—atomic hydrogen, H2—molecular hydrogen, O—atomic oxygen, O2—molecular oxygen, C—carbon.
w C , dry = w C , raw 1 w moisture ,
The material composition of the combustible fraction of RDF is shown in Table 3. RDF contains a relatively high amount of ash because of the presence of inorganic materials. The properties of RDF studied in this work were similar to those of RDF prepared from municipal solid waste in [20].

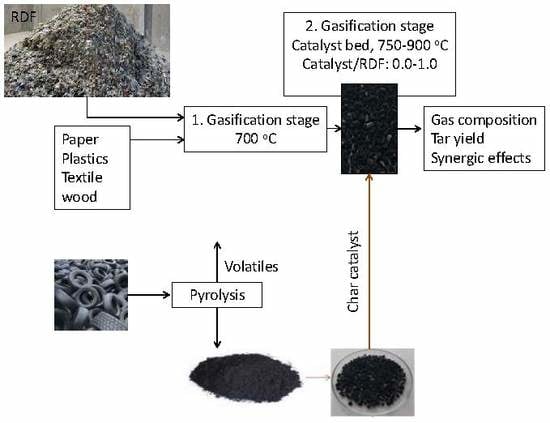
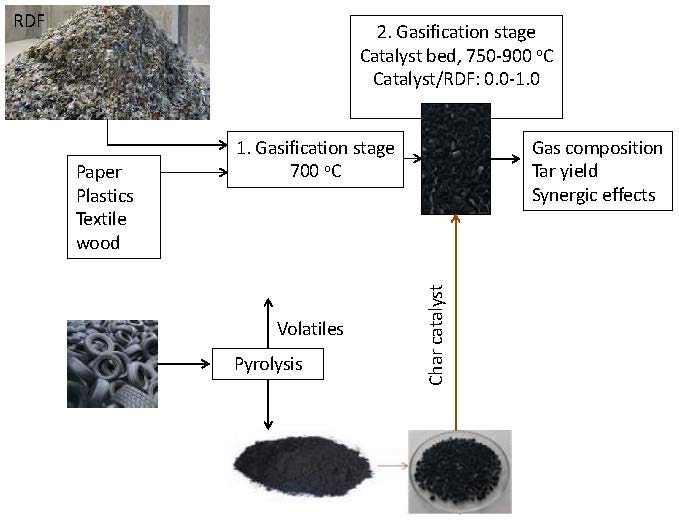
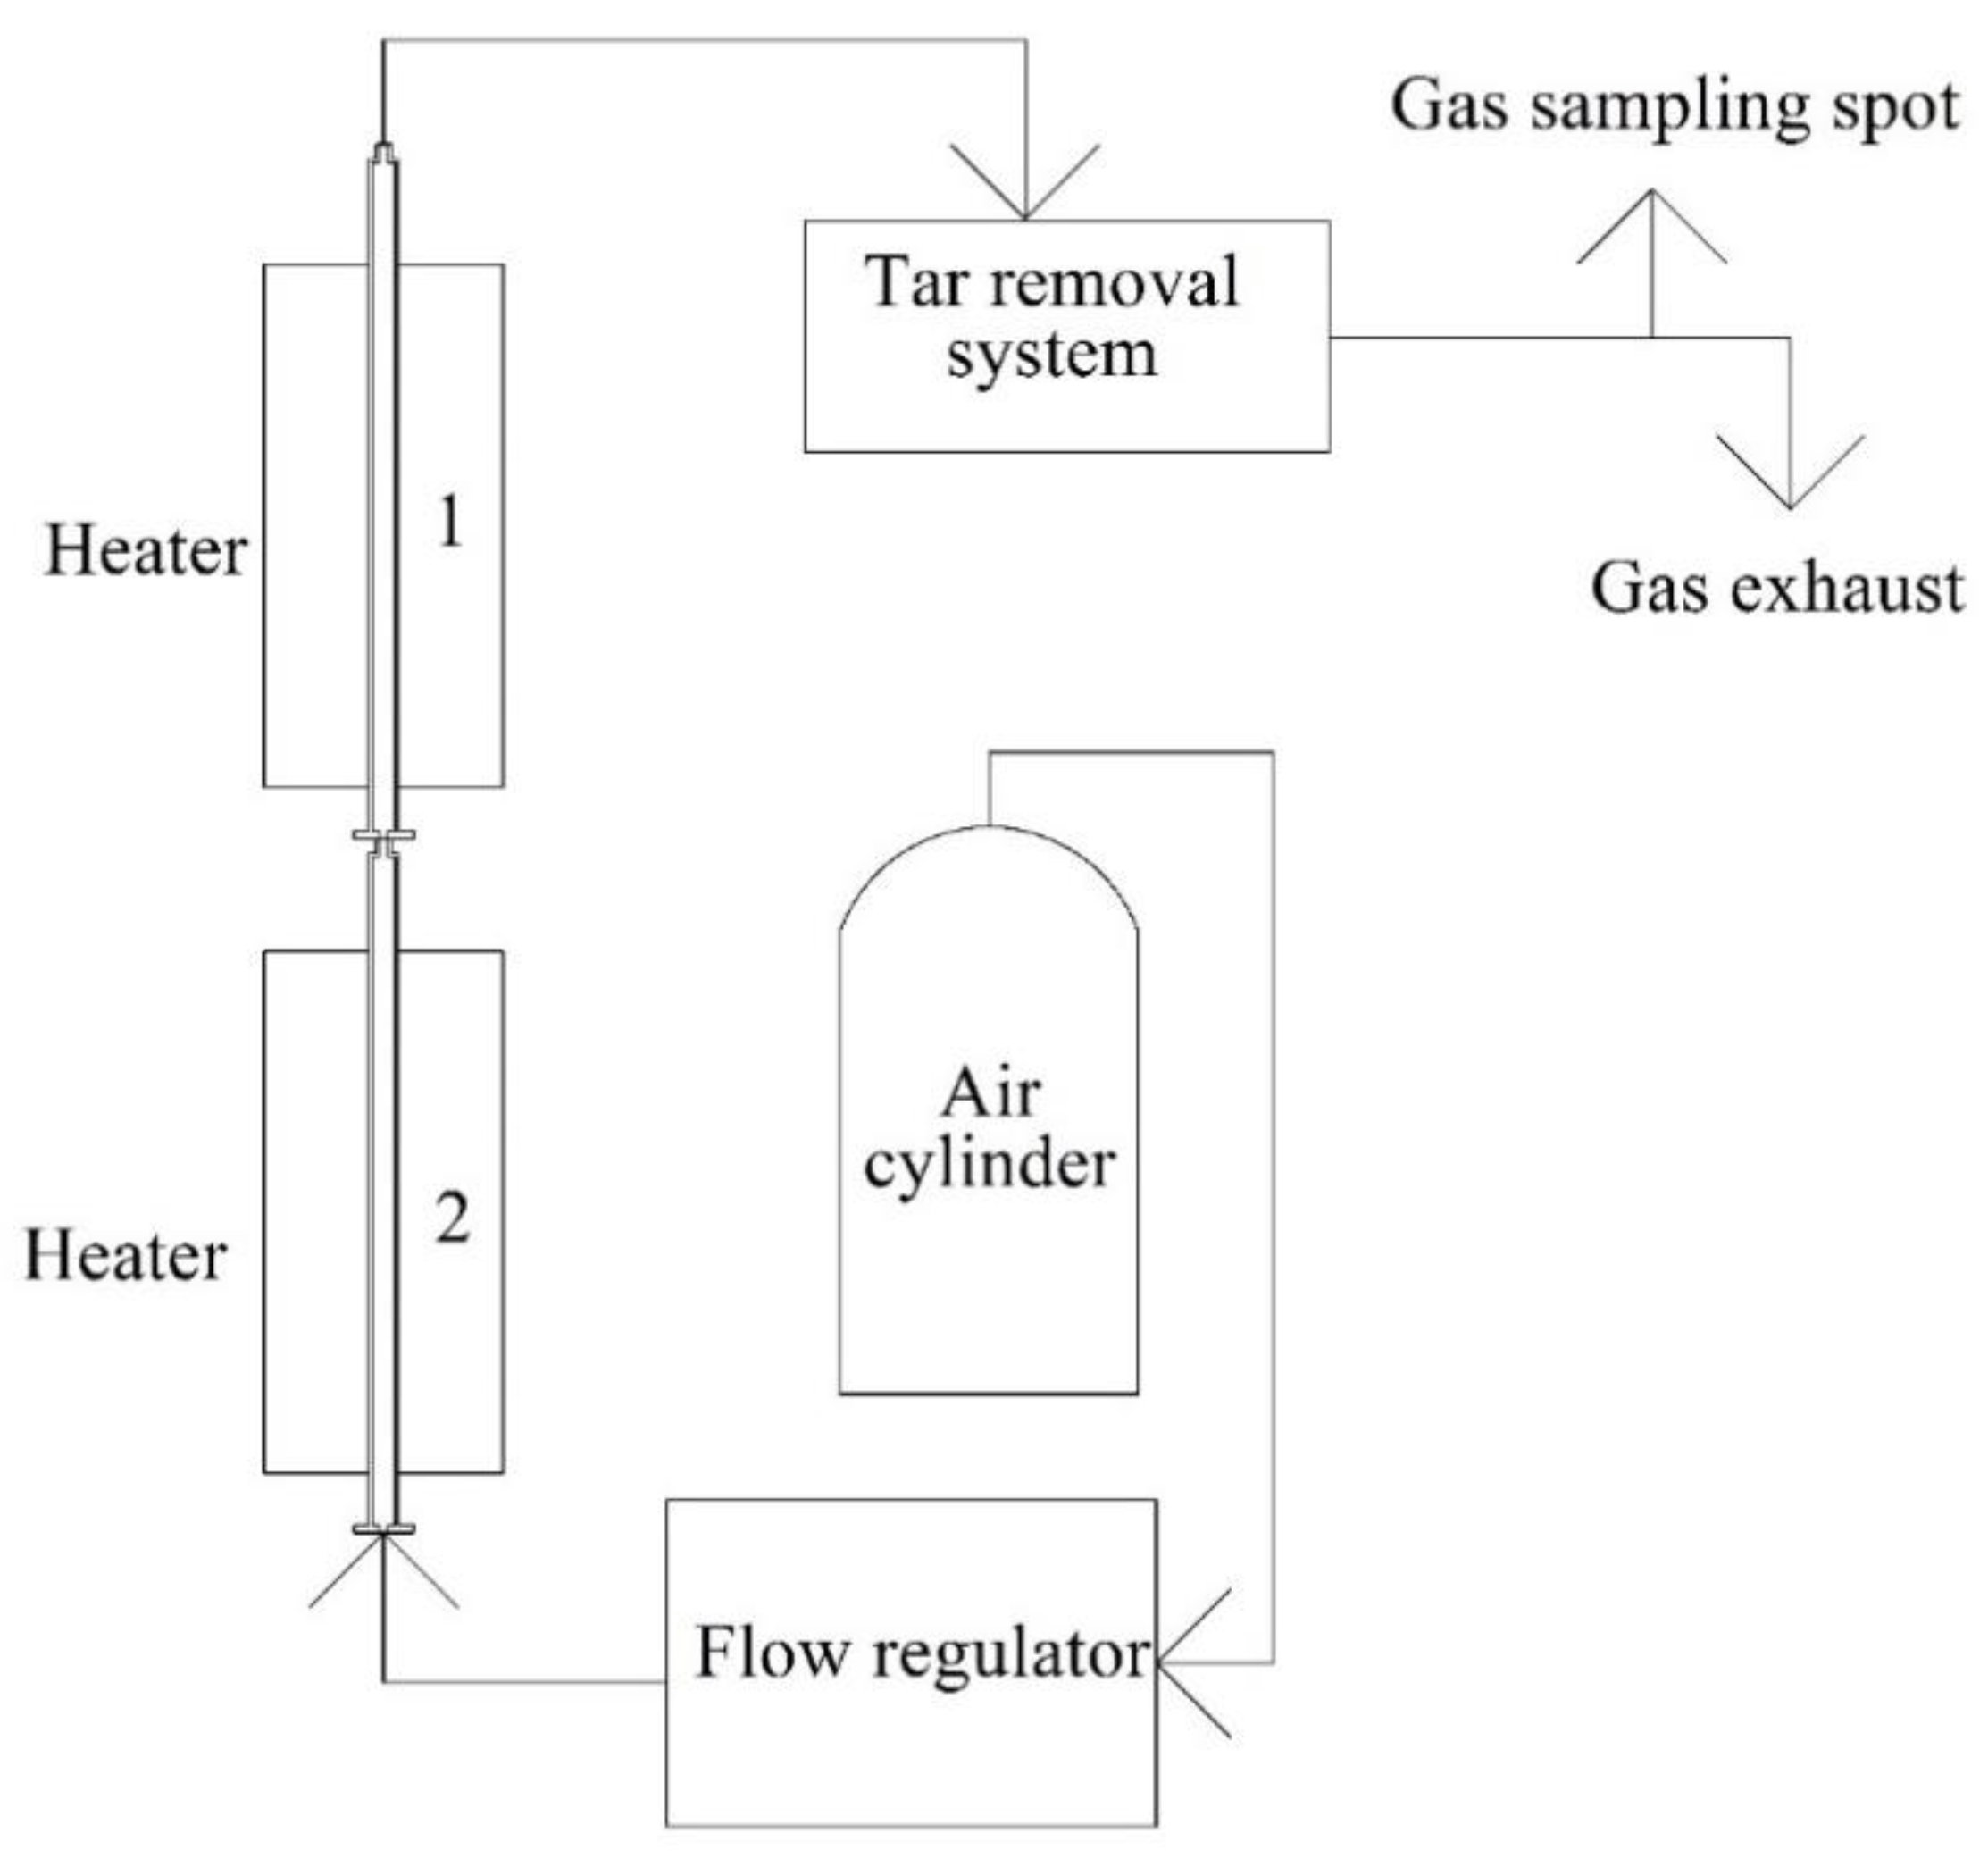
2.2. Experimental Apparatus

The scheme of the apparatus employed for the experiments is shown in Figure 1. The apparatus consisted of a gasifying (2) and a catalytic reactor (1) which were connected during the experiment. The reactor was composed of a steel tube heated by an electric furnace. Each tube had an inner diameter of 17 mm and a wall thickness of 2.5 mm. The lengths of the tubes were 466 mm and 400 mm for the gasifying and catalytic reactor, respectively. Segments of steel tubes located outside the heaters were insulated with glass wool. Layers of hollow ceramic cylinders were placed at the bottom of each tube to ensure the sample and catalyst were positioned in the region with the desired temperature. Air was fed into the bottom of the gasifying reactor using a flow regulator to ensure constant air flow into the reactor. Evolved gas from the catalytic reactor was passed through an isopropanol scrubbing system where tar was captured. This system was designed according to the Energy Research Centre of the Netherlands guidelines [21]. The system consisted of seven impinger bottles, where four bottles were preheated to 37 °C and two bottles were cooled to −20 °C. The first bottle was at ambient temperature and evolved gas from the catalytic reactor was directly fed into this bottle. From this bottle, gas was passed through all preheated and cooled bottles. Each bottle, except for the last one, was filled with isopropanol. In the last two bottles, glass beads were placed to ensure a higher contact area between the purified gas and isopropanol.

2.3. Experimental Procedure

First, electric furnaces were preheated to desired temperatures, then the catalytic reactor containing the catalyst bed was placed inside the electric furnace. Then, the gasifying reactor filled with feedstock was placed inside the second electric furnace and both reactors were interconnected. In the next step, air was introduced into the gasifying reactor. This moment was considered as the beginning of the experiment. Gas produced in the gasifying reactor was passed through the catalytic reactor and then went on to the isopropanol system for tar to be absorbed. After this, pretreated gas was ready for the analysis.

2.4. Experimental Conditions

All experiments were carried out with 10 g of dried sample. In the first reactor, the temperature of the reactor and airflow were set to 700 °C and 15 dm3/h (dry air, ambient temperature), respectively. The low temperature allowed for using a reactor made of cheaper material with lower resistance. The temperature was high enough to run decomposition processes of the studied feedstocks. In a continuous process studied in our previous work [22], the optimum theoretical air to RDF mass flow ratio was estimated to be 2.1. The closest value of air flow rate to this optimum value in a semibatch system with 10 g of RDF is 15 dm3/h. This value, as well as the first reactor temperature, was kept constant during all experimental runs. In the second reactor, different conditions were examined. These conditions were divided into two sets. In the first set, the effect of different temperatures in the catalytic reactor was studied. For this purpose, experiments were carried out at temperatures of 700, 750, 800, 850 and 900 °C in the catalytic reactor. This temperature range is suitable for major gasification reactions [7,23]. In this set, 2 g of fresh catalyst, representing a catalyst to feed mass ratio of 0.2, were used in each experiment. This minimum catalyst loading was chosen to better visualize the effect of temperature. In the second set, the effect of different amounts of catalyst was tested while the temperature in the catalytic reactor was set to 750 °C. The largest difference between experiments with and without the catalyst was observed at this temperature. In these experiments, 10, 5, 2 and 0 g of fresh catalyst were packed into the catalytic reactor, representing a catalyst to feed mass ratio of 1, 0.5, 0.2 and 0, respectively. Each experiment lasted for 1 h. Experiments were carried out in duplicate. The relative deviations of the measured data in repeated experiments did not exceed 15%, although their average value was below 10%.

2.5. Catalyst

The catalytic activity of the studied pyrolysis char was confirmed on model tar compounds in our previous studies [13,14]. P-xylene conversion as a model tar component at 800 °C increased from 71.5% in a process without any catalyst to 99.1% in a process with the char catalyst. However, after 180 min of operation, p-xylene conversion decreased to 97% because of catalyst deactivation. Catalyst activity was also confirmed through other experiments with RDF carried out using an inert replacement of the catalyst. In this case, the tar yield in the experiment with the catalyst decreased by 45% compared to the experiment with a non-catalytic replacement. Raw tire pyrolysis char came from a pyrolysis unit in Slovakia. The pyrolysis of tires took place at a temperature of 550 °C. The char was compacted using a roll compactor into particles of 3–5 mm. Then, the compacted pyrolysis char was dried at 105 °C for 6 h. The preparation of catalyst was finished by its carbonization, which was carried out at 800 °C in a continuous flow of CO2. This procedure took 4 h. The surface properties of carbonized and raw pyrolysis char were determined by the nitrogen adsorption and BET (Brunauer-Emmett-Teller) isotherm from our previous studies [13,14] and they are presented in Table 4. The studied catalyst in this work had the same origin as the catalyst described in [14].

2.6. Gas Analysis Procedure

A gas sample for the analysis was captured 5 min from the beginning of the experiment because this moment was correlated with the highest gas emission from the feed. The sample was taken from the gas sampling spot located at the outlet of the isopropanol system. Around 50 cm3 (ca. 1 bar) of the gaseous sample were injected into a gas chromatograph (Agilent 7890A, Agilent Technologies, USA). The gas sample was injected into two columns: J&W W113-4362 260 °C: 60 m × 320 μm × 0 μm, and Agilent PLOTQ + MOLSIEVE 260 °C: 65 m × 530 μm × 50 μm. An oven heated the columns according to the following procedure:
  • Initial temperature of the oven was 40 °C, hold time was 2 min.
  • Increased temperature of the oven to 60 °C at a heating rate of 20 °C/min, hold time was 7.5 min.
  • Increased temperature of the oven to 200 °C at a heating rate of 25 °C/min, hold time was 2 min.
The concentration of methane, ethane, ethylene, propane, propylene, n-butane and i-butane in the gas sample was determined by a flame ionization detector (FID), while the concentration of CO, CO2 and H2 was determined via a thermal conductivity detector (TCD). Argon was used as the carrier gas.

2.7. Tar Analysis Procedure

Tar yields were determined by the vacuum distillation of 100 cm3 samples of collected isopropanol from scrubbers [21]. All samples were distilled in a vacuum rotary evaporator (Hei-VAP Advantage, Heidolph Germany) at a temperature of 55 °C and a pressure of 10 kPa. Each distillation lasted 53 min, obtained residue was dissolved in 25 mL of pure isopropanol and the solution was placed in a Petri dish. In the next step, isopropanol was evaporated to a constant mass at low temperature, which varied between 20–32 °C, in a chemical fume hood. In the end, a Petri dish with residual tar was weighed and the amount of total tar produced in each experiment was calculated. Tar measurement was done for all gasification runs, including duplicate measurements.

3. Results and Discussion

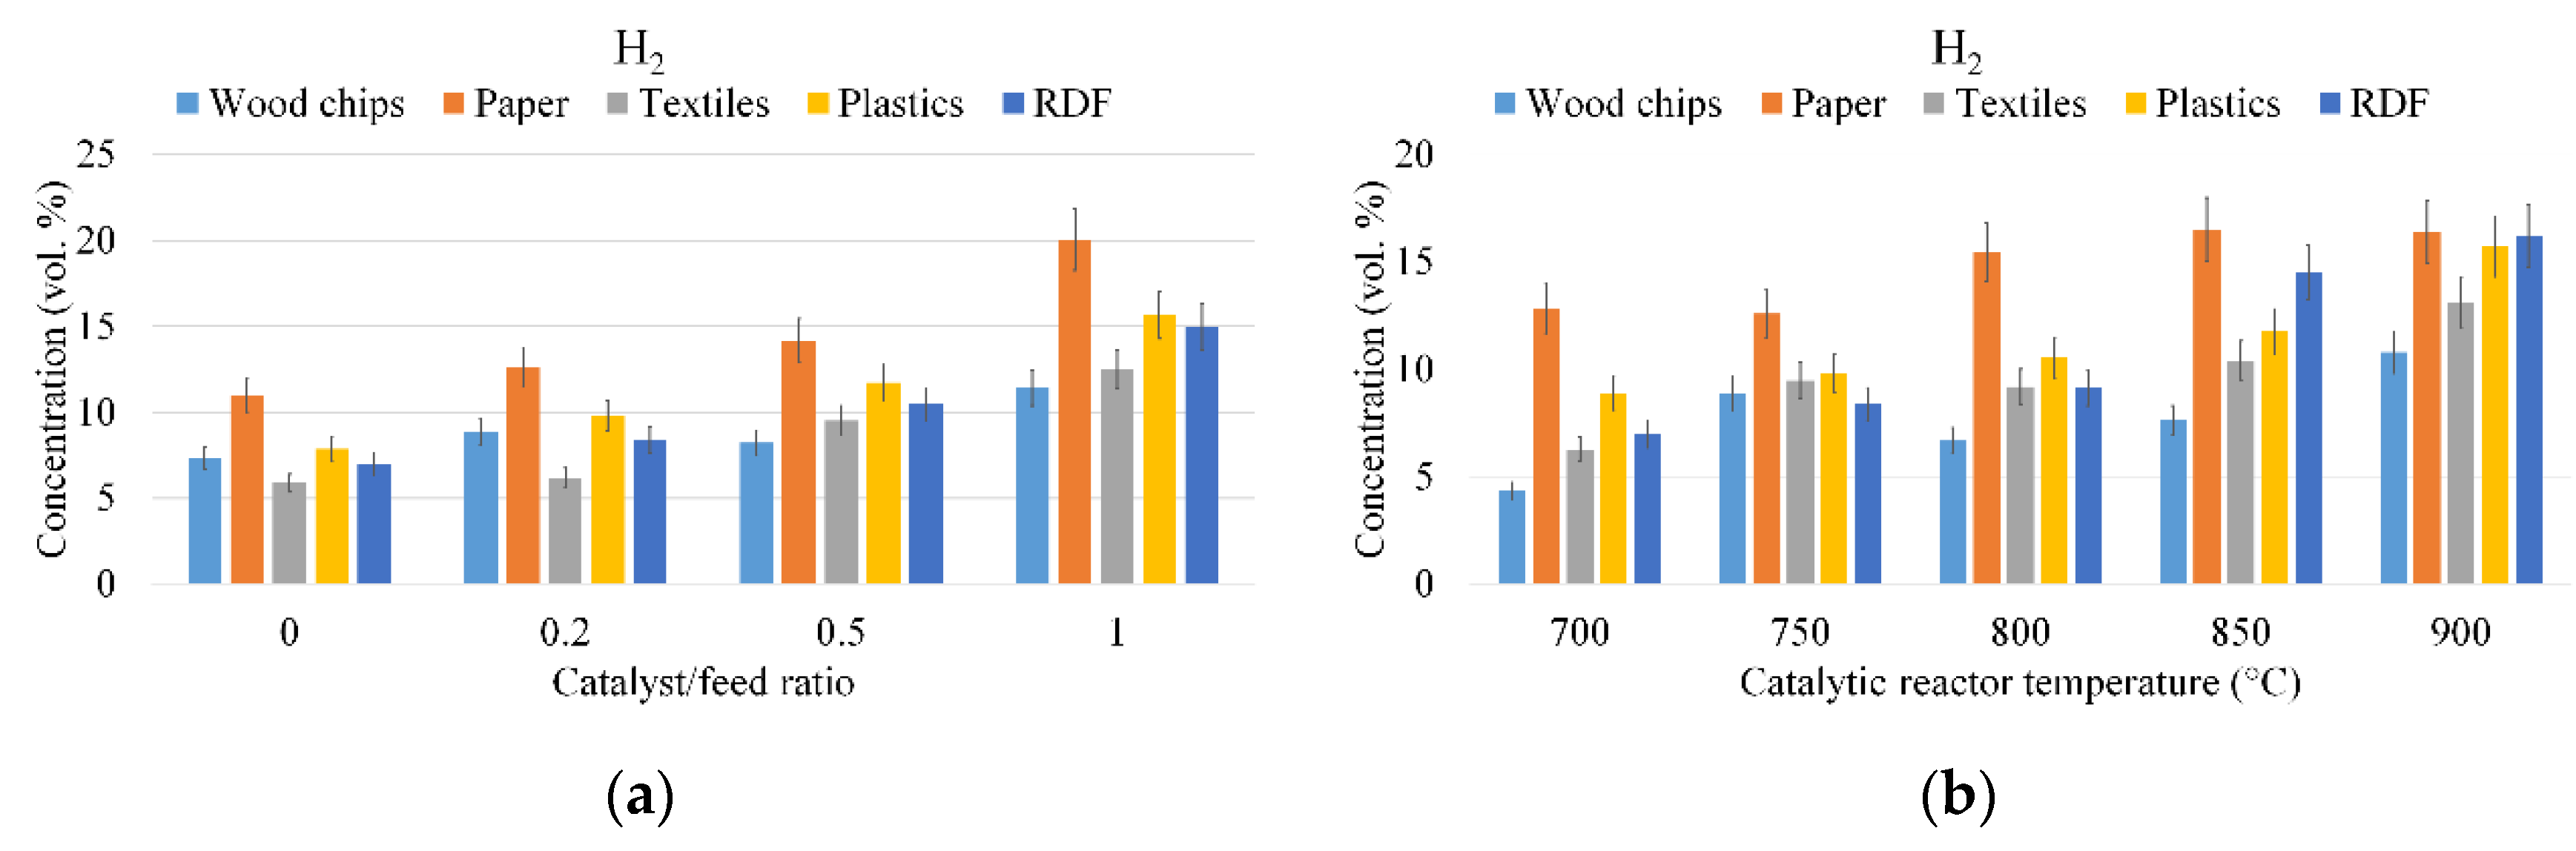
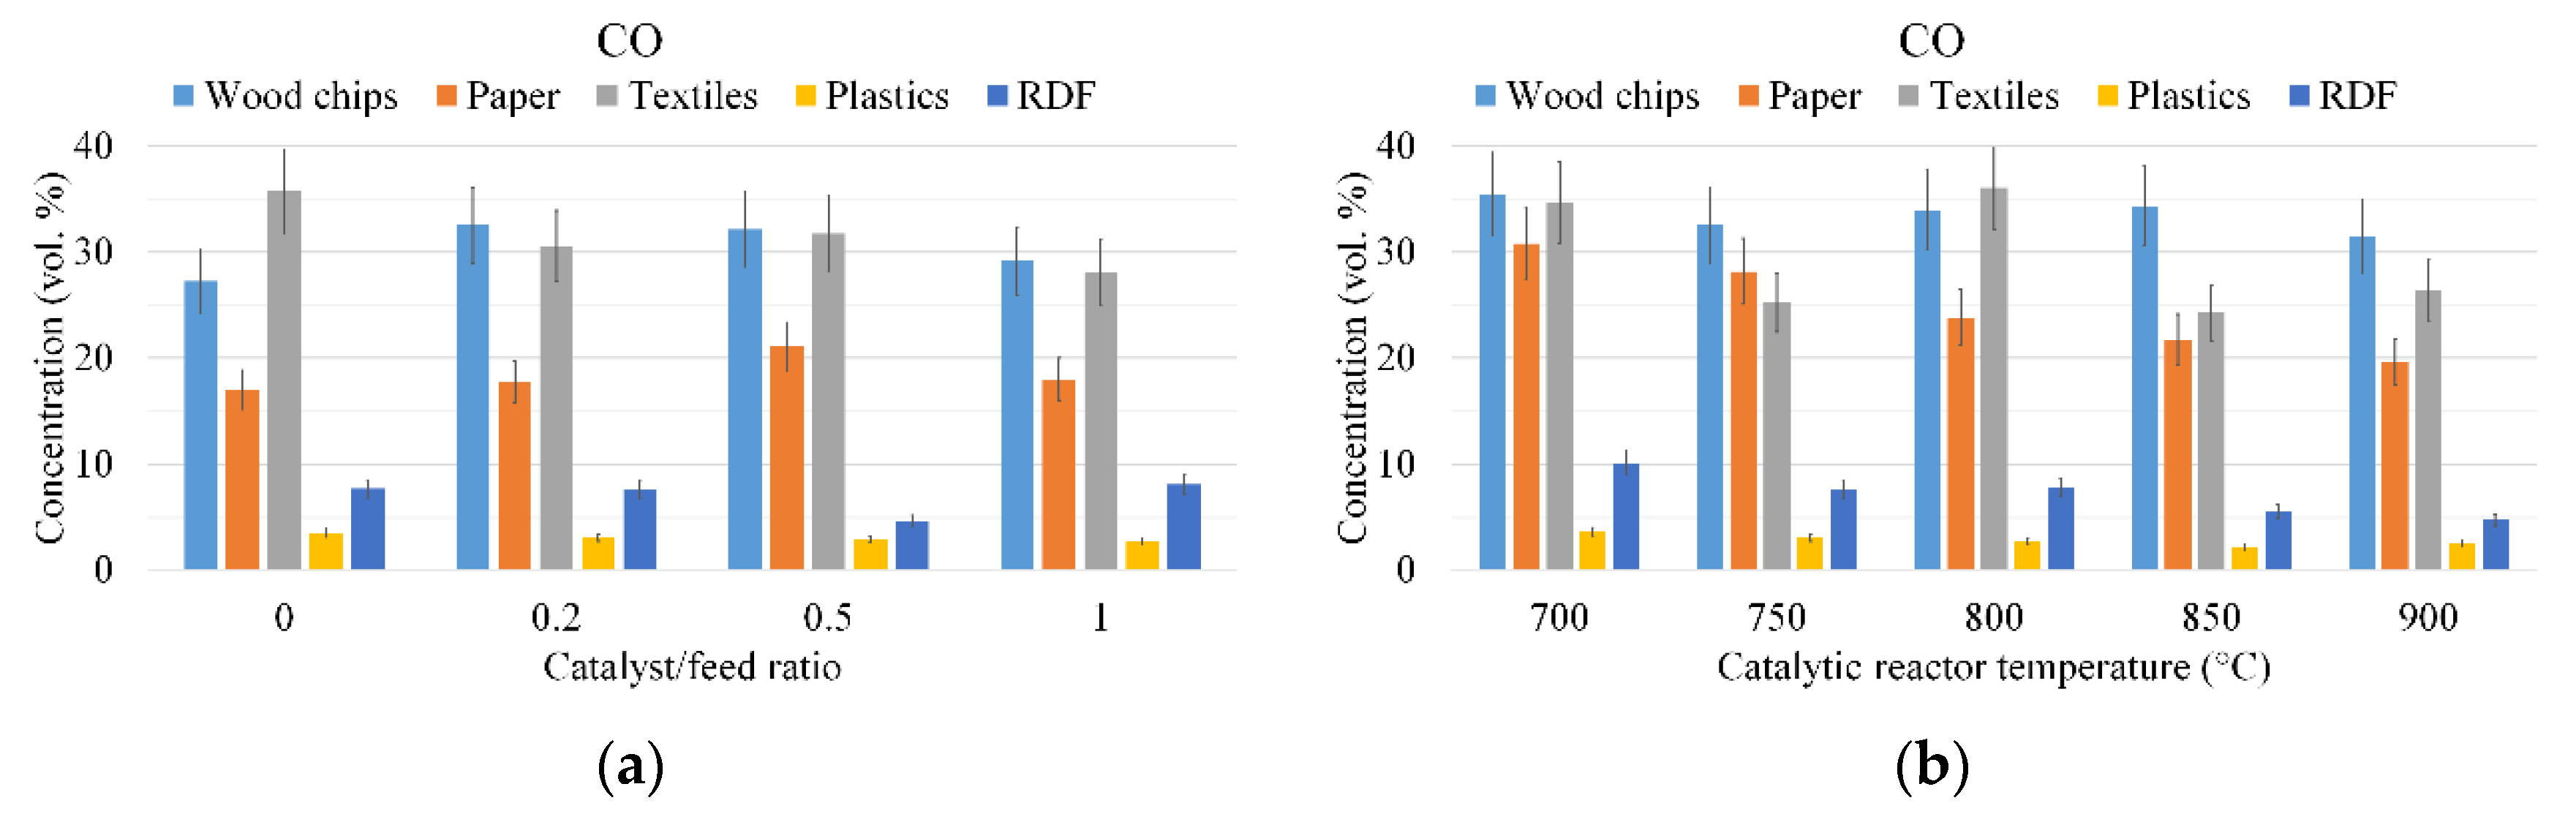
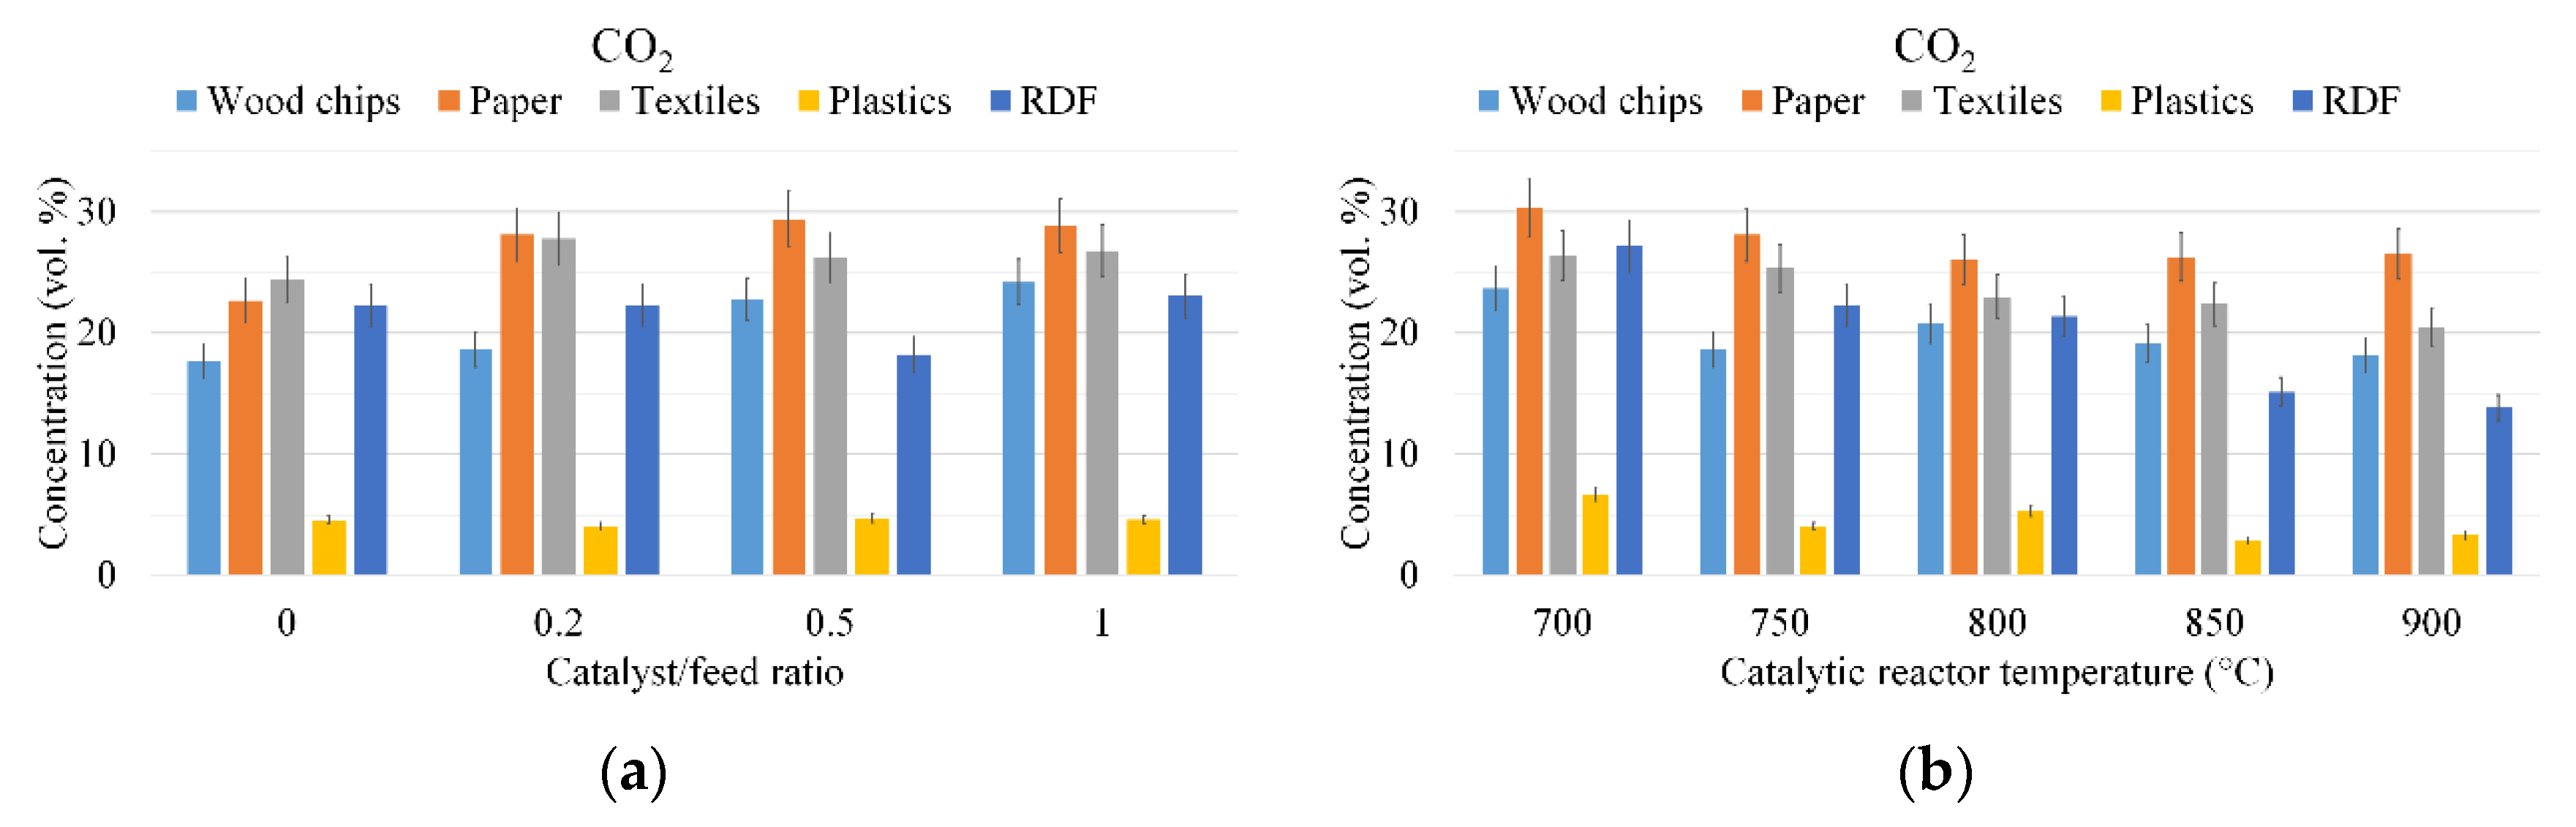
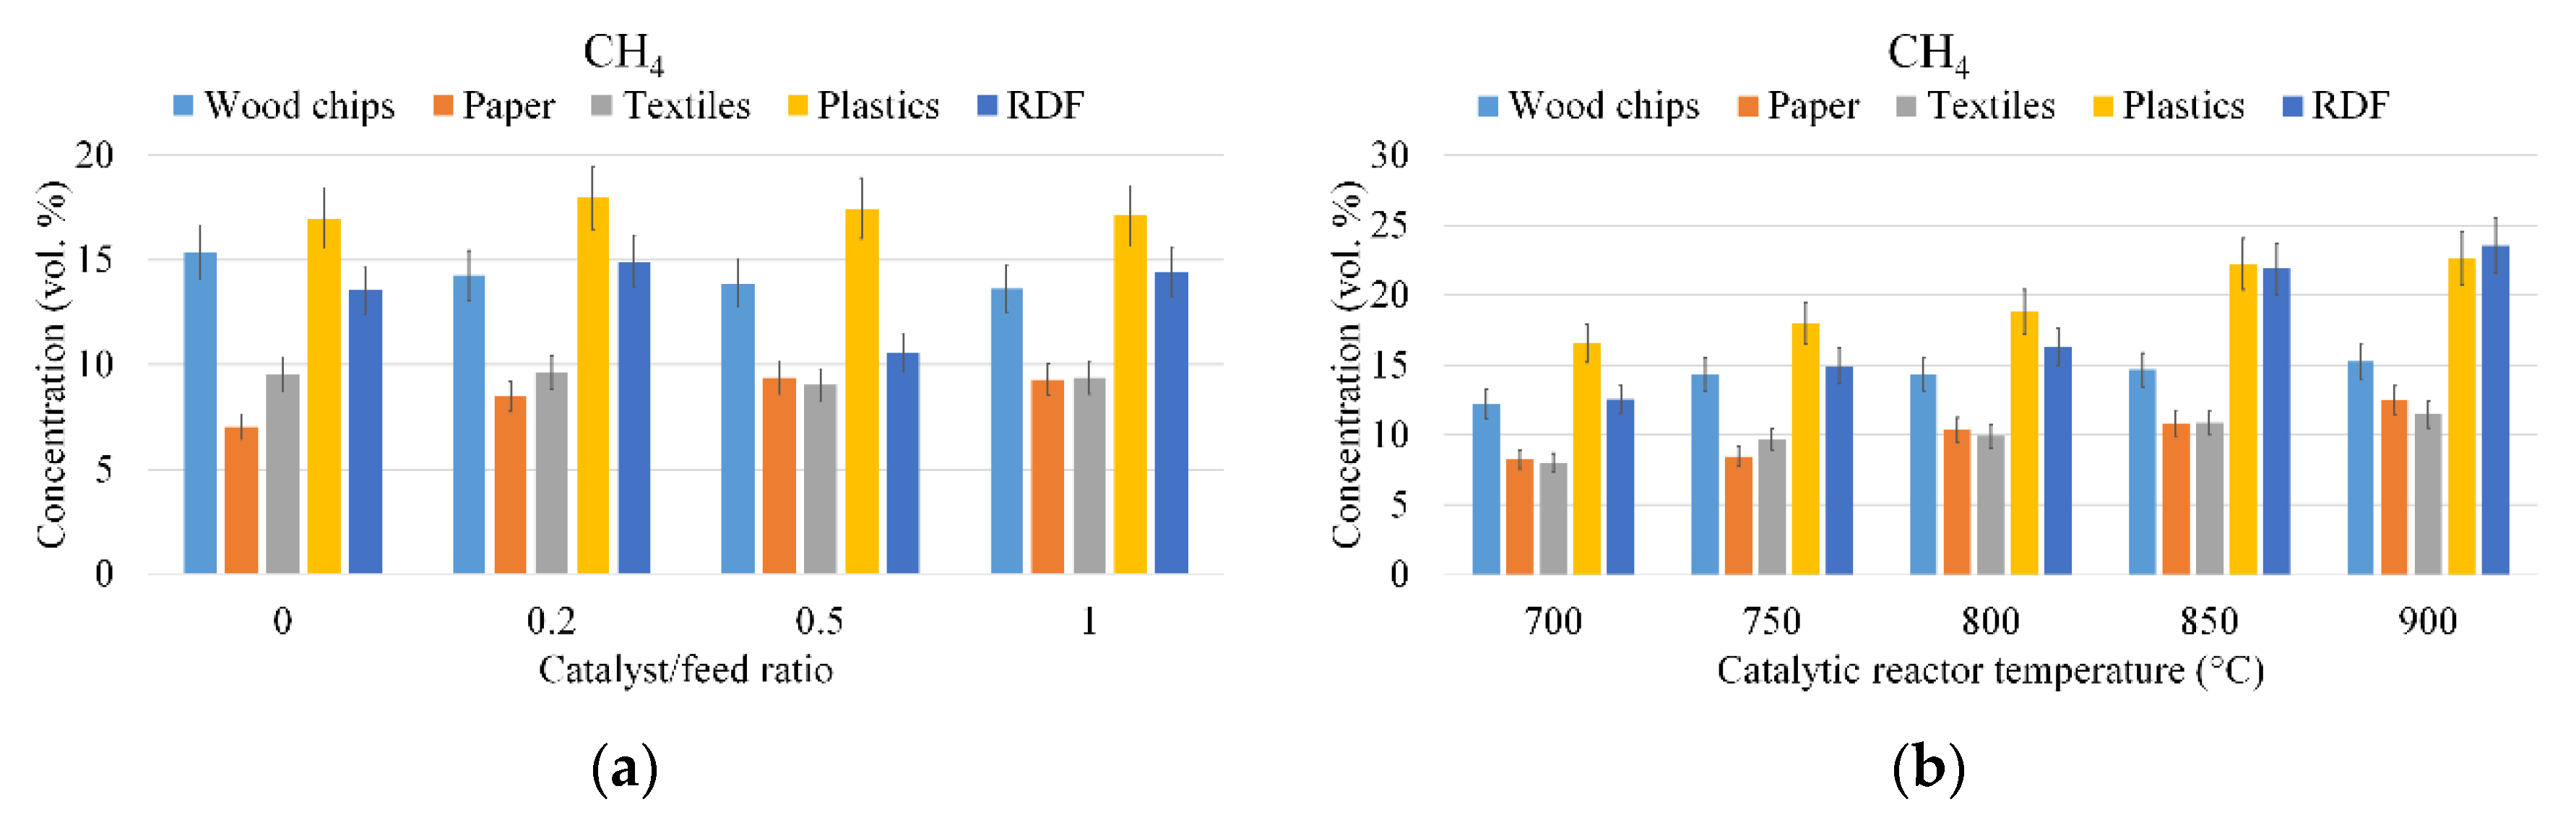
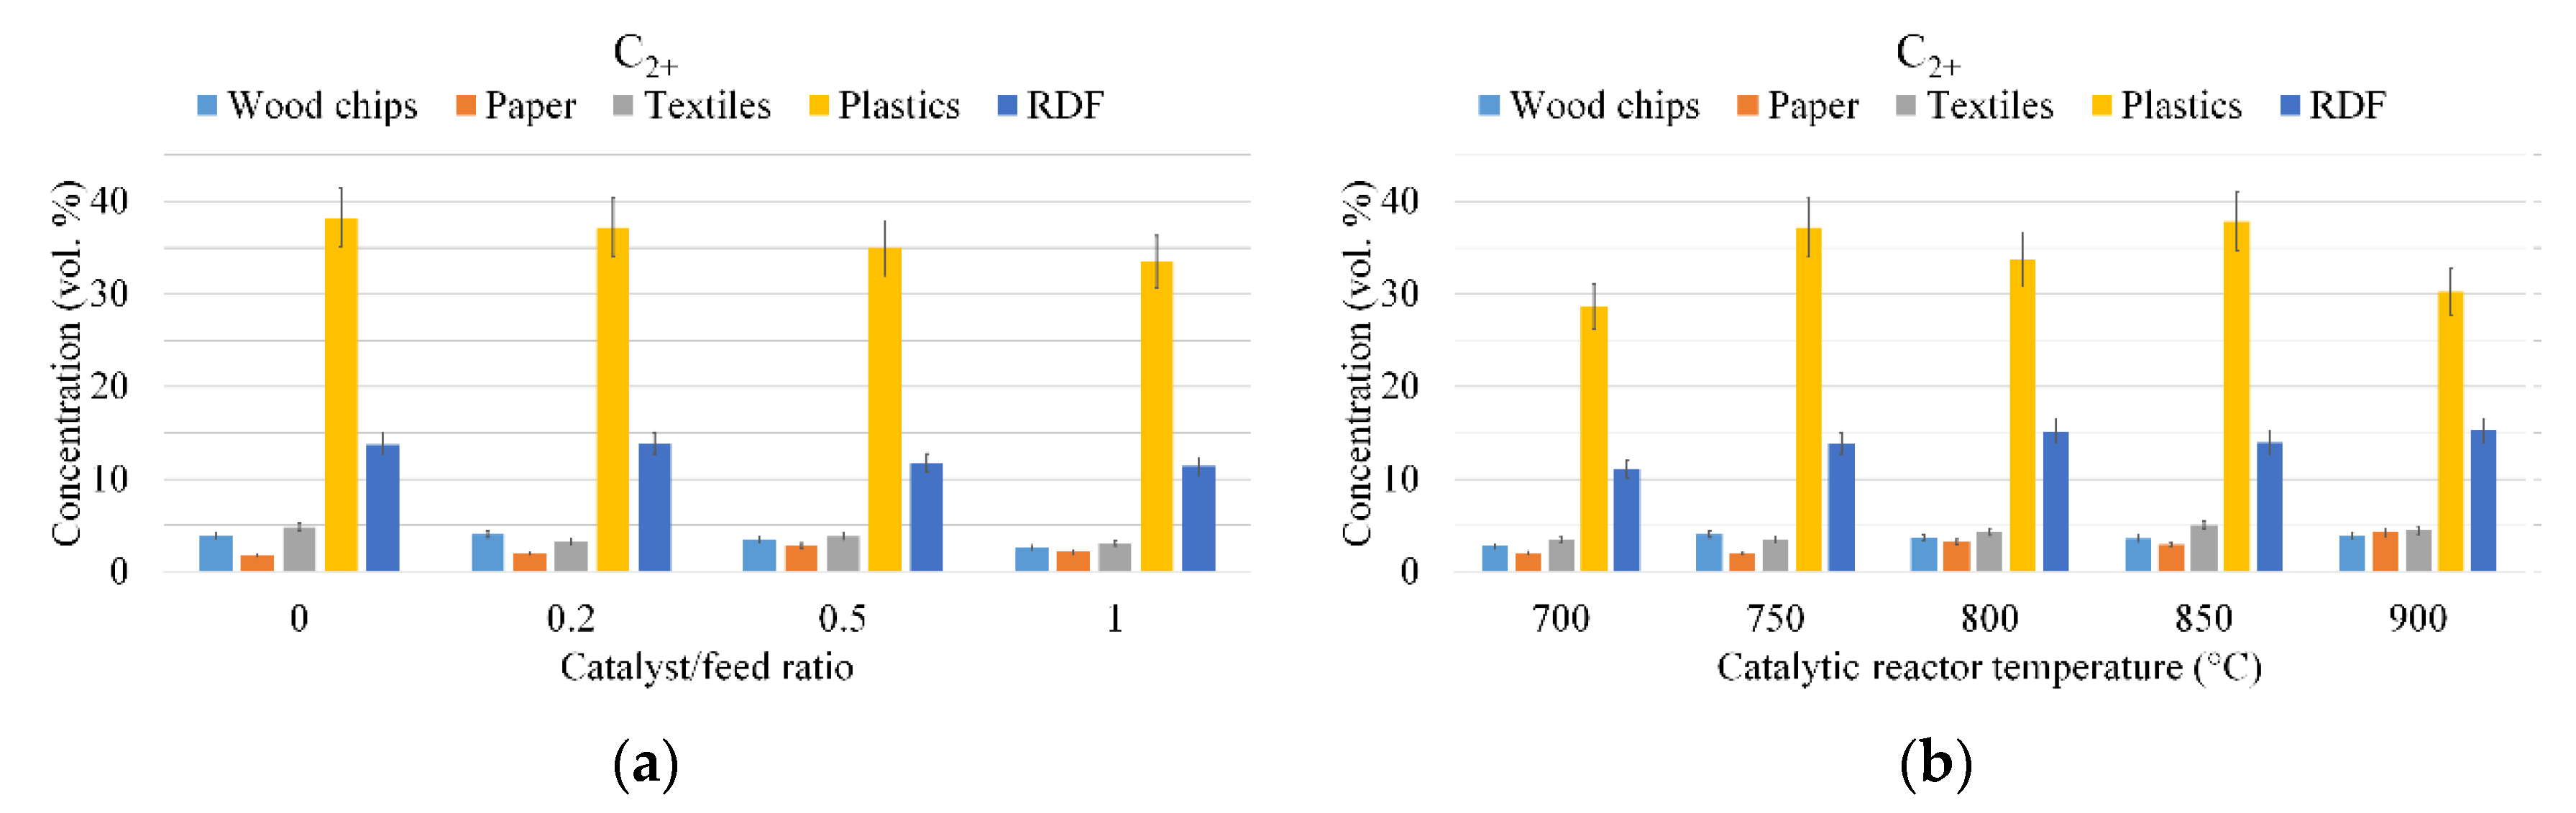
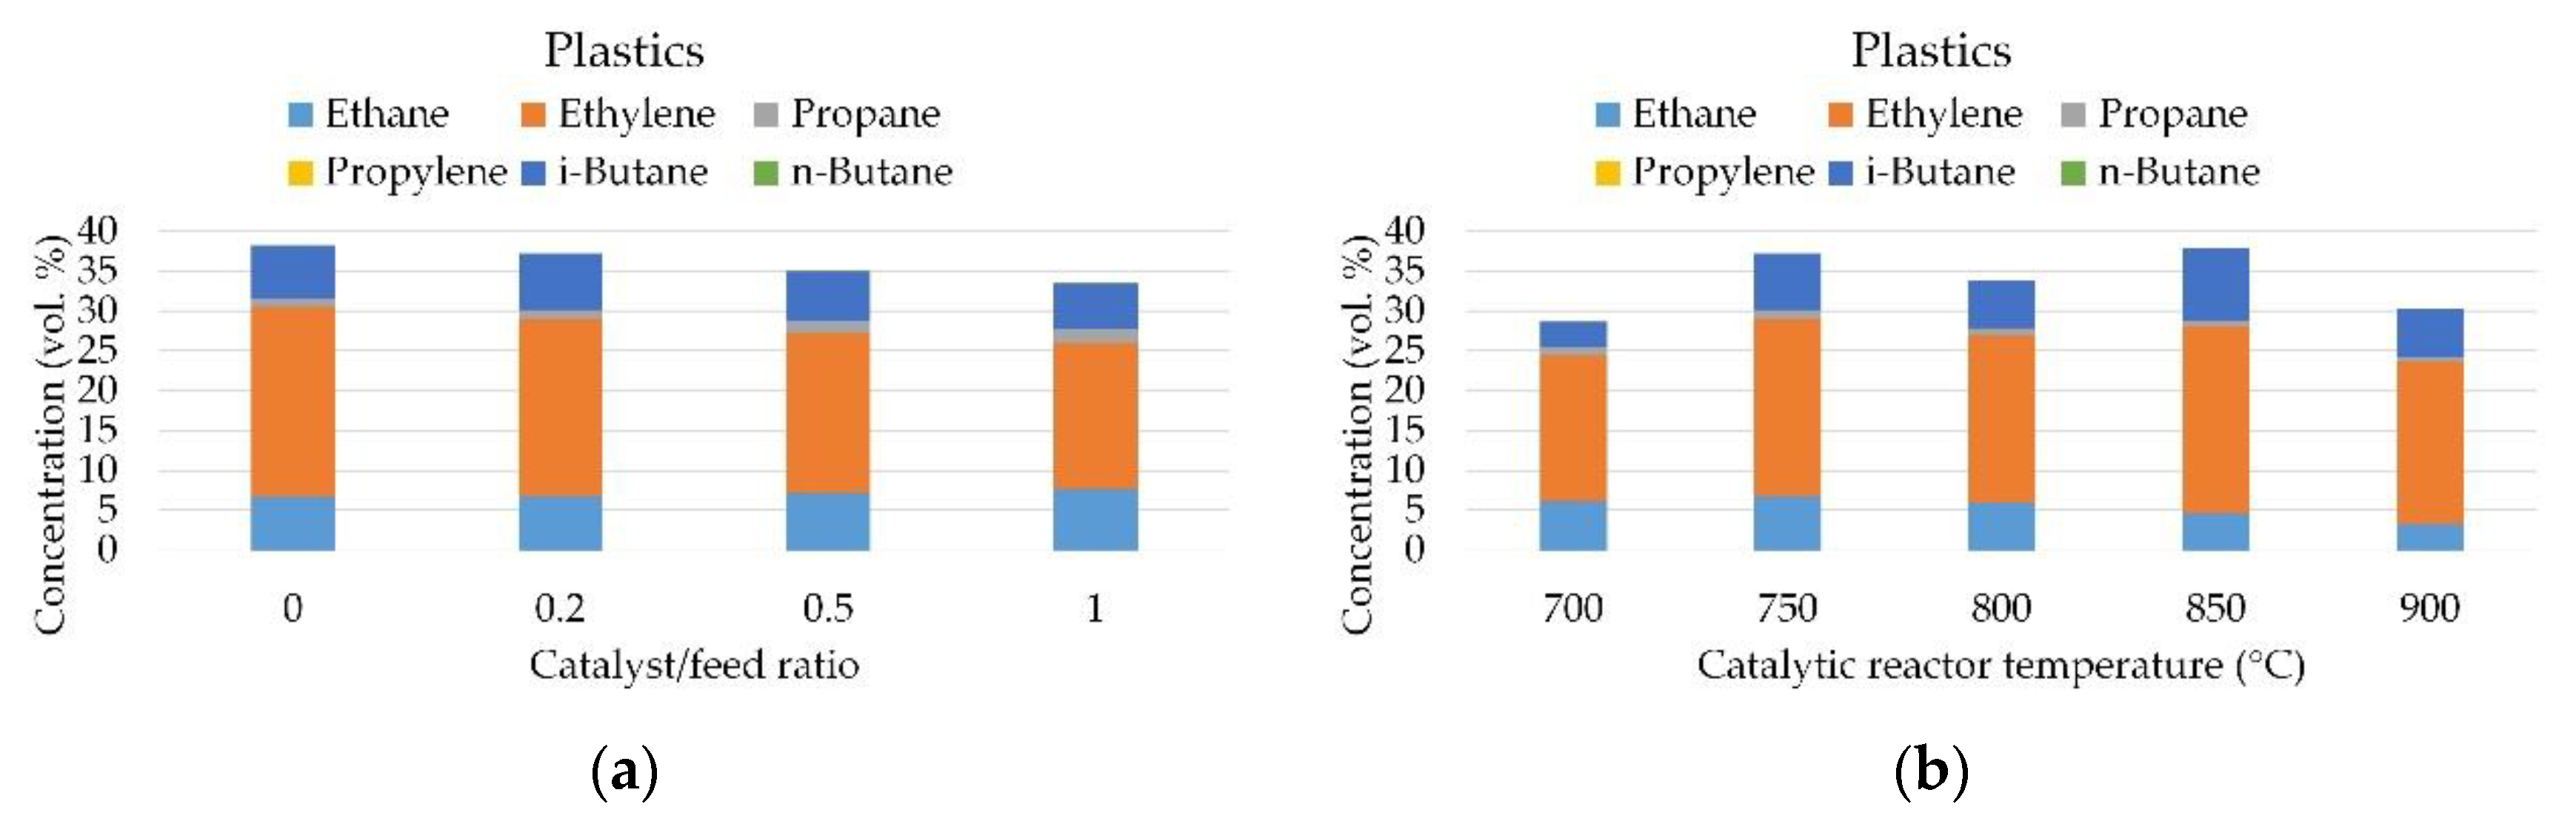
3.1. Gas Composition
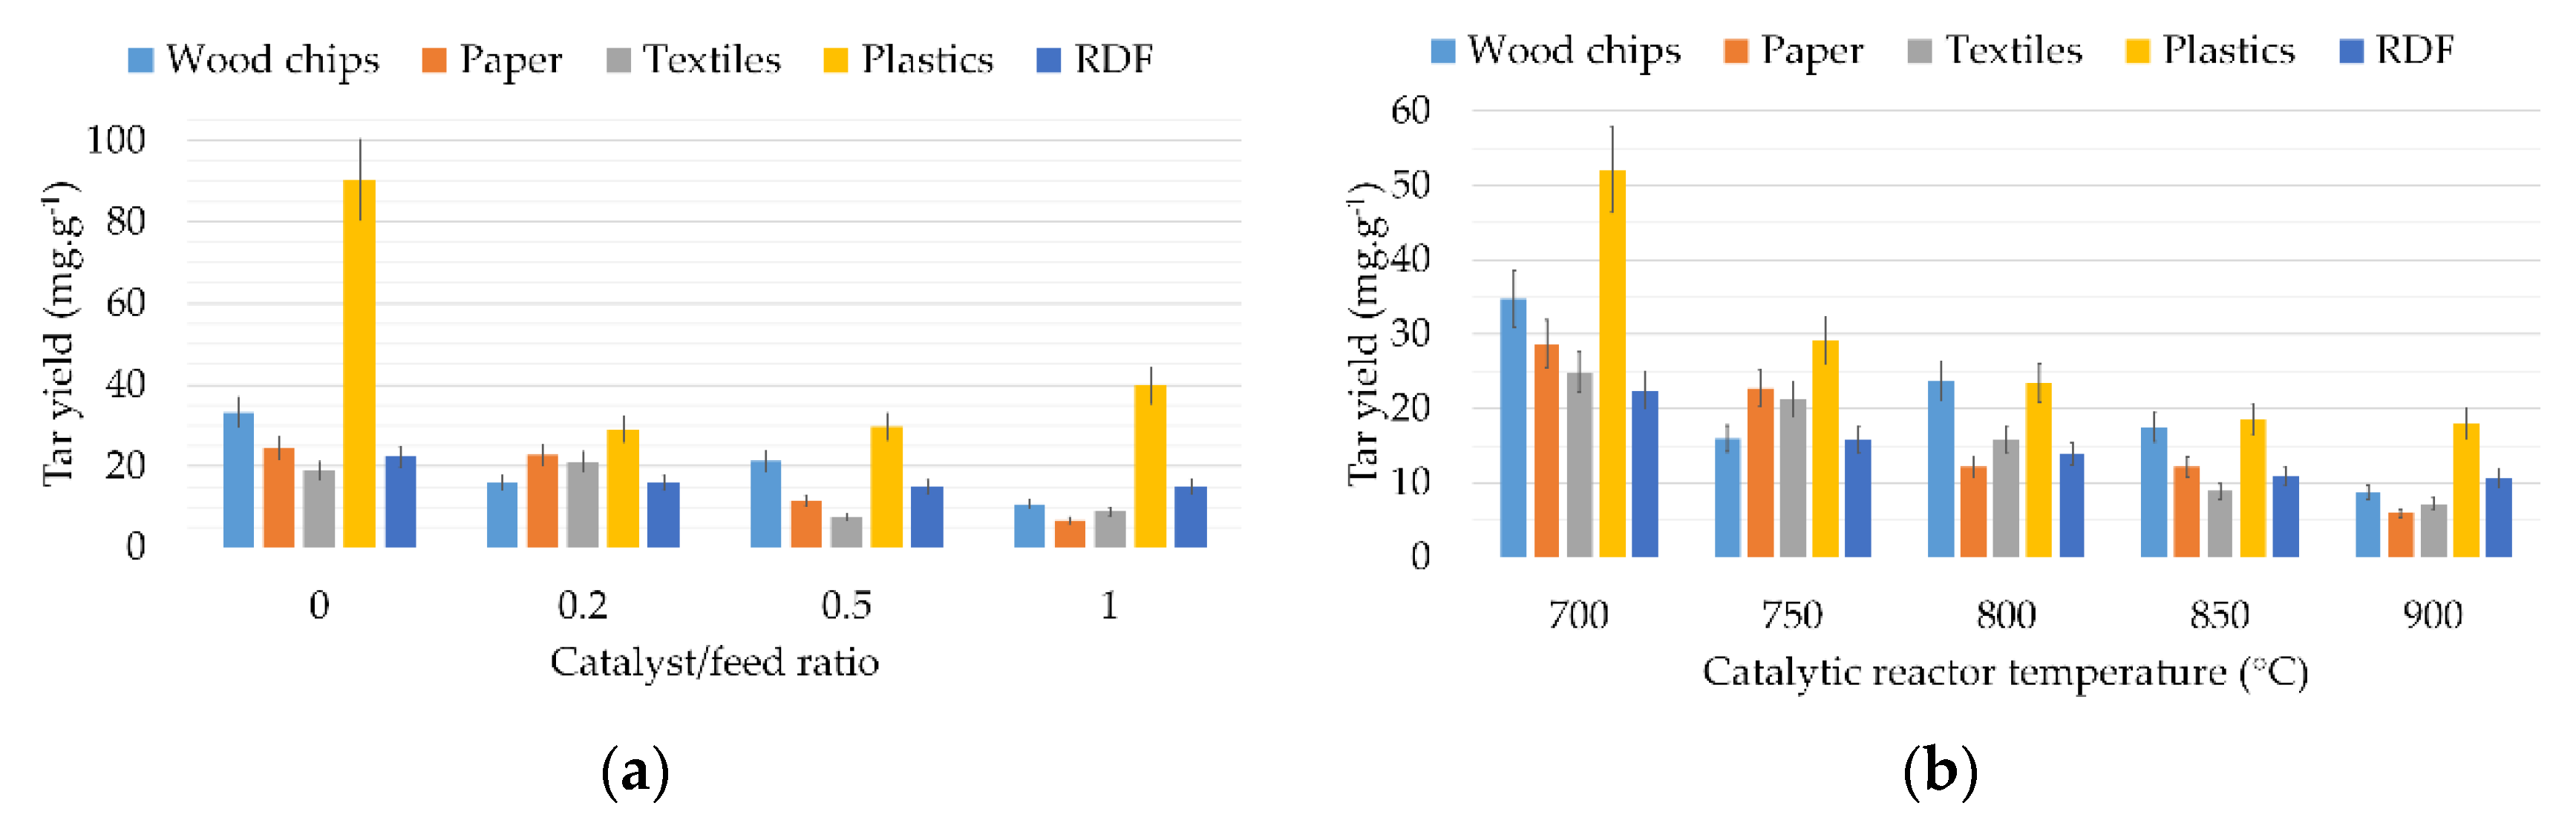
The results obtained from gas analysis are presented in Figure 2, Figure 3, Figure 4, Figure 5, Figure 6 and Figure 7, which compare the effect of catalyst/feed ratio and the temperature of the catalytic reactor on the concentration of selected products. The concentration of H2 indicated that the paper fraction has the highest tendency of hydrogen generation (up to 20.1 ± 1.8 vol.%; catalyst/feed ratio = 1) in the studied range of conditions (Figure 2). Inorganic species based on alkali metals present in paper could catalyze the secondary reactions of emitted volatiles, which could increase the hydrogen content [24]. However, an increased temperature reduced the difference between the H2 concentration of paper and other materials (Figure 2b). Concentrations of H2 have achieved similar values at 900 °C in the case of paper, plastics and RDF (16.4 ± 1.5, 15.7 ± 1.4 and 16.2 ± 1.4 vol.%, respectively), probably due to approaching the equilibrium H2 concentration for all material types.
Figure 3 depicts different CO concentrations due to different materials. Plastics and RDF show especially low concentrations of CO in comparison to the other materials. Different O2 contents in the materials are the reason for different CO contents in gas. There was a low CO content in gas from plastic gasification, as plastics contain a small amount of oxygen (Table 1) compared to other materials. However, the constant air flow rate in these experiments for all material types has to be considered. These results indicate that to achieve higher CO concentrations in plastics gasification, a higher air to feed mass ratio is required. In the case of plastics, the CO concentration was between 2.17 ± 0.24–3.63 ± 0.40 vol.%.
Table 5 shows that plastics provided the highest values of H2/CO ratios, above 2 and up to 6.32. This makes the synthesis gas suitable for chemical synthesis. Relatively high H2/CO values were also reported in [25], where the authors used steam as the gasification agent for plastics. However, the application of steam led to synthesis gas with a higher hydrogen content than in the case of air gasification. The RDF also achieved an H2/CO ratio above 2 in three cases, whereas it was below 2 for the other studied materials. According to the H2/CO ratio displayed in Table 5, it can be stated that elevated temperatures and increased catalyst to feed ratios led to increased H2/CO ratios.
Similar results were obtained for CO2 (Figure 4a). Plastics provided CO2 concentrations between 2.84 ± 0.22 and 6.69 ± 0.53 vol.%. In the case of RDF, the CO2 concentration was much higher compared to plastics and it noticeably decreased with increasing temperature (Figure 4b). A similarly low CO2 content at high temperatures was reported in [25], where the authors additionally concluded that CO2 originated from hydrocarbon steam reforming and water–gas shift reactions. In this study, a low CO2 and CO content is a result of insufficient hydrocarbon decomposition.
Figure 5a shows that a change in the catalyst/feed ratio did not affect the concentration of methane noticeably and only small variations were observed. On the other hand, the concentration of methane was significantly affected by the catalytic reactor temperature (Figure 5b) and it increased with increasing temperature for each studied material. RDF showed the highest methane concentration of 23.6 ± 2.0 vol.% at 900 °C. Higher methane concentrations were observed for plastics at lower temperatures than for RDF. Both materials, RDF and plastics, have a higher tendency of methane generation than the other studied materials. Aluri et al. [26] measured similar concentrations of methane during RDF pyrolysis using a thermogravimetric device. Lower concentrations of methane were reported in our previous work, where an Ni-doped clay catalyst was used [27]. These observations indicate that the content of methane can be significantly affected by the equivalence ratio and the catalyst type.
The concentrations of light hydrocarbons (ethane, ethylene, propane, propylene, i-butane and n-butane) showed a similar trend. Figure 6 shows that the highest production of light hydrocarbons came from plastics rather than the other studied materials. RDF has also a high tendency of light hydrocarbon production, but it is lower compared to plastics. Synthesis gas with a high hydrocarbon content, hence a high heating value, is suitable as fuel. The calculated net heating value of gas produced from plastics varied between 14.7 and 20.6 MJ/Nm3 (Table 5). According to Figure 6a, an increased catalyst/feed ratio led to a noticeable reduction in the concentration of light hydrocarbons. Figure 6b shows the influence of increased temperature on light hydrocarbon concentration. A comparison of these concentrations at 700 °C and 900 °C indicated that elevated temperatures led to increased concentrations of light hydrocarbons.
In case of plastics, the distribution of light hydrocarbon concentration is shown in Figure 7, where it can be seen that ethylene was the main component of light hydrocarbons. This synthesis gas is therefore a possible new source of ethylene, which is a valuable petrochemical feedstock. The highest ethylene concentration of 23.8 ± 2.0 vol.% was achieved without the catalyst. This value was even higher than the methane concentration (17.0 ± 1.4 vol.%) obtained in the same experiment. On the other hand, a methane concentration of 22.6 ± 1.9 vol.% was above the ethylene concentration of 20.4 ± 1.7 vol.% in the experiment carried out at 900 °C. RDF also showed a relatively high content of ethylene (13.4 ± 1.1 vol.%) at 900 °C at a catalyst to feed ratio of 0.2.

3.2. Tar Yields

The results of tar yields are presented in Figure 8, which shows that plastics produce higher amounts of tar in comparison to the other materials. When no catalyst was used, the highest value of tar yield of 90.4 ± 9.9 mg/g was achieved for plastics and the lowest tar yield value of 18.9 ± 2.1 mg/g was obtained for textiles. In the case of plastics, high tar production could be a result of low oxygen concentration and no char formation in the gasifying reactor. The results of fixed carbon in Table 2 indicate that the decomposition of plastics in gasification runs without char formation, which has a crucial impact on tar decomposition. An additional reason could be the absence of metals in plastic-based feedstock. Paper contains a noticeable amount of calcium, which promotes tar decomposition [28] reactions, whereas plastics contain only traces of metals from their production and transport. The introduction of a catalyst led to reduced tar yields (Figure 8a). However, an unexpected increase in the tar yield was observed when the catalyst/feed ratio was increased from 0.5 to 1.0 in the case of plastics. The same ratios were used for the other materials but increased tar yields were not observed. This phenomenon could be caused by the emission of tar from the catalyst, which is combustible and produces tar at temperatures above 800 °C. The formation of additional tar is supported by the low efficiency of its dry reforming caused by a low concentration of CO2. It is interesting to note that the gasification of RDF produced a small amount of tar in comparison to the other materials, although it contained a high amount of plastics. RDF is a mixture of plastics and lignocellulosic biomass and the results in Figure 8 indicate that the co-gasification of plastic- and lignocellulose-based materials can produce a gas with a lower tar content than the separate gasification of plastics and biomass, especially at temperatures below 800 °C. A similar synergic effect was reported by Burra and Gupta [18] when observing gas yields in the co-gasification of different plastics with biomass.
The tar removal efficiency of the catalyst differed for different materials and the highest tar yield decrease was observed for paper (72.5% at 1.0 catalyst/feed ratio). A temperature increase in the catalytic reactor led to the reduction of tar yields (Figure 8b). In these experiments, a catalyst/feed ratio of 0.2 was used. At 700 °C, RDF showed the lowest tar yield of 22.4 ± 2.5 mg/g in comparison with the other materials. However, an increased temperature had a different effect on the tar yield. At 900 °C, the lowest tar yield of 5.93 ± 0.65 mg/g was achieved in the case of paper gasification. The form of catalyst particles (pelleted or compacted) and catalyst bed temperature seemed to have a significant effect on the catalyst tar removal activity. In a previous work, tire pyrolysis char in the form of pellets with a similar specific surface area to the compacted char used in this work showed the higher tar removal efficiency in a preliminary test at 800 °C [13]. Additional experiments are therefore required to estimate the effect of catalyst particle size and other process conditions on the tar removal activity of tire pyrolysis char.

3.3. Effect of Theoretical Oxygen Demand

The calculated theoretical oxygen demand (TOD) displayed in Table 2 shows that plastics required the highest amount of oxygen for combustion in comparison to the other materials. Based on the assumption that all materials are decomposed at the same rate, it can be stated that plastics were gasified in very low-oxygen environment. In this environment, only a small amount of tar and hydrocarbons were decomposed by direct reactions with oxygen. It should also have led to low CO2 concentrations. Ultimately, an insufficient amount of CO2 for the dry reforming of hydrocarbons and tar was available [29]. On the contrary, the paper fraction, with the lowest TOD value, provided the lowest tar content and the highest hydrogen content. It should be noted that paper contains additives based on alkali metals that are considered as strong tar-cracking catalysts [29,30]. It is clear that a higher air flow has to be applied for plastics gasification. Assuming negligible differences in material properties, air flow can be adjusted according to TOD values to maintain a similar oxygen environment for different RDF compositions.

3.4. Process Mass Balance

During the process, the mass of solids removed from the reactor and liquid phase captured in isopropanol were recorded. Table 6 shows the mass yields of solid, liquid and gas products.
The mass flow of produced gas was not measured. It was only calculated to 100%. From these measurements, product losses in the system cannot be estimated. However, the apparatus was tested under different conditions to estimate product loss in the past [13]. At all conditions, the maximum mass loss was below 10%.

4. Conclusions

The gasification of RDF and its fractions (plastics, paper, textile and wood chips) was investigated in a two-stage batch gasification system with tire pyrolysis char as a catalyst. The obtained results showed that an increased temperature and catalyst/feed ratio led to an increased hydrogen content and reduced tar yield. It can be stated that the product gas composition was mostly influenced by tar decomposition with increased temperature in the catalytic reactor. Tar was decomposed primarily to H2 and hydrocarbons, which diluted CO and CO2 in the product gas. The highest hydrogen concentrations were achieved for the paper fraction (11.02 ± 0.98 to 20.1 ± 1.8 vol.%). An increased temperature decreased the differences between hydrogen concentrations originating from paper, plastics and RDF, and it also led to higher methane concentrations, while an increased catalyst/feed ratio did not affect the methane concentration noticeably. Plastics and RDF produced significantly higher concentrations of methane and other light hydrocarbons than the other studied materials, which makes RDF and plastics suitable feedstocks for high calorific value fuel gas production. Both studied materials provided high H2/CO ratios, which makes them interesting feedstocks for chemical synthesis and electric energy production. However, the high tar yield from plastics must be reduced. Gas obtained from plastics had a low CO2 concentration (2.84 ± 0.22–6.69 ± 0.53 vol.%) compared to other components (more than 13.8 ± 1.1 vol.%, RDF 900 °C, 0.2 catalyst to feed ratio), however, the CO2 content in the gas from RDF gasification did not correspond to its plastic content. Plastics also provided the highest tar yields due to a lower oxygen concentration environment in comparison to the gasification of other materials. On the contrary, the paper fraction was gasified in an environment with an oxygen amount closest to the TOD value (0.9439 ± 0.0059), which led to the highest hydrogen concentrations and lowest tar yields. The TOD value of plastics (3.079 ± 0.048) was more than threefold that. Increasing the oxygen content in air more than threefold should thus provide the same oxygen environment for plastics as for paper. The effect of catalytic bed temperature and the form of the prepared catalyst particles on their catalytic activity needs additional experimental investigation.

Author Contributions

Concept, P.Š. and J.H. (Juma Haydary); Formal analysis, J.H. (Jakub Husár); Funding acquisition, J.H. (Juma Haydary); Investigation, P.Š. and J.H. (Jakub Husár); Methodology, P.Š.; Project administration, J.H. (Juma Haydary); Supervision, J.H. (Juma Haydary); Writing—original draft, P.Š.; Writing—review and editing, J.H. (Jakub Husár) and J.H. (Juma Haydary). All authors have read and agreed to the published version of the manuscript.

Funding

This research was funded by the Slovak Research and Development Agency under contract No. APVV-15-0148 and OP Research and Development (ITMS 26240220084) of the European Regional Development Fund for financial support.

Conflicts of Interest

The authors declare no conflict of interest.

References

  1. Zhao, L.; Giannis, A.; Lam, W.Y.; Lin, S.X.; Yin, K.; Yuan, G.A.; Wang, J.Y. Characterization of Singapore RDF resources and analysis of their heating value. Sustain. Environ. Res. 2016, 26, 51–54. [Google Scholar] [CrossRef] [Green Version]
  2. Haydary, J. Gasification of Refuse-Derived Fuel (RDF). Geosci. Eng. 2016, 62, 37–44. [Google Scholar] [CrossRef]
  3. Zhou, H.; Meng, A.; Long, Y.; Li, Q.; Zhang, Y. An overview of characteristics of municipal solid waste fuel in China: Physical, chemical composition and heating value. Renew. Sustain. Energy Rev. 2014, 36, 107–122. [Google Scholar] [CrossRef]
  4. Sarc, R.; Lorber, K.E. Production, quality and quality assurance of Refuse Derived Fuels (RDFs). Waste Manag. 2013, 33, 1825–1834. [Google Scholar] [CrossRef]
  5. Lopez, G.; Artetxe, M.; Amutio, M.; Alvarez, J.; Bilbao, J.; Olazar, M. Recent advances in the gasification of waste plastics. A critical overview. Renew. Sustain. Energy Rev. 2018, 82, 576–596. [Google Scholar] [CrossRef]
  6. Heidenreich, S.; Foscolo, P.U. New concepts in biomass gasification. Prog. Energy Combust. Sci. 2015, 46, 72–95. [Google Scholar] [CrossRef]
  7. Devi, L.; Ptasinski, K.J.; Janssen, F.J.J.G. A review of the primary measures for tar elimination in biomass gasification processes. Biomass Bioenergy 2003, 24, 125–140. [Google Scholar] [CrossRef]
  8. Shen, Y.; Yoshikawa, K. Recent progresses in catalytic tar elimination during biomass gasification or pyrolysis—A review. Renew. Sustain. Energy Rev. 2013, 21, 371–392. [Google Scholar] [CrossRef]
  9. Choi, G.G.; Jung, S.H.; Oh, S.J.; Kim, J.S. Total utilization of waste tire rubber through pyrolysis to obtain oils and CO2 activation of pyrolysis char. Fuel Process. Technol. 2014, 123, 57–64. [Google Scholar] [CrossRef]
  10. Striūgas, N.; Zakarauskas, K.; Stravinskas, G.; Grigaitienė, V. Comparison of steam reforming and partial oxidation of biomass pyrolysis tars over activated carbon derived from waste tire. Catal. Today 2012, 196, 67–74. [Google Scholar] [CrossRef]
  11. Zhang, S.; Song, Y.; Song, Y.C.; Yi, Q.; Dong, L.; Li, T.T.; Zhang, L.; Feng, J.; Li, W.Y.; Li, C.Z. An advanced biomass gasification technology with integrated catalytic hot gas cleaning. Part III: Effects of inorganic species in char on the reforming of tars from wood and agricultural wastes. Fuel 2016, 183, 177–184. [Google Scholar] [CrossRef] [Green Version]
  12. Mui, E.L.K.; Ko, D.C.K.; McKay, G. Production of active carbons from waste tyres—A review. Carbon 2004, 42, 2789–2805. [Google Scholar] [CrossRef]
  13. Husár, J.; Haydary, J.; Šuhaj, P.; Steltenpohl, P. Potential of tire pyrolysis char as tar cracking catalyst in solid waste and biomass gasification. Chem. Pap. 2019, 73, 2091–2101. [Google Scholar] [CrossRef]
  14. Steltenpohl, P.; Husár, J.; Šuhaj, P.; Haydary, J. Performance of Catalysts of Different Nature in Model Tar Component Decomposition. Catalysts 2019, 9, 894. [Google Scholar] [CrossRef] [Green Version]
  15. Ouadi, M.; Brammer, J.G.; Kay, M.; Hornung, A. Fixed bed downdraft gasification of paper industry wastes. Appl. Energy 2013, 103, 692–699. [Google Scholar] [CrossRef] [Green Version]
  16. Inayat, M.; Sulaiman, S.A.; Kurnia, J.C.; Shahbaz, M. Effect of various blended fuels on syngas quality and performance in catalytic co-gasification: A review. Renew. Sustain. Energy Rev. 2019, 105, 252–267. [Google Scholar] [CrossRef]
  17. Salavati, S.; Zhang, C.; Zhang, S.; Liu, Q.; Gholizadeh, M.; Hu, X. Cross-interaction during Co-gasification of wood, weed, plastic, tire and carton. J. Environ. Manag. 2019, 250, 109467. [Google Scholar] [CrossRef]
  18. Burra, K.G.; Gupta, A.K. Synergistic effects in steam gasification of combined biomass and plastic waste mixtures. Appl. Energy 2018, 211, 230–236. [Google Scholar] [CrossRef]
  19. Déparrois, N.; Singh, P.; Burra, K.G.; Gupta, A.K. Syngas production from co-pyrolysis and co-gasification of polystyrene and paper with CO2. Appl. Energy 2019, 246, 1–10. [Google Scholar] [CrossRef] [Green Version]
  20. Materazzi, M.; Lettieri, P.; Mazzei, L.; Taylor, R.; Chapman, C. Thermodynamic modelling and evaluation of a two-stage thermal process for waste gasification. Fuel 2013, 108, 356–369. [Google Scholar] [CrossRef] [Green Version]
  21. Van de Kamp, W.L.; de Wild, P.J.; Knoef, H.A.M.; Neeft, J.P.A.; Kiel, J.H.A. Tar Measurement in Biomass Gasification, Standardisation, and Supporting R&D. Available online: https://www.semanticscholar.org/paper/Tar-measurement-in-biomass-gasification%2C-and-R%26D-Kamp-Wild/8b2ee8f68ba439120043a781e6bcbfbbd77d1485 (accessed on 20 May 2020).
  22. Haydary, J.; Jelemenský, Ľ. Design of Biomass Gasification and Combined Heat and Power Plant Based on Laboratory Experiments. In International Congress on Energy Efficiency and Energy Related Materials (ENEFM2013); Springer: Antalya, Turkey, 2014; pp. 171–178. [Google Scholar]
  23. Sansaniwal, S.; Pal, K.; Rosen, M.A.; Tyagi, S.K. Recent advances in the development of biomass gasification technology: A comprehensive review. Renew. Sustain. Energy Rev. 2017, 72, 363–384. [Google Scholar] [CrossRef]
  24. Ahmed, I.; Gupta, A.K. Evolution of syngas from cardboard gasification. Appl. Energy 2009, 86, 1732–1740. [Google Scholar] [CrossRef]
  25. Acomb, J.C.; Wu, C.; Williams, P.T. Control of steam input to the pyrolysis-gasification of waste plastics for improved production of hydrogen or carbon nanotubes. Appl Catal. B Environ. 2014, 147, 571–584. [Google Scholar] [CrossRef]
  26. Aluri, S.; Syed, A.; Flick, D.W.; Muzzy, J.D.; Sievers, C.; Agrawal, P.K. Pyrolysis and gasification studies of model refuse derived fuel (RDF) using thermogravimetric analysis. Fuel Process. Technol. 2018, 179, 154–166. [Google Scholar] [CrossRef]
  27. Šuhaj, P.; Haydary, J.; Husár, J.; Steltenpohl, P.; Šupa, I. Catalytic gasification of refuse-derived fuel in a two-stage laboratory scale pyrolysis/gasification unit with catalyst based on clay minerals. Waste Manag. 2019, 85, 1–10. [Google Scholar] [CrossRef]
  28. Hervy, M.; Berhanu, S.; Weiss-Hortala, E.; Chesnaud, A.; Gerente, C.; Vilot, C.; Pham Minh, D.; Thorel, A.; Le Coq, L.; Nzihou, A. Multi-scale characterization of chars mineral species for tar cracking. Fuel 2017, 189, 88–97. [Google Scholar] [CrossRef] [Green Version]
  29. Luo, S.; Zhou, Y.; Yi, C. Syngas production by catalytic steam gasification of municipal solid waste in fixed-bed reactor. Energy 2012, 44, 391–395. [Google Scholar] [CrossRef]
  30. Guan, Y.; Luo, S.; Liu, S.; Xiao, B.; Cai, L. Steam catalytic gasification of municipal solid waste for producing tar-free fuel gas. Int. J. Hydrog. Energy 2009, 34, 9341–9346. [Google Scholar] [CrossRef]
Figure 1. Experimental apparatus for gasification, 1—catalytic reactor, 2—gasifying reactor.
Sustainability 12 06647 g001
Figure 2. (a) Influence of catalyst to feed ratio on H2 concentration; (b) influence of temperature on H2 concentration.
Sustainability 12 06647 g002
Figure 3. (a) Influence of catalyst to feed ratio on CO concentration; (b) influence of temperature on CO concentration.
Sustainability 12 06647 g003
Figure 4. (a) Influence of catalyst to feed ratio on CO2 concentration; (b) influence of temperature on CO2 concentration.
Sustainability 12 06647 g004
Figure 5. (a) Influence of catalyst to feed ratio on methane concentration; (b) influence of temperature on methane concentration.
Sustainability 12 06647 g005
Figure 6. (a) Influence of catalyst to feed ratio on light hydrocarbon concentration; (b) influence of temperature on light hydrocarbon concentration.
Sustainability 12 06647 g006
Figure 7. (a) Influence of temperature on light hydrocarbon concentration; (b) influence of temperature on the distribution of light hydrocarbon concentration in plastics gasification.
Sustainability 12 06647 g007
Figure 8. (a) Influence of catalyst to feed ratio on tar yields; (b) influence of temperature on tar yields.
Sustainability 12 06647 g008
Table 1. Ultimate analysis of raw materials (as received).
MaterialN (wt.%)C (wt.%)H (wt.%)S (wt.%)O 1 (wt.%)
Paper0.250 ± 0.11035.08 ± 0.195.28 ± 0.040.00043.91 ± 0.20
Plastics0.533 ± 0.06178.40 ± 1.8012.56 ± 0.250.003 ± 0.0102.70 ± 2.00
Wood chips0.303 ± 0.03646.02 ± 0.216.38 ± 0.110.027 ± 0.08045.35 ± 0.20
Textiles0.597 ± 0.01045.48 ± 0.326.59 ± 0.170.083 ± 0.02743.23 ± 0.22
RDF1.970 ± 0.70050.60 ± 3.007.22 ± 0.820.310 ± 0.25017.80 ± 4.10
1 Oxygen was calculated according to 1.0—mass fraction of ash, N, C, H and S.
Table 2. Proximate analysis, higher heating value (HHV) and theoretical oxygen demand (TOD) of raw materials.
MaterialMoisture
(wt.%)
Volatiles
(wt.%)
Fixed Carbon
(wt.%)
Ash
(wt.%)
HHV
(MJ/kg)
TOD
(Mass Ratio)
Paper2.69 ± 0.6774.8 ± 2.87.40 ± 2.5015.50 ± 1.8010.2 ± 1.70.944 ± 0.006
Plastics0.34 ± 0.0993.7 ± 3.50.04 ± 0.025.90 ± 0.6742.4 ± 4.13.079 ± 0.048
Wood chips5.10 ± 1.3077.3 ± 2.915.60 ± 5.201.92 ± 0.2218.2 ± 0.41.353 ± 0.012
Textiles3.05 ± 0.7686.2 ± 3.26.70 ± 2.304.01 ± 0.4518.4 ± 0.41.349± 0.020
RDF2.00 ± 0.5069.1 ± 2.66.80 ± 2.3022.05 ± 2.5021.0 ± 1.61.780 ± 0.100
Table 3. Material composition of combustible fraction of RDF (refuse-derived fuel).
Name of the ComponentQuantity (%)
Plastics75
Wood5
Paper5
Cardboard2
Rubber3
Textile10
Table 4. Properties of carbonized pyrolysis char [14] and raw pyrolysis char [13].
CatalystSBET (m2/g)νp (cm3/g)Dp (nm)
Raw pyrolysis char28.300.27934.05
Compacted and carbonized pyrolysis char67.480.32417.44
Table 5. Calculated H2/CO ratios and net heating values of emitted gases.
Catalyst/Feed Ratio0251022222
Catalytic reactor temperature (°C)750750750750700750800850900
H2/CO
Wood chips0.2690.2730.2560.3900.1230.2730.1970.2220.343
Paper0.6480.7060.6731.1100.8270.7060.8670.8730.811
Textiles0.1650.2030.3000.4440.1810.3760.2550.4290.496
Plastics2.2403.2104.0205.6502.4503.2103.8205.4206.120
RDF0.9111.1102.2501.8500.6881.1101.1762.6303.440
Net heating value (MJ/Nm3)
Wood chips6.827.126.806.276.157.126.976.907.11
Paper3.854.405.235.004.204.405.405.526.34
Textiles6.315.575.815.575.615.506.406.346.32
Plastics18.9019.0018.117.714.7019.0017.7020.6017.50
RDF8.829.177.718.627.719.1710.0010.1010.90
Table 6. Mass balance of products.
Catalytic Reactor Temperature (°C)700750800850900
Gas (wt.%)
Wood chips85.6 ± 1.590.7 ± 0.888.5 ± 1.191.1 ± 0.993.0 ± 0.6
Paper75.9 ± 1.677.2 ± 1.581.8 ± 1.079.7 ± 1.281.5 ± 1.0
Textile89.3 ± 1.091.7 ± 0.590.7 ± 0.990.7 ± 0.993.2 ± 0.6
Plastics78.7 ± 2.084.0 ± 1.484.3 ± 1.485.3 ± 1.287.2 ± 1.0
RDF70.4 ± 2.070.8 ± 1.972.5 ± 1.772.8 ± 1.873.9 ± 1.5
Liquid (wt.%)
Wood chips12.4 ± 1.46.2 ± 0.78.6 ± 1.07.2 ± 0.84.6 ± 0.5
Paper7.2 ± 0.87.1 ± 0.82.3 ± 0.34.4 ± 0.52.5 ± 0.3
Textile7.9 ± 0.95.9 ± 0.76.9 ± 0.87.1 ± 0.84.6 ± 0.5
Plastics15.6 ± 1.710.0 ± 1.19.8 ± 1.18.5 ± 0.96.7 ± 0.7
RDF9.2 ± 1.08.4 ± 0.95.7 ± 0.65.2 ± 0.64.6 ± 0.5
Solid (wt.%)
Wood chips2.0 ± 0.13.1 ± 0.22.8 ± 0.21.7 ± 0.12.4 ± 0.2
Paper17.0 ± 0.815.7 ± 0.815.9 ± 0.815.9 ± 0.816.1 ± 0.8
Textile2.8 ± 0.22.3 ± 0.22.4 ± 0.22.2 ± 0.22.2 ± 0.2
Plastics5.7 ± 0.36.0 ± 0.35.9 ± 0.36.2 ± 0.36.1 ± 0.3
RDF20.4 ± 1.020.8 ± 1.021.8 ± 1.022.0 ± 1.221.5 ± 1.0
Catalyst/Feed ratio00.20.51
Gas (wt.%)
Wood chips84.3 ± 1.690.7 ± 0.891.1 ± 0.993.0 ± 0.6
Paper77.3 ± 1.477.2 ± 1.580.2 ± 1.278.8 ± 1.3
Textile92.7 ± 0.691.7 ± 0.893.7 ± 0.693.7 ± 0.6
Plastics74.3 ± 2.484.0 ± 1.483.5 ± 1.583.0 ± 1.9
RDF67.0 ± 2.066.8 ± 1.967 ± 2.066.2 ± 2.1
Liquid (wt.%)
Wood chips13.1 ± 1.46.2 ± 0.77.7 ± 0.94.7 ± 0.5
Paper4.8 ± 0.57.1 ± 0.84.5 ± 0.55.0 ± 0.6
Textile4.6 ± 0.55.9 ± 0.73.7 ± 0.43.7 ± 0.4
Plastics18.8 ± 2.110.0 ± 1.111.0 ± 1.211.2 ± 1.7
RDF6.7 ± 0.77.4 ± 0.97.3 ± 0.88.0 ± 0.9
Solid (wt.%)
Wood chips2.7 ± 0.23.1 ± 0.21.2 ± 0.12.4 ± 0.2
Paper17.9 ± 0.915.7 ± 0.815.4 ± 0.716.2 ± 0.8
Textile2.7 ± 0.22.3 ± 0.22.6 ± 0.22.6 ± 0.2
Plastics6.9 ± 0.46.0 ± 0.35.5 ± 0.35.9 ± 0.3
RDF26.3 ± 1.325.8 ± 1.025.8 ± 1.225.8 ± 1.2

